Article

Skin Lesion Segmentation Using Stochastic Region-Merging and Pixel-Based Markov Random Field

Computer Science Department, University of KwaZulu Natal, Durban 4000, South Africa
*
Author to whom correspondence should be addressed.
These authors contributed equally to this work.
Symmetry 2020, 12(8), 1224; https://doi.org/10.3390/sym12081224
Submission received: 23 May 2020 / Revised: 9 June 2020 / Accepted: 15 June 2020 / Published: 26 July 2020
(This article belongs to the Section Computer)

Abstract

:
Markov random field (MRF) theory has achieved great success in image segmentation. Researchers have developed various methods based on MRF theory to solve skin lesions segmentation problems such as pixel-based MRF model, stochastic region-merging approach, symmetric MRF model, etc. In this paper, the proposed method seeks to provide a complement to the advantages of the pixel-based MRF model and stochastic region-merging approach. This is in order to overcome shortcomings of the pixel-based MRF model, because of various challenges that affect the skin lesion segmentation results such as irregular and fuzzy border, noisy and artifacts presence, and low contrast between lesions. The strength of the proposed method lies in the aspect of combining the benefits of the pixel-based MRF model and the stochastic region-merging by decomposing the likelihood function into the multiplication of stochastic region-merging likelihood function and the pixel likelihood function. The proposed method was evaluated on bench marked available datasets, PH2 and ISIC. The proposed method achieves Dice coefficients of 89.65 % on PH2 and 88.34 % on ISIC datasets respectively.

1. Introduction

Melanoma skin lesion has been reported as the deadliest skin cancer with high mortality [1]. Early detection and treatment of this deadly disease could reduce the mortality rate [2]. The essential task in melanoma diagonsis is through segmentation of that affected areas which aids in the identification and recognition of disease patterns. In recent decades, due to advancements in technology, several computer-aided techniques have evolved for analysis and segmentation of the medical images. Automatic medical image analysis methods are considered quite successful in medical image analysis over the past two decades [3]. Automated analysis of skin lesions has assisted clinicians in making quick and accurate decisions in melanoma detection. This paper deals with skin lesion segmentation issues for the needs of automated analysis of skin lesions.
Skin lesion segmentation is a crucial stage as it shows various clinical identification features, locally and globally. The purpose of lesion segmentation using dermoscopy images is to segment the targeted region (unhealthy lesion) from the background image (healthy skin). The segmented lesion boundary provides vital information to assist in the automated analysis of skin lesions. The accurate diagnosis needs the correct lesion classification from the targeted feature extraction through efficient lesion segmentation methods. Consequently, the final diagnostic results of skin lesion disease depends largely on the performance of the lesion segmentation stage. Various image segmentation algorithms have been proposed to segment lesion types using features descriptors and pattern analysis. Valuable work has been presented by Celebi et al. [4], which classifies the algorithms of image segmentation techniques. In [5,6,7], the feature-based model such as threshold methods which use threshold values to differentiate the skin lesions from the surrounding healthy tissues. In [8,9,10], the clustering methods that utilize color space features to determine cluster regions. In [11], the model-based models such as a unified Markov random field (UMRF) that focus on random field analysis models. In [12,13,14], the edge-based model such as watershed which has an excellent performance in some particular local result. In [15,16,17], the active contour methods which adopt evolution algorithms to segment skin lesions. In [18,19,20,21], the supervised segmentation methods for skin lesions segmentation such as support vector machine (SVM) and artificial neural networks (ANN) that can train and learn image patterns from large image dataset.
However, the segmentation of skin lesions remains challenging and most of the existing techniques have not been able to give accurate and reliable results [22,23,24]. These challenges are due to unique features and the peculiarity in the fine-grained appearances of the skin lesion images. The skin lesion images are sometimes characterized by noise such as: hairs, oils, marks, skin lines, blood vessels, variegated coloring, weak edges, fuzzy and irregular borders. There is also a low contrast between the appearance of the health lesion and the affected lesion [25]. To address these limitations, this research proposes an efficient hybrid model based on the Markov random field (MRF) theory with a reduced cost for the robust segmentation of the skin lesions.
In recent years, the deep learning methods have achieved the best enhanced performances in medical imaging tasks [26]. Their performance is leveraged in their capacity to learn and extract deep and hierarchical features from the complex image dataset [26]. Recently, the deep learning methods such as deep convolutional models have achieved great success for the medical image segmentation [27]. Deep convolutional neural networks (CNNs) possess the capacity to process general and highly variable tasks in fine-grained objects [28]. They can also learn hierarchical features that correspond to the appearance and semantics of images in the large labeled dataset. The performance of deep learning methods is however restricted to the scarcity of annotated medical training data. The segmentation output of these techniques is coarse with poor boundary [29] which results due to insufficient training data set. CNNs apply heavy tuning of a large number of parameters and pre-processing techniques to minimize the effect of the limitations. This increases the computational resources consumption [29].
The MRF model is a probabilistic graphical technique which extracts the image segmentation features as the prior information. The MRF model has been used for decreasing the effect of intra-class variation and removing the noise [19]. Initially, the first version of this model used to predict the segmented-image based on its pixels. The pixel-based MRF model representation depicted in Figure 1. Where a circle and a square indicates the class label of one pixel X s and the observed feature Y s of its pixel, respectively, the pixel-based MRF model could easily use the structural contextual information on the grid because the neighboring structural connection between the pixels is regular. However, the pixel-based MRF model process requires more time, and its small neighborhood also affects the accuracy of the image segmentation. Thus, many types of research have worked to modify the MRF model by using the region-based MRF model instead of the pixel-based MRF model to model more macro information and complex spatial patterns in a large neighborhood.
Chen et al. [11] stated that all the shortcomings of the pixel-based MRF model cannot be overcome by using the region-based MRF model alone. This is because of the image segmentation challenges that still impact its output, for instance, the irregular structural contextual neighborhood of initial regions and the region inaccuracy. However, the region-based MRF model can use the region-based information to cover the macro texture pattern, but the irregular structural context are its limitations. Therefore, if we can build one model which possesses the regular structural context and the account of the macro texture pattern in its account at one time, this model can take the benefits of the two MRF models and solve each model pitfalls. Some of the pitfalls include: the pixel-based MRF model which can use the macro texture pattern description to have interactions in a large neighborhood, the stochastic region-merging approach [30] use the regular structural context in order to capture the structural relationship between regions more efficiently. For the aforementioned reasons this work combines the benefits of the pixel-based MRF model and the stochastic region-merging approach in one model.

2. Materials and Methods

The proposed method is a probabilistic technique that automatically predicts the skin lesion from a given image based on the MRF theory. The proposed method combines the advantages of two models into its version: the pixel-based MRF model and the stochastic region-merging approach. Both of these models have their advantages and disadvantages. The proposed method aims to overcome the shortcomings by complement each other in one model. It seeks to decompose the likelihood function in Equation (2) into the multiplication of the stochastic region-merging likelihood function and the pixel likelihood function.

2.1. Problem Formulation + MRF Model

Let us assume S = { s i | i = 1 , 2 , , n × m } denotes the original images where s i indicates the image pixel and n × m represents the dimensions of the image. The label random field is represented on S as X = { X s | s S } . Every random variables X s in X defines the pixel class s, the set of class is Λ = { 1 , 2 , , N } where N represents the classes number. The observed image Y on S is defined by Y = { y s | s S } . Let x = { x s | s S } be the region label field instantiation. The aim of the MRF theory is to obtain the optimal solution of x given the observed image Y; formulated by the following maximum a posteriori (MAP) estimation problem:
x ^ = arg max x P ( x | Y ) ,
According to the Bayesian rule, the posterior probability P ( x | Y ) is equivalent to [ P ( Y | X ) P ( X ) ) / P ( Y ) ] . Since the probability P ( Y ) is a constant, the estimation of the best realization x ^ can be obtained by maximizing P ( Y | X ) P ( X ) , which requires to calculate the forms of P ( X ) and P ( Y | X ) . Equation (1) become equivalent to
x ^ = arg max x P ( Y | X ) P ( X ) ,
where P ( Y | X = x ) is the conditional probability function and P ( X ) is the Gibbs distribution function. In case of skin lesion segmentation, the estimation to the problem defined on Equation (2) is not an easy task due to complex challenges to the segmentation of skin lesion in a given image, such as noise and artifacts, various regions of the lesion, spatial variations, color variations and illumination, and weak boundary isolation linking surrounding skin regions and unhealthy skin regions. The proposed model attempts to estimate the problem defined in (2) by decomposing the conditional probability function into the multiplication of pixel likelihood function and the stochastic region merging likelihood function. The estimations of P ( X ) and P ( Y | X = x ) are discussed below.

2.2. Initialization–Probability of the Label Random Field

The joint probability P ( X ) is used to model the label random field X. Since X is assumed to possess the Markov property in the MRF model, P ( X ) is of Gibbs distribution according to the theorem of the Hammersley–Clifford theory [31]. That is
P ( X = x ) = 1 Z exp U ( x ) ,
where Z represents the normalization factor which is given by
Z = x U ( x ) .
Here U ( x ) is the energy function defined as follows
U ( x ) = s S U ( x s , x N s ) ,
where
U ( x s , x N s ) = t N s V ( x s , x t ) .
Here N s reflects the neighbours set of pixel s and each V ( x s , x t ) denotes the potential function linking pixel s with its neighbours t , t N s . According to the multilevel logistic (MLL) model [31], the V ( x s , x t ) has the following form
V ( x s , x t ) = β if x s = x t β if x s x t .
Here β > 0 being the parameter of the potential energy and t N s . Based on the MLL model, P ( X ) would have a large value if the local neighbor labels are the same, otherwise small. This characteristic encourages the adjacent pixels to be classified into the same label, which would make the MRF model resist noise and reduce the impact of intra-class variations.
The proposed method aims to incorporate the advantages of the pixel-based MRF model and stochastic region merging approach in order then put the regular spatial context and the macro texture pattern description in its account. Chen et al. [11] proved that the observed image Y can be divided into the pixel feature Y P = { Y s P | s S } and the regional feature Y R = { Y s R | s S } , to incorporate more priority for the segmentation results. Therefore, the conditional probability function divided into two parts as mentioned in [11]: the pixel likelihood function and the regional likelihood function, which can be expressed into ( Y P , Y R ) . The pixel-MRF model and the stochastic region-merging approaches are used to extract the pixel features and the region features respectively. This gives a formulation as per Equation (2) to find a solution to the MAP estimation problem which leads to the desire skin lesion segmentation.
x ^ = arg max x P ( X ) · P ( Y P , Y R | X ) ,
x ^ = arg max x P ( X ) · P ( Y P | X ) · P ( Y R | X ) .
On solving (9) will lead to the skin lesion segmentation by using the proposed model. The distribution of P ( Y P | X ) and P ( Y R | X ) will be describe in Section 2.3 and Section 2.4 below.

2.3. Pixel Feature Extraction

The micro texture pattern and the more pixel feature as spectral value are modeled by using the conditional probability function P ( Y P | X = x ) . For measuring the probability of how the observed image Y matches a given realization X = x . The site of the conditional probability function is defined to be independent when the label field is obtained, i.e.,
P ( Y P | X ) = s S P ( Y s P | X s = h ) .
The Gaussian distribution is used to determine the conditional probability function P ( Y s P | X s = h ) . In Equation (10) each site s = ( i , j ) S represents a pixel and its feature Y s is the spectral values vector of each band at site s, i.e., Y s = ( Y s 1 , Y s 2 , , Y s D ) . Here, Y s i defines spectral value band i, where D is the spectral bands number for the observed image. P ( y s | x s = h ) uses the Gaussian distribution in order to model (10), i.e.,
P ( Y s P | X s = h ) = γ ( 2 π ) D / 2 det ( Σ h P ) exp ( Y s P μ h P ) T · ( Y s P μ h P ) 2 ( Σ h P ) ,
where Y s P is the pixel feature for each pixel s, the Gaussian distribution parameters are μ h P , Σ h P . The D is the dimension of Y s P .

2.4. Regional Feature Extraction

On the region-based MRF model, a stochastic region merging (SRM) method [30] is employed to solve the problem in (2). The SRM uses a region adjacent graph [31] to represent each vertex as a region R, and each vertex is connected to its adjacent graph vertices using the edges E. The SRM aims to merge the region R a with an adjacent region R b by using merging probability formula. The merging probability α ( R a , R b ) is introduced in SRM likelihood function which accounts P ( Y R | X ) in (9), i.e.,
α ( R a , R b ) = exp ( E [ R a ] E [ R b ] ) 2 Λ ( R a , R b ) .
Here E [ · ] denote the expected element value in the region where the penalty function of statistical region merging formulated as follows
Λ ( R a , R b ) = D f 2 2 Q ln Φ ( f ) 2 ) Φ ( R a ) + ln Φ ( f ) 2 ) Φ ( R b ) .
Here Φ ( · ) denotes the elements number contained in the set defined as the argument (e.g., Φ ( f ) is pixels number in a given image f), D f indicates the dynamic range of f (e.g., 512 for an 16-bit image), and the regularization part denoted by Q. In the color images case, Equation (12) should be computed for every color channel and the output merging likelihood is the multiplication of the individual likelihoods of every channel. According to the merging probability α ( R a , R b ) computation, we decide whether R a is merged with R b in probabilistic manner. By generating a random value u from a uniform distribution range 0 and 1. If the random value u is greater than α ( R a , R b ) , then R a is not merged with R b otherwise the regions are merged.
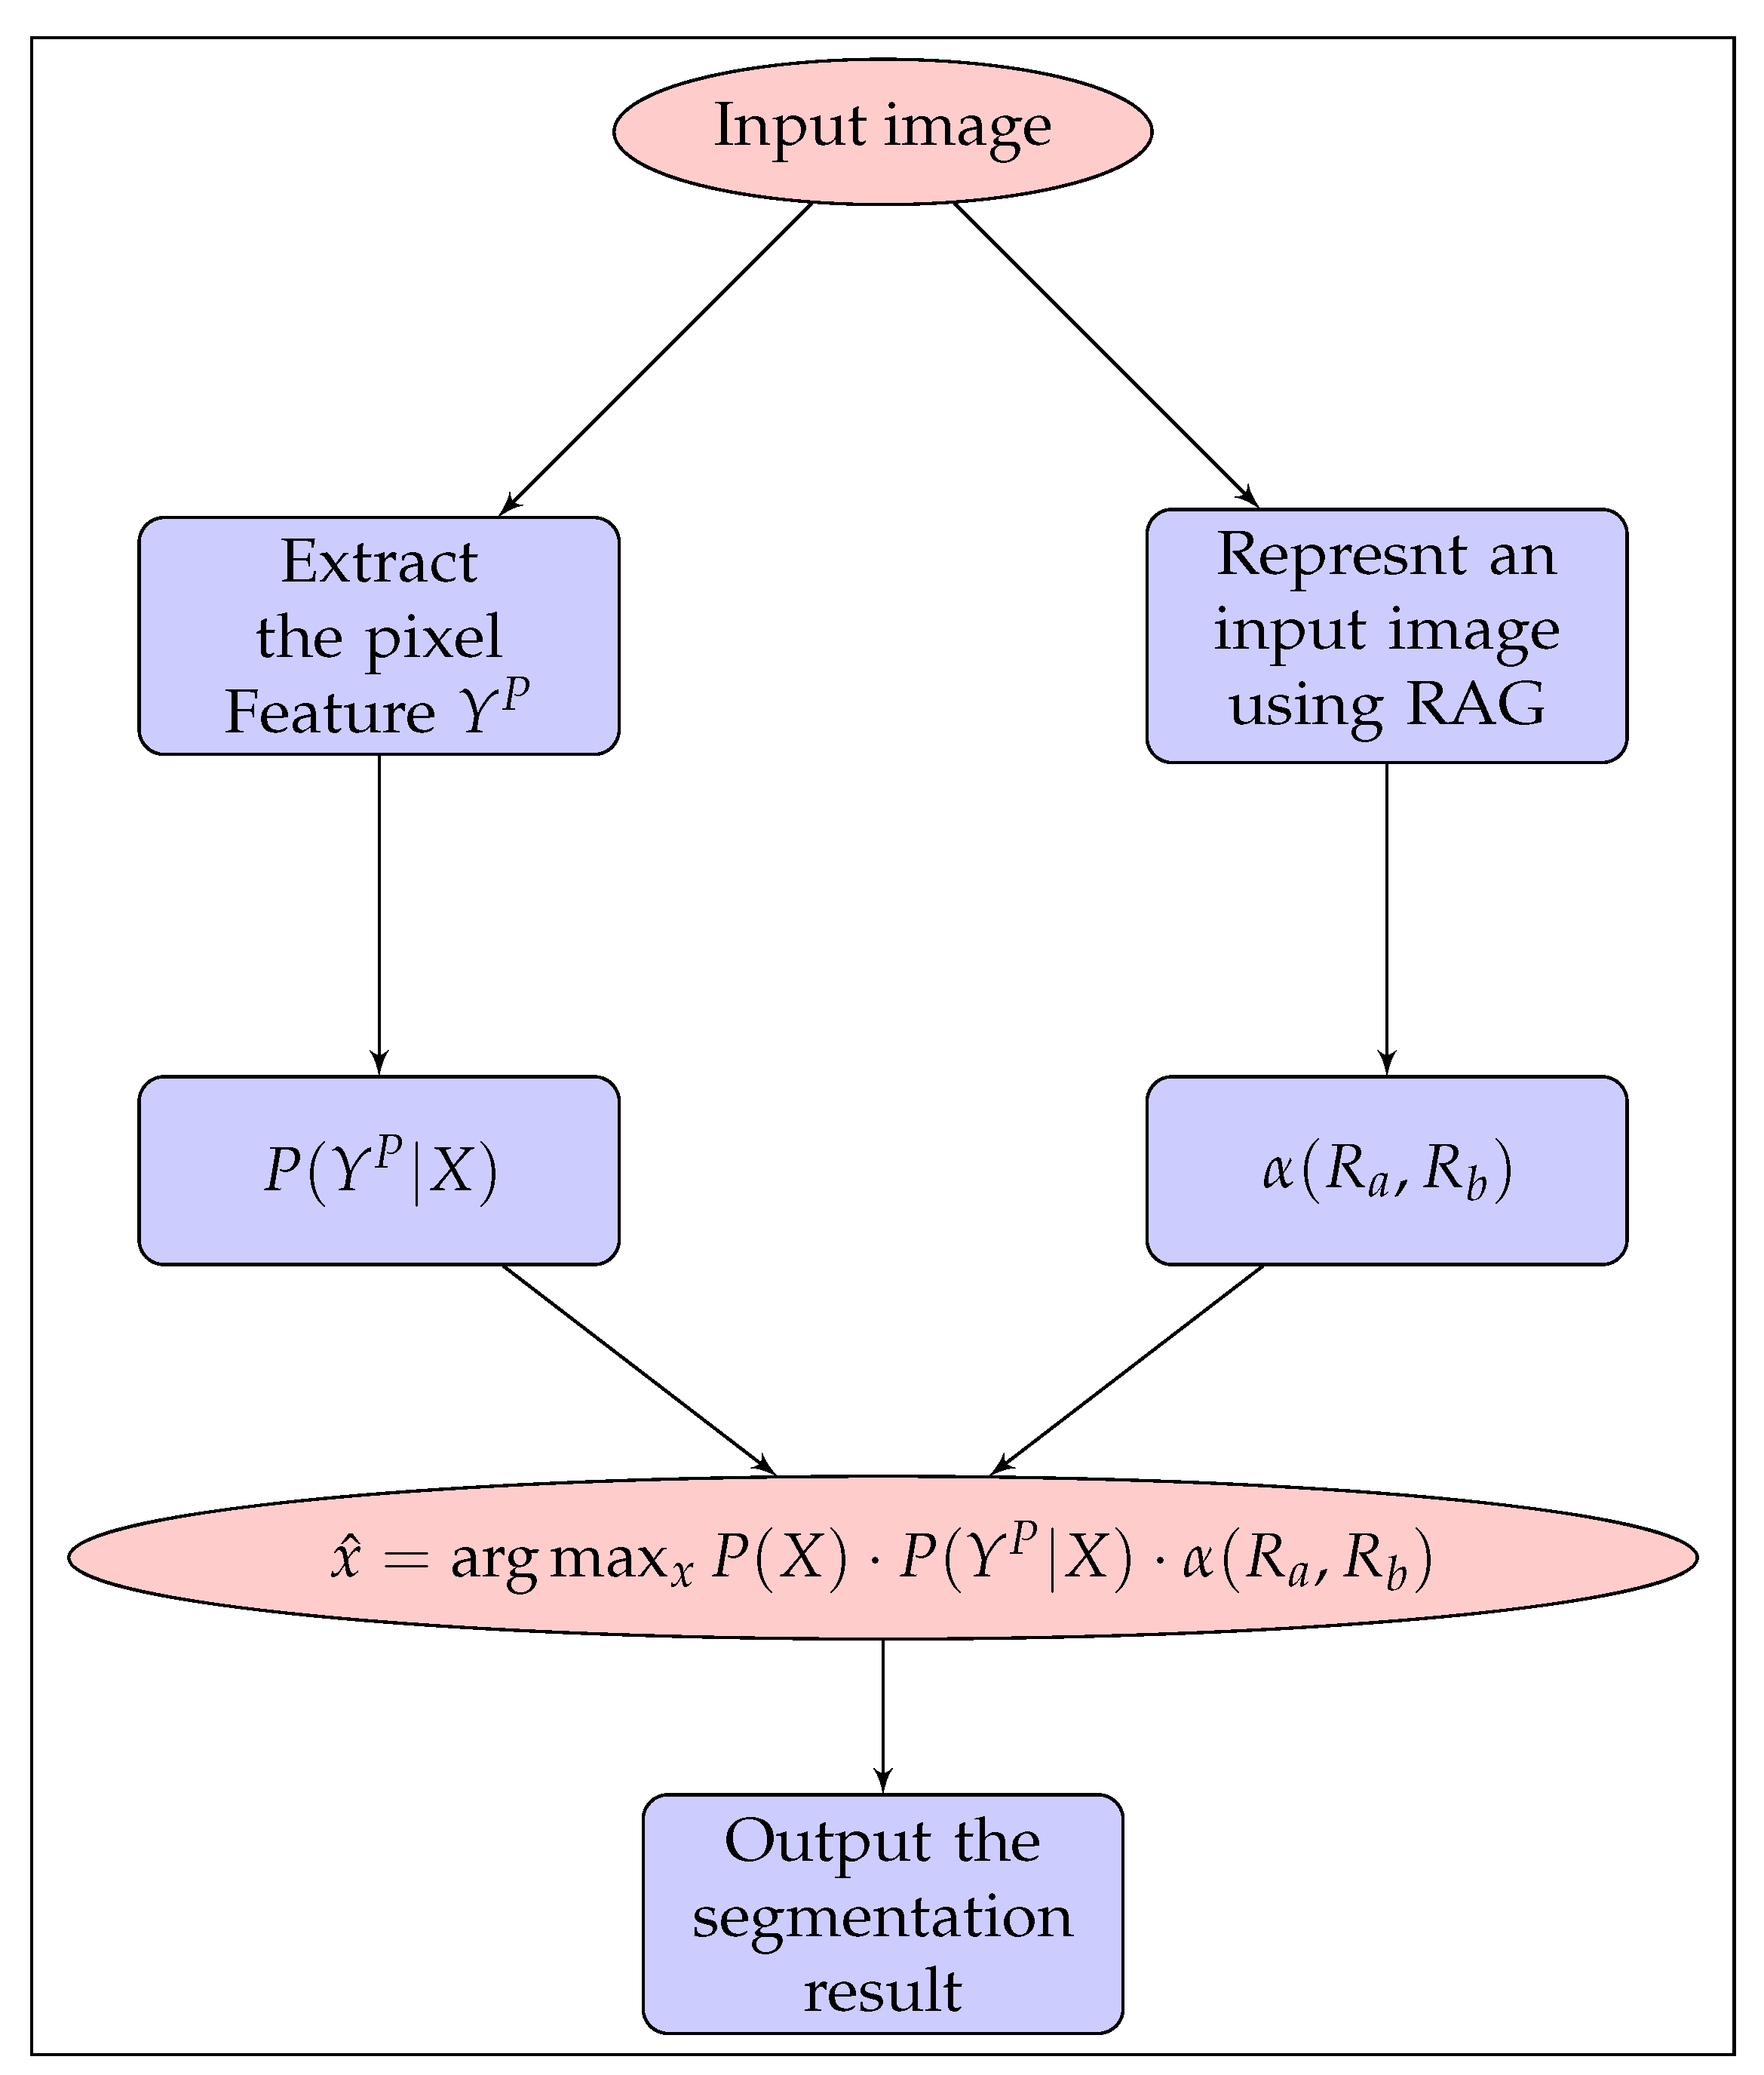
Figure 2 shows the flowchart of the stochastic region-merging and the pixel-based MRF method for the skin lesion segmentation. It is started by extracting pixel features from a given skin lesion image Y. Then the regional features, using the stochastic region merging approach are extracted. After that, the pixel features and the regional features image are used to estimate the probability of likelihood functions. Finally, the MAP using the pixel features and the regional features are estimated.

2.5. Parameters Setting

The proposed method has four variables, μ h P , Σ h P , β , and γ which are used in Equations (7) and (11). The variables μ h P , Σ h P are the Gaussian distribution parameters called the mean value and the variance value, respectively, which can be computed as follows
μ h P = 1 | X h | s X h Y s P , Σ h P = 1 | X h | s X h Y s P μ h P Y s P μ h P .
Here β denotes the potential parameter in (7) which is used for estimating P ( X ) , and γ is applied to consider the interaction between P ( Y s P | X s = h ) and α ( R a , R b ) .

3. Results

In this section, the experimental results of the proposed method is discussed. The performance evaluation of the proposed skin lesion segmentation method is carried out by using the various experiments. Two publicly available datasets have been used for the empirical experiments. Different types of evaluation metrics are used to evaluate the proposed method performance. The outputs achieved are compared with the existing algorithms.

3.1. Datasets

The evaluation of the proposed method has been obtained by using the two publicly available datasets. The first is the dermatology image dataset, also known as the PH2 dataset, which was released by the dermatology service of the Hospital Pedro Hispano, Portugal [32]. It contains 200 dermoscopic images, including 40 melanoma, 80 common nevi and 80 atypical nevi. The dermoscopic images are RGB color with a resolution of 768 × 560 pixels. The PH2 dataset also has the ground truth of each image, which is representing as binary images. The skin lesion region with an intensity value of ‘0’ corresponds to the background (healthy skin), whereas the skin lesion region with an intensity value of ‘1’ corresponds to the region of interest (unhealthy skin). Secondly, the international skin imaging collaboration (ISIC) has collected the dermoscopic images from leading hospitals internationally and acquired with different devices [1,33]. The ISIC 2018 contains 2594 dermoscopic images with the ground truth which is given by the dermatologists. The image size posses the highest resolution of 1022 × 767 pixels. It was also categorized into training and testing images set with the ground truth labels, respectively. The training and testing images are in JPG format, while the ground truths are binary images in PNG format.

3.2. Evaluation Metric Calculation

We have used various skin lesion segmentation metrics to evaluate the performance of the proposed method; these include the Jaccard index, the Dice similarity coefficient, the sensitivity, the specificity, and the accuracy. Many studies have used these metrics and they considered as the most common metrics for the segmented-images evaluation. More details about these metrics are discussed as follows.
The Jaccard similarity coefficient compares the similarity for the pixels in the ground truth and automatic segmented-image to check which pixels are matched and which are unmatched. It takes two sets of data as an input and produces the similarity result in a range from 0 % to 100 % . The formula to find the index is:
Jaccard Index = | X Y | | X Y | ,
where X and Y denote the pixel’s number in the ground truth and the automatic segmented-image, respectively.
On the other hand, the Dice similarity coefficient measures the overlap or similarity between the automatic segmented-image and the ground truth. It is given as
Dice = 2 T P F P 2 T P F N .
Sensitivity measures the proportion of those with the true positive values among those who actually tested positive.
Sensitivity = T P T P F N .
Specificity measures the proportion of those that are the true negative values among those who tested negative.
Specificity = T N T N F P .
Accuracy measures the proportion of both the true positives values and the true negatives values among the sum of the true and the false results. The formula is
Accuracy = T P T N T P T N F P F N .
Here F P , F N , T P , and T N denotes the false positive pixels number, the false negative pixels number, the true positive pixels number, and the true negative pixels number, respectively.

3.3. Performance Evaluation

The evaluation metrics defined in Section 3.2 are used to assess the proposed method performance. The applied performance metrics applied are a pixel-level estimation. The pixel-level segmentation accuracy is the measure of how many target pixels (lesion pixels) are predicted when compared with the ground truth. Sensitivity measures the number of true lesion pixels that are identified as the lesion pixels. In contrast, specificity measures the number of true background pixels that are predicted as the background pixels. Dice coefficient similarity and Jaccard index measure the degree of overlapping of the automatically segmented lesion and the ground truth. Concerning lesion segmentation performance on the two datasets, first, the proposed method result on the PH2 skin lesion image dataset is depicted in Table 1. We see the result achieved for the Jaccard index and the Dice coefficient is of 78.35 % and 89.65 % , respectively. This result indicates that the proposed method can predict and differentiates a higher amount of unhealthy skin lesions from the healthy skin lesions on the PH2 dataset.
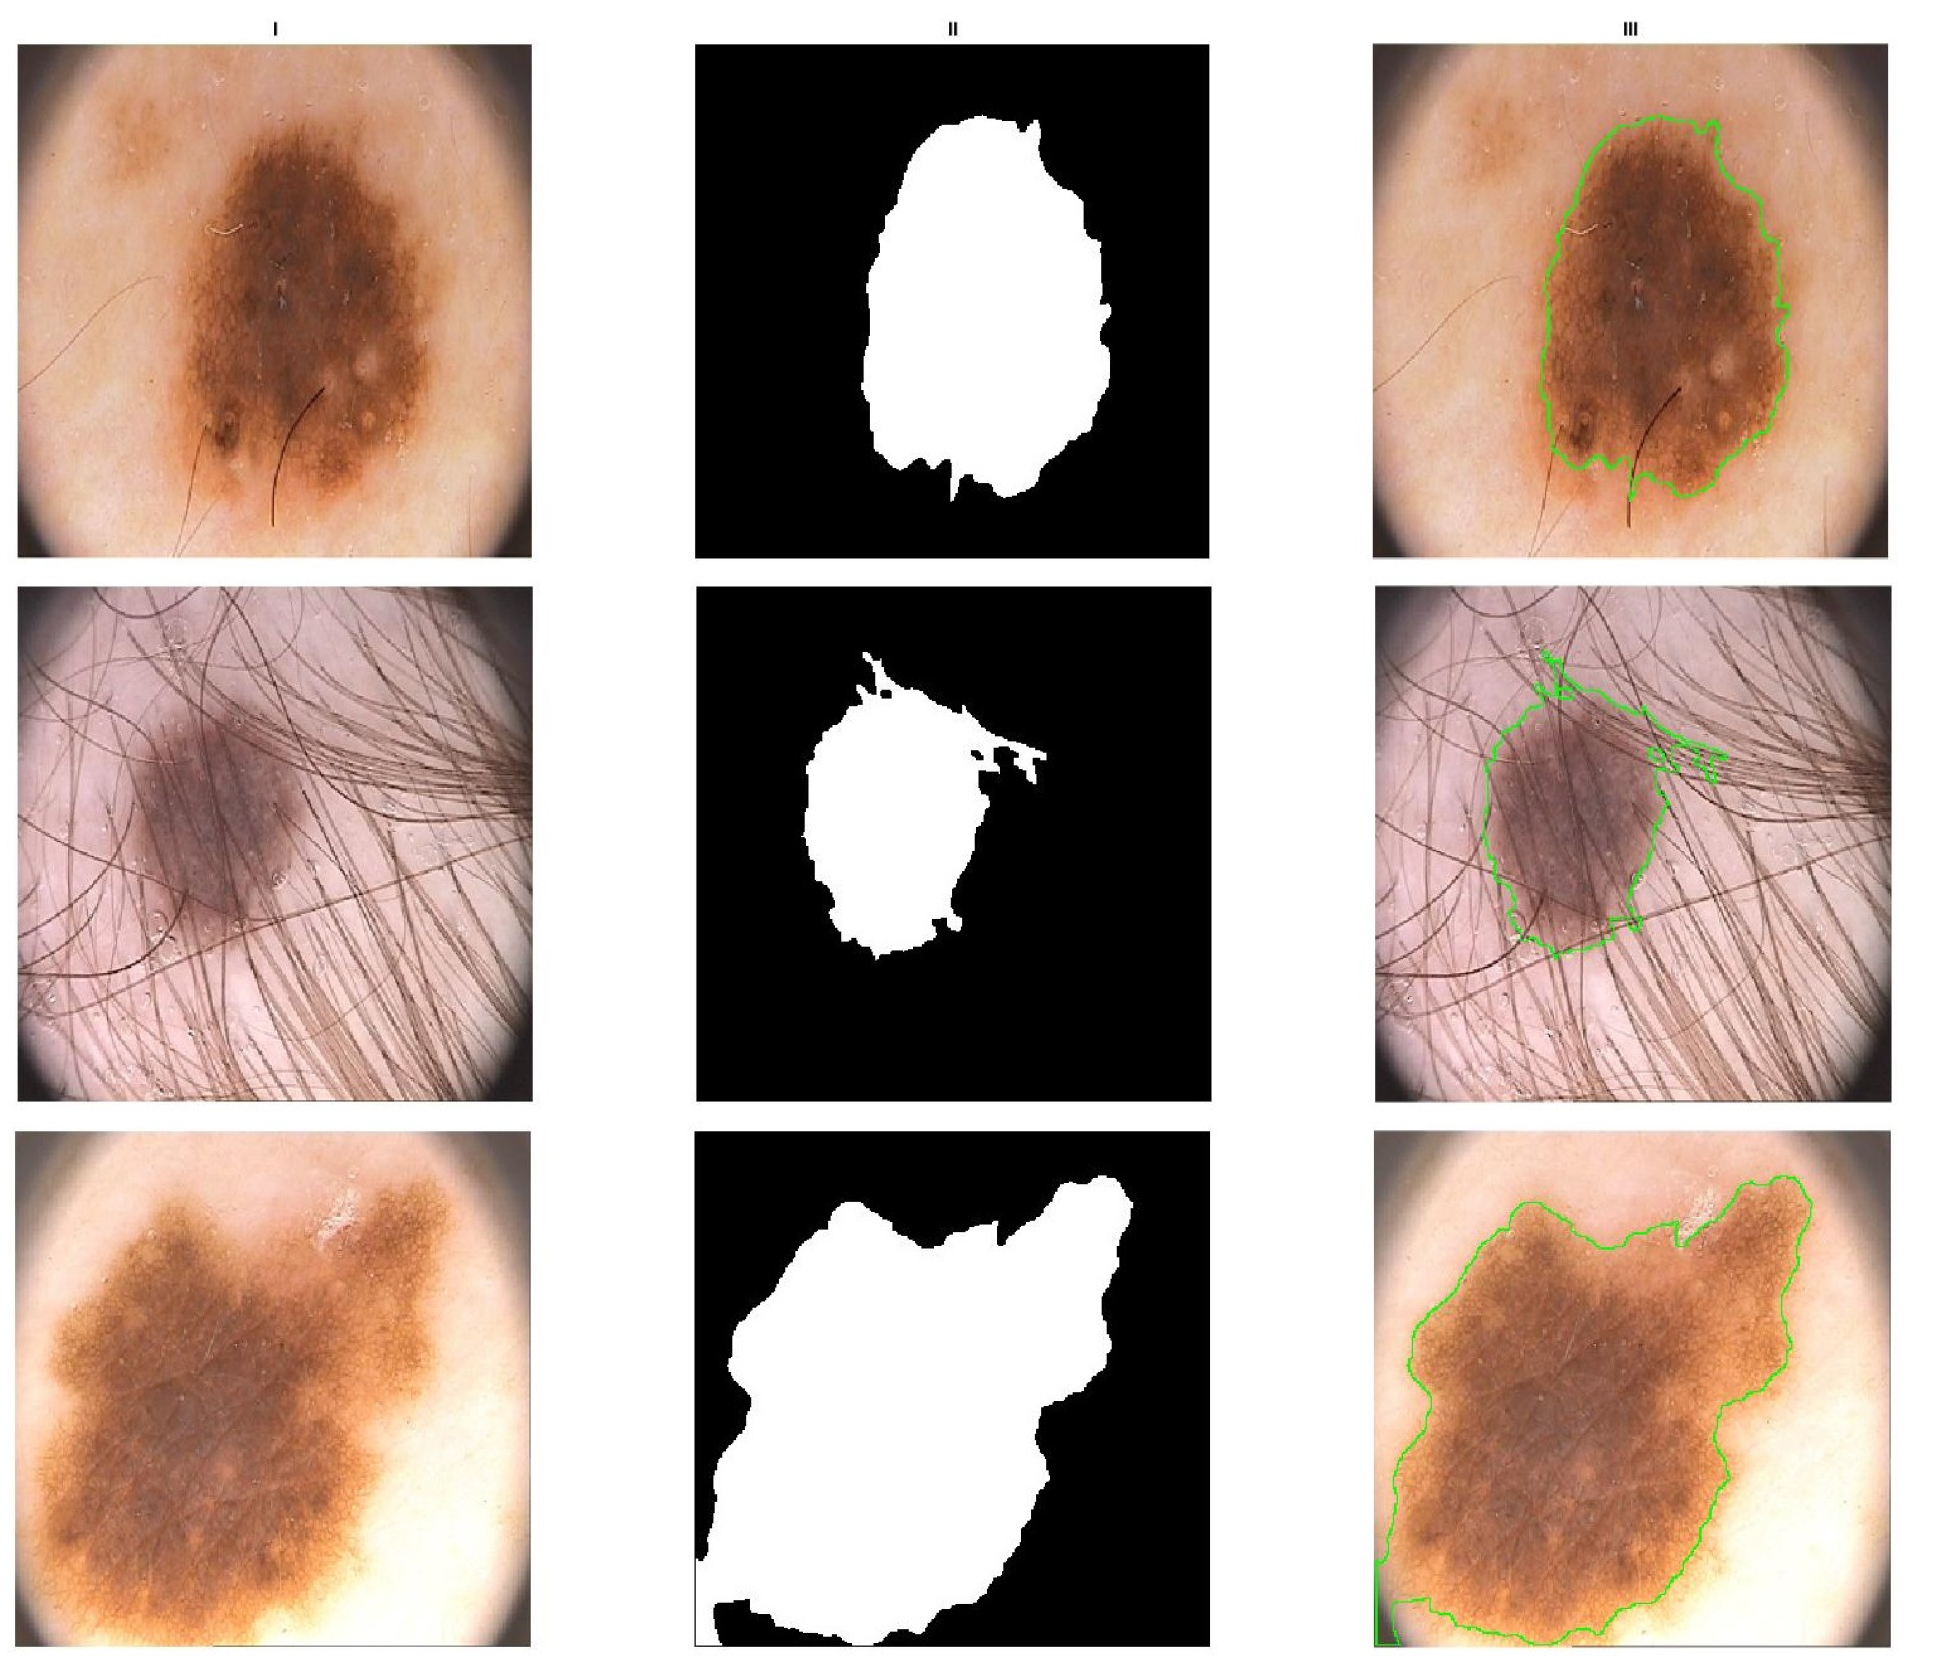
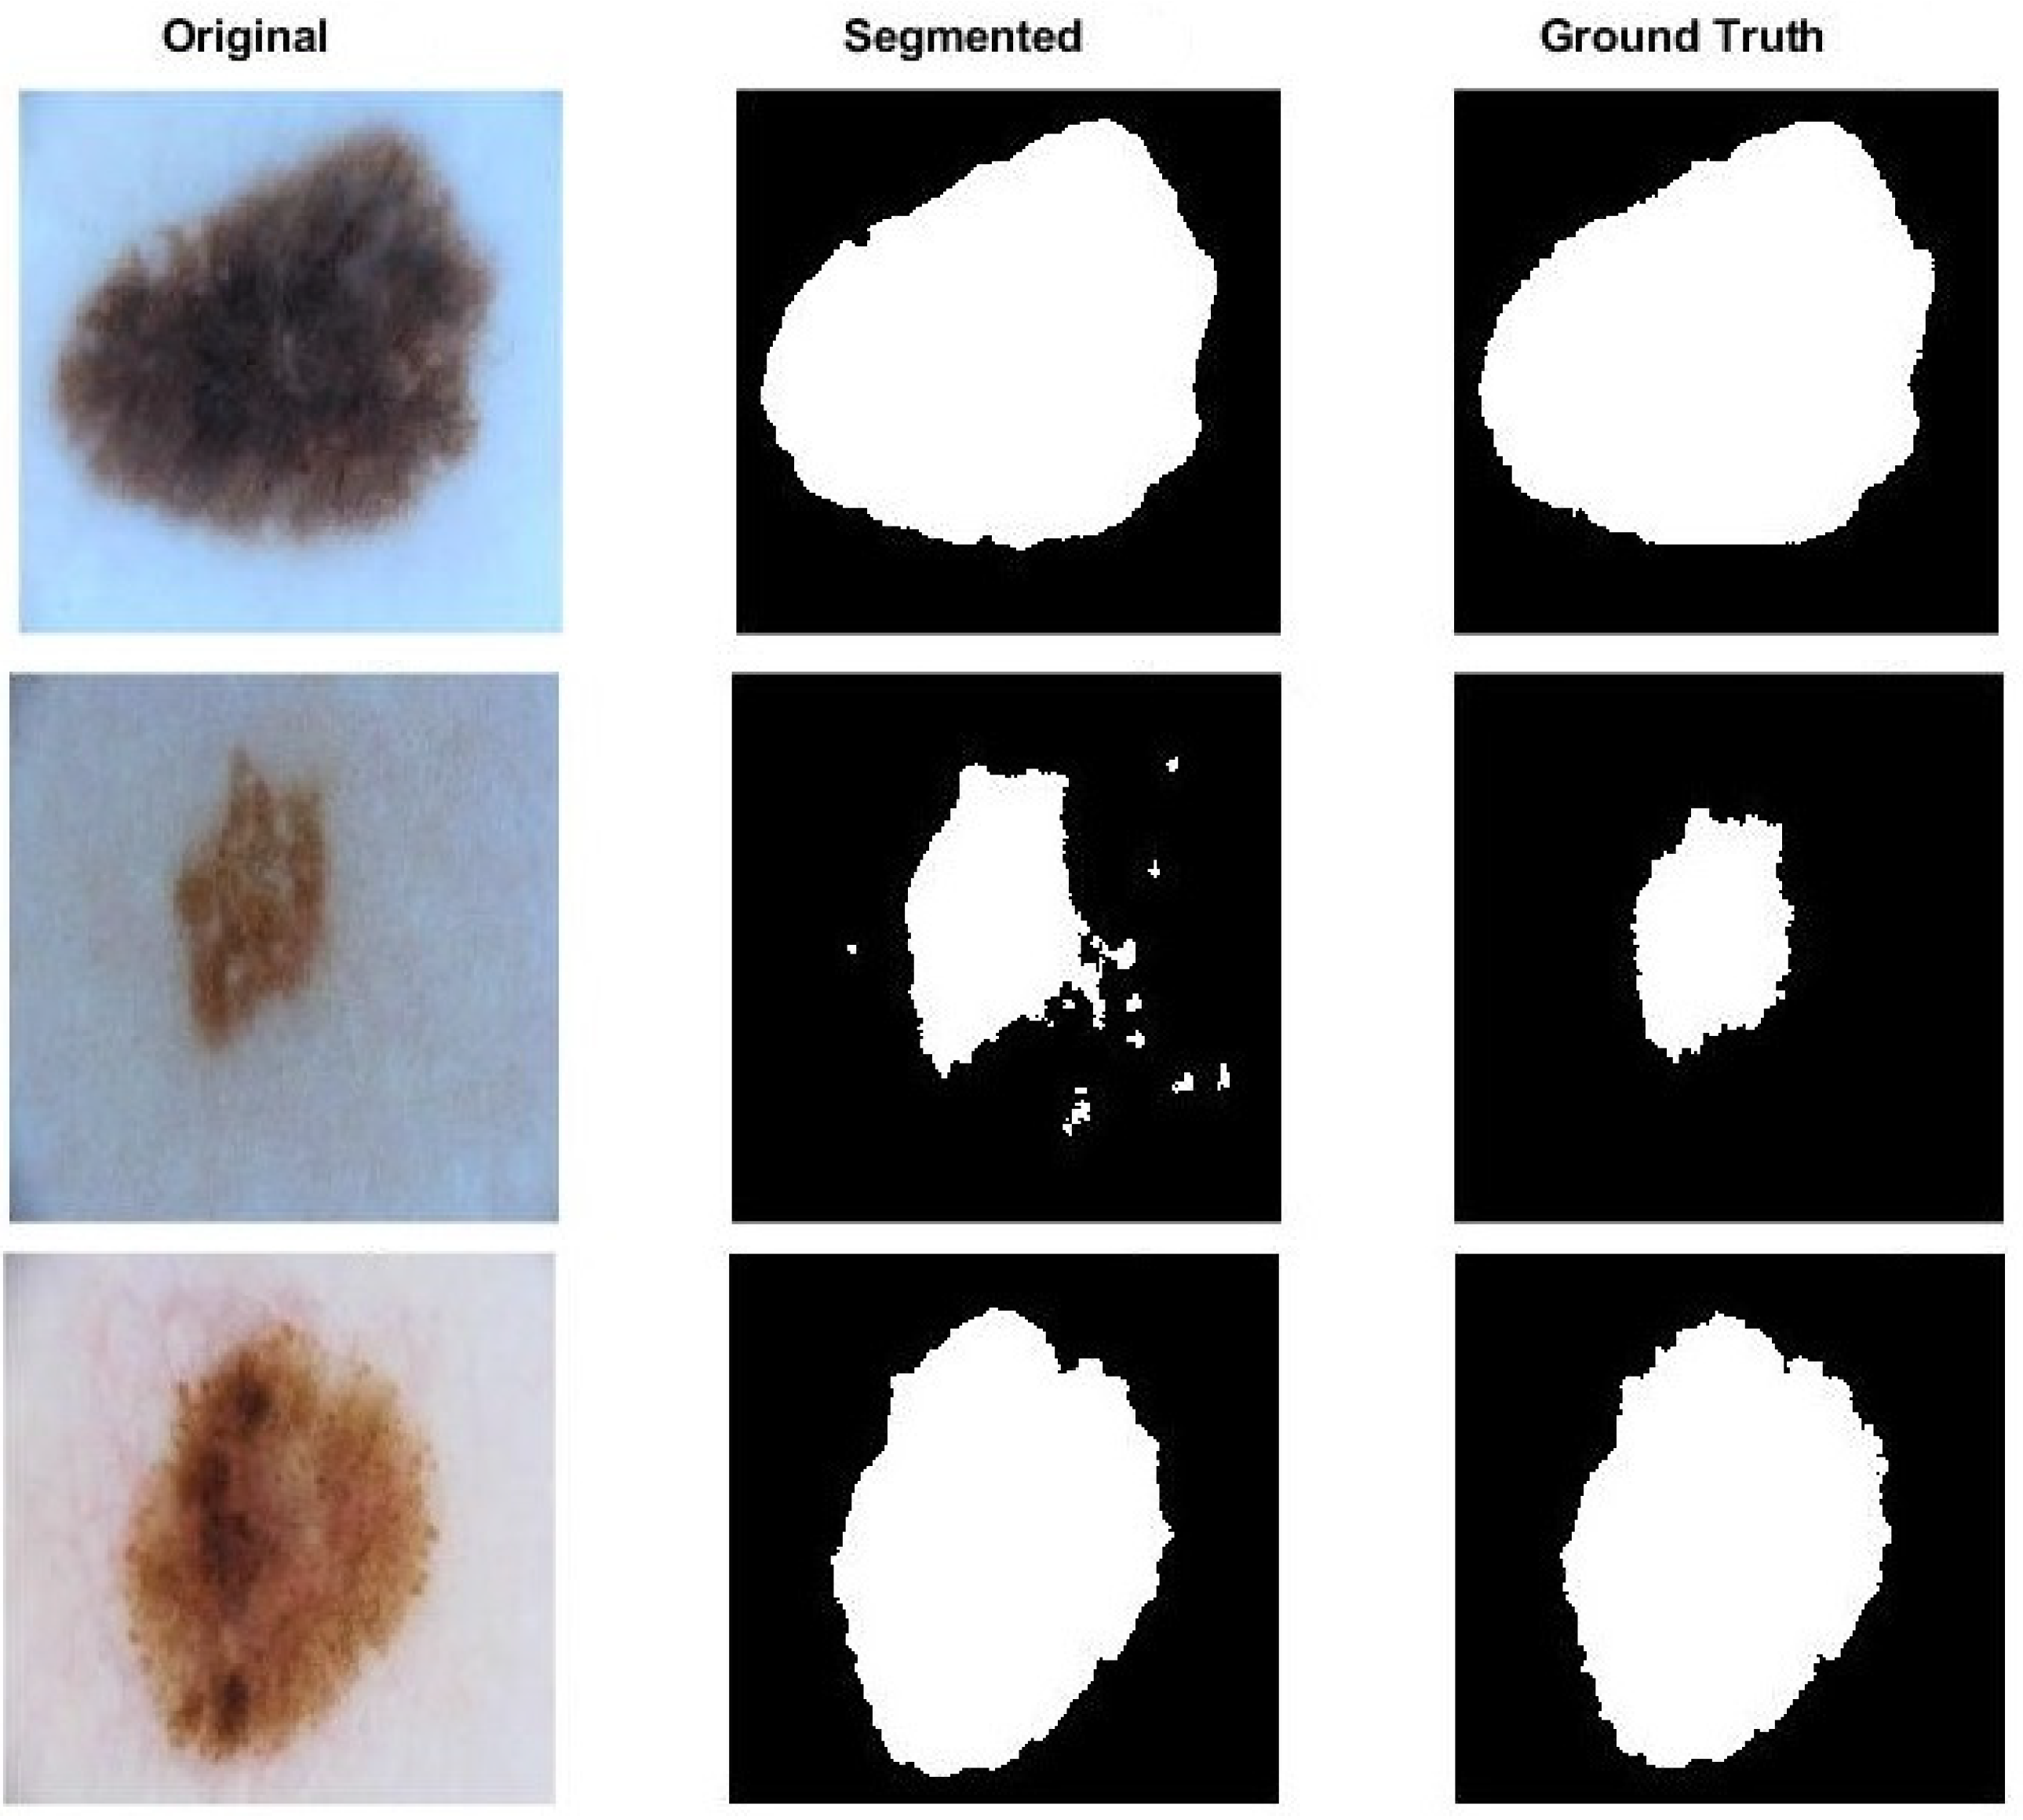
The proposed method has evaluated on the ISIC dataset using 100 and 1000 for validation and test skin lesion images, respectively. The images were resized to 256 × 256 pixels. The result achieved both the Jaccard index and the Dice coefficient of 79.78 % and 88.34 % for validation set, 72.45 % and 80.67 % for test dataset, respectively. Furthermore, the proposed method performance in Table 1 gives a good accuracy percentage and sensitivity of 92.77 % and 87.17 % on the ISIC validation set, respectively. It also shows excellent specificity of 97.99 % on the same dataset. This result again indicates that the proposed method can predict and differentiates a higher amount of unhealthy skin lesions from the healthy tissues on the ISIC skin lesion dataset. The results output in Figure 3 and Figure 4 for both the PH2 and the ISIC dataset also shows that the proposed method performance in various skin lesions is challenging, such as fuzzy border, noisy and artifacts presence and low contrast between lesion.

3.4. Comparison

The proposed method performance is compared with four well-known segmentation algorithms for the dermoscopic images: C-LS [34], AT [35], DT [23], and CA [19]. Their results published for the evaluation of the PH2 dataset used in [36]. All these algorithms have been used the same pre-processing step, except that the proposed method has no pre-processing step. The Dice coefficient is chosen for the comparison evaluation where it has been commonly used among the compared algorithms. The result shows that the proposed method does not only perform well but also outperforms some existing methods. It attributed mostly to the complementary of the pixel-based MRF and the stochastic region-based methods. When we compare the results with the methods mentioned earlier, the proposed method generated notably higher results in comparison to the opposite methods, and it has the highest Dice coefficient overall average of 89.65 % , as well as the best maximum of 98.09 % and minimum of 66.18 % . The outcomes imply that the proposed method performance is more efficient in predicting and isolating lesions, especially complex cases. For complex cases, the proposed method had the highest minimum Dice coefficient of 66.18 % , which is higher than the next best method (DT) and has the lowest standard deviation, as can be shown in Table 2. The DT performed second best in minimum Dice coefficient, but its ability to accurately predicts the edges of the lesion across all the dataset (see Figure 5). The closest method to the proposed method in overall Dice coefficient measures is the CA method. Further, the C-LS has some challenges in some cases, such as the heterogeneous background which makes it hard to predicts lesions. However, additional post-processing such as the dilation or simple border smoothing can be processed to the C-LS to bias the segmentation outputs.
Figure 5 shows one sample of the lesion segmentation results for several methods: C-LS, CA, AT, DT, and the proposed method. All these methods give the segmentation results which are not similar to the segmentation of the ground truth except the proposed method. This example shows the power of our lesion segmentation results compared to other methods. However, the proposed method is sensitive to such image condition and fully automated method.

4. Conclusions

This paper proposes a method for the automated skin lesion region. The proposed method based on stochastic region and pixel feature has also been presented for the robust segmentation of the skin lesions towards the melanoma detection. This method adopts an enhanced in the lesion segmentation with a combination of the stochastic region-merging and the pixel feature. The segmentation effectiveness of the proposed method has been measured by using five types of evaluation metrics, i.e., the Jaccard Index, the Dice coefficient, the accuracy, the sensitivity, and the specificity. The results on segmentation performance have been shown in Table 1, which indicates many essential insights on the performance and the particularities of the proposed method. The proposed system achieved an overall Dice coefficient and accuracy of 89.65 % and 91.51 % on the PH2 skin lesion image dataset. The proposed method has also achieved the Dice coefficient and the accuracy of 88.34 % and 92.77 % on the ISIC validation set, respectively. The outputs can be inferred from the proposed system evaluation that the method is promising and could outperform some state-of-the-art.
The largest Dice coefficient achieved by the proposed method indicates that the proposed method the best overall performance when compares to the other methods. The proposed method can be part of a computer-aid diagnosis system to assist the clinicians and the doctors to automatically identify the skin lesions diagnosis. The experimental results of the proposed method for the skin lesions indicate that this method potentially can give additional accurate segmentation of the skin lesions images in comparison to the other existing methods. This method will assist the dermatologists to automatically locate a region of the skin lesion for more diagnosis.

Author Contributions

Conceptualization, O.S. and S.V.; methodology, O.S.; coding, O.S.; writing–original draft preparation, O.S.; supervision, S.V. All authors have read and agreed to the published version of the manuscript.

Funding

This research received no external funding.

Conflicts of Interest

The authors declare no conflict of interest.

Abbreviations

The following abbreviations are used in this manuscript:
MRFMarkove Random Filed
ISICInternational Skin Imaging Collaboration
MAPMaximum a Posteriori

References

  1. Codella, N.C.; Gutman, D.; Celebi, M.E.; Helba, B.; Marchetti, M.A.; Dusza, S.W.; Kalloo, A.; Liopyris, K.; Mishra, N.; Kittler, H.; et al. Skin lesion analysis toward melanoma detection: A Challenge Hosted International Skin Imaging Collaboration (isic). arXiv 2019, arXiv:1902.03368. [Google Scholar]
  2. Celebi, M.E.; Kingravi, H.A.; Uddin, B.; Iyatomi, H.; Aslandogan, Y.A.; Stoecker, W.V.; Moss, R.H. A methodological approach to the classification of dermoscopy images. Comput. Med. Imaging Gr. 2007, 31, 362–373. [Google Scholar] [CrossRef] [PubMed] [Green Version]
  3. Nguyen, N.; Lee, S. Robust Boundary Segmentation in Medical Images Using a Consecutive Deep Encoder-Decoder Network. IEEE Access 2019, 7, 33795–33808. [Google Scholar] [CrossRef]
  4. Celebi, M.E.; Hitoshi, I.; Gerald, S.; William, V.S. Lesion border detection in dermoscopy images. Comput. Med. Imaging Gr. 2009, 2, 148–153. [Google Scholar] [CrossRef] [PubMed] [Green Version]
  5. Lee, H.K.; Kim, J.H. An HMM-based threshold model approach for gesture recognition. IEEE Trans. Pattern Anal. Mach. Intell. 1999, 10, 961–973. [Google Scholar]
  6. Chen, Y.B.; Chen, O.T.C. Image segmentation method using thresholds automatically determined from picture contents. Eurasip J. Image Video Process. 2009, 1, 140492. [Google Scholar] [CrossRef] [Green Version]
  7. Losada, C.; Mazo, M.; Palazuelos, S.; Redondo, F. Adaptive threshold for robust segmentation of mobile robots from visual information of their own movement. In Proceedings of the 2009 IEEE International Symposium on Intelligent Signal Processing, Budapest, Hungary, 26–28 August 2009; pp. 293–298. [Google Scholar]
  8. Chen, S.; Zhang, D. Robust image segmentation using FCM with spatial constraints based on new kernel-induced distance measure. IEEE Trans. Syst. Man Cybern. Part B 2004, 34, 1907–1916. [Google Scholar] [CrossRef] [Green Version]
  9. Jain, A.K.; Murty, M.N.; Flynn, P.J. Data clustering: A review. ACM Comput. Surv. (CSUR) 1999, 3, 264–323. [Google Scholar] [CrossRef]
  10. Kanungo, T.M.; David, M.; Netanyahu, N.S.; Piatko, C.D.; Silverman, R.W.; Angela, Y. An efficient k-means clustering algorithm: Analysis and implementation. IEEE Trans. Pattern Anal. Mach. Intell. 2002, 7, 881–892. [Google Scholar] [CrossRef]
  11. Chen, X.; Zheng, C.; Yao, H.; Wang, B. Image segmentation using a unified Markov random field model. IET Image Process. 2017, 11, 860–869. [Google Scholar] [CrossRef]
  12. Zhao, Y.; Liu, J.; Li, H.; Li, G. Improved watershed algorithm for dowels image segmentation. In Proceedings of the 2008 7th World Congress on Intelligent Control and Automation, Chongqing, China, 25–27 June 2008; pp. 7644–7648. [Google Scholar]
  13. Hodneland, E.; Tai, X.C.; Gerdes, H.H. Four-color theorem and level set methods for watershed segmentation. Int. J. Comput. Vis. 2009, 3, 264–283. [Google Scholar] [CrossRef]
  14. Chien, S.Y.; Huang, Y.W.; Chen, L.G. Predictive watershed: A fast watershed algorithm for video segmentation. IEEE Trans. Circuits Syst. Video Technol. 2003, 13, 453–461. [Google Scholar] [CrossRef] [Green Version]
  15. Yu, H.; Li, L.; Xu, W.; Liu, W. A multi-scale approach to mass segmentation using active contour models. In Proceedings of the Medical Imaging 2010: Image Processing, San Diego, CA, USA, 13–18 February 2010; Volume 7623, p. 762343. [Google Scholar]
  16. Chang, R.F.; Wu, W.J.; Moon, W.K.; Chen, W.M.; Lee, W.; Chen, D.R. Segmentation of breast tumor in three-dimensional ultrasound images using three-dimensional discrete active contour model. Ultrasound Med. Biol. 2003, 11, 1571–1581. [Google Scholar] [CrossRef]
  17. Chan, T.F.; Vese, L.A. Active contours without edges. IEEE Trans. Image Process. 2001, 2, 266–277. [Google Scholar] [CrossRef] [PubMed] [Green Version]
  18. Taufiq, M.A.; Hameed, N.; Anjum, A.; Hameed, F. m-Skin Doctor: A mobile enabled system for early melanoma skin cancer detection using support vector machine. In eHealth 360; Springer: Cham, Switzerland, 2017; pp. 468–475. [Google Scholar]
  19. Bi, L.; Kim, J.; Ahn, E.; Feng, D.; Fulham, M. Automated skin lesion segmentation via image-wise supervised learning and multi-scale superpixel based cellular automata. In Proceedings of the 2016 IEEE 13th International Symposium on Biomedical Imaging (ISBI), Prague, Czech Republic, 13–16 April 2016; pp. 1059–1062. [Google Scholar]
  20. Li, Y.; Shen, L. Skin lesion analysis towards melanoma detection using deep learning network. Sensors 2018, 18, 556. [Google Scholar] [CrossRef] [PubMed] [Green Version]
  21. Wighton, P.; Sadeghi, M.; Lee, T.K.; Atkins, M.S. A fully automatic random walker segmentation for skin lesions in a supervised setting. Int. Conf. Med. Image Comput. Comput.-Assisted Interv. 2009, 1108–1115. Available online: https://link.springer.com/chapter/10.1007/978-3-642-04271-3_134 (accessed on 27 May 2020).
  22. Okuboyejo, D.; Olugbara, O.; Odunaike, S. Unsupervised Restoration of Hair-Occluded Lesion in Dermoscopic Images. MIUA 2014, 91–96. Available online: https://www.semanticscholar.org/paper/Unsupervised-Restoration-of-Hair-Occluded-Lesion-in-Okuboyejo-Olugbara/0c25698f522164ff3c473cdc5d88cce433a22c9d (accessed on 27 May 2020).
  23. Pennisi, A.; Bloisi, D.D.; Nardi, D.; Giampetruzzi, A.R.; Mondino, C.; Facchiano, A. Skin lesion image segmentation using Delaunay Triangulation for melanoma detection. Comput. Med. Imaging Gr. 2016, 52, 89–103. [Google Scholar] [CrossRef] [PubMed] [Green Version]
  24. Premaladha, J.; Ravichandran, K.S. Novel approaches for diagnosing melanoma skin lesions through supervised and deep learning algorithms. J. Med. Syst. 2016, 4, 96. [Google Scholar] [CrossRef]
  25. Eltayef, K.A.A. Segmentation and Lesion Detection in Dermoscopic Images. Ph.D. Thesis, Brunel University London, London, UK, 2017. [Google Scholar]
  26. Lee, J.G.; Jun, S.; Cho, Y.W.; Lee, H.; Kim, G.B.; Seo, J.B.; Kim, N. Deep learning in medical imaging: General overview. Korean J. Radiol. 2017, 4, 570–584. [Google Scholar] [CrossRef] [PubMed] [Green Version]
  27. Litjens, G.; Kooi, T.; Bejnordi, B.E.; Setio, A.A.A.; Ciompi, F.; Ghafoorian, M.; Van Der Laak, J.A.; Van Ginneken, B.; Sánchez, C.I. A survey on deep learning in medical image analysis. Med. Image Anal. 2017, 42, 60–88. [Google Scholar] [CrossRef] [Green Version]
  28. Sainath, T.N.; Mohamed, A.R.; Kingsbury, B.; Ramabhadran, B. Deep convolutional neural networks for LVCSR. In Proceedings of the 2013 IEEE International Conference on Acoustics, Speech and Signal Processing, Vancouver, BC, Canada, 26–31 May 2013; pp. 8614–8618. [Google Scholar]
  29. Bi, L.; Kim, J.; Ahn, E.; Kumar, A.; Fulham, M.; Feng, D. Dermoscopic image segmentation via multistage fully convolutional networks. IEEE Trans. Biomed. Eng. 2017, 9, 2065–2074. [Google Scholar] [CrossRef] [PubMed] [Green Version]
  30. Wong, A.; Scharcanski, J.; Fieguth, P. Automatic skin lesion segmentation via iterative stochastic region merging. IEEE Trans. Inf. Technol. Biomed. 2011, 15, 929–936. [Google Scholar] [CrossRef] [PubMed]
  31. Li, S. Markov Random Field Modelling in Image Analysis, 3rd ed.; Springer: London, UK, 2009. [Google Scholar]
  32. Mendonça, T.; Ferreira, P.M.; Marques, J.S.; Marcal, A.R.; Rozeira, J. PH2- A dermoscopic image database for research and benchmarking. In Proceedings of the 2013 35th Annual International Conference of the IEEE Engineering in Medicine and Biology Society (EMBC), Osaka, Japan, 3–7 July 2013; pp. 5437–5440. [Google Scholar]
  33. Tschandl, P.; Rosendahl, C.; Kittler, H. The HAM10000 dataset, a large collection of multi-source dermatoscopic images of common pigmented skin lesions. Sci. Data 2018, 5, 180161. [Google Scholar] [CrossRef]
  34. Chan, T.F.; Sandberg, B.Y.; Vese, L.A. Active contours without edges for vector-valued images. J. Vis. Commun. Image R 2000, 11, 130–141. [Google Scholar] [CrossRef] [Green Version]
  35. Silveira, M.; Nascimento, J.C.; Marques, J.S.; Marçal, A.R.; Mendonça, T.; Yamauchi, S.; Maeda, J.; Rozeira, J. Comparison of segmentation methods for melanoma diagnosis in dermoscopy images. IEEE J. Sel. Top. Signal Process. 2009, 3, 35–45. [Google Scholar] [CrossRef]
  36. Ahn, E.; Kim, J.; Bi, L.; Kumar, A.; Li, C.; Fulham, M.; Feng, D.D. Saliency-based lesion segmentation via background detection in dermoscopic images. IEEE J. Biomed. Health Inf. 2017, 21, 1685–1693. [Google Scholar] [CrossRef]
Figure 1. The pixel-pased MRF model part, with observations (squares) and labels (circles) [11].
Symmetry 12 01224 g001
Figure 2. The flowchart of stochastic region-merging and pixel-based MRF method.
Symmetry 12 01224 g002
Figure 3. PH2 sample of skin cancer segmentation using the proposed method. (I) Original image (II) Segmented image (III) Segmented lesion region overlapped with the original image
Symmetry 12 01224 g003
Figure 4. ISIC sample of skin cancer segmentation using the proposed method.
Symmetry 12 01224 g004
Figure 5. Segmentation results from one sample (PH2 dataset).
Symmetry 12 01224 g005
Table 1. Segmentation performance of the proposed method on the two datasets.
Metric PH2 Dataset ISIC ValidationISIC Test
Jaccard Index (%) 78.35 79.78 72.45
Dice Coefficient (%) 89.65 88.34 80.67
Accuracy (%) 91.51 92.77 89.47
Sensitivity (%) 84.07 87.17 79.45
Specificity (%) 95.55 97.99 95.09
Table 2. Comparison of the proposed method using PH2 dataset.
Method Dice(Min) Dice(Max) Dice(Avg) Dice(Dtv)
C-LS [34,35,36] 7.44 % 97.47 % 84.82 % 11.44 %
AT [35,36] 25.21 % 96.68 % 81.91 % 13.81 %
DT [23,36] 30.40 % 95.35 % 86.04 % 7.09 %
CA [19] 17.73 % 96.11 % 88.89 % 12.34 %
Proposed method66.18%98.09%89.65%4.07%