Abstract
The objective was to optimize the existing solution for the limit support pressure of a tunnel face. Firstly, based on the numerical simulation results, the existing three-dimensional analytical solution for pore water pressure distribution is expanded to a three-dimensional solution considering the pore water pressure distribution in the upper formation behind the tunnel face. Then, according to the results of physical model tests, a failure model considering the failure range in the upper formation behind the tunnel face is established, and the newly established three-dimensional solution for pore water pressure is introduced into the model, and then the limit effective support pressure of the tunnel face considering seepage is obtained by the method of soil–water joint calculation. Finally, the calculation results in this paper are compared with the experimental results, numerical simulation results and existing theoretical solutions. The major findings are as follows. The distribution of pore water pressure in the front and back strata above the tunnel face is basically symmetrical. The limit effective support pressure of the tunnel face will increase linearly with an increase in the hydraulic head difference between the tunnel face and the ground surface. The calculated results of the new limit equilibrium theory are obviously larger than those of the existing theory and numerical simulation and closer to the results of the physical model tests. Therefore, the new limit equilibrium model can better predict the limit effective support pressure of the tunnel face considering seepage and provide a reference for actual projects.
1. Introduction
It is easy to form a seepage field near a tunnel face when the shield is excavated in a saturated sandy soil layer, which is not conducive to the stability of the tunnel face. The determination of the limit support pressure of the tunnel face under seepage conditions is very important to maintain the stability of the tunnel face in saturated sandy soil. Physical model tests [1,2,3] and numerical simulations [4,5,6] can be used to study the limit support pressure of the tunnel face under seepage conditions, but these methods are often limited to specific seepage fields and soil physical and mechanical parameters. However, theoretical calculation can often predict the limit support pressure of the tunnel face under different seepage conditions and soil physical and mechanical parameters. Theoretical calculation of the limit support pressure of the tunnel face under seepage conditions mainly includes limit analysis [7,8,9] and limit equilibrium analysis, and the limit equilibrium method is simple and easy to understand and more convenient to apply to actual projects.
Anagnostou and Kovári [10] combined the seepage force calculated by numerical simulation and the classical wedge model, which gives the calculation expression of the limit support pressure of the tunnel face. Perazzelli et al. [11] and Cao et al. [12] fitted the pore water pressure distribution expression based on the numerical simulation results and combined the classical wedge model to study the effect of seepage on the limit support pressure of the tunnel face. Wang et al. [13] further optimized the pore water pressure distribution expression based on numerical simulation results, making the calculation result of the limit support pressure of the tunnel face more accurate. Based on engineering practice, Wei and He [14] proposed a trapezoidal wedge failure model, which is more in line with the actual situation than the classical wedge model. Based on the trapezoid wedge model, Qiao et al. [15] and Lü et al. [16], respectively, combined the seepage force and pore water pressure obtained from the numerical simulation results, and expressed the calculation of the limit support pressure of the tunnel face considering seepage. All of the above theories are based on numerical simulation to study the influence of seepage on the limit support pressure of the tunnel face, which is inconvenient for application in practical engineering. Cao et al. [17] extended the existing analytical solution for pore water pressure directly in front of the tunnel face [18] and the analytical solution for two-dimensional pore water pressure above the tunnel face [19] to a three-dimensional solution for pore water pressure distribution in front of the tunnel face. Combined with the limit instability failure model established by numerical simulation, the calculation of the limit support pressure of the tunnel face was obtained through the limit balance equation.
In this paper, the limit equilibrium method is used to study the limit support pressure of the tunnel face in saturated sandy soil under seepage conditions. First of all, according to the numerical simulation results, the three-dimensional solution for pore water pressure distribution in front of the tunnel face from Cao et al. [17] is extended to a three-dimensional solution for pore water pressure considering the upper formation behind the tunnel face. Secondly, based on the results of physical model tests by Mi and Xiang [3], an instability failure model considering the failure range behind the tunnel face was established, and the newly established three-dimensional pore water pressure solution was introduced into the model to obtain the limit support pressure of the tunnel face. Finally, the calculation results in this paper are compared with experimental results, numerical simulation results and existing theoretical solutions.
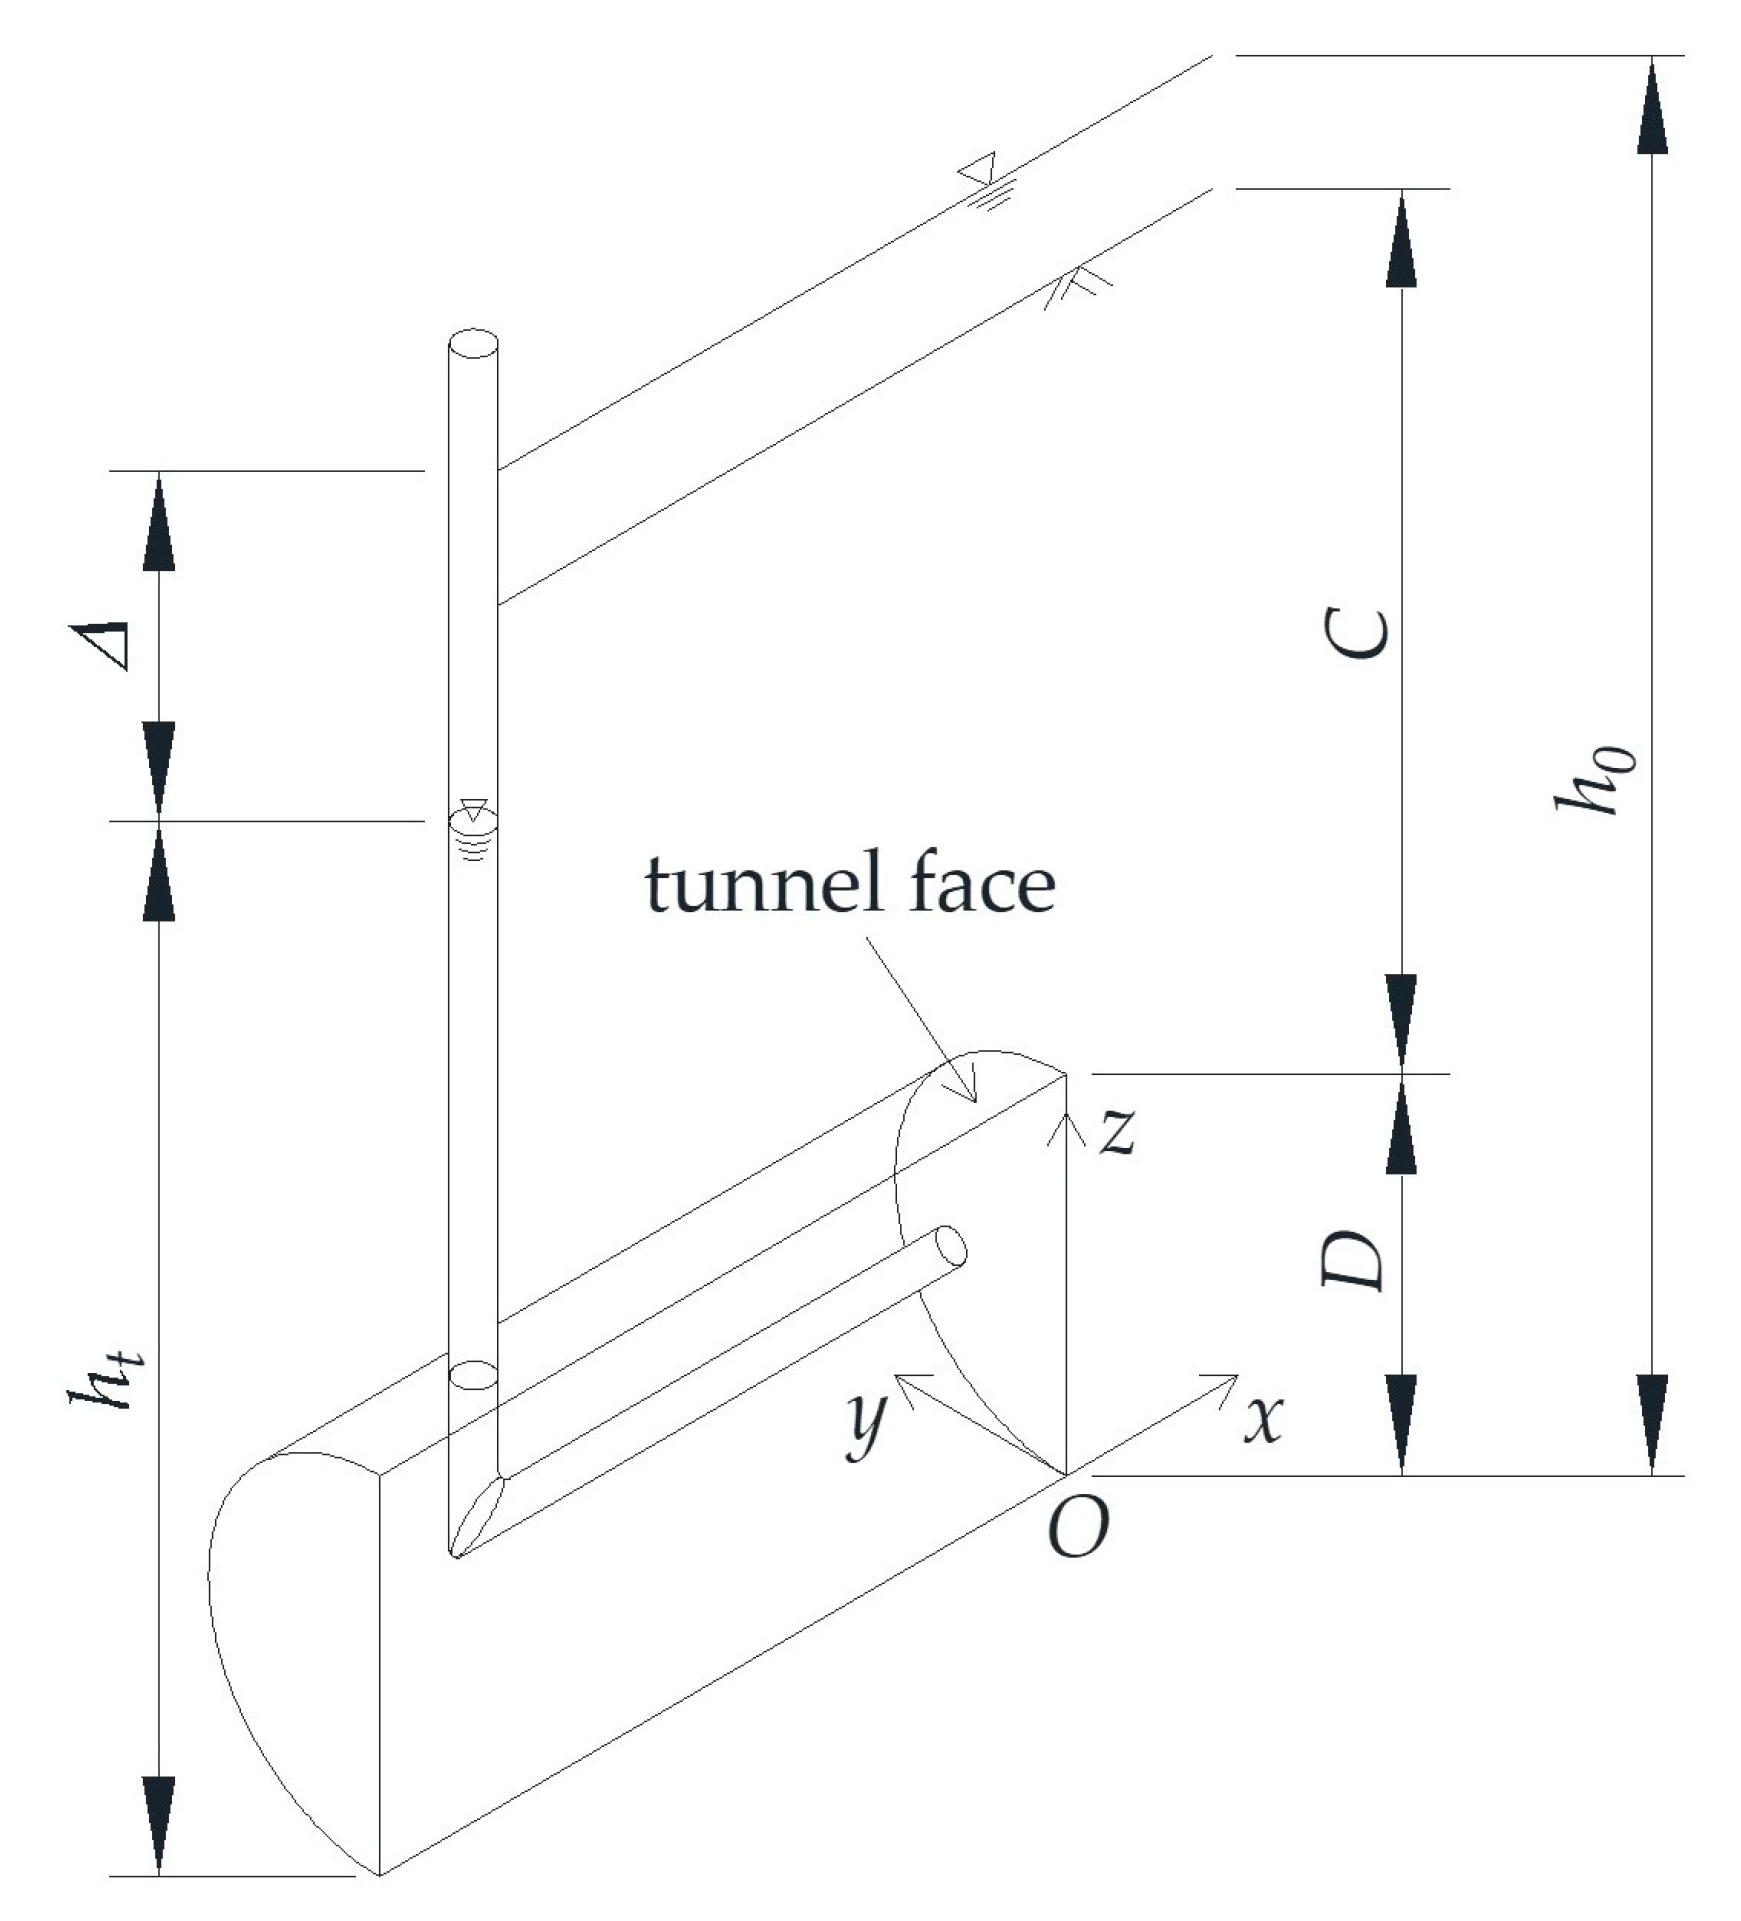
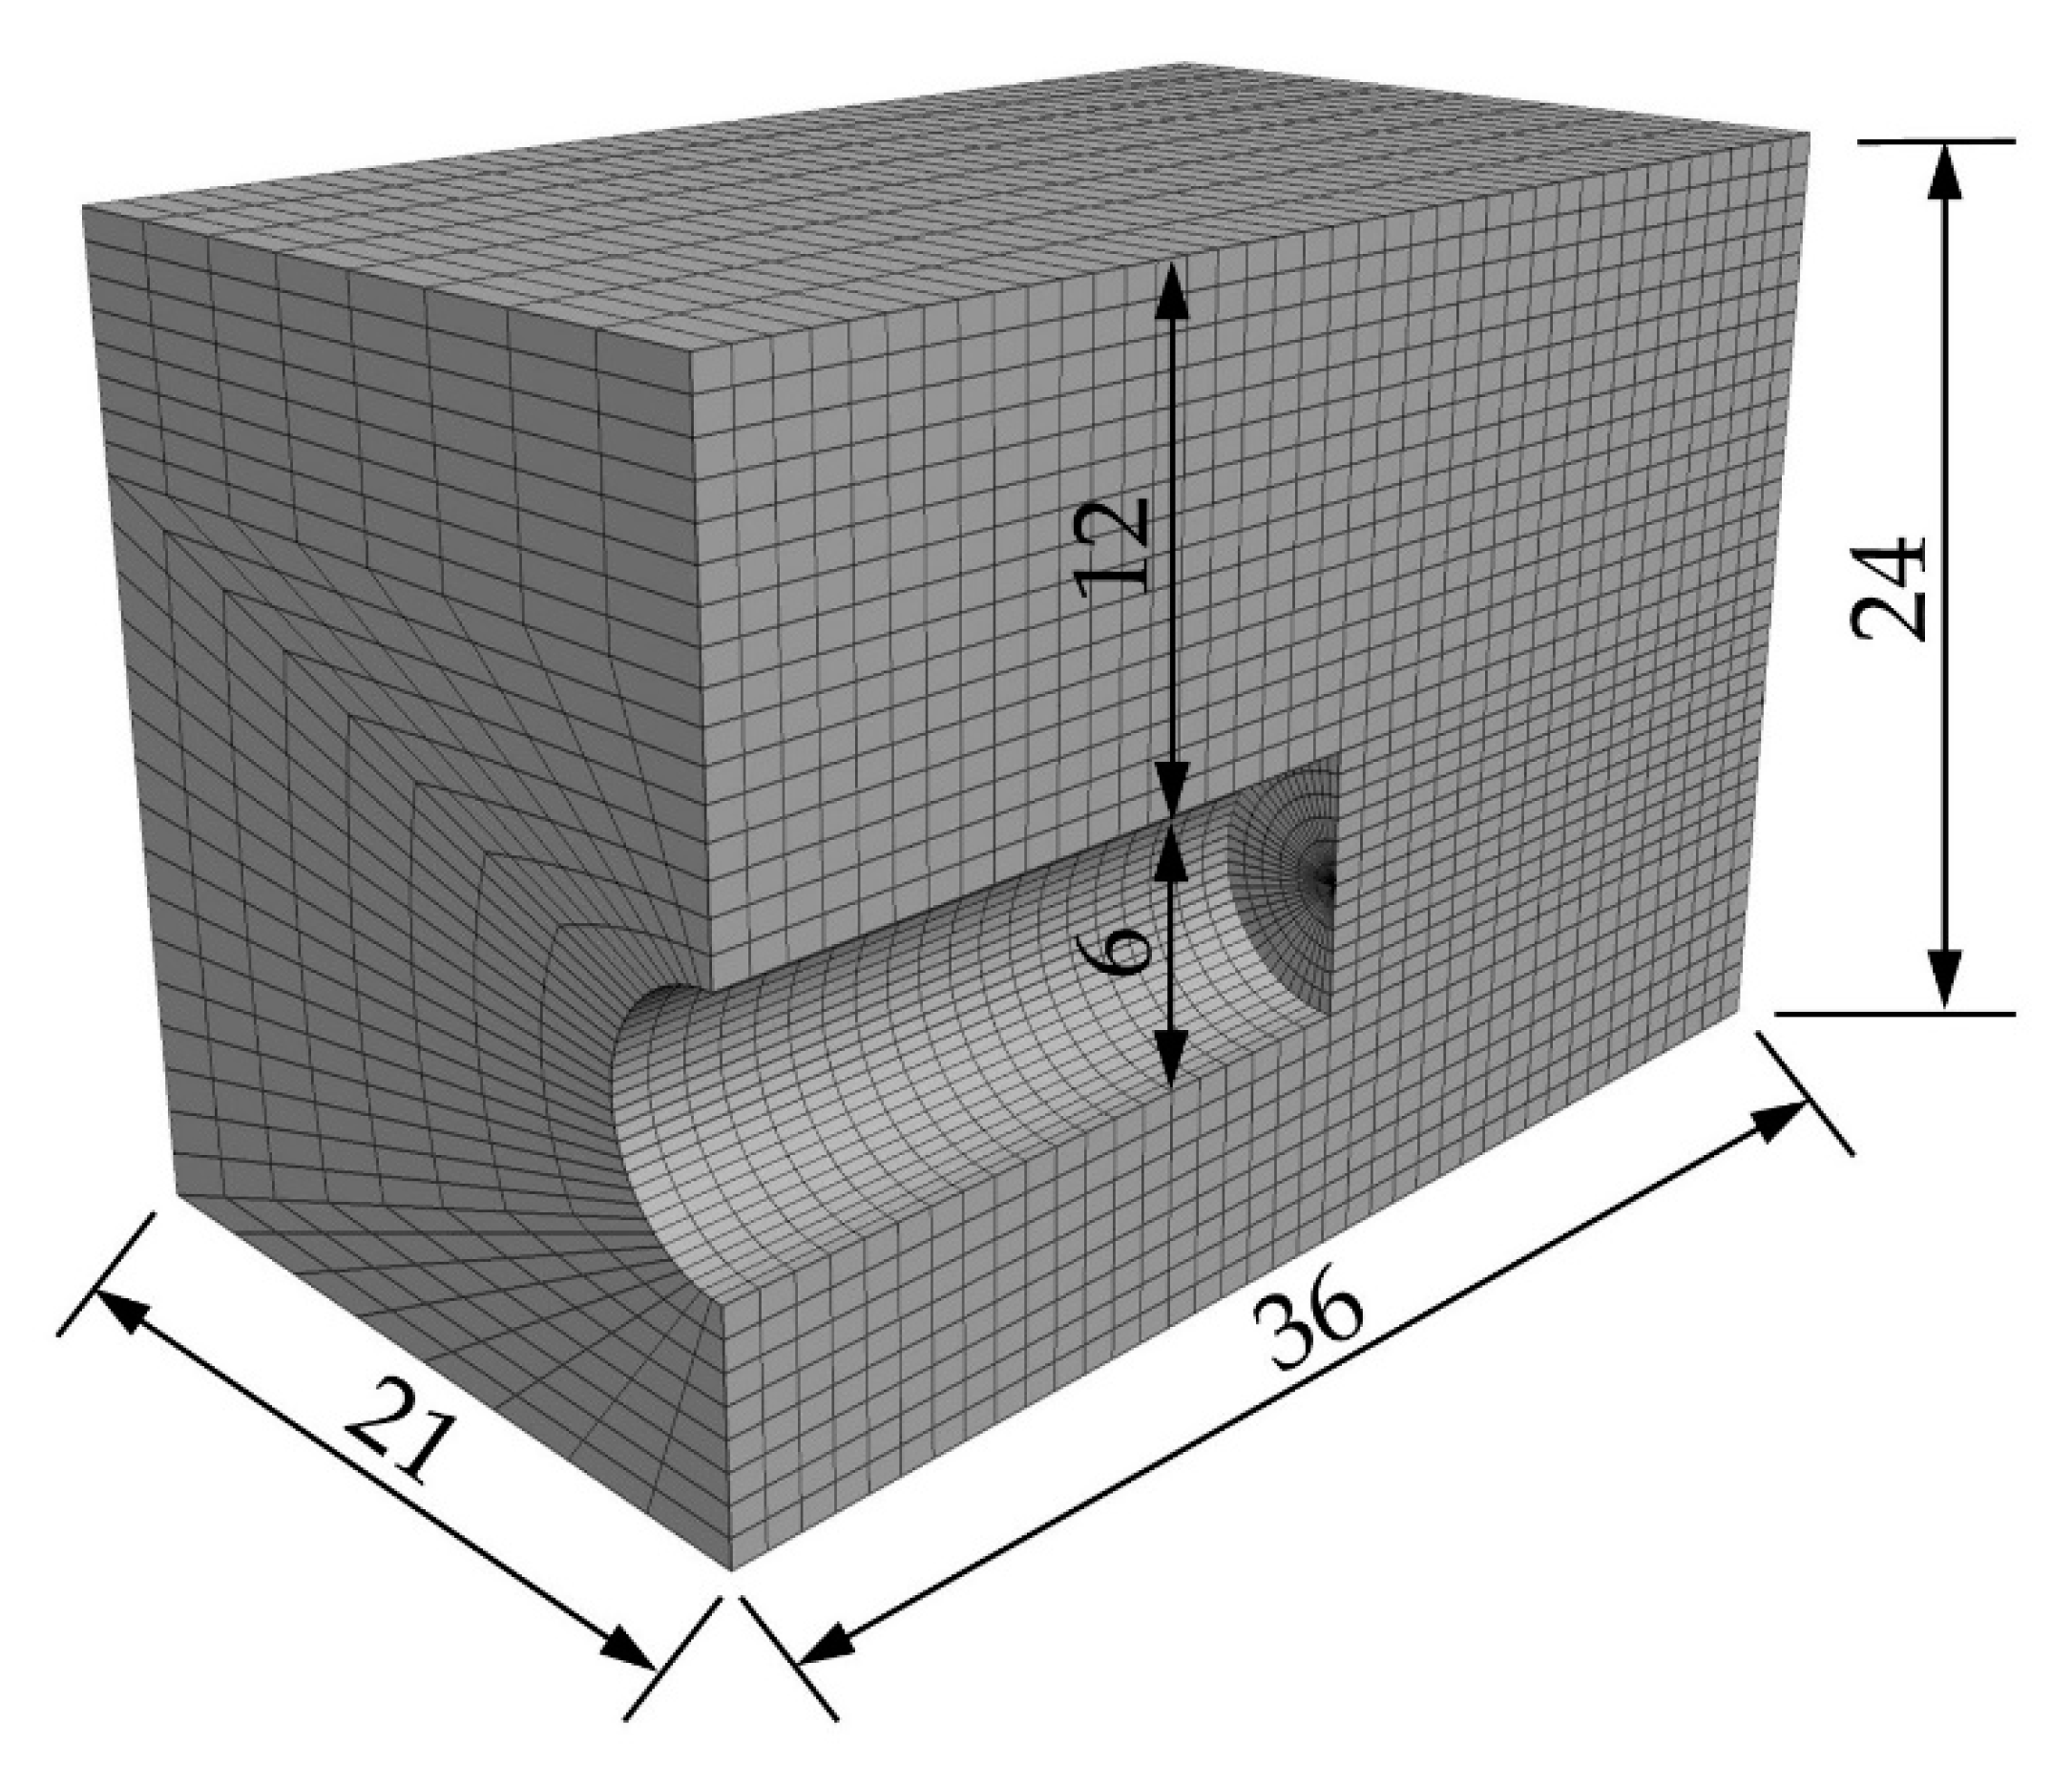
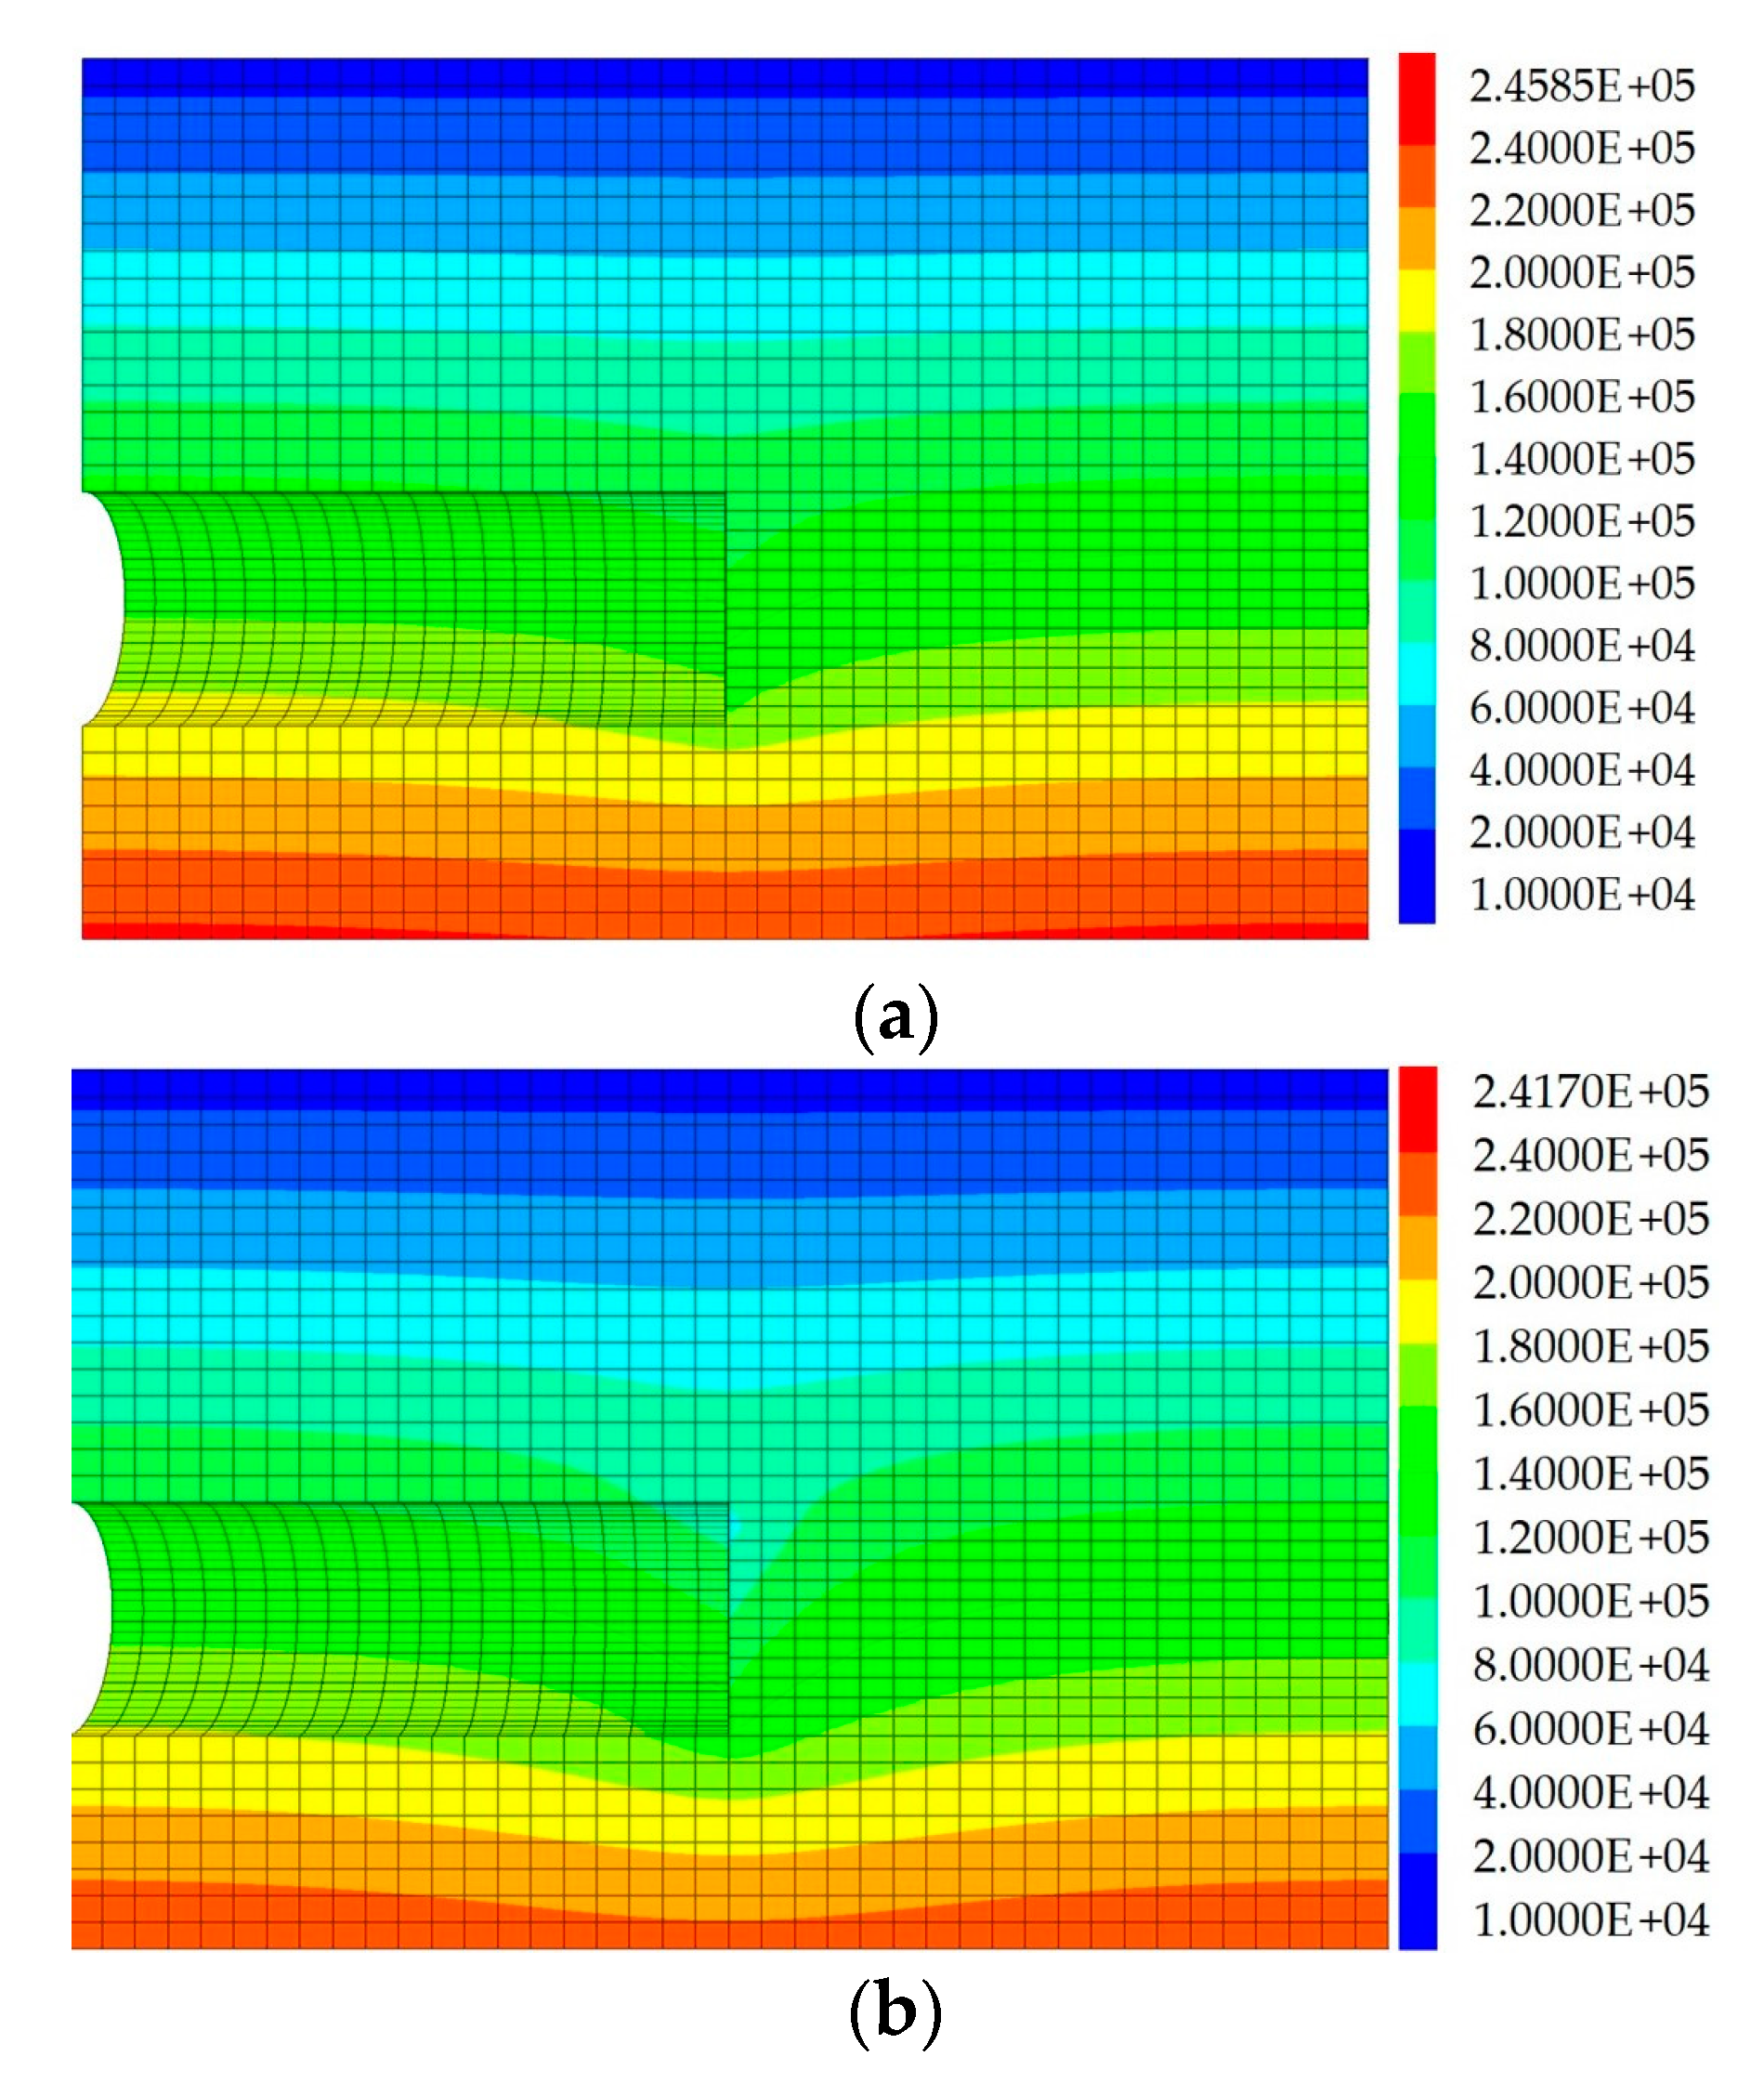
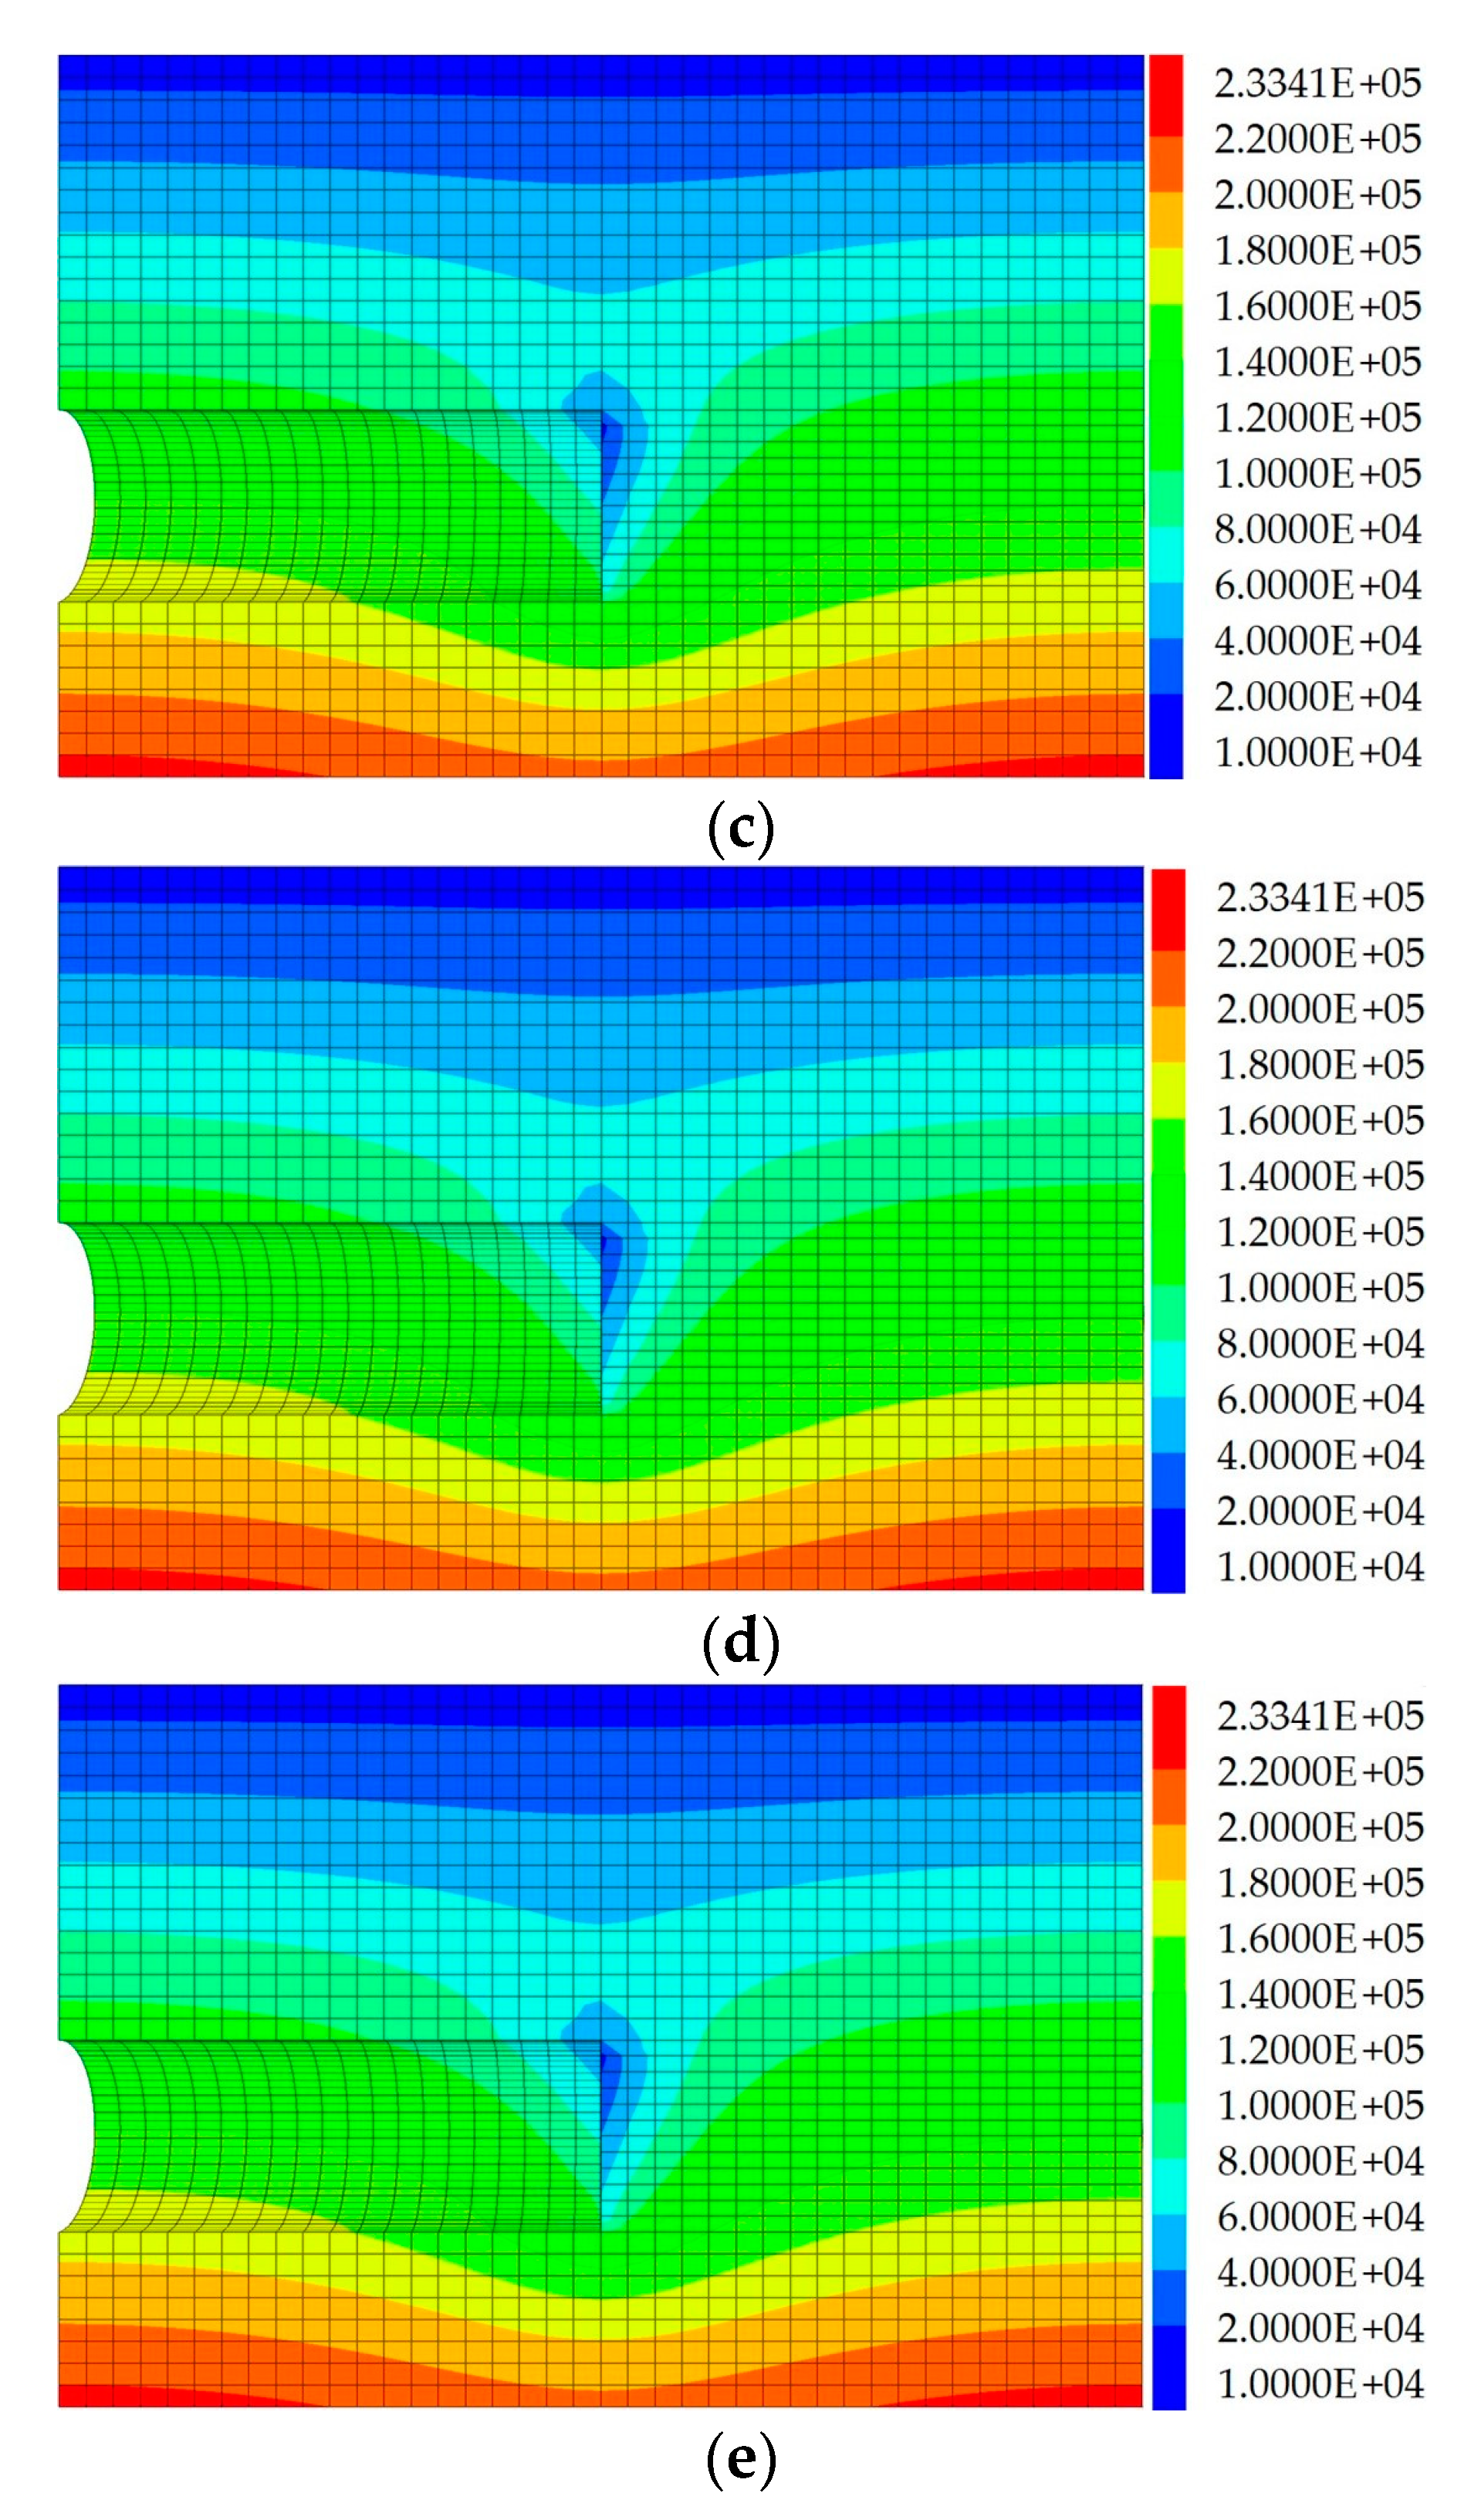
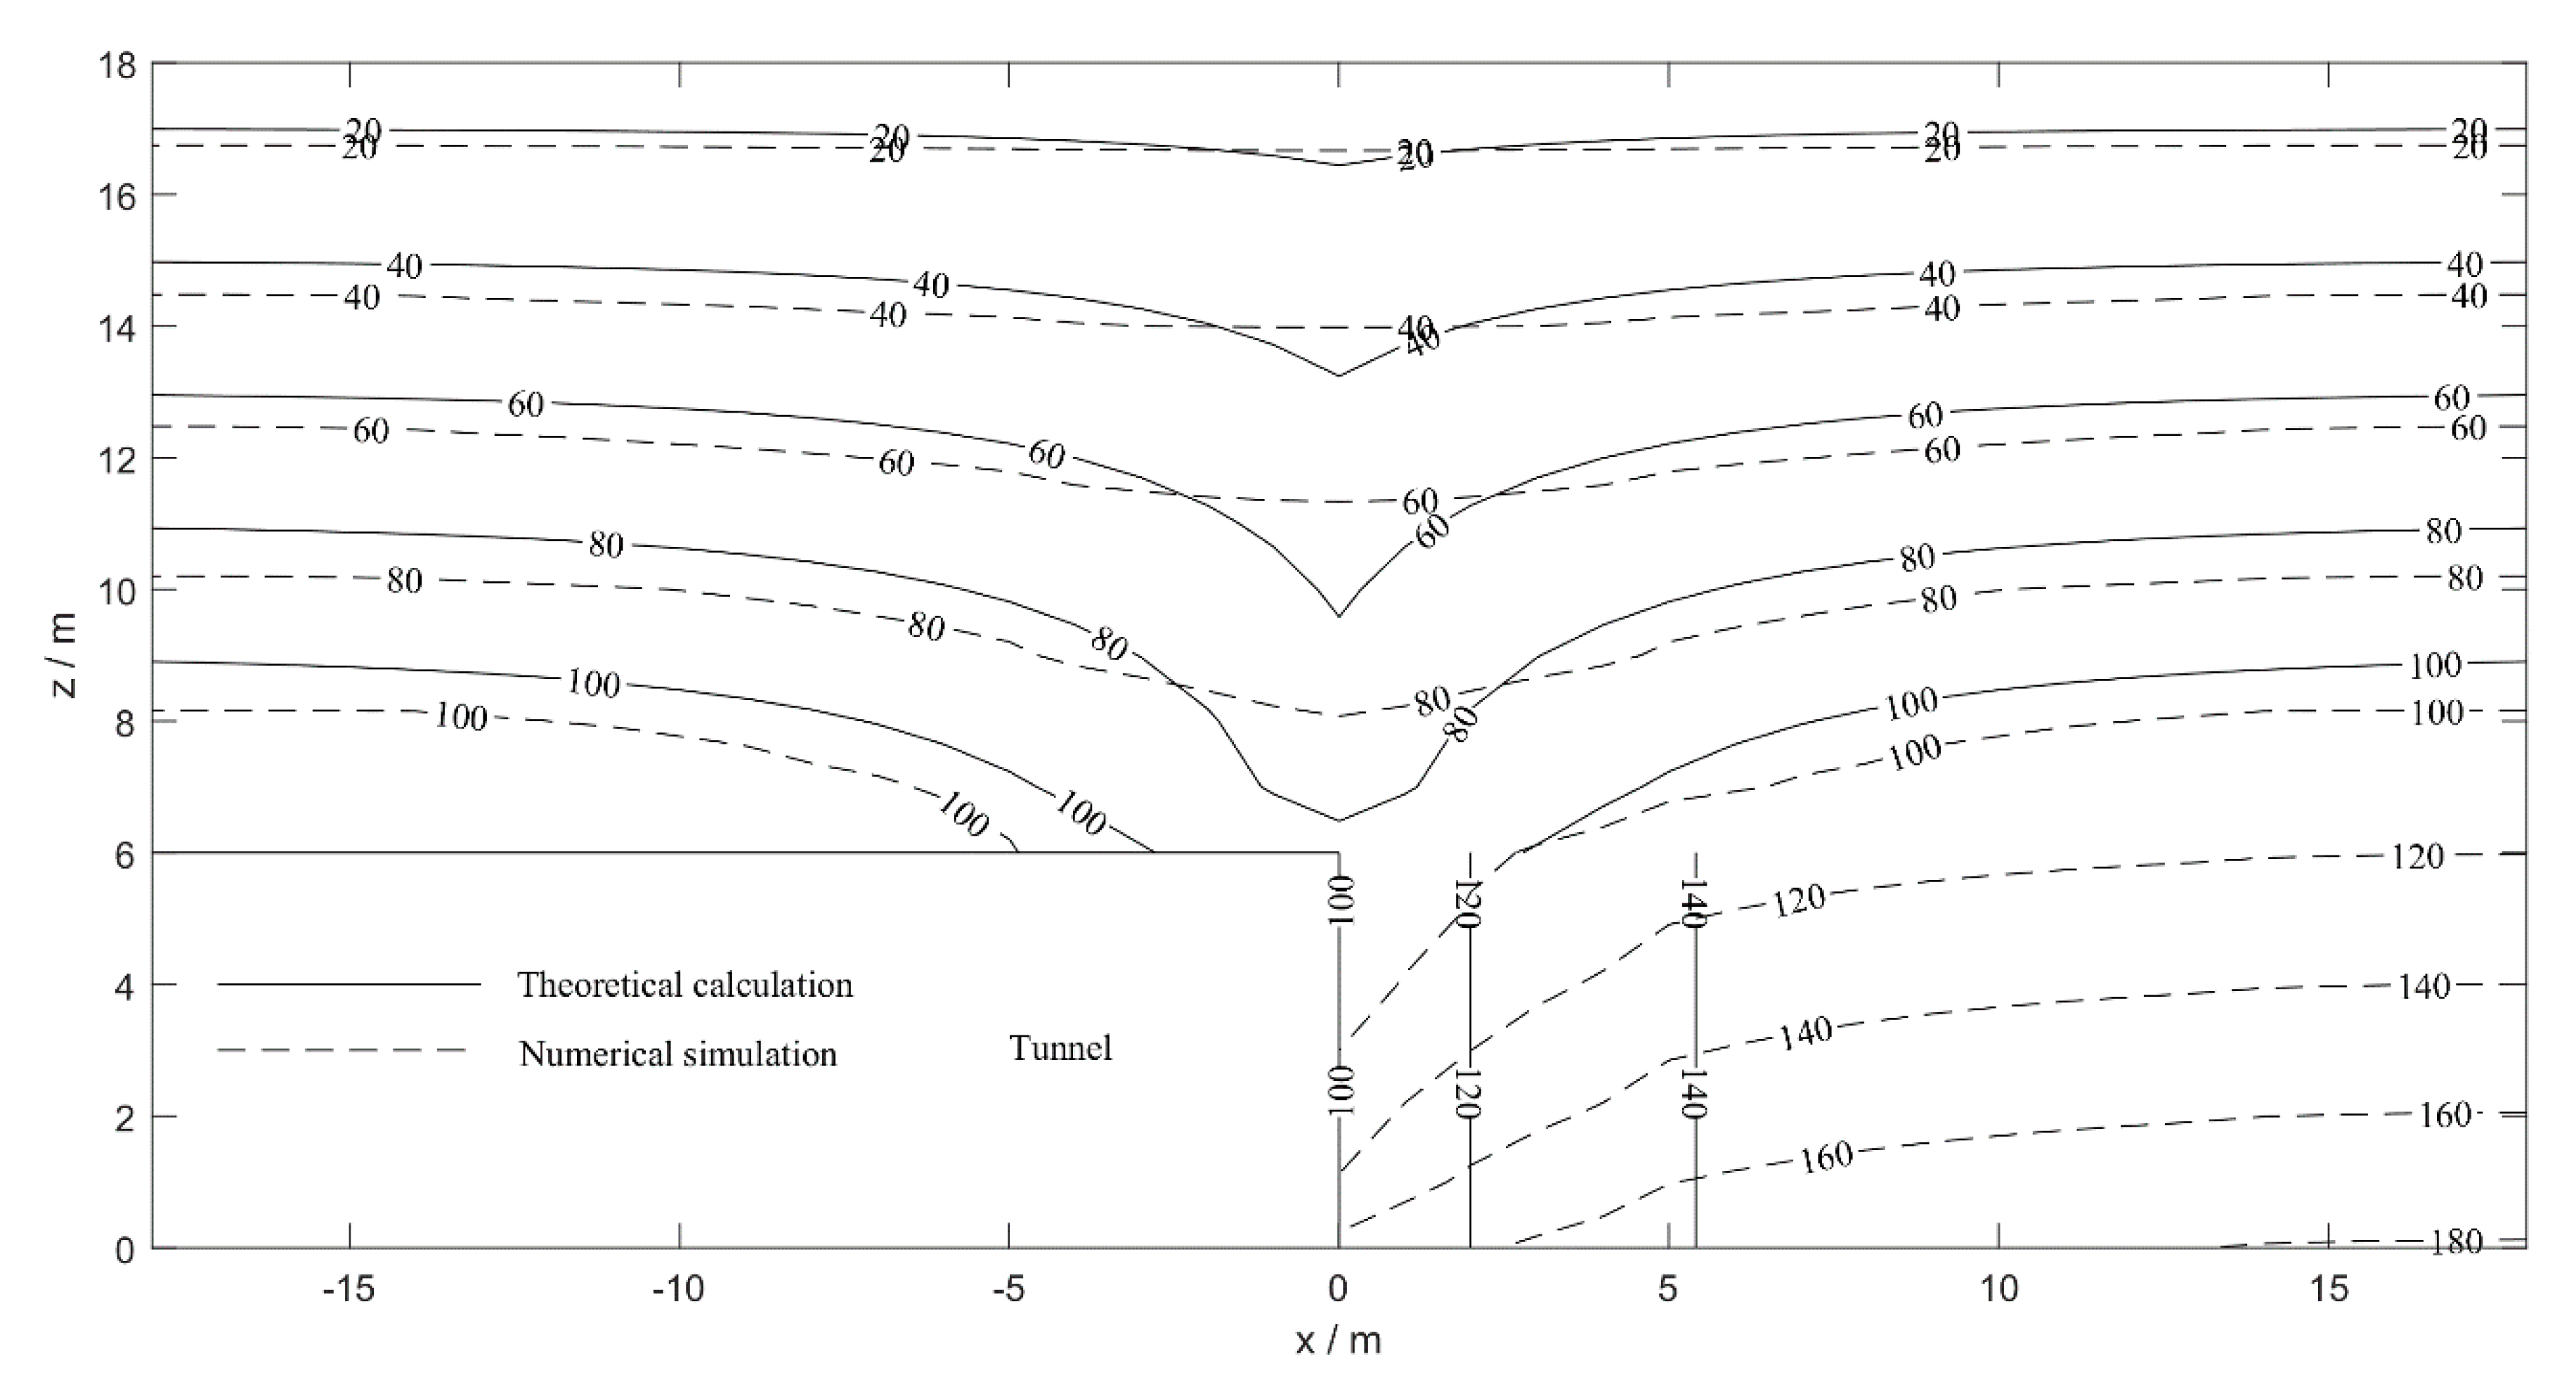
2. Three-Dimensional Analytical Solution for Pore Water Pressure Distribution
The distribution of pore water pressure is key to study of the limit support pressure of the tunnel face considering seepage by the limit equilibrium method. Figure 1 shows the seepage model of the tunnel face, where, is the cover thickness of the tunnel; is the tunnel diameter; is the hydraulic head of the tunnel face; is the hydraulic head of the ground surface; and is the hydraulic head difference between the tunnel face and the ground surface. Taking the bottom of the tunnel as the origin of the coordinates, the tunnel excavation direction is the positive x-axis direction, and the vertical upward direction is the positive z-axis direction.
Figure 1.
Seepage model of the tunnel face.
Cao et al. [17] obtained a three-dimensional solution for pore water pressure distribution in front of the tunnel face through Equations (1) and (2), but did not consider the distribution of pore water pressure behind the tunnel face. Here, is the pore water pressure; is the unit weight of water; is the equivalent height of the tunnel in this paper, .
In order to expand the above three-dimensional solution without considering the pore water pressure behind the tunnel face to the three-dimensional solution considering the pore water pressure behind the tunnel face, a numerical model, as shown in Figure 2, is established by FLAC3D software, considering the symmetry of the tunnel. Here, the diameter of the tunnel is 6 m, the thickness of the covering soil is 12 m, the top surface is free and the hydraulic head pressure is fixed at 1 m, the bottom surface and the side wall of the tunnel are fixed and impermeable, the surrounding normal direction is fixed and impermeable, the tunnel face is fixed in the normal direction, the hydraulic head difference between the tunnel face and the ground surface is fixed at 0.5, 1.0 or 2.0 , and the friction angle of the soil is 37°, 31° or 25°. Then, the distribution of pore water pressure is obtained by three-dimensional seepage calculation.
Figure 2.
Numerical model for calculating pore water pressure distribution (unit: m).
Figure 3 shows the cloud image of the pore water pressure distribution obtained by numerical simulation. According to the numerical simulation results, it is found that the pore water pressure in the front and back of the tunnel face is symmetrical. Therefore, this paper expands the three-dimensional solution for the pore water pressure distribution of Equations (1) and (2), which did not consider the pore water pressure distribution behind the tunnel face, into Equation (3), which comprehensively considers the pore water pressure distribution directly in front of the tunnel face, the upper formation in front of the tunnel face and the upper formation behind the tunnel face.

Figure 3.
Cloud image of the pore water pressure distribution. (a) The friction angle of the soil = 37°; the hydraulic head difference between the tunnel face and the ground surface = 0.5 ; (b) = 37°; = 1.0 ; (c) = 37°; = 2.0 ; (d) = 31°; = 2.0 ; (e) = 25°; = 2.0 (unit: Pa).
Figure 4 shows the distribution of pore water pressure on the vertical symmetrical plane of the tunnel obtained by numerical simulation and theoretical calculation in this paper. It can be seen from Figure 4 that the pore water pressure distribution law above the tunnel face obtained by the two methods is the same (the maximum relative error is less than 15%), both of which take the tunnel face as the symmetrical plane. Directly above the tunnel face, the pore water pressure gradient calculated by theory is obviously larger than that of the numerical simulation, which will make the seepage force in the theoretical calculation larger and make the limit support pressure of the tunnel face larger, and give the calculation result more safety. As the ground directly in front of the tunnel face is mainly affected by the horizontal seepage force [18], the pore water pressure on the central axis of the tunnel represents the pore water pressure on the ground directly in front of the tunnel face. According to the distribution of pore water pressure on the central axis of the tunnel in Figure 4, the theoretical calculation is basically consistent with the numerical simulation results. Based on the above analysis, it is safe to apply the pore water pressure calculated according to Equation (3) to calculation of the limit support pressure of the tunnel face.
Figure 4.
Pore water pressure distribution ( = 37°; = 1.0 ; unit: kPa).
3. Limit Support Pressure of the Tunnel Face Considering the Influence of Seepage
In this section, firstly, according to the physical model tests of Mi and Xiang [3], a failure model considering the failure range behind the tunnel face is established, then the newly established three-dimensional solution for the pore water pressure is introduced into the model, and, finally, the limit support pressure of the tunnel face is solved by the limit equilibrium method.
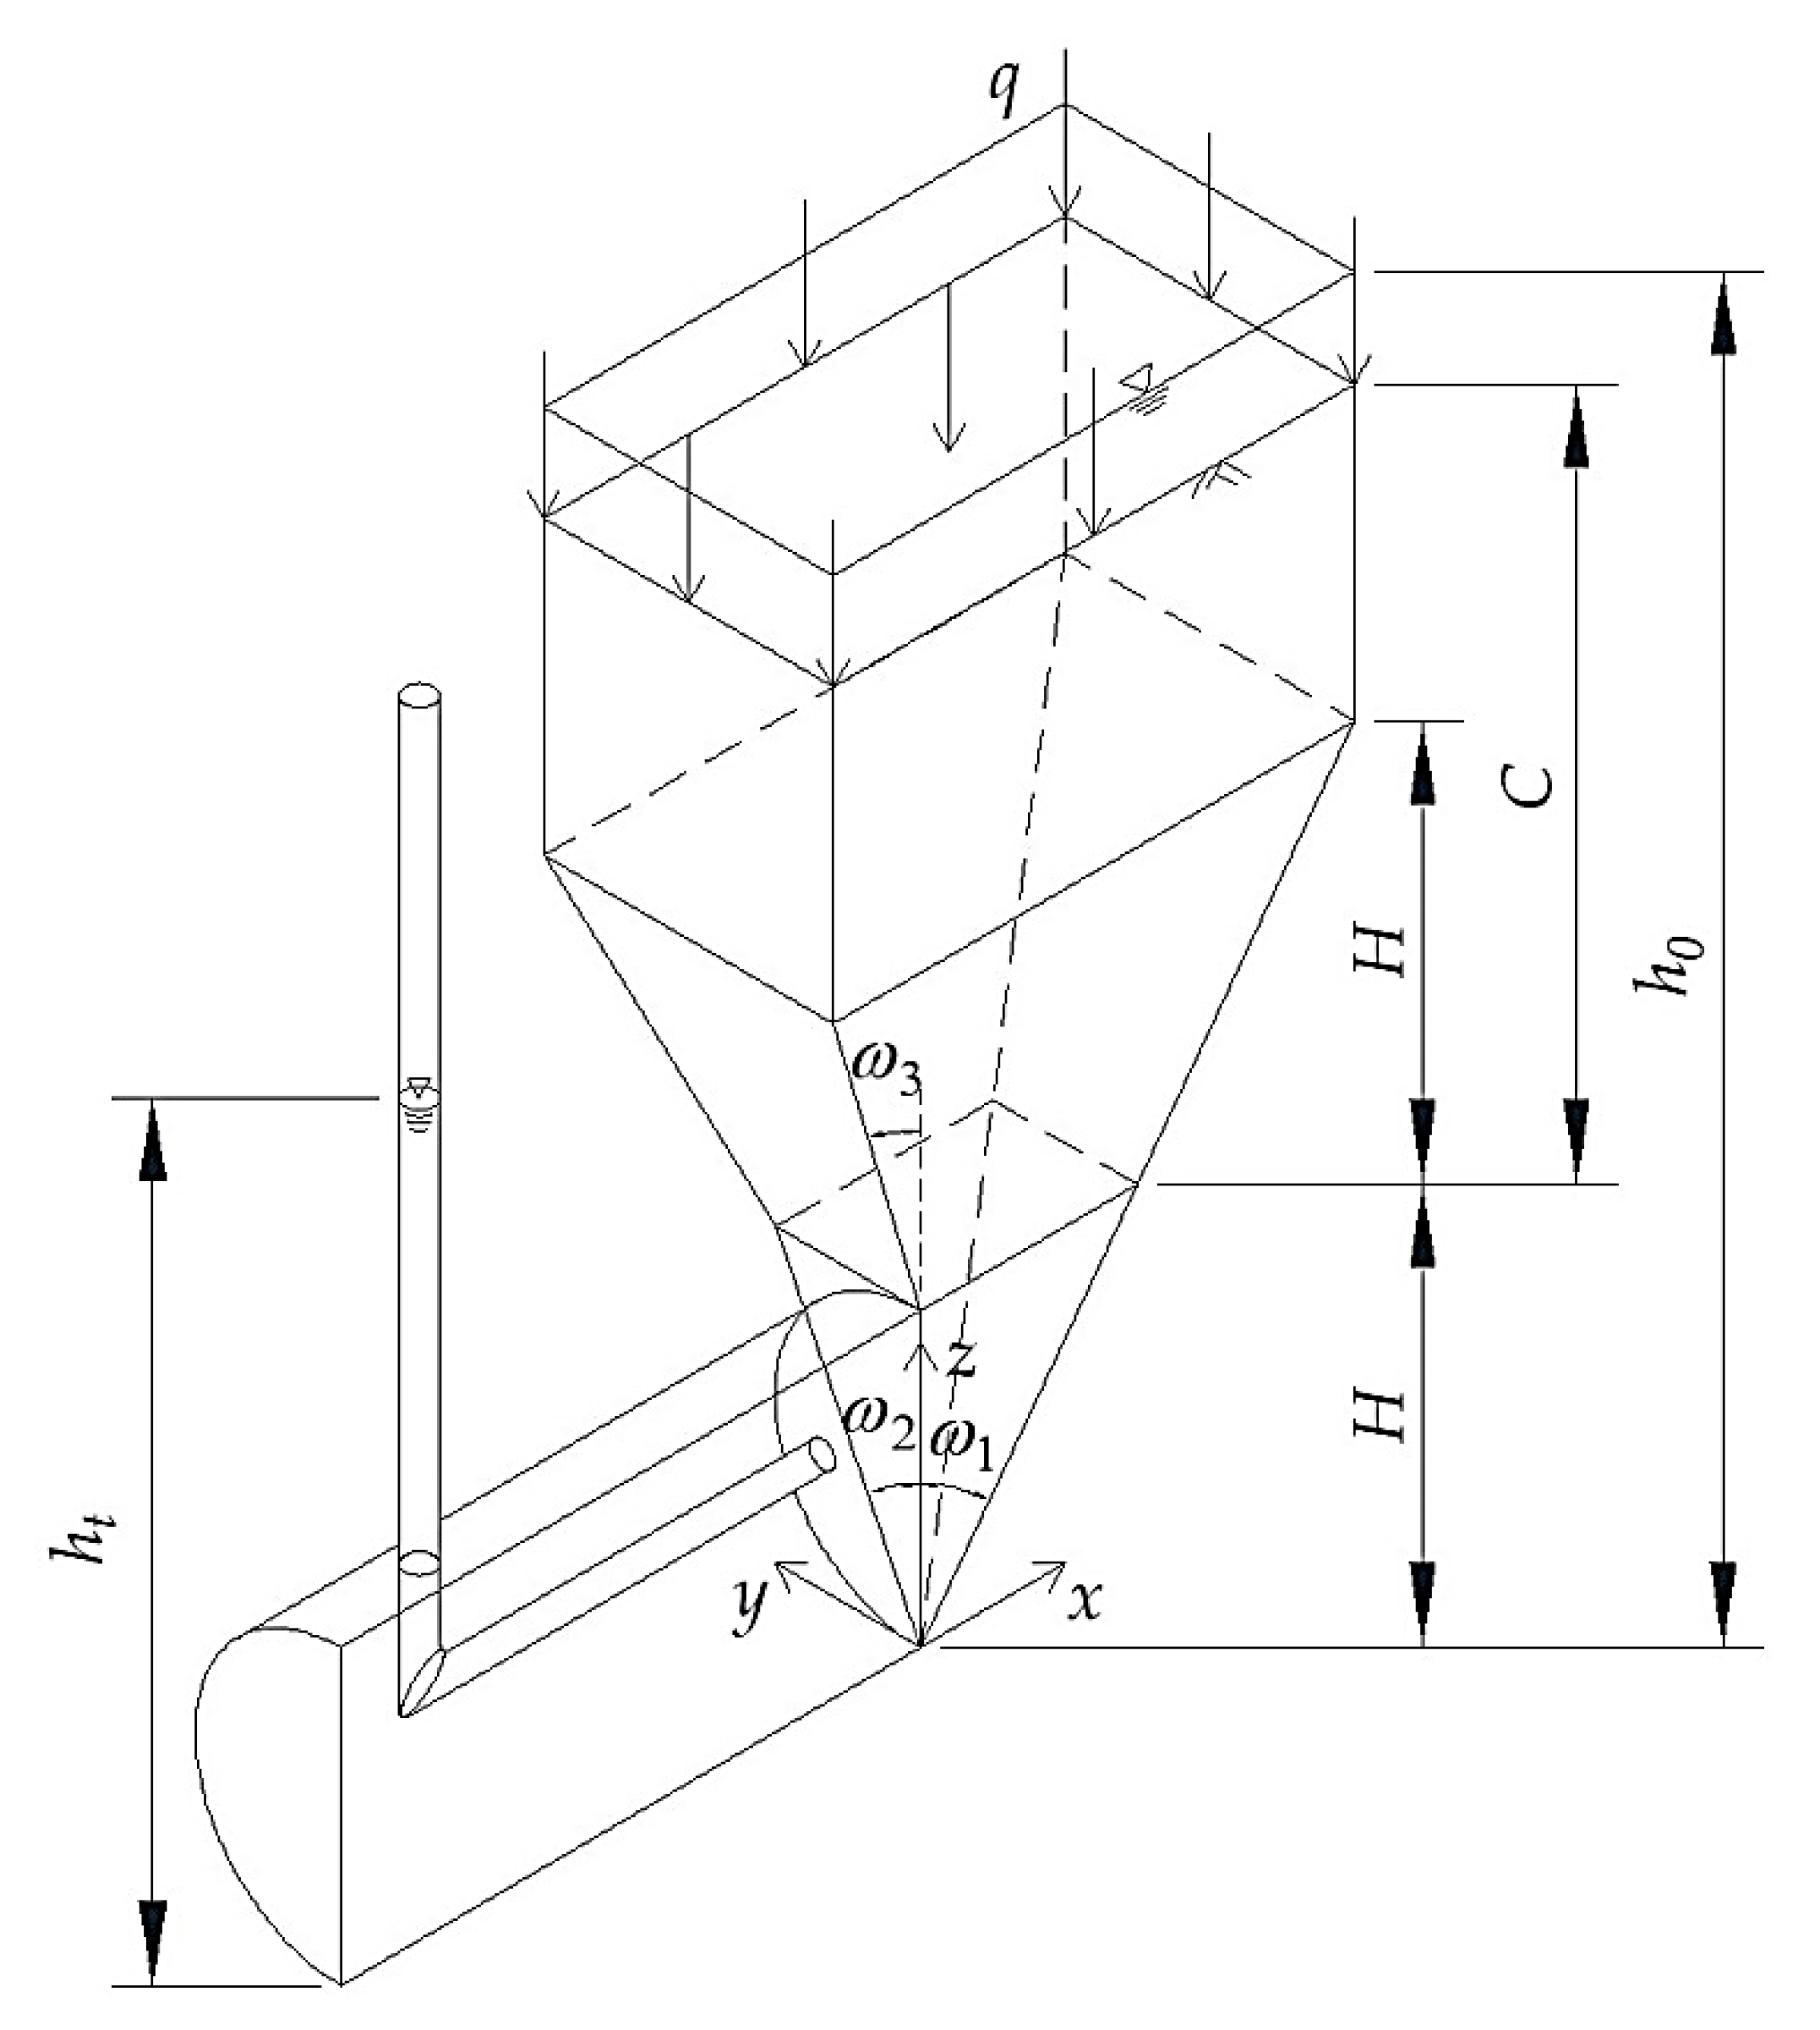
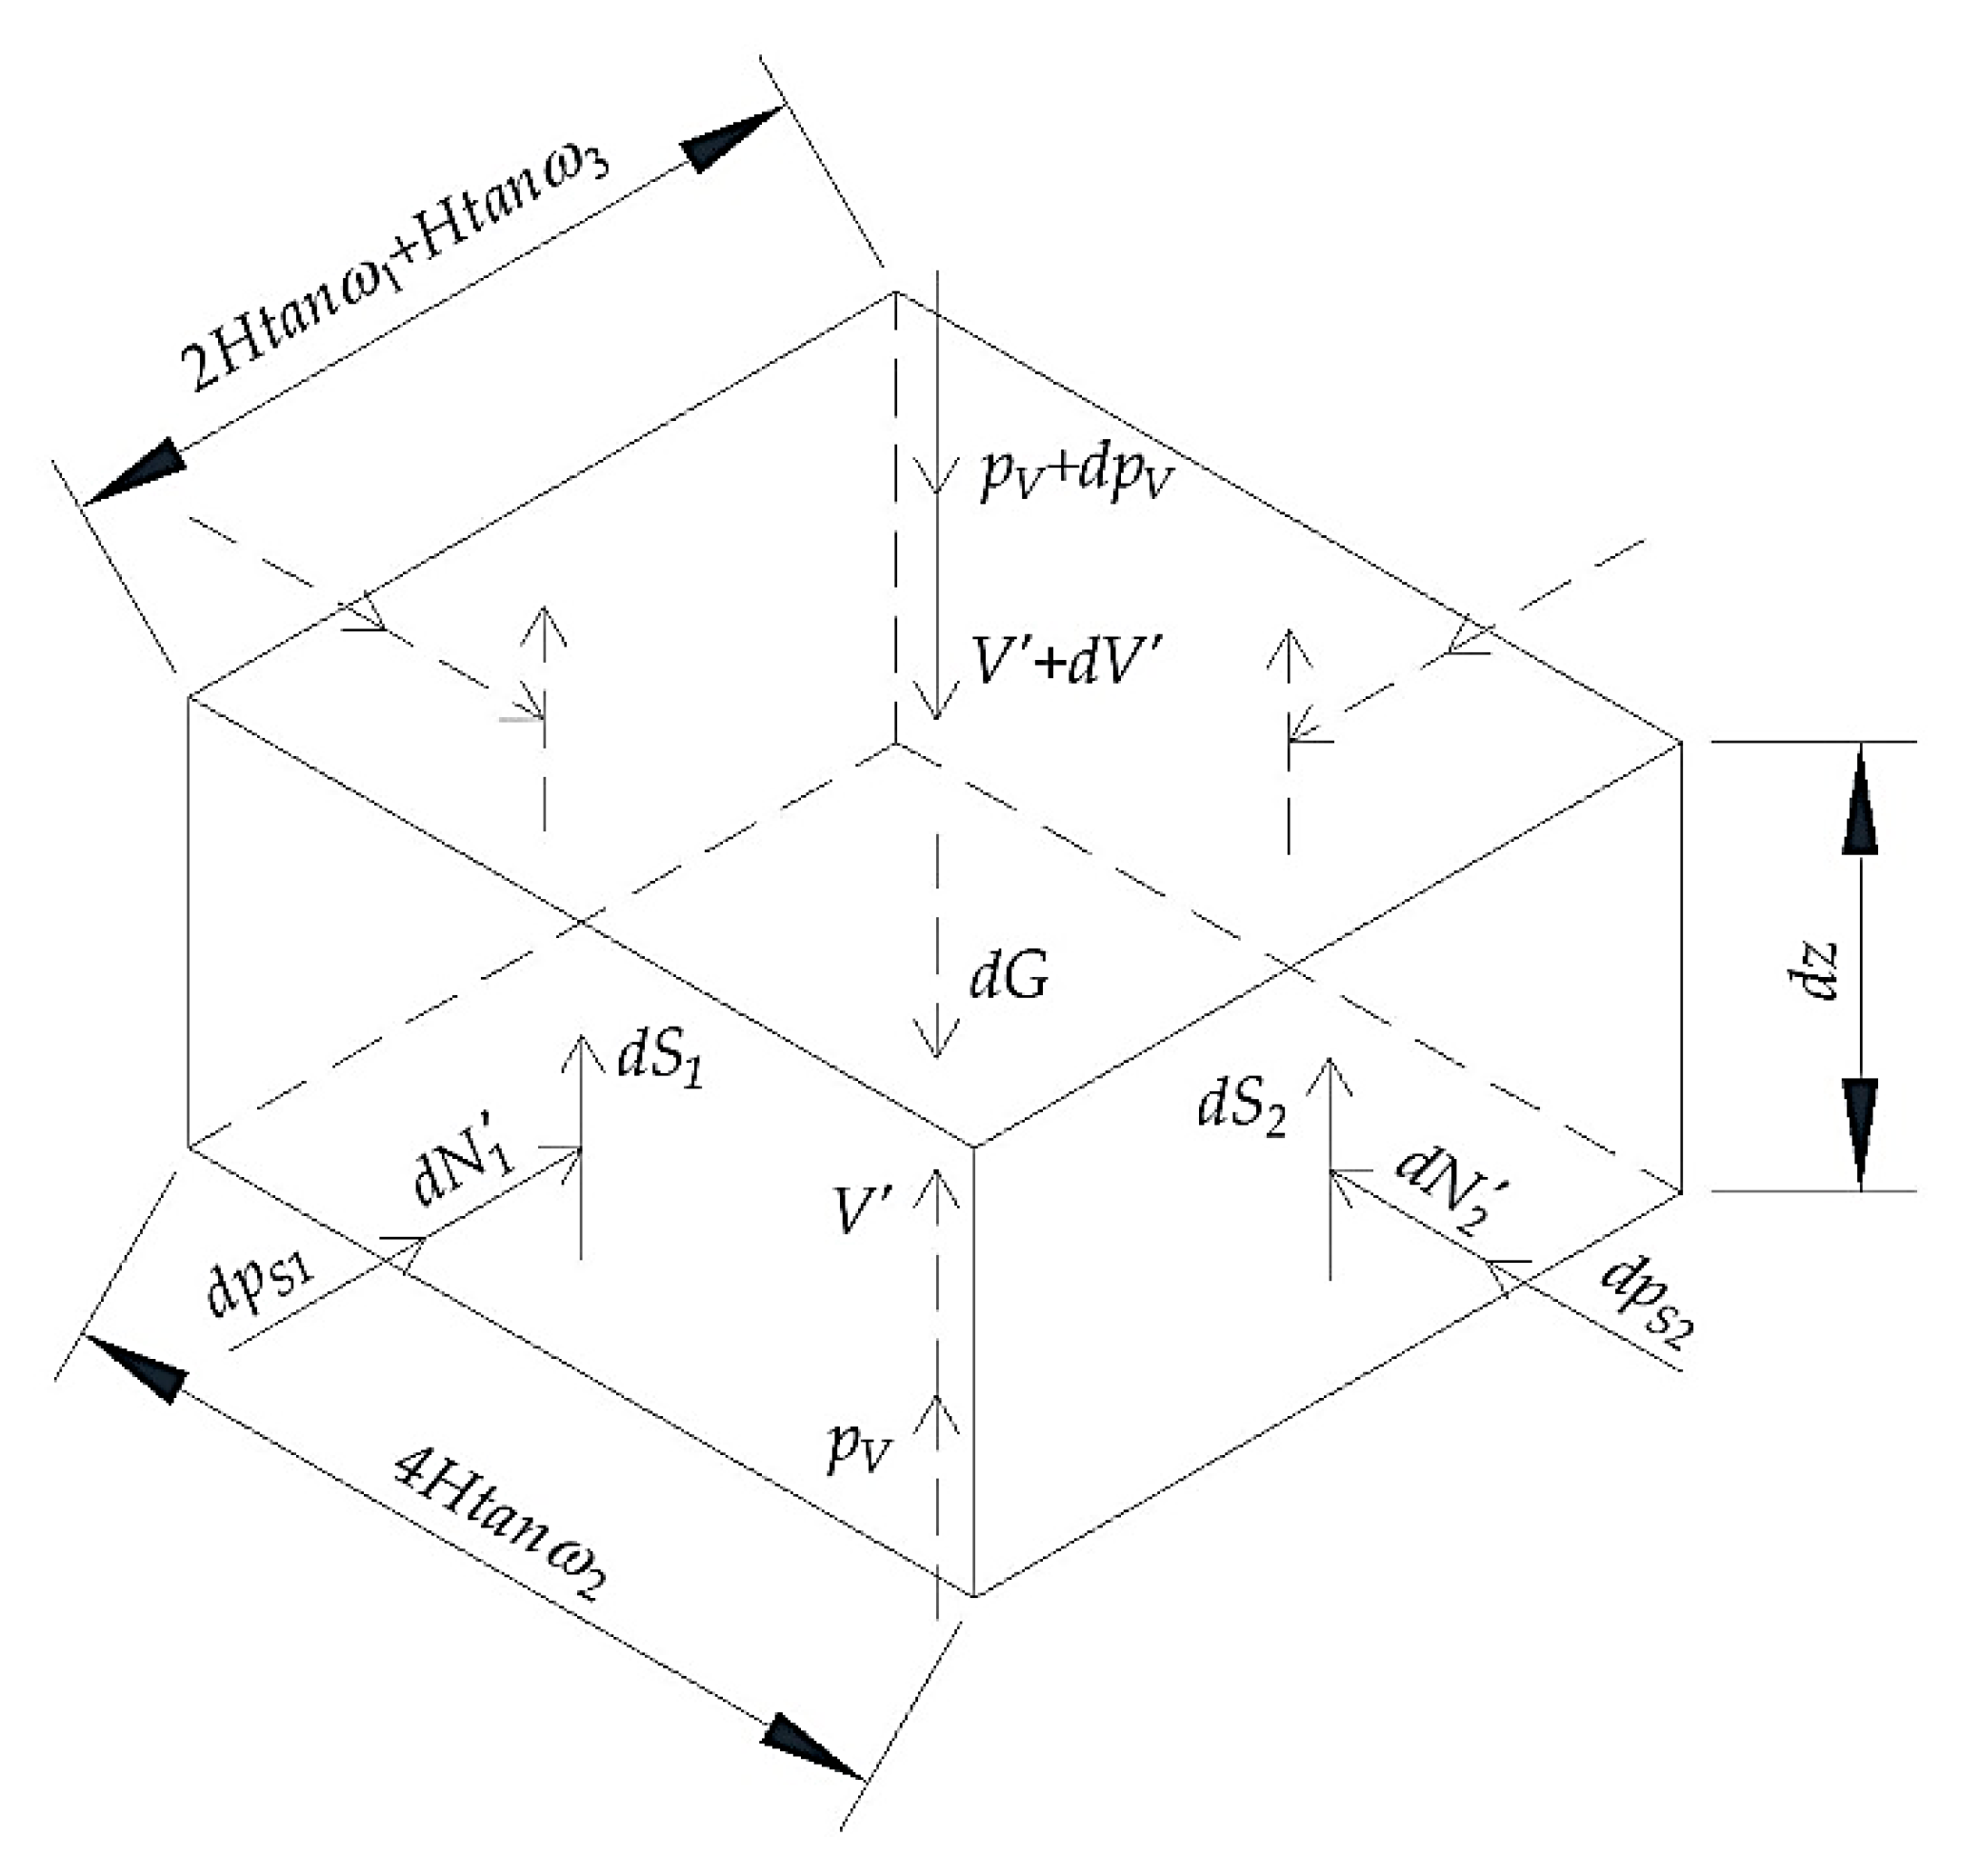
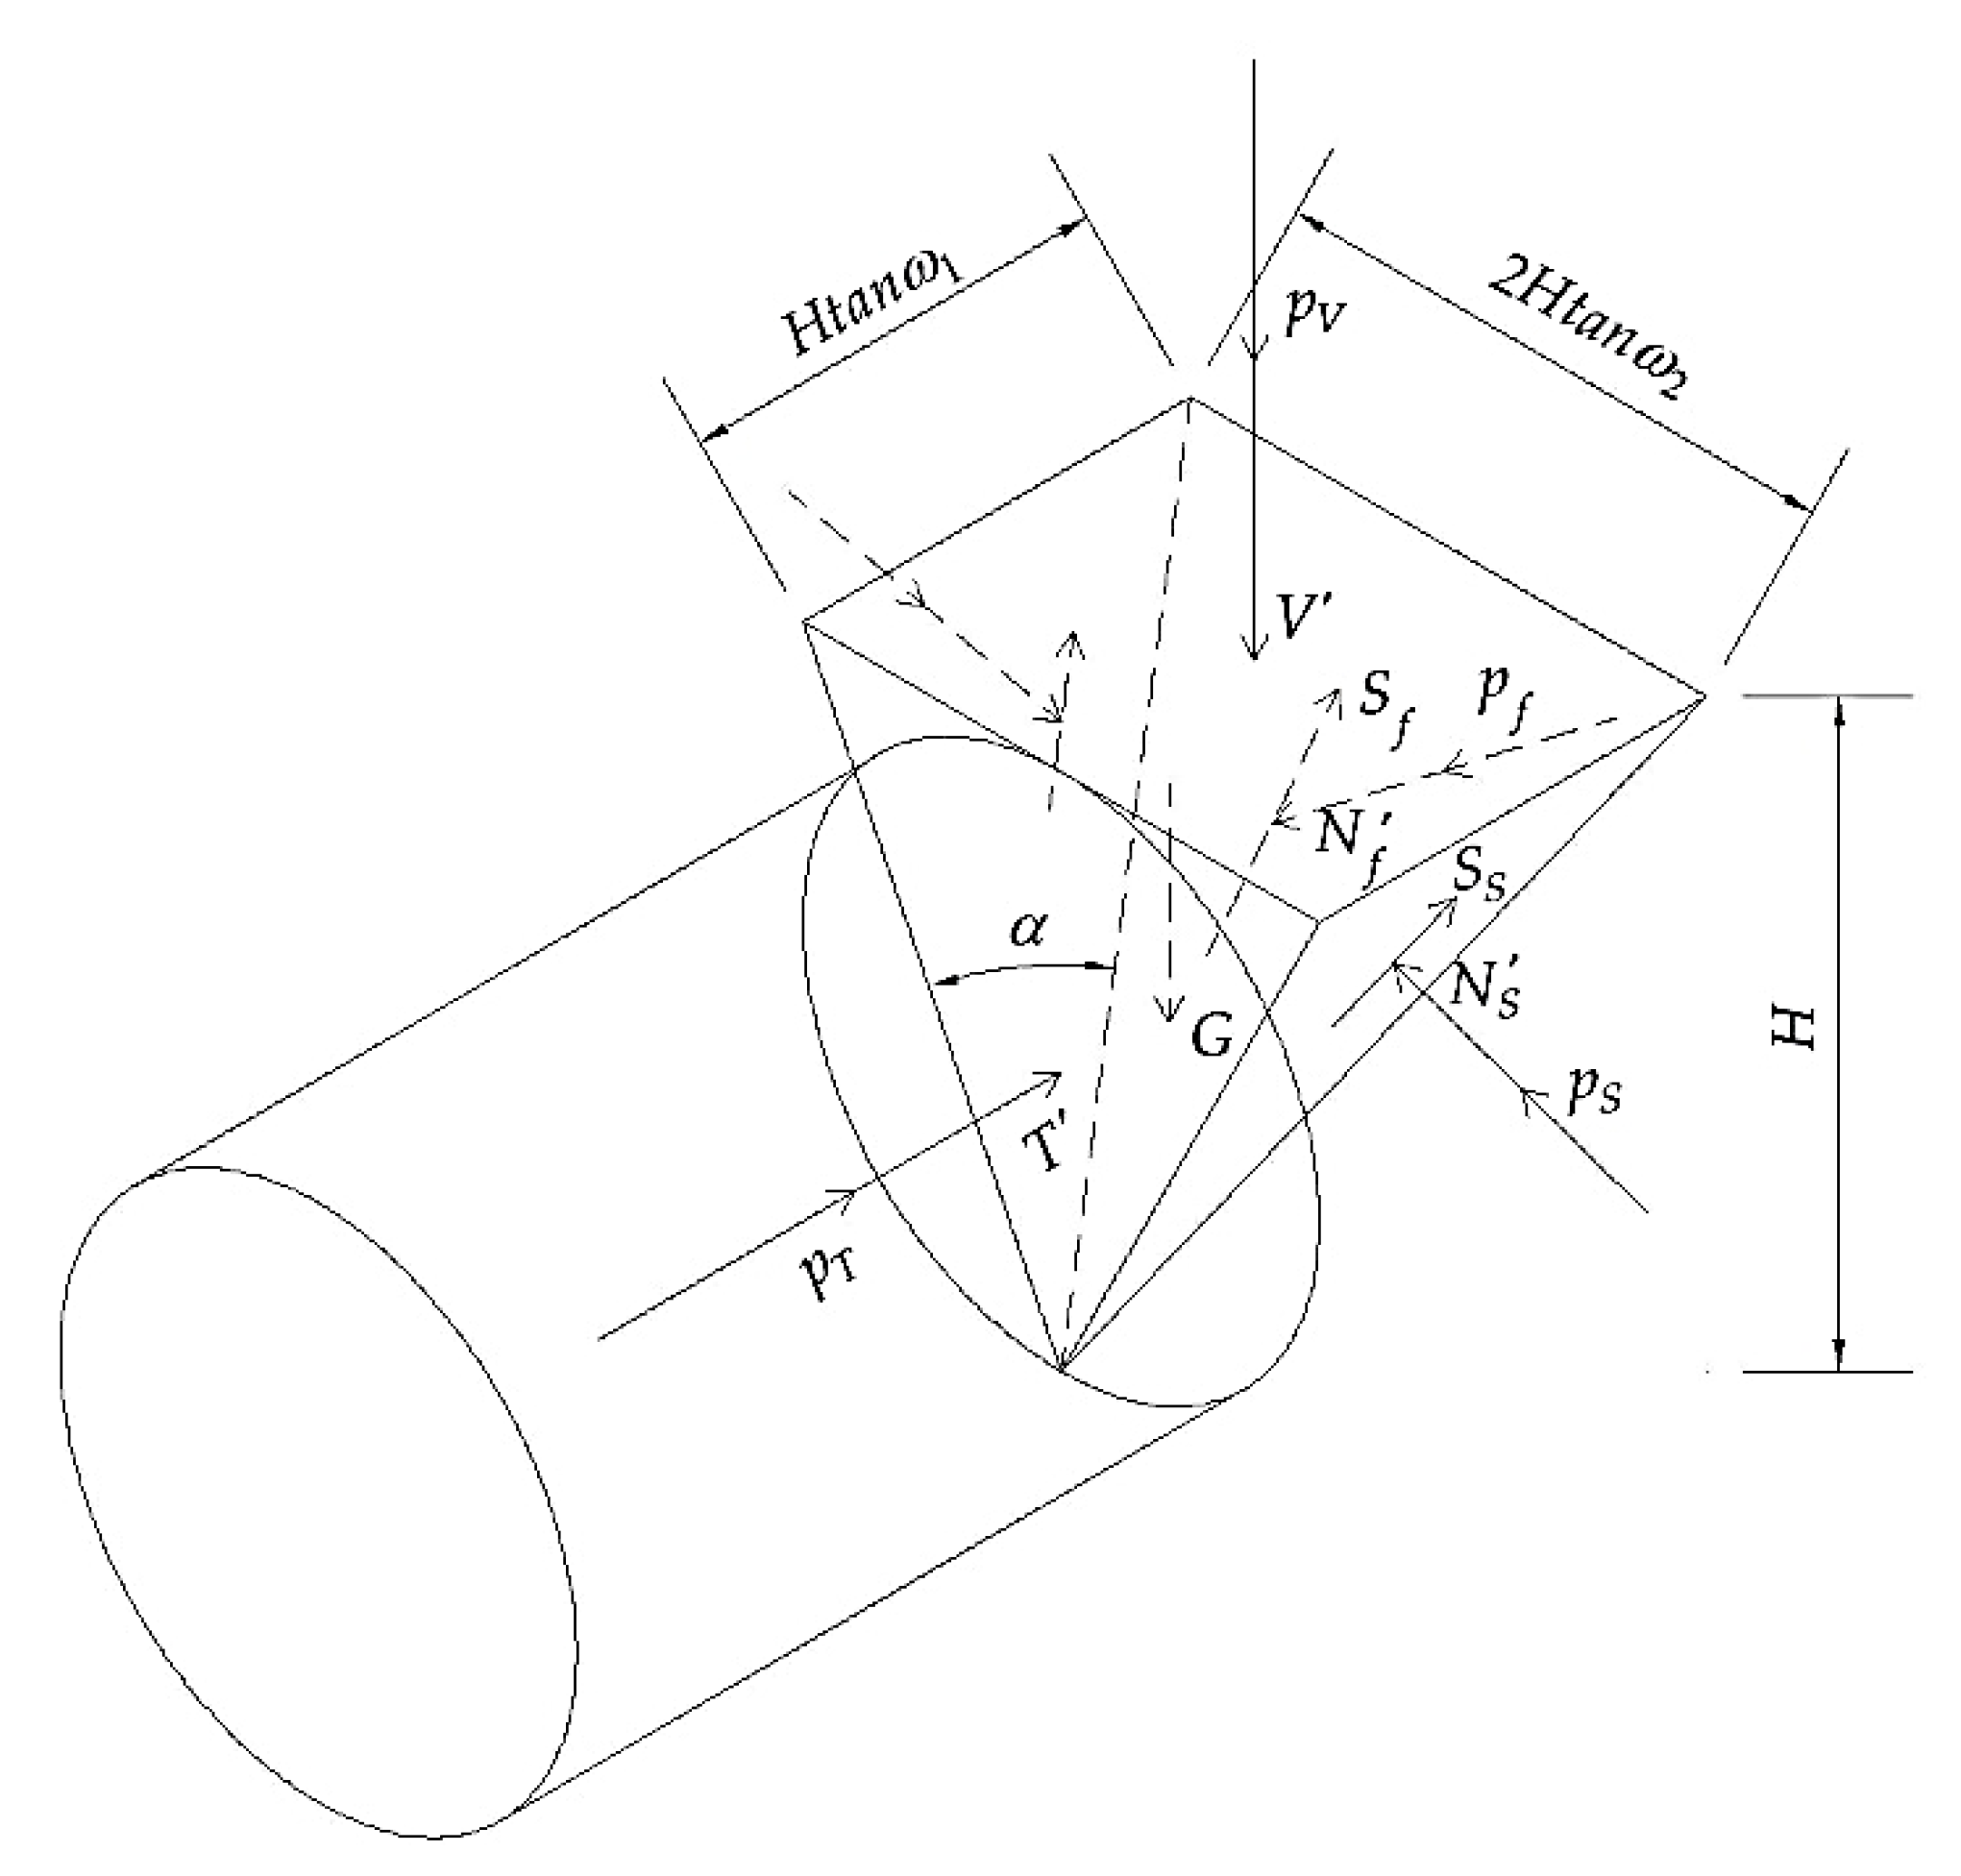
3.1. Establishment of the Failure Model
Figure 5 shows the test model of excavation-seepage instability of the shield tunnel established by Mi and Xiang [3]. Different seepage fields are generated by regulating the pump switch. By rotating the runner of the tunnel model, the support plate moves backward gradually until the ground is unstable and damaged. In the process of the support plate moving backward, the ground settlement and the support pressure of the tunnel face are monitored. Based on analysis of the monitoring data, the ground collapse range and the limit support pressure of the tunnel face are obtained.
Figure 5.
Test model of excavation-seepage instability of the shield tunnel [3].
Figure 6 shows the ground collapse range of the vertical symmetry plane in the center of the tunnel and the plane in front of the tunnel face under different seepage conditions based on the physical model tests of Mi and Xiang [3]. Here, is the hydraulic head difference between the tunnel face and the ground surface and is the tunnel diameter. It can be seen from Figure 6 that when the support pressure of the tunnel face is not enough, the ground in front and behind the tunnel face will lose stability within a certain range. The collapse range boundary in front of the tunnel face extends from the bottom of the tunnel to the upper part of the tunnel at a certain angle and reaches a certain height, and then extends vertically to the ground surface. The collapse range boundary behind the tunnel face extends from the top of the tunnel to the rear and up at a certain angle and reaches a certain height, then extends vertically upward to the ground surface. The horizontal collapse range boundary extends from the bottom of the tunnel to the upper side at a certain angle and reaches a certain height, then extends to the ground surface vertically.
Figure 6.
The ground collapse range of the vertical symmetry plane in the center of the tunnel and the plane in front of the tunnel face [3].
According to the ground collapse range in Figure 6, considering the symmetry of the tunnel, a failure model considering the influence of seepage, as shown in Figure 7, is established. This model consists of three parts: a pyramid, a prismoid and a prism from bottom to top. Here, is the equivalent height of the tunnel (in this paper, ); is the cover thickness of the tunnel; is the hydraulic head of the ground surface; is the hydraulic head of the tunnel face; is the additional pressure on the ground surface; is the break angle in front of the tunnel face; is the horizontal break angle; is the break angle behind the tunnel face.
Figure 7.
Pyramid–prismoid–prism failure model considering seepage.
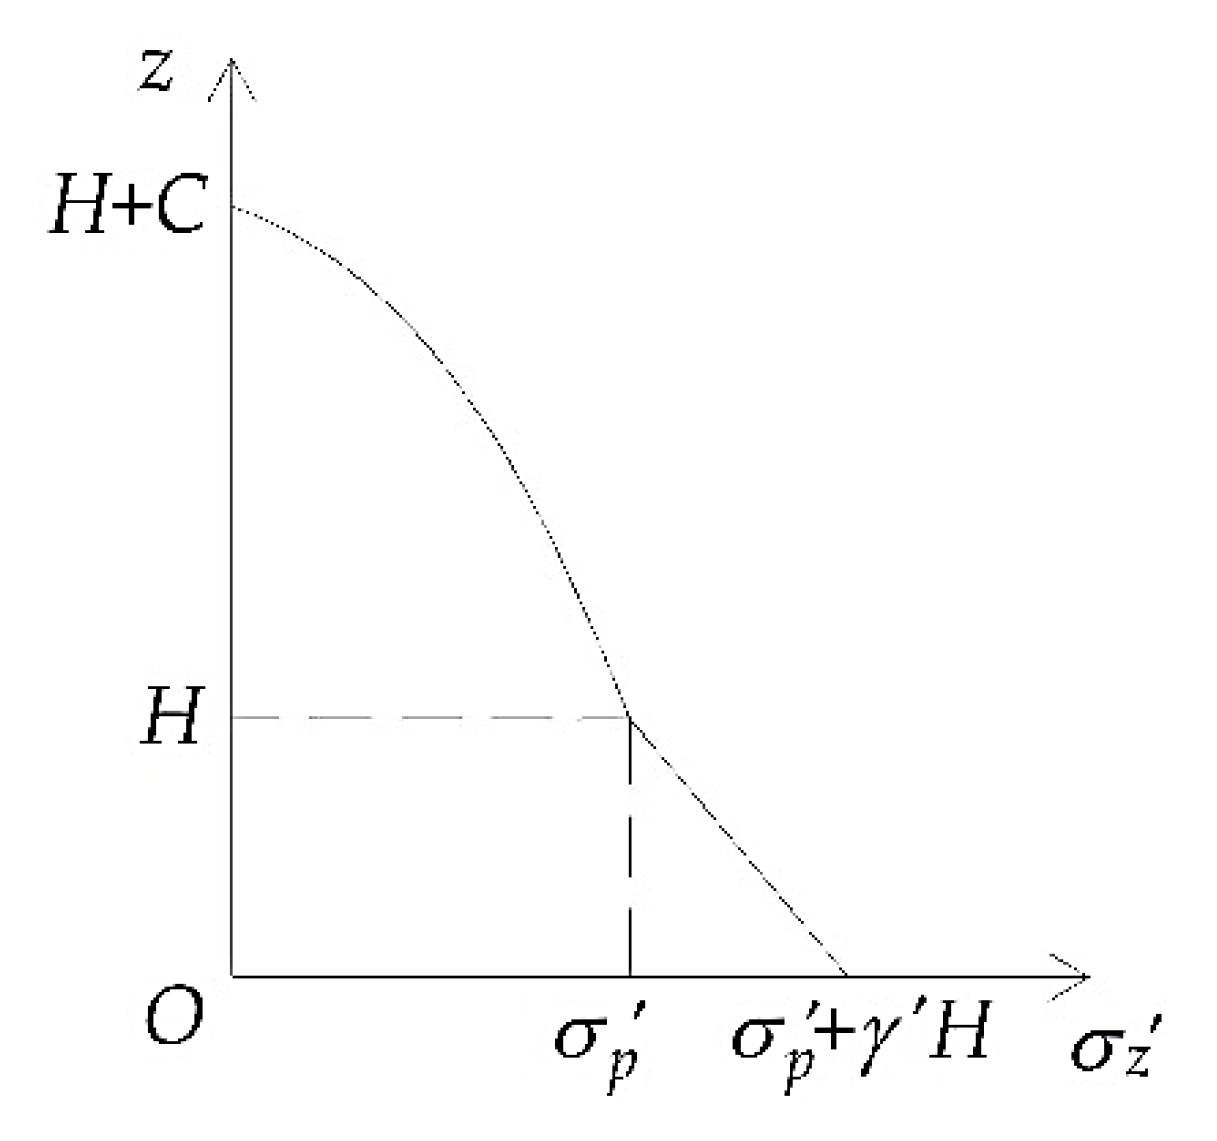
3.2. Calculation of the Limit Support Pressure of the Tunnel Face
It is assumed that the soil in front of and behind the tunnel face is uniform and obeys the Mohr–Coulomb failure criterion. Considering that the divided calculation of water and soil needs to solve the seepage force, the process of solution is rather complicated, so this paper uses the method of soil–water joint calculation to analyze the stress of the failure model.
Figure 8 shows the stress state of the prism micro-element, where, and are the water pressure on the two sides of the prism micro-element, respectively; and are the normal effective pressure on the two sides of the prism micro-element, respectively. From the static equilibrium conditions of the prism micro-elements in the vertical direction, it can be obtained that
where is the vertical effective pressure increment of the prism micro-element;
where is the average vertical effective compressive stress on the plane of the prism; is the vertical water pressure increment of the prism micro-element;
where is the average water pressure on the plane of the prism; is the gravity of the prism micro-element,
where is the saturated weight of the soil; is the friction resistance on the front and back sides of the prism micro-element,
where is the cohesion of the soil; is the pressure coefficient (in this paper, ); is the friction angle of soil; is the friction resistance on the left and right sides of the prism micro-element:
Figure 8.
The stress state of the prism micro-element (soil–water joint calculation).
Substituting Equations (5)–(9) into Equation (4) and combining the surface boundary conditions and , the vertical effective compressive stress of the prism can be obtained,
where is the area-perimeter ratio of the cross-section of the prism,
In order to simplify the calculation, it is assumed that the vertical effective compressive stress in the prismoid continues the change rule in the prism; that is, within the range , the vertical effective compressive stress can be obtained by Equation (10). When , the vertical effective compressive stress of the interface between the prismoid and the pyramid can be obtained, that is, .
Figure 9 shows the stress state of the whole pyramid. According to the static equilibrium conditions in the and directions of the pyramid, it can be obtained that
where is the normal effective pressure on the slope in front of the pyramid; is the friction resistance on the slope in front of the pyramid. The relationship between them is as follows:
Figure 9.
The stress state of the whole pyramid (soil–water joint calculation).
Substitute Equation (14) into Equations (12) and (13), respectively, and eliminate simultaneously to obtain the effective support pressure of the tunnel face ,
where is the angle between two side edges of the pyramid,
is the vertical effective pressure on the top surface of the pyramid,
is the water pressure on the top surface of the pyramid,
is the gravity of the pyramid,
is the friction resistance on both sides of the pyramid,
where is the normal pressure on both sides of the pyramid. Assuming that the pyramid adopts the vertical stress distribution form of gravity mode, as shown in Figure 10 ( in the figure is the effective gravity of the soil), then,
where is the water gravity.
Figure 10.
The vertical stress distribution form of gravity mode.
is the water pressure on both sides of the pyramid,
is the water pressure on the slope in front of the pyramid,
is the water pressure on the front of the pyramid,
By substituting Equations (16)–(24) into Equation (15), the effective support pressure of the tunnel face can be obtained, then the effective support pressure stress of the tunnel face can be obtained,
It can be seen in Figure 3 that the break angle behind the tunnel face, , does not change much and can be approximately taken as . Through the optimization calculation, it is determined that and make the maximum value , and is the limit effective support pressure stress of the tunnel face considering the influence of seepage.
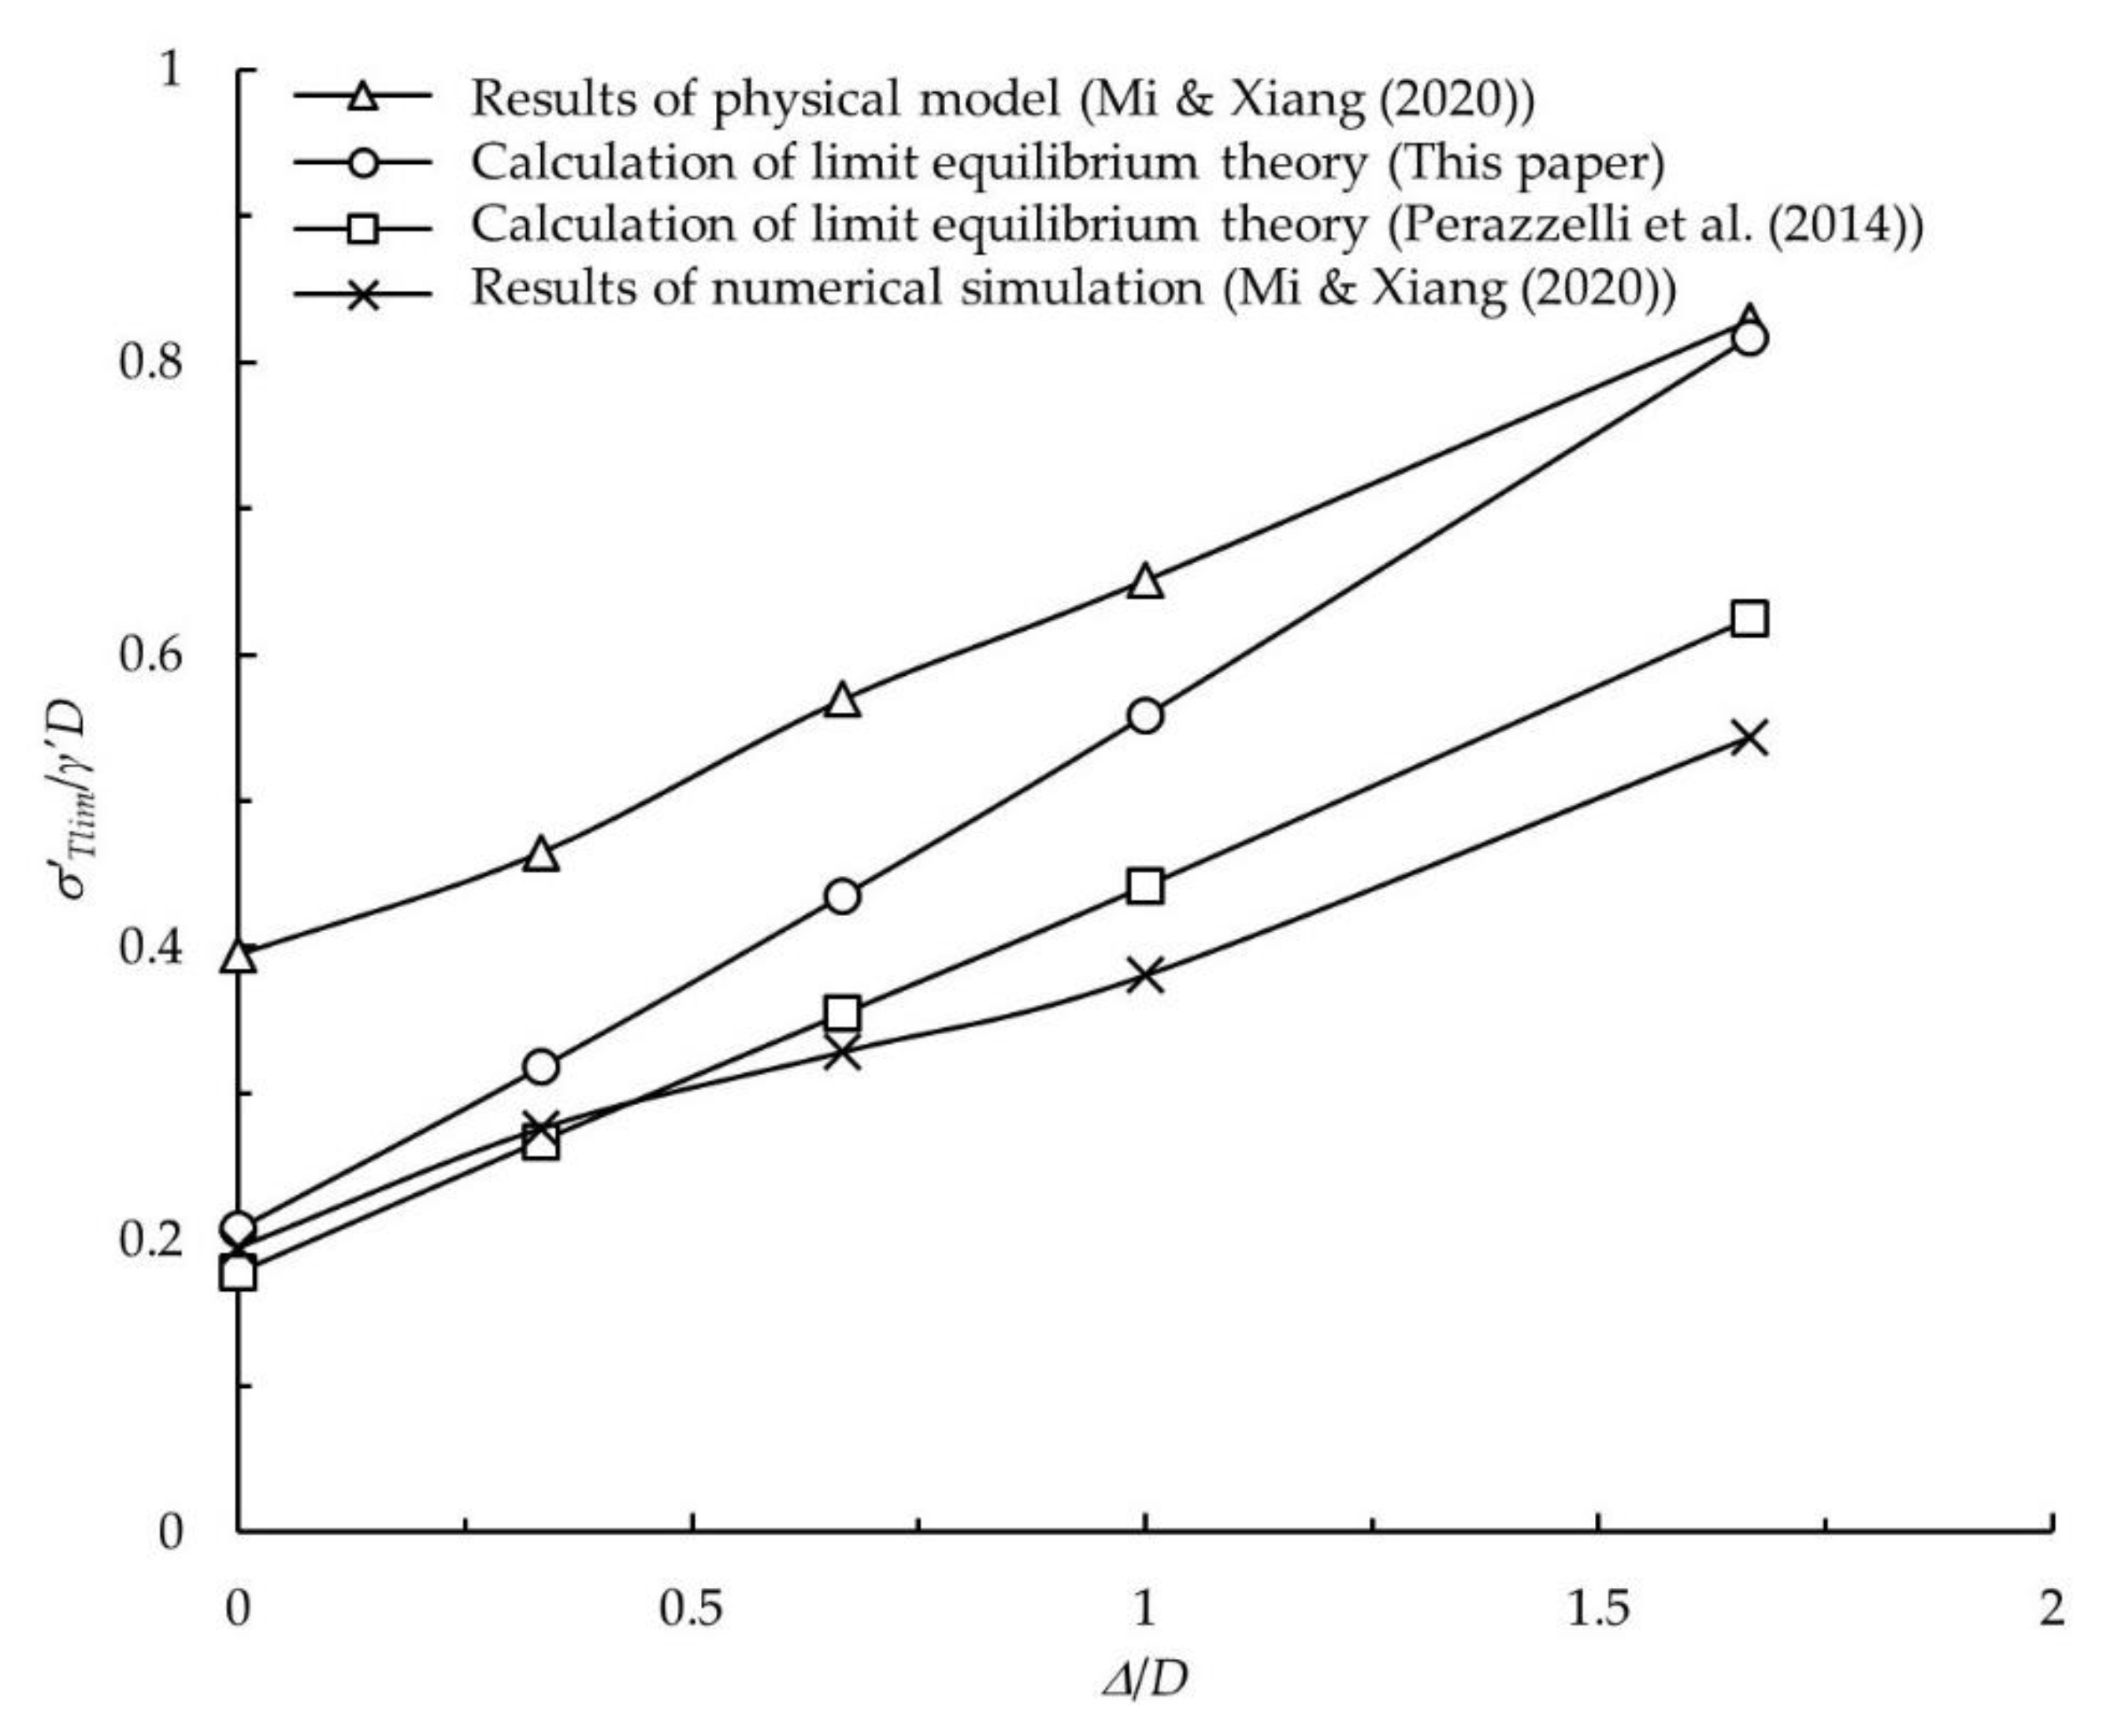
4. Comparative Analysis of the Limit Effective Support Pressure of the Tunnel Face Obtained by Different Methods
In order to verify the correctness of the theoretical solution for the limit equilibrium in this paper, the physical model test parameters of Mi and Xiang [3] are used for calculation, and the calculation results are compared with the physical model test results [3], the existing theoretical calculation results of the limit equilibrium [11] and the numerical simulation results [3], respectively. The diameter of the tunnel is 0.3 m; the covering thickness is 0.6 m; the hydraulic head of ground surface is 1.0 m; the hydraulic head of the tunnel face is 1.0, 0.9, 0.8, 0.7 or 0.5 m; the saturated weight of soil is 21.2 kN/m3; the friction angle of the soil is 37°; the cohesion of the soil is 0; the additional pressure on the ground surface is 0.
Figure 11 shows the limit effective support pressure of the tunnel face under different seepage conditions obtained by different methods, where is the hydraulic head difference between the tunnel face and the ground surface. It can be seen that there is a linear relationship between the limit effective support pressure and the hydraulic head difference , that is, will increase linearly with the increase in . The theoretical calculation results of the limit equilibrium in this paper are obviously larger than those of Perazzelli et al. [11] and the numerical simulation results of Mi and Xiang [3], which are closer to the physical model test results of Mi and Xiang [3]. The larger the hydraulic head difference is, the closer the prediction result calculated in this paper is to the actual test result. The theoretical model of limit equilibrium established in this paper can better predict the limit effective support pressure of the tunnel face considering seepage and can provide a reference for practical engineering.
Figure 11.
Comparison of the limit effective support pressure of the tunnel face under seepage conditions obtained by different methods.
5. Conclusions
The objective was to study the limit support pressure of a tunnel face in saturated sandy soil under seepage conditions. Firstly, according to the numerical simulation results, the existing three-dimensional analytical solution for the pore water pressure distribution not considering the distribution of pore water pressure behind the tunnel face is extended to the three-dimensional solution considering the distribution behind the tunnel face. Secondly, based on the results of the physical model tests, a failure model considering the failure range behind the tunnel face was established, and the newly established three-dimensional pore water pressure solution was introduced into the model to obtain the limit support pressure of the tunnel face with the method of soil–water joint calculation. Finally, the calculation results were compared with the experimental results, numerical simulation results and existing theoretical solutions. The main conclusions are as follows.
(1) The distribution of pore water pressure in the front and back strata above the tunnel face is basically symmetrical.
(2) When the support pressure of the tunnel face is not enough, both the ground in front and that behind the tunnel face will lose stability within a certain range. Therefore, when establishing the failure model, the failure range of the ground directly in front of the tunnel face, the upper formation in front of the tunnel face, and the upper formation behind the tunnel face should be considered comprehensively.
(3) The limit effective support pressure of the tunnel face will increase linearly with the increase in the hydraulic head difference between the tunnel face and the ground surface.
(4) The calculated results in the new limit equilibrium theory are obviously larger than those in the existing theory and numerical simulation and are closer to the results of the physical model tests. Therefore, the new limit equilibrium model can better predict the limit effective support pressure of the tunnel face considering seepage and provide a reference for practical engineering.
It is worth noting that the ground studied in this paper is sandy soil, and the limit effective support pressure of the tunnel face for cohesive soil needs further study.
Author Contributions
B.M. and Y.X. contributed equally to this work. All authors have read and agreed to the published version of the manuscript.
Funding
This research was funded by the Fundamental Research Funds for the Central Universities of China. (No. 2017YJS148).
Acknowledgments
The authors are deeply thankful to the reviewers and editor for their valuable suggestions to improve the quality of the paper.
Conflicts of Interest
The authors declare no conflict of interest.
References
- Chen, R.; Yin, X.; Tang, L.; Chen, Y.-M. Centrifugal model tests of tunneling face failure under seepage flow. Rock Soil Mech. 2015, 36, 225–229. [Google Scholar]
- Lü, X.; Zhou, Y.; Huang, M.; Zeng, S. Experimental study of the face stability of shield tunnel in sands under seepage condition. Tunn. Undergr. Space Technol. 2018, 74, 195–205. [Google Scholar] [CrossRef]
- Mi, B.; Xiang, Y. Model test and calculation analysis of excavation-seepage stability for shallow shield tunneling in sandy ground. Rock Soil Mech. 2020, 41, 837–848. [Google Scholar]
- Kim, S.H.; Tonon, F. Face stability and required support pressure for TBM driven tunnels with ideal face membrane–Drained case. Tunn. Undergr. Space Technol. 2010, 25, 526–542. [Google Scholar] [CrossRef]
- Lü, X.; Zhou, Y.; Li, F. Centrifuge model test and numerical simulation of stability of excavation face of shield tunnel in silty sand. Rock Soil Mech. 2016, 11, 3324–3335. [Google Scholar]
- Zheng, J.; Lü, X.; Li, F. Numerical Simulation for Stability of Excavated Surface of Shield Tunnels under Water Level Condition. Technol. Highw. Transp. 2014, 3, 86–89. [Google Scholar]
- Lee, I.M.; Nam, S.W.; Ahn, J.H. Effect of seepage forces on tunnel face stability. Can. Geotech. J. 2003, 40, 342–350. [Google Scholar] [CrossRef]
- Wang, H.; Huang, M.; Lü, X. Upper-bound limit analysis of stability of shield tunnel face considering seepage. Chin. J. Geotech. Eng. 2013, 35, 1696–1704. [Google Scholar]
- Lü, X.; Wang, H.; Huang, M. Upper bound solution for the face stability of shield tunnel below the water table. Math. Probl. Eng. 2014, 2014, 1–11. [Google Scholar] [CrossRef]
- Anagnostou, G.; Kovári, K. Face stability conditions with earth-pressure-balanced shields. Tunn. Undergr. Space Technol. 1996, 11, 165–173. [Google Scholar] [CrossRef]
- Perazzelli, P.; Leone, T.; Anagnostou, G. Tunnel face stability under seepage flow conditions. Tunn. Undergr. Space Technol. 2014, 43, 459–469. [Google Scholar] [CrossRef]
- Cao, L.; Zhang, D.; Sun, Z. Stability analysis of working face of shield tunnel in saturated sand. Rail. Eng. 2019, 59, 35–38. [Google Scholar]
- Wang, L.; Han, K.; Xie, T.; Luo, J. Calculation of limit support pressure for EPB shield tunnel face in water-rich sand. Symmetry 2019, 11, 1102. [Google Scholar] [CrossRef]
- Wei, G.; He, F. Calculation of minmial support pressure acting on shield face during pipe jacking in sandy soil. Chin. J. Undergr. Space Eng. 2007, 3, 903–908. [Google Scholar]
- Qiao, J.; Zhang, Y.; Gao, J. Stability analysis of shield tunnel face in multilayer soil with seepage. Rock Soil Mech. 2010, 31, 1497–1502. [Google Scholar]
- Lü, X.; Li, F.; Huang, M. 3D limit support pressure solution for shield tunnel face subjected to seepage. Chin. J. Geotech. Eng. 2013, 35, 108–112. [Google Scholar]
- Cao, L.; Zhang, D.; Li, X. Analysis of limit support pressure due to shield tunneling with shallow overburden under seepage. J. Southwest Jiaotong Univ. 2019, 54, 507–515. [Google Scholar]
- Liu, W. Research on Tunnel Face Stability in Saturated Layered Soil. Ph.D. Thesis, Zhejiang University, Zhejiang, China, 2013. [Google Scholar]
- Huang, F. Study on the Stability of the Surrounding Rock and the Stress Characteristics of the Supporting Structure of the Tunnel under the Sea. Ph.D. Thesis, Beijing Jiaotong University, Beijing, China, 2005. [Google Scholar]
© 2020 by the authors. Licensee MDPI, Basel, Switzerland. This article is an open access article distributed under the terms and conditions of the Creative Commons Attribution (CC BY) license (http://creativecommons.org/licenses/by/4.0/).