Article

Design and Optimization of Plasmon Resonance Sensor Based on Micro–Nano Symmetrical Localized Surface

1
School of Electronic and Electrical Engineering, Shanghai University of Engineering Science, Shanghai 201620, China
2
School of Optical-Electrical and Computer Engineering, University of Shanghai for Science and Technology, Shanghai 200093, China
3
Department of Medical Physics and Informatics, Bashkir State Medical University, Lenina st. 3, 450008 Ufa, Russia
*
Author to whom correspondence should be addressed.
Symmetry 2020, 12(5), 841; https://doi.org/10.3390/sym12050841
Submission received: 20 April 2020 / Revised: 13 May 2020 / Accepted: 15 May 2020 / Published: 20 May 2020
(This article belongs to the Special Issue Symmetry in Engineering Sciences Ⅲ)

Abstract

:
Surface Plasma resonance (SPR) sensors combined with biological receptors are widely used in biosensors. Due to limitations of measurement techniques, small-scale, low accuracy, and sensitivity to the refractive index of solution in traditional SPR prism sensor arise. As a consequence, it is difficult to launch commercial production of SPR sensors. The theory of localized surface plasmon resonance (LSPR) developed based on SPR theory has stronger coupling ability to near-field photons. Based on the LSPR sensing theory, we propose a submicron-sized golden-disk and graphene composite structure. By varying the thickness and diameter of the array disk, the performance of the LSPR sensor can be optimized. A graphene layer sandwiched between the golden-disk and the silver film can prevent the latter from oxidizing. Symmetrical design enables high-low concentration of dual-channel distributed sensing. As the fixed light source, we use a 632.8-nm laser. A golden nano-disk with 45 nm thickness and 70 nm radius is designed, using a finite difference time domain (FDTD) simulation system. When the incident angle is 42°, the figure of merit (FOM) reaches 8826, and the measurable refractive index range reaches 0.2317.

1. Introduction

In the past few decades, nanostructured optical sensors and semiconductor biosensors have made great progress, while SPR-based optical sensors have also produced structures such as prism structure, photonic crystal fiber structure, and grating structure [1,2,3,4]. In recent years, the optical sensor based on local surface plasma structure is proposed, compared with the previous biosensors based on batch state [5,6,7,8,9,10]. These biosensors show the advantages of functional nanostructures and devices. Due to the coupling of gold nanoparticles on the film with local near-field light, it shows the compatibility of light and solution medium and the miniaturization of equipment, becoming one of the most promising materials in the field of optical sensing. When the gold nano-disk interacts with light, there is a coupling resonance between local surface plasmon resonance (LSPR) wave and material energy, which can be used as a sensing signal [11,12]. The generation of LSPR is due to the transfer of the free electron energy from the incident light to the specific collective oscillation mode, resulting in a strong optical absorption band for the incident light. The position of resonance peak at a certain wavelength depends on the shape, size, material, aggregation state, and distribution. LSPR can increase the intensity of the reflected wave and confine the light to the surface of the nanostructure, which makes a series of plasma biosensors possible. LSPR biosensor technology includes refractive index (RI) biosensor technology, metal surface enhanced fluorescence (SEF) technology, and surface enhanced Raman scattering (SERS) technology [13,14,15,16]. Among these technologies, RI biosensor is the simplest, because the change of body RI can be monitored by the change of position or intensity of LSPR peak with real-time and unlabeled sensing ability.
Although LSPR sensor has high sensitivity and resolution [17], the stability of measurement is a challenge. LSPR biosensor technology usually uses optical reference at the beginning of experiment. Measurement is based on the change of light intensity relative to the initial reference. Whether the ambient light and the light source are ideal transverse magnetic waves will affect the reflected intensity. Therefore, the stability of measurement conditions is a key problem in most of the methods based on intensity [18]. Based on the research of adjustable distributed SPR sensor with bimetal film, the sensor can attain two detection ranges of 1.380–1.395 and 1.500–1.520, with a FOM of 5960. When measuring the water content in honey aqueous solution, the sensitivity can reach up to 5.25 × 10⁻⁵ RIU 10−5 refractive index unit (RIU). However, the measurement range of this sensor is small, because, for ordinary liquids, the refractive index of the solution varies between 1.333 and 1.51. Singh et al. [19] designed a methanol sensor in infrared band. Through simulation and numerical analysis, they found that for methanol porosity of 20–45%, STM = 77.95–66.66 nm/RIU and FOM = 17.51–17.66/RIU. For gas detection, the quality factor of the sensor may be low, and the measurement effect is not very good relative to the liquid. However, it is possible to improve the response time and sensitivity of the sensor by controlling the composition and structure of the film and changing its optical properties. To further improve the stability and sensitivity of the detection, we propose a local surface plasmon optical biosensor with symmetrical structure of silver film graphene gold disk nanostructure [20].
In this paper, we improve the performance of LSPR sensor by controlling the size of the disk on the film, and optimize it by FDTD solutions simulation. Compared with Chen Qiang’s results, our designed LSPR sensor has a detection range of 1.321–1.335 and 1.553–1.561. For low range solutions, it can detect some solutions with lower refractive index than pure water, such as methanol solution (RI = 1.328) [21]. It is increased by 48% to FOM of 8826. In Section 2, we propose LSPR structure design and simulation. In Section 3, we analyze the structure and parameters of the device through experiments. In Section 4, we summarize our conclusions.

2. Materials and Methods

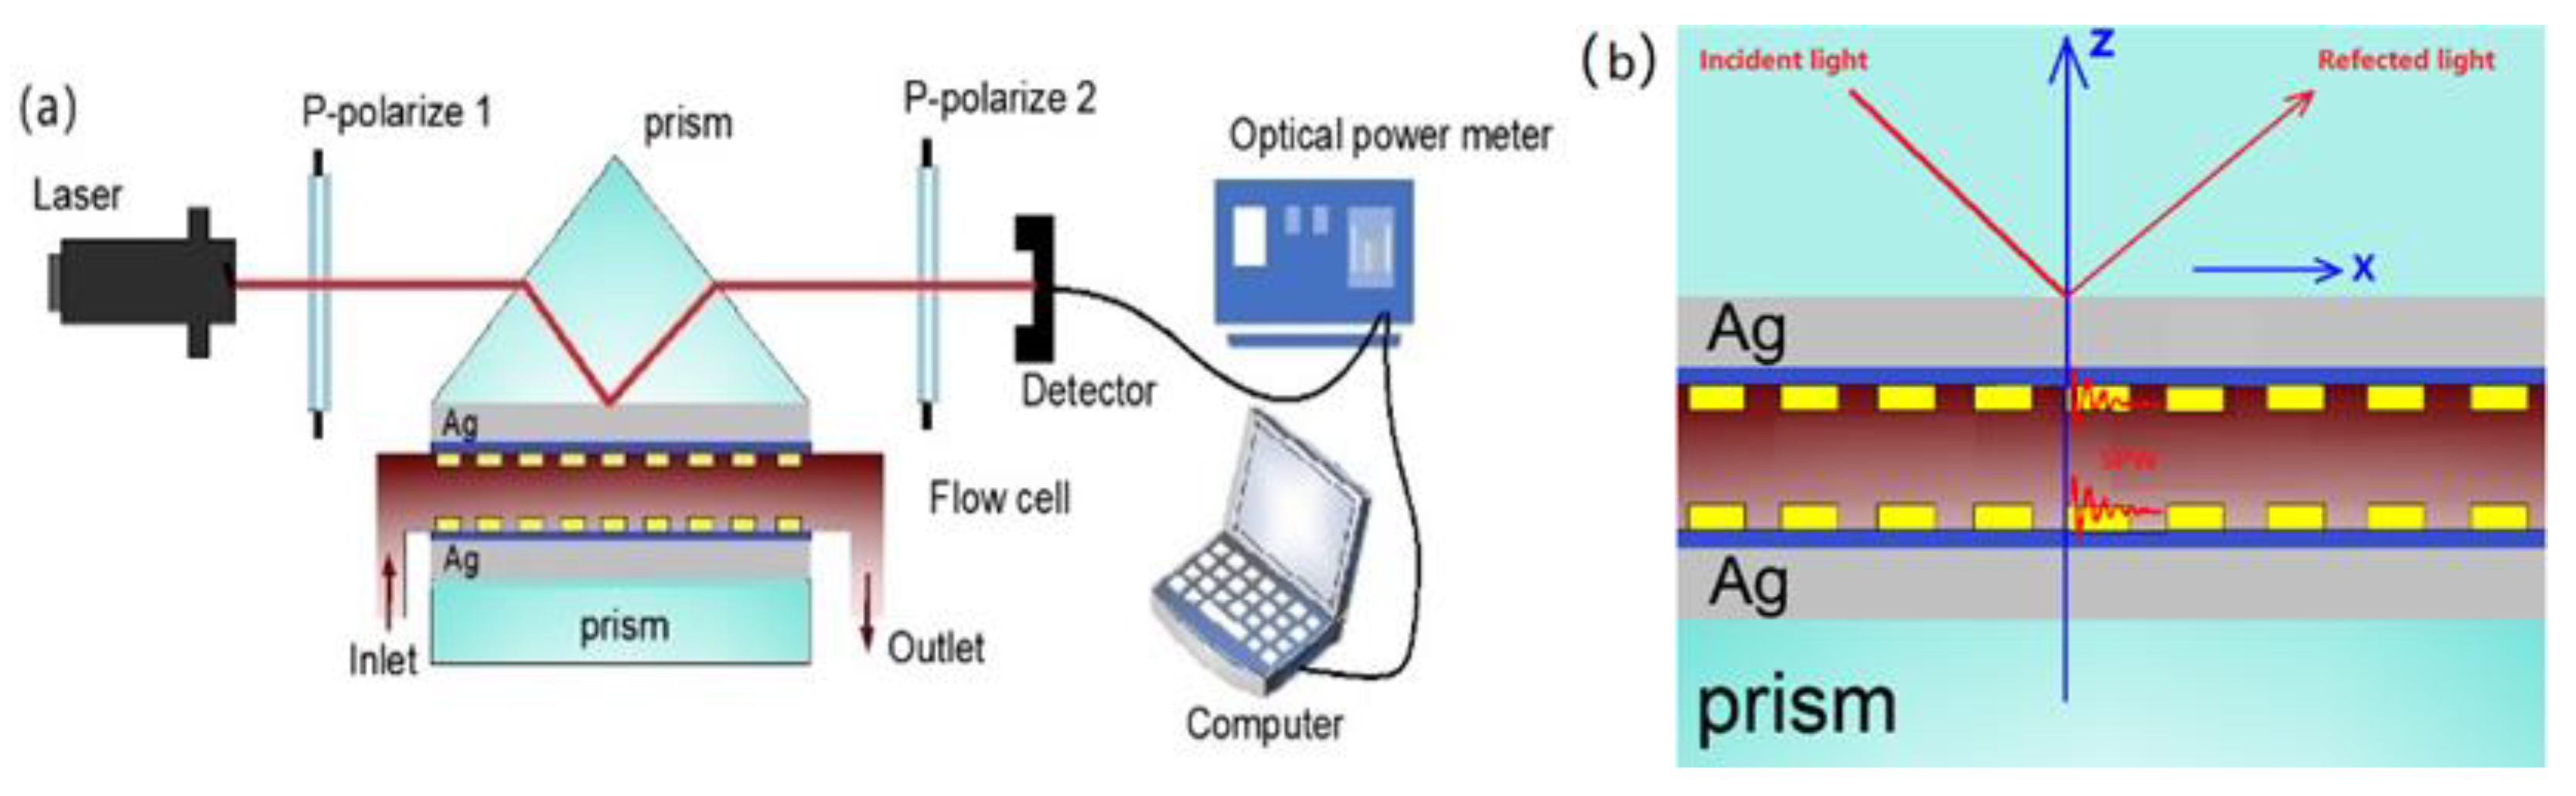
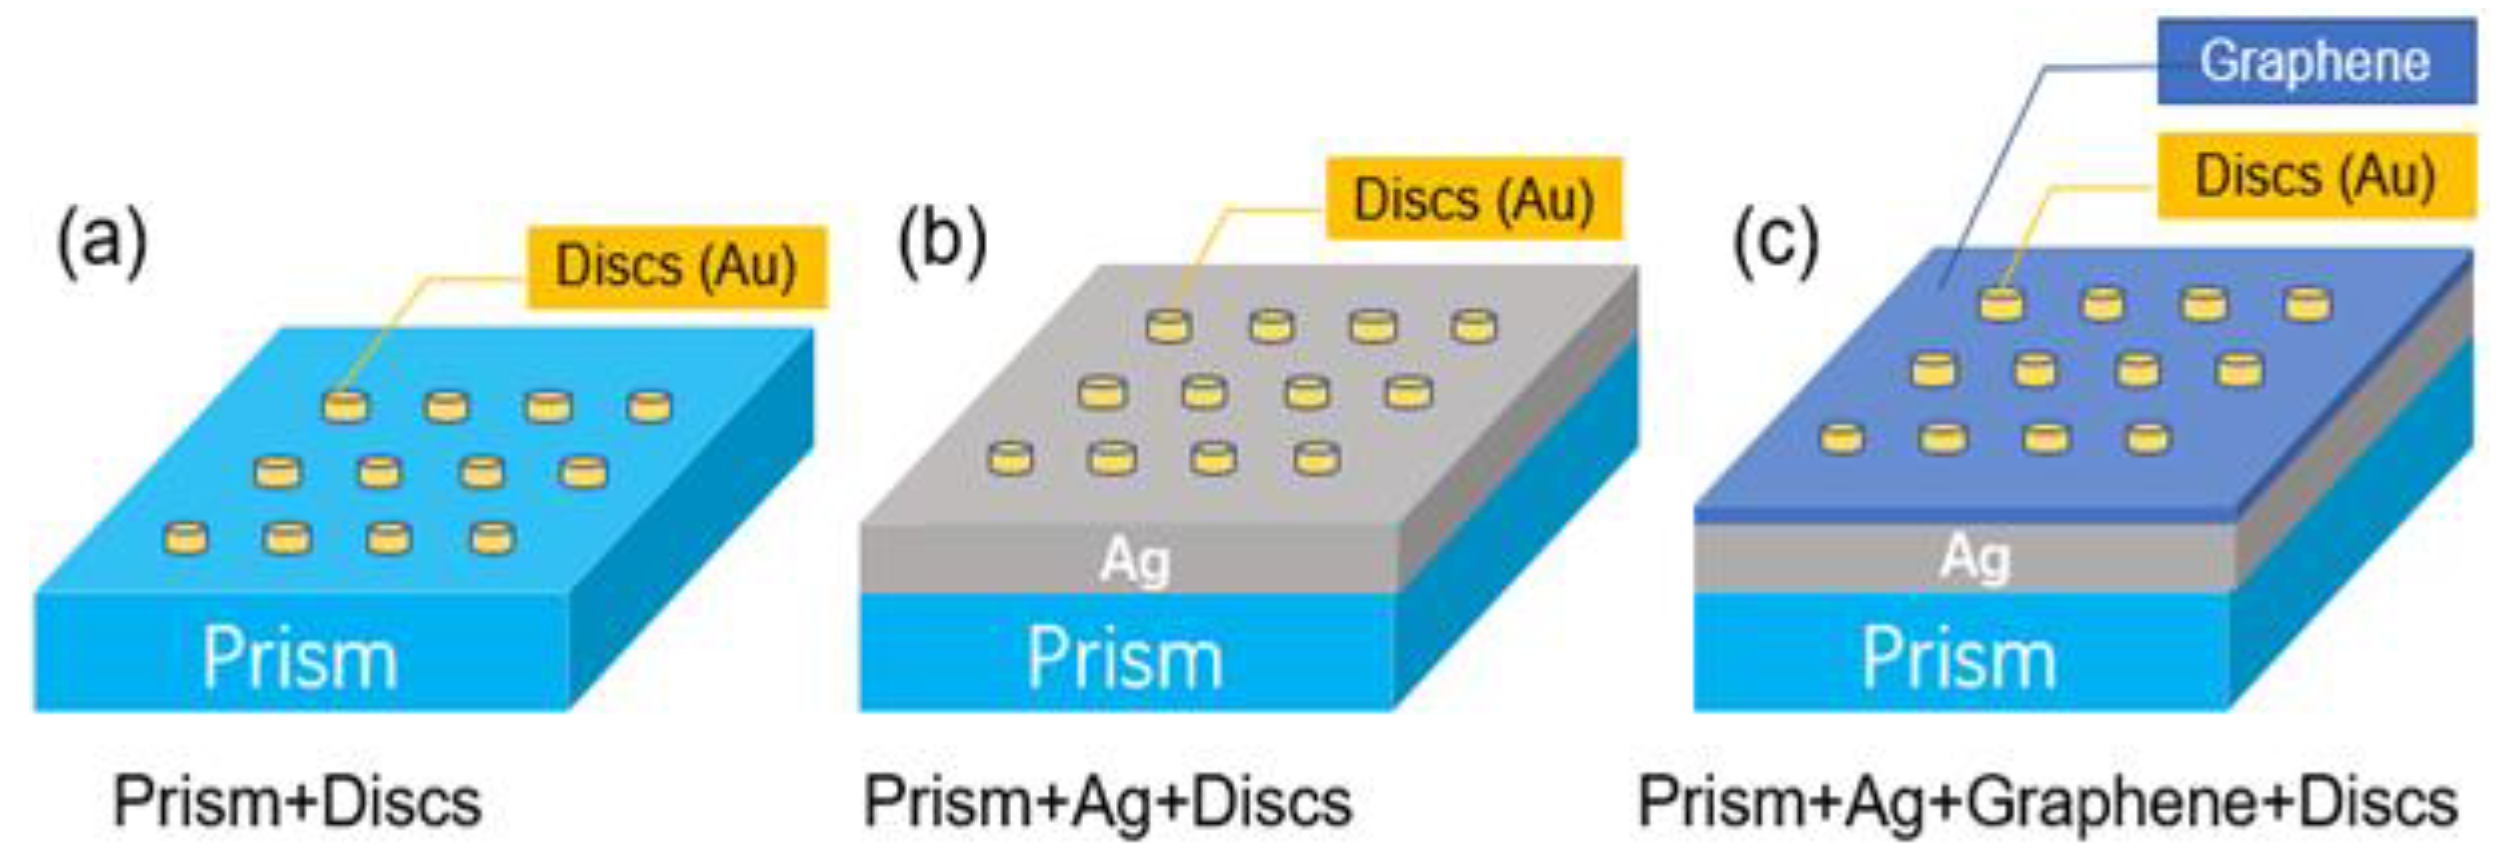
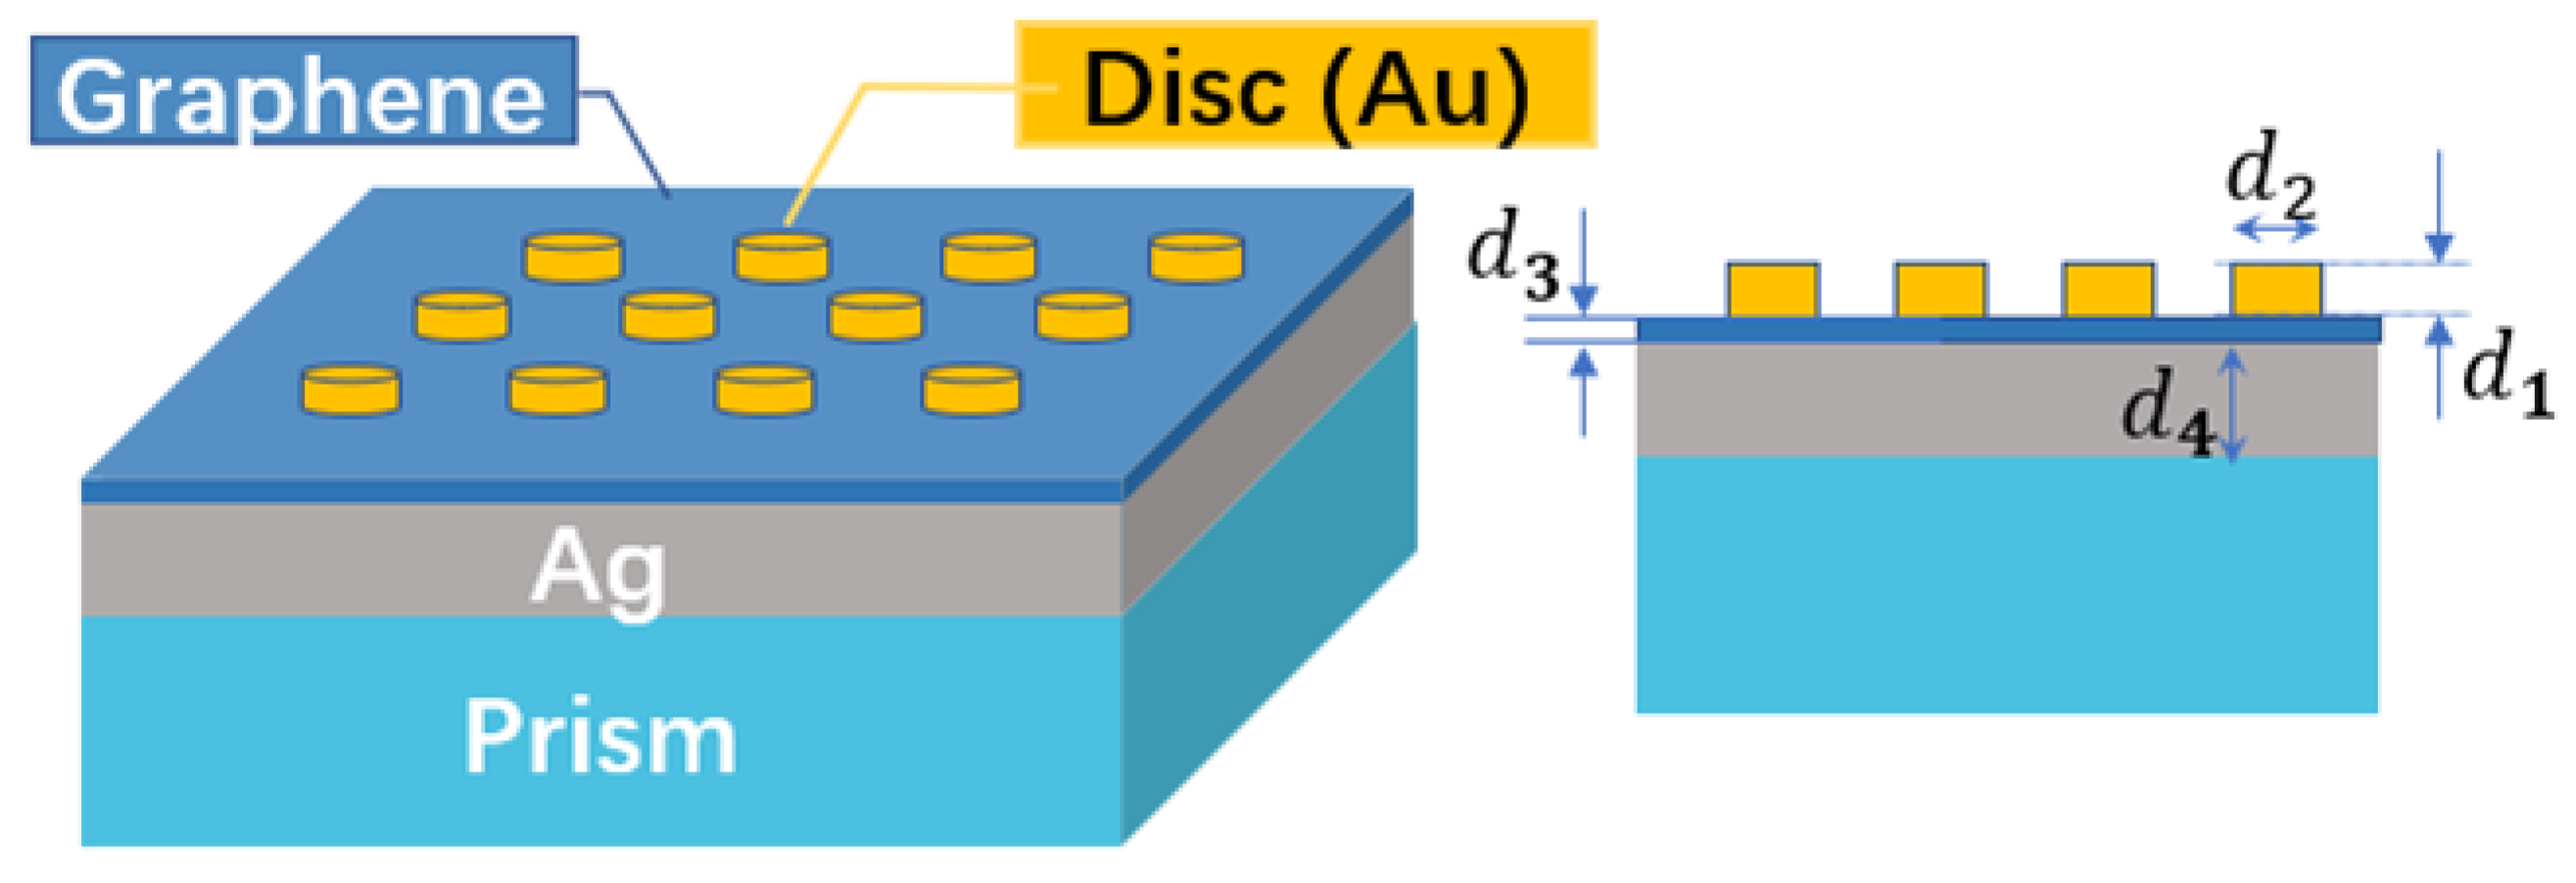
2.1. LSPR Sensor Structure Design

As the light source, we use a 10 mW He-Ne laser with wavelength 632.8 nm (see Figure 1a). Light enters the prism through the polarizer to produce total reflection. The reflected light passes through the polarizer and finally enters the optical power meter. The incident light is totally reflected through the silver film and the gold disk array on graphene [22]. When the frequency of the photon matches the overall frequency of the electrons conducted by the metal particles, the nanoparticle will strongly absorb the photon energy, and local surface plasmon resonance will occur.
The prism is placed on BK7 optical glass by vapor deposition of corresponding metal particles and engraved by laser. Between the two groups of prisms is a liquid flow cell. When the refractive index of the liquid changes, the transmittance of the light will correspondingly change [23]. The change of the light intensity generates by the detector a signal, which is transmitted to the spectrum analyzer. At last, the computer displays the corresponding concentration.
Figure 1b shows how light enters the silver film and passes through the silver film and graphene to couple with the plasmon on the surface of the gold nano-disk. The design of symmetrical structure sensor shows that there are two local surface plasmon resonances. In Figure 1b, the incident light produces LSPR on the surface where the solution and the disk structure film contact. When the incident light angle is small, it directly passes through the first part of the film structure. Because the refractive index of the solution is smaller than that of the prism, the second refraction occurs in the solution, and the angle is larger than the first incident angle. LSPR occurs on the second part of the film surface. When the incident angle increases, total reflection occurs on the prism surface, and LSPR occurs on the first film structure as the incident angle continues to increase. Two absorption peaks can be generated by changing the incident angle output normalized light intensity. The wave vector direction of the incident light is the same as that of the x-axis. The nano-disk can adjust the wave vector of the plasma wave on its surface to be equal to the wave vector of the incident light to produce local plasmon resonance.

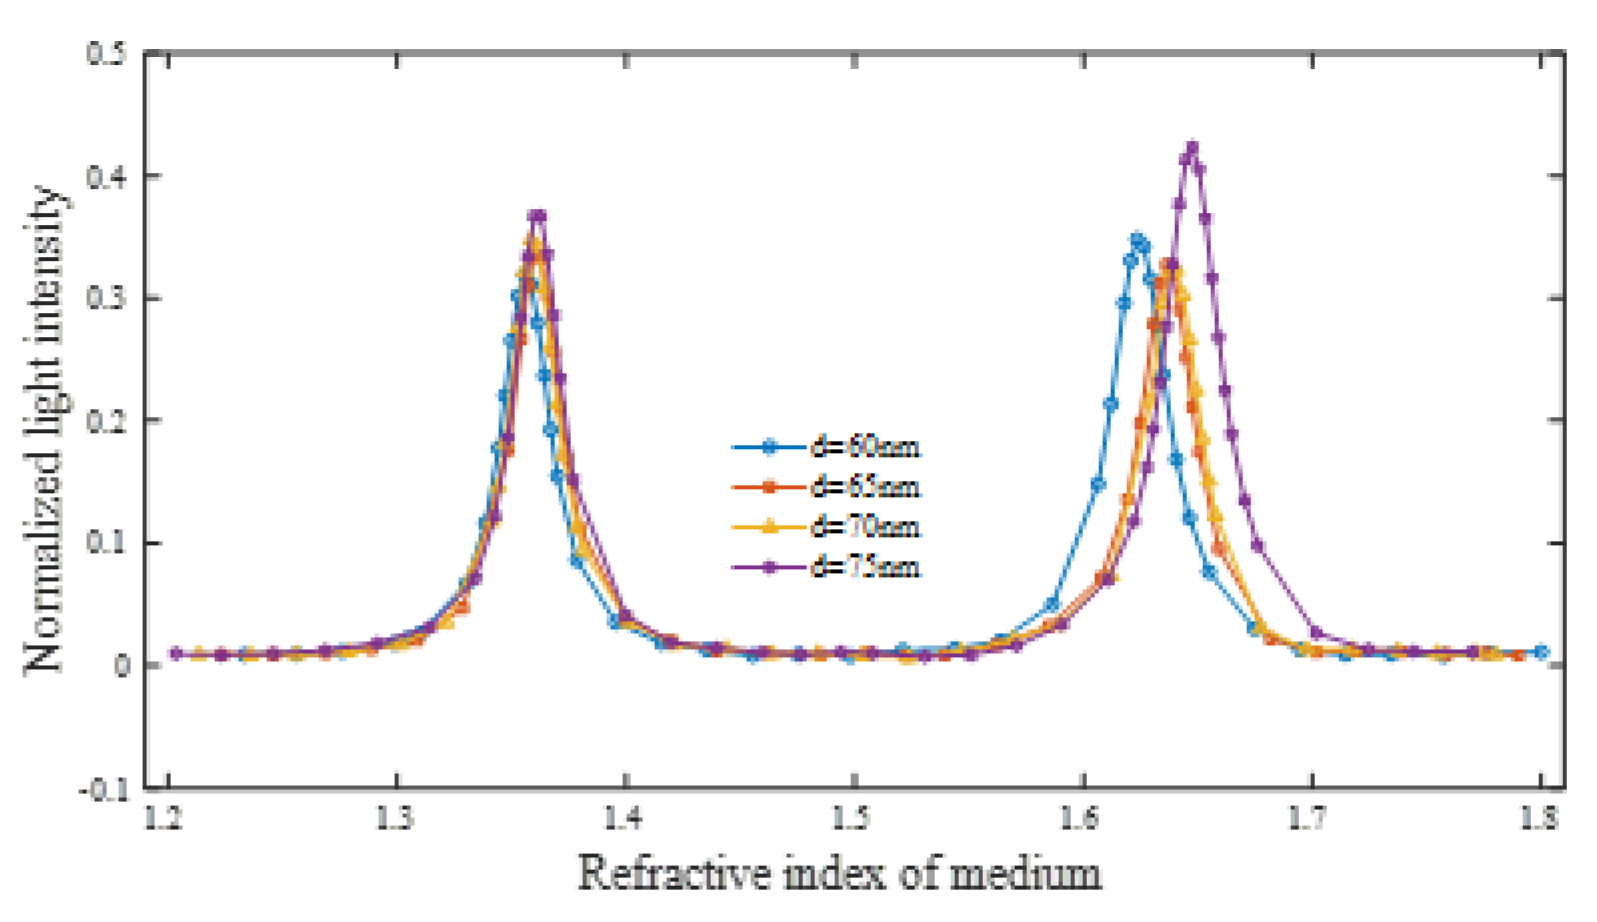
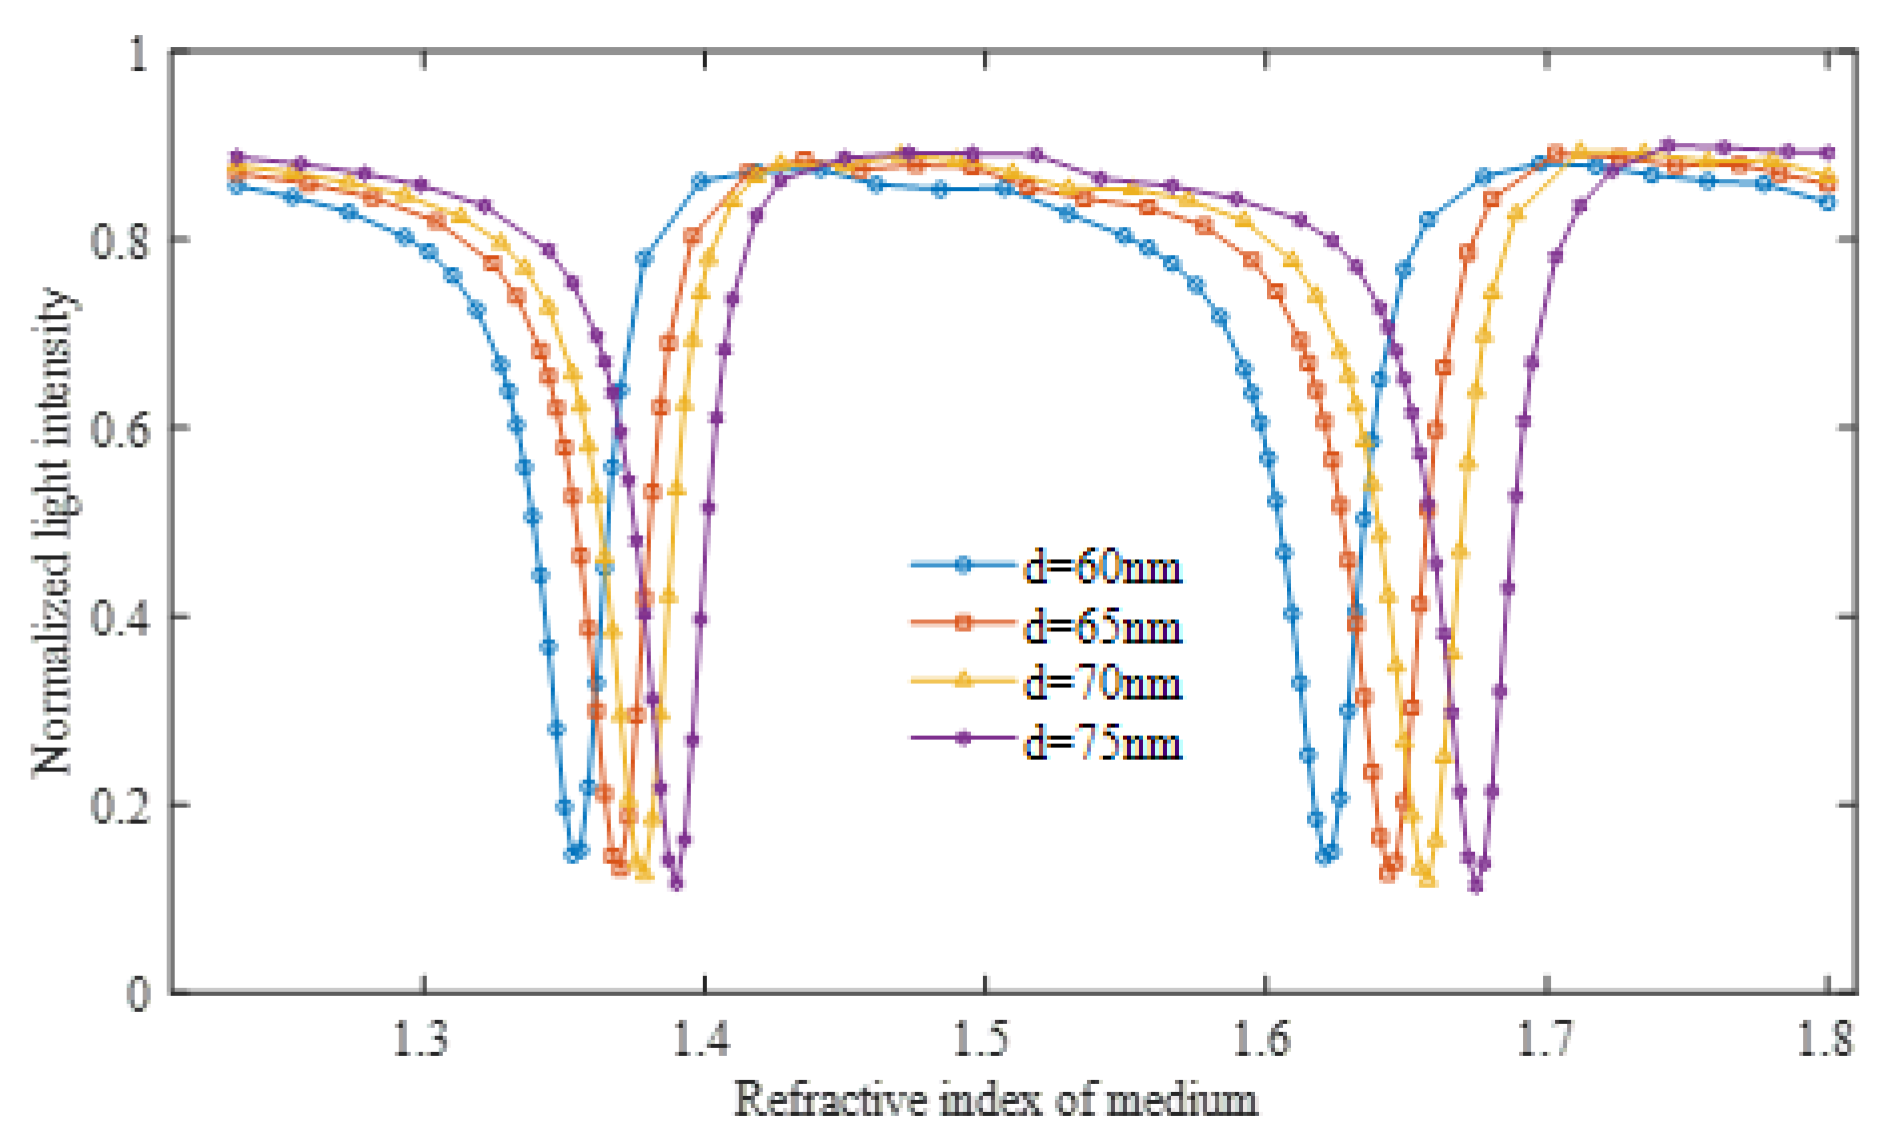
2.2. Variable Method of Controlling Disc Thickness

In the above analysis, two LSPR can be generated by changing the incident angle. In the following simulation experiments, to facilitate our processing of simulation data, only the parameters of refractive index scanning reflect the sensor performance, thus highlighting the research focus.
LSPR sensor has four modulation modes: angle, intensity, wavelength, and phase. In this paper, the light intensity detection method is selected. Under the normalized light intensity, the ratio of the change of output light intensity to the change of refractive index is multiplied by the minimum resolution, expressed as [24]
S = Δ R T Δ n Δ I V
FOM = S F W H W
The structural sensitivity is defined as the ratio of the refractive index change of the solution to be tested to the change of the light intensity [25,26]. It is the minimum resolution accuracy of the optical power meter. The comprehensive factor for evaluating LSPR sensors is the figure of merit (FOM), which is defined as the ratio of the LSPR sensor sensitivity S to the full width at half maximum (FWHM). From Equation 2, it can be seen that FWHW and FOM are inversely proportional under the condition of constant sensitivity. The FOM can be improved by reducing FWHW, thereby improving the performance of the LSPR sensor [27].
It is clear from the structure model that the half-peak width, peak value, and adjustable range of the LSPR formant directly influence the performance and resolution of the LSPR sensor. This paper studies high-low concentration distributed sensing, and optimizing the structure effectively improves the resolution. The symmetrical nano-disk structure sensor is tuned by using the corresponding change of the reflected light intensity when the concentration of the analyte changes. Both the thickness of the disc and the thickness of the dielectric layer impact on the intensity of the reflected light. The wavelength of the fixed source is adjusted by regulating the system parameters of sensor structure (disc thickness, disk diameter, incident angle, and medium thickness) to achieve tunable distributed large-scale sensing detection [28].
The simulation was performed by using finite-difference time domain algorithm software (FDTD). In the mode of light intensity modulation, a He-Ne laser is selected and the environmental parameters are set as follows: the simulated temperature is 300 K and the standard atmospheric pressure is 101 kPa. The base material is BK7 optical glass; the light source enters at a slightly larger angle (42°) than the critical angle; the thicknesses of the gold disc layer are 40, 45, 50, and 55 nm; the thickness of the medium to be tested is 860 nm; and the tested material is deionized purified water, with a refractive index of 1.33.
As shown in Figure 2, there are two resonance peaks in the intensity absorption spectra of nano-disk arrays with different thicknesses. With the increase of the thickness of the nano-disk layer, the absorption spectra begin to shift to the direction of high refractive index, and the absorption intensity gradually decreases. The FWHM is weakened from 0.033 to 0.020. The FWHM of the gold-porous layer with a thickness of 55 nm is only 0.020, which has a narrower resonance half-width than the 45 nm thick film. The thicknesses of the disk film are 40, 45, 50, and 55 nm.
Figure 3 shows the reflection intensity curves for nano-disk films of different thicknesses. When the thickness of the gold layer is 40 or 55 nm, the double-resonance absorption peak of the reflected light intensity decreases with the increase of the thickness of the gold disk layer, and the minimum reflectance of the normalized light intensity is 0.08344. The thinner is the gold disk layer, the easier it is to excite the LSPW, showing a resonance range that exhibits a larger refractive index in the spectrum. However, as the attenuation absorption peak becomes larger, the FWHM of the resonance peak becomes wider, which brings about a decrease in the sensitivity of the LSPR sensor. According to the refractive index range of the solution, the thickness of the gold nano-disk layer is selected considering the attenuation amount, the measurement range, and the sensitivity. The above figure also shows that, as the thickness of the disk film becomes thinner, the refractive index fluctuates between 1.42 and 1.55, indicating that the reflected light intensity begins to become unstable when the disk film is too thin. It also shows that improving the performance of the LSPR sensor by reducing the thickness of the film can lead to unstable detection [29].
Figure 4 shows the electric field intensity distribution at different disk thicknesses. The thicknesses are 40, 45, 50, and 55 nm, respectively. Along the x-axis, different thicknesses of nanoporous films respond to two specific refractive index points. For the thickness of 45 nm, the refractive index points are 1.37 and 1.646, which show the maximum peak of the electric field intensity at the resonance refraction point. The peak values are 4.209 and 3.89, respectively. The electric field strength of the transverse magnetic (TM) wave is mainly concentrated on the plane where the array disk is located. The direction of propagation is exponentially attenuated. The first peak has a stronger intensity than the second peak. On the interface between the LSPR prism and the solution to be measured, the TM wave is significantly enhanced at two specific refractive index points, and the local electric field enhancement is mapped to the spectrum to produce a double resonance peak.

2.3. Variable Disk Diameter Control Method

In the previous section, we simulate and analyze the effect of thickness on the LSPR induction curve. Changing the diameter of the submicron disk in the dielectric layer also affects the LSPR curve. In the following section, we only change the parameter of the diameter and analyze the change of the LSPR induction curve.
As shown in Figure 5, for nano-disk array structures with different diameters, with the increase of the aperture diameter, the curve of absorption spectrum begins to shift to the direction of high refractive index, the absorption intensity gradually increases, and the range of measurable refractive index becomes larger. The mean bimodal resonance curve of FWHM decreases from 0.031 to 0.023. The bimodal resonance curve FWHM of the gold disk layer with a diameter of 150 nm is only 0.023, which is narrower than that of the gold disk with a relative diameter of 120 nm. Refractive index between 1.43 and 1.52 decreases the fluctuation of absorption spectrum intensity, which indicates that choosing the appropriate inner diameter of disk membrane can reduce the disturbance of absorption intensity and increase the stability of SPR system detection.
In Figure 6, the reflective intensity curves of 120, 130, 140 and 150 nm diameters are shown. In Figure 3 shows that the thicker is the film, the weaker is the minimum reflection intensity, and the smaller is the FWHW. At the same thickness, we only change the inner diameter of the disk, and we find that the minimum point and the full width of the half peak of the reflected light intensity curve almost do not change. However, the value of refractive index at the minimum of two absorption peaks increases because of the right offset of the second reflection minimum. The inner diameter of the gold disk does not change the performance of the SPR sensor. From the shift of the reflection intensity curve in the above figure, we can conclude that the refractive index of the LSPR detection solution can be adjusted by changing the inner diameter of the gold disk.

3. Discussion and Result

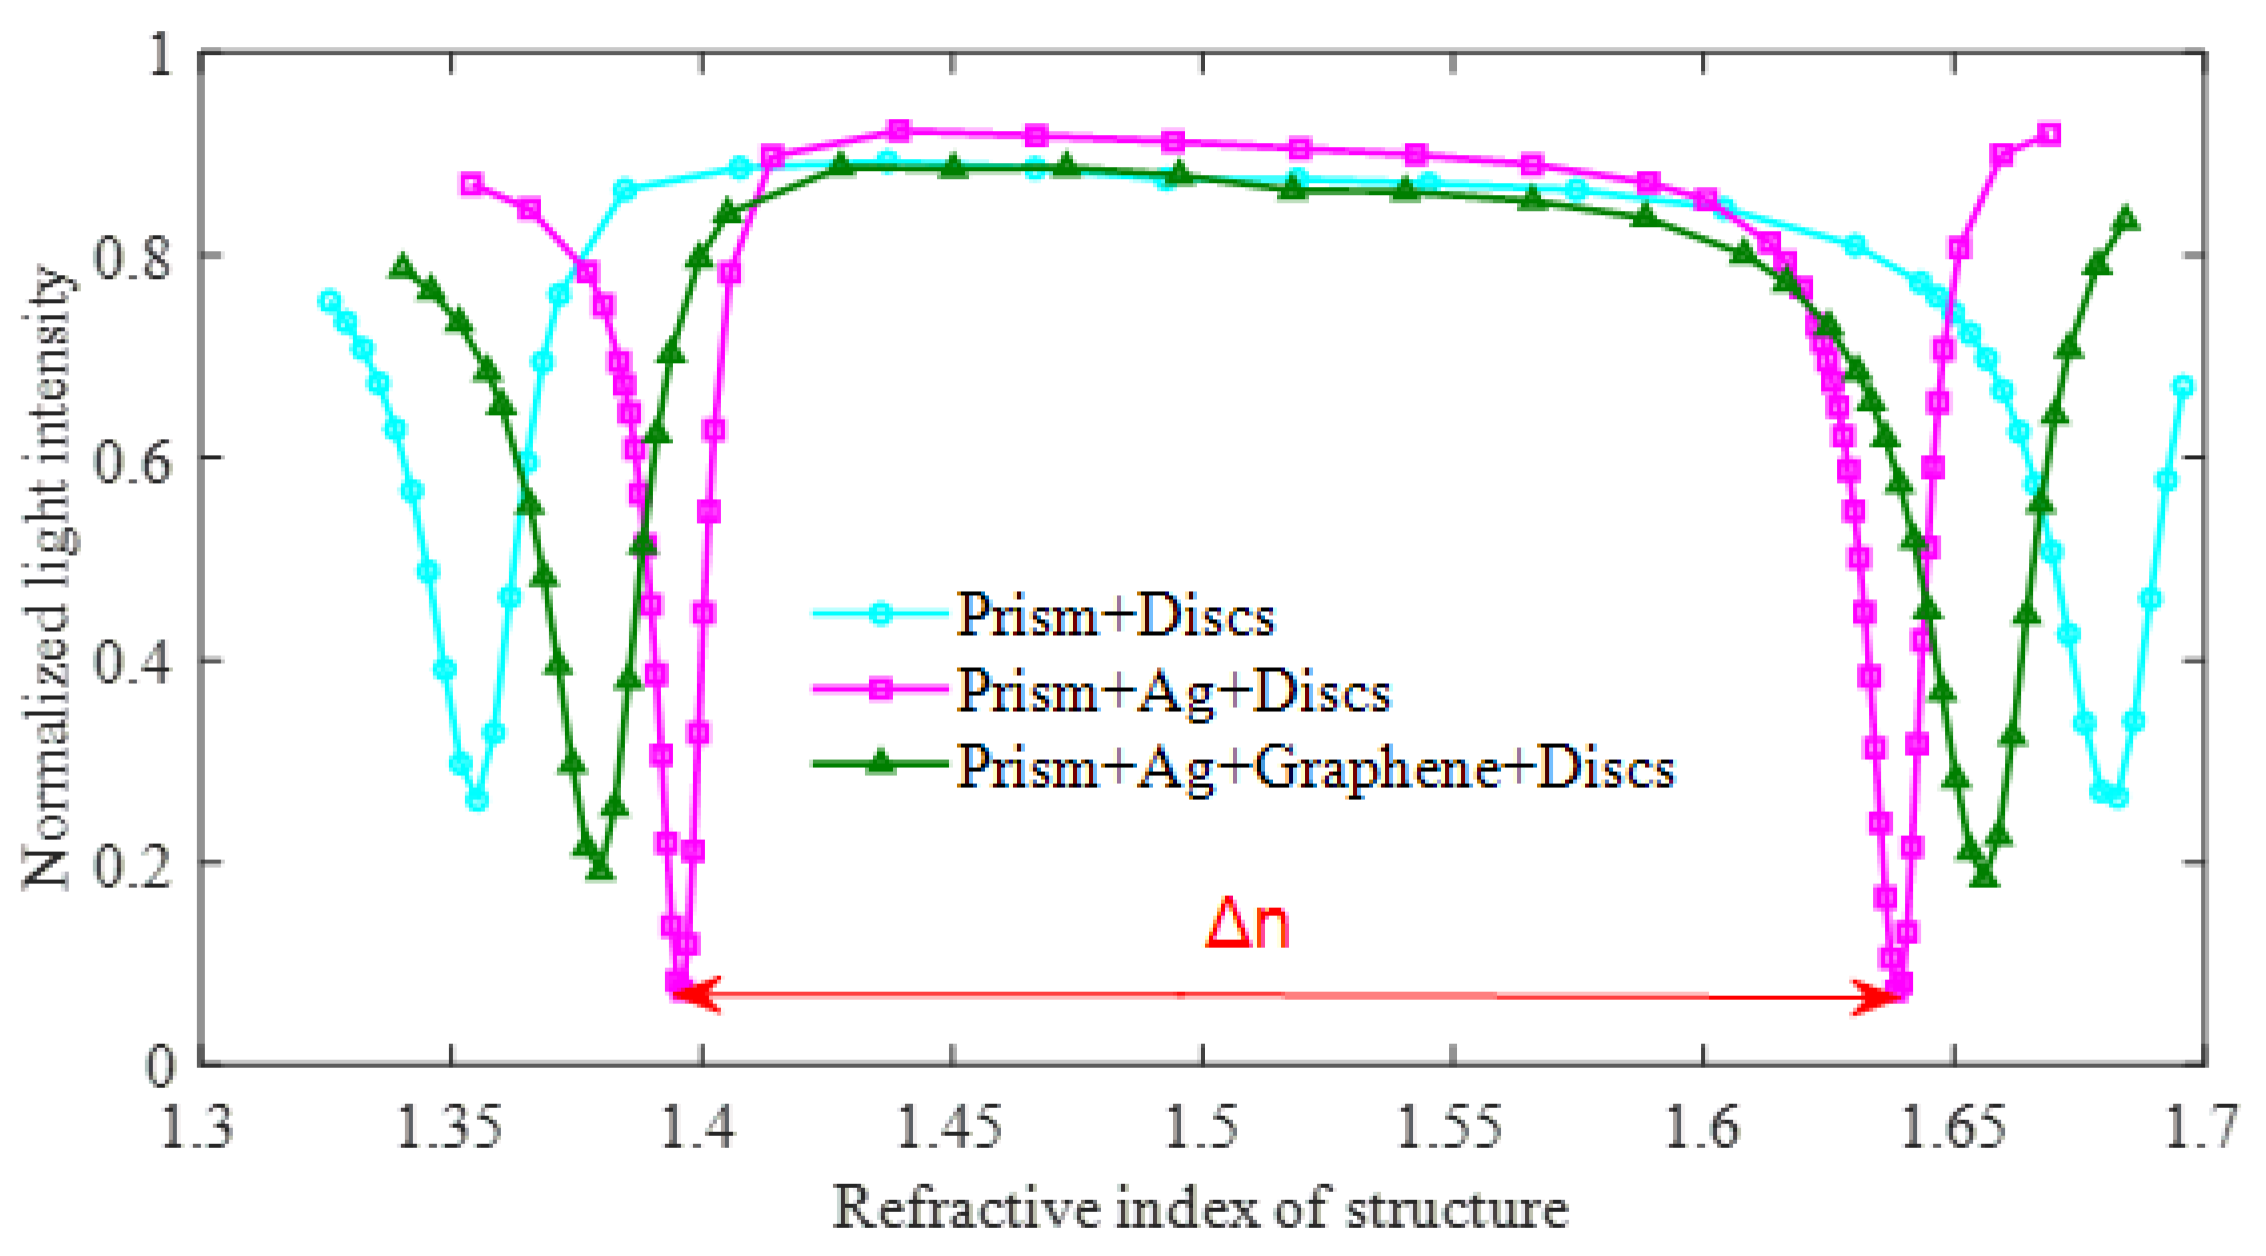
3.1. Comparing with Three Kinds of Structures

We analyzed the influence of the thickness and diameter of the disk on the reflected light intensity carried out under a single condition. This paper determines the sensor structure through simulation and structural performance analysis, such as prism + discs, prism + silver film + discs, and prism + silver film + graphene + discs. Figure 7 shows the single-sided structure of the three sensors.
Figure 8 shows the reflected light intensity curves of the three structures under the same condition. In this experiment, the thickness of the solution is set as 850 nm, the thickness of the disk is set as 50 nm, the diameter is set as 120 nm, and the thickness of the silver film is set as 50 nm. Other parameters are the same as the ones in Figure 2. As shown in Figure 8, the prism + disc model can measure the solution in a larger range, but the absorption peak is smaller, thus the FOM is also smaller. The prism + silver film + disc structure has a larger absorption peak and a smaller measurement range; therefore, the FOM is larger. The performance of the prism + silver film + graphene + disc structure is between the other two models. The results in Figure 8 show that the prism + silver film + disc structure is the best. However, the silver film in the prism + silver film + disc structure is directly exposed to the solution, and contact with the gold disc would accelerate the indicated oxidation, which affects the stability of the measurement.
As reported in Table 1, the FOM of prism + silver film + disc is the biggest, reaching 3069, while the minimum value is for prism + disc at 772. The value of prism + silver film + graphene + disc structure is 1391. The analyses presented in Table 1 and Figure 8 are consistent. Considering the stability (oxidation resistance) and performance of the measurement, we choose prism + silver film + graphene + disc. The prism + silver film + graphene + disc structure is used in the following discussion.

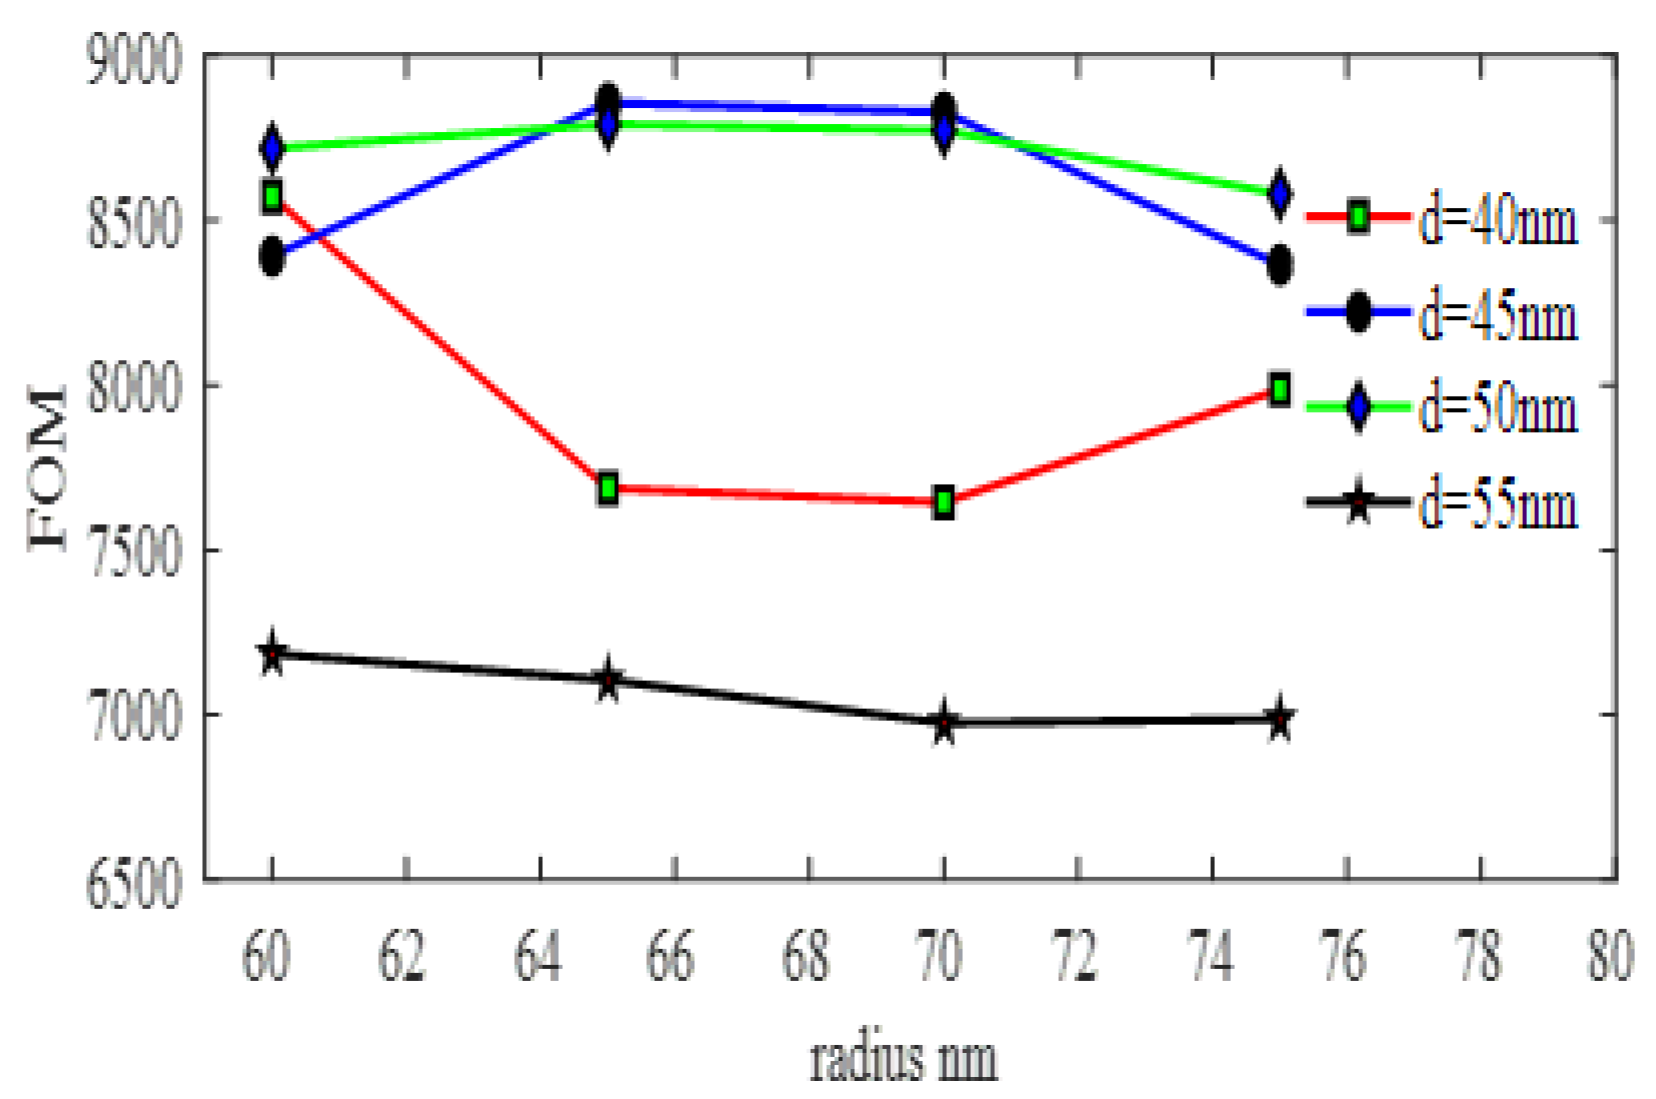
3.2. Comparison after Changing the Thickness and Diameter of the Disk Layer

In the above analysis, we can improve the performance of the LSPR sensor by changing the thickness of the disk film and the inner diameter of the disk. In the theoretical analysis of symmetric structure SPR sensing, we define the sensitivity of the LSPR sensor as the intensity of the light intensity corresponding to the refractive index change of the unit sample (the ratio of the change in the intensity of the substance to be measured to the amount of change in the refractive index) [30]. Sensitivity is one of the SPR performance indicators. In the above theory, we introduce FOM to evaluate the comprehensive performance of LSPR sensors. Therefore, we simulated the reflection intensity curve after changing the diameter of the gold disc at different thicknesses by FDTD solutions software. The FOM under each SPR sensing structure type was then calculated from the corresponding reflection intensity curve [31].
In Figure 9, we can see that the difference in FOM is small when the thickness of the film is 45 and 50 nm. The disk diameters were 120, 130, 140, and 150 nm, respectively, and the film thickness was 45 nm, resulting in FOM of 8348, 8624, 8826, and 8364, respectively. The FOM with thickness of 40 nm is 8348, 8624, 8826, and 8364, respectively. The FOM of 40 and 55 nm is lower than for 45 and 50 nm. For the 55-nm disk layer, the FOM of thicker film is from the relationship between the thickness of the front and the intensity of the reflection spectrum. The intensity of the reflection line is weakened, and the sensitivity is lowered. From Equation (2), the sensitivity is proportional to FOM, thus FOM is small. For the 40-nm disk layer, we can see that the FWHW is the largest (Figure 3). From Equation (2), FWHW is inversely proportional to FOM, thus FOM is small. It can be seen in the Figure 9 that, when the thickness of the gold nano-disk layer is 45 nm and the disk diameter is 140 nm, the maximum quality factor is 8826. At this point, we can conclude that the best performance is achieved when the golden disk layer thickness is 45 nm with a diameter of 140 nm.
Figure 10 shows the structure diagram of one side of the sensor chip. The bottom layer is prism structure, which is used to reflect the light twice and generate a secondary resonance [32]. The silver film on the top improves the sensitivity of the sensor, but silver can be easily oxidized by the solution. we have coated a layer of graphene on the silver film, which prevents the silver film from contacting with the solution to oxidize and improves the film layer coupling coefficient.

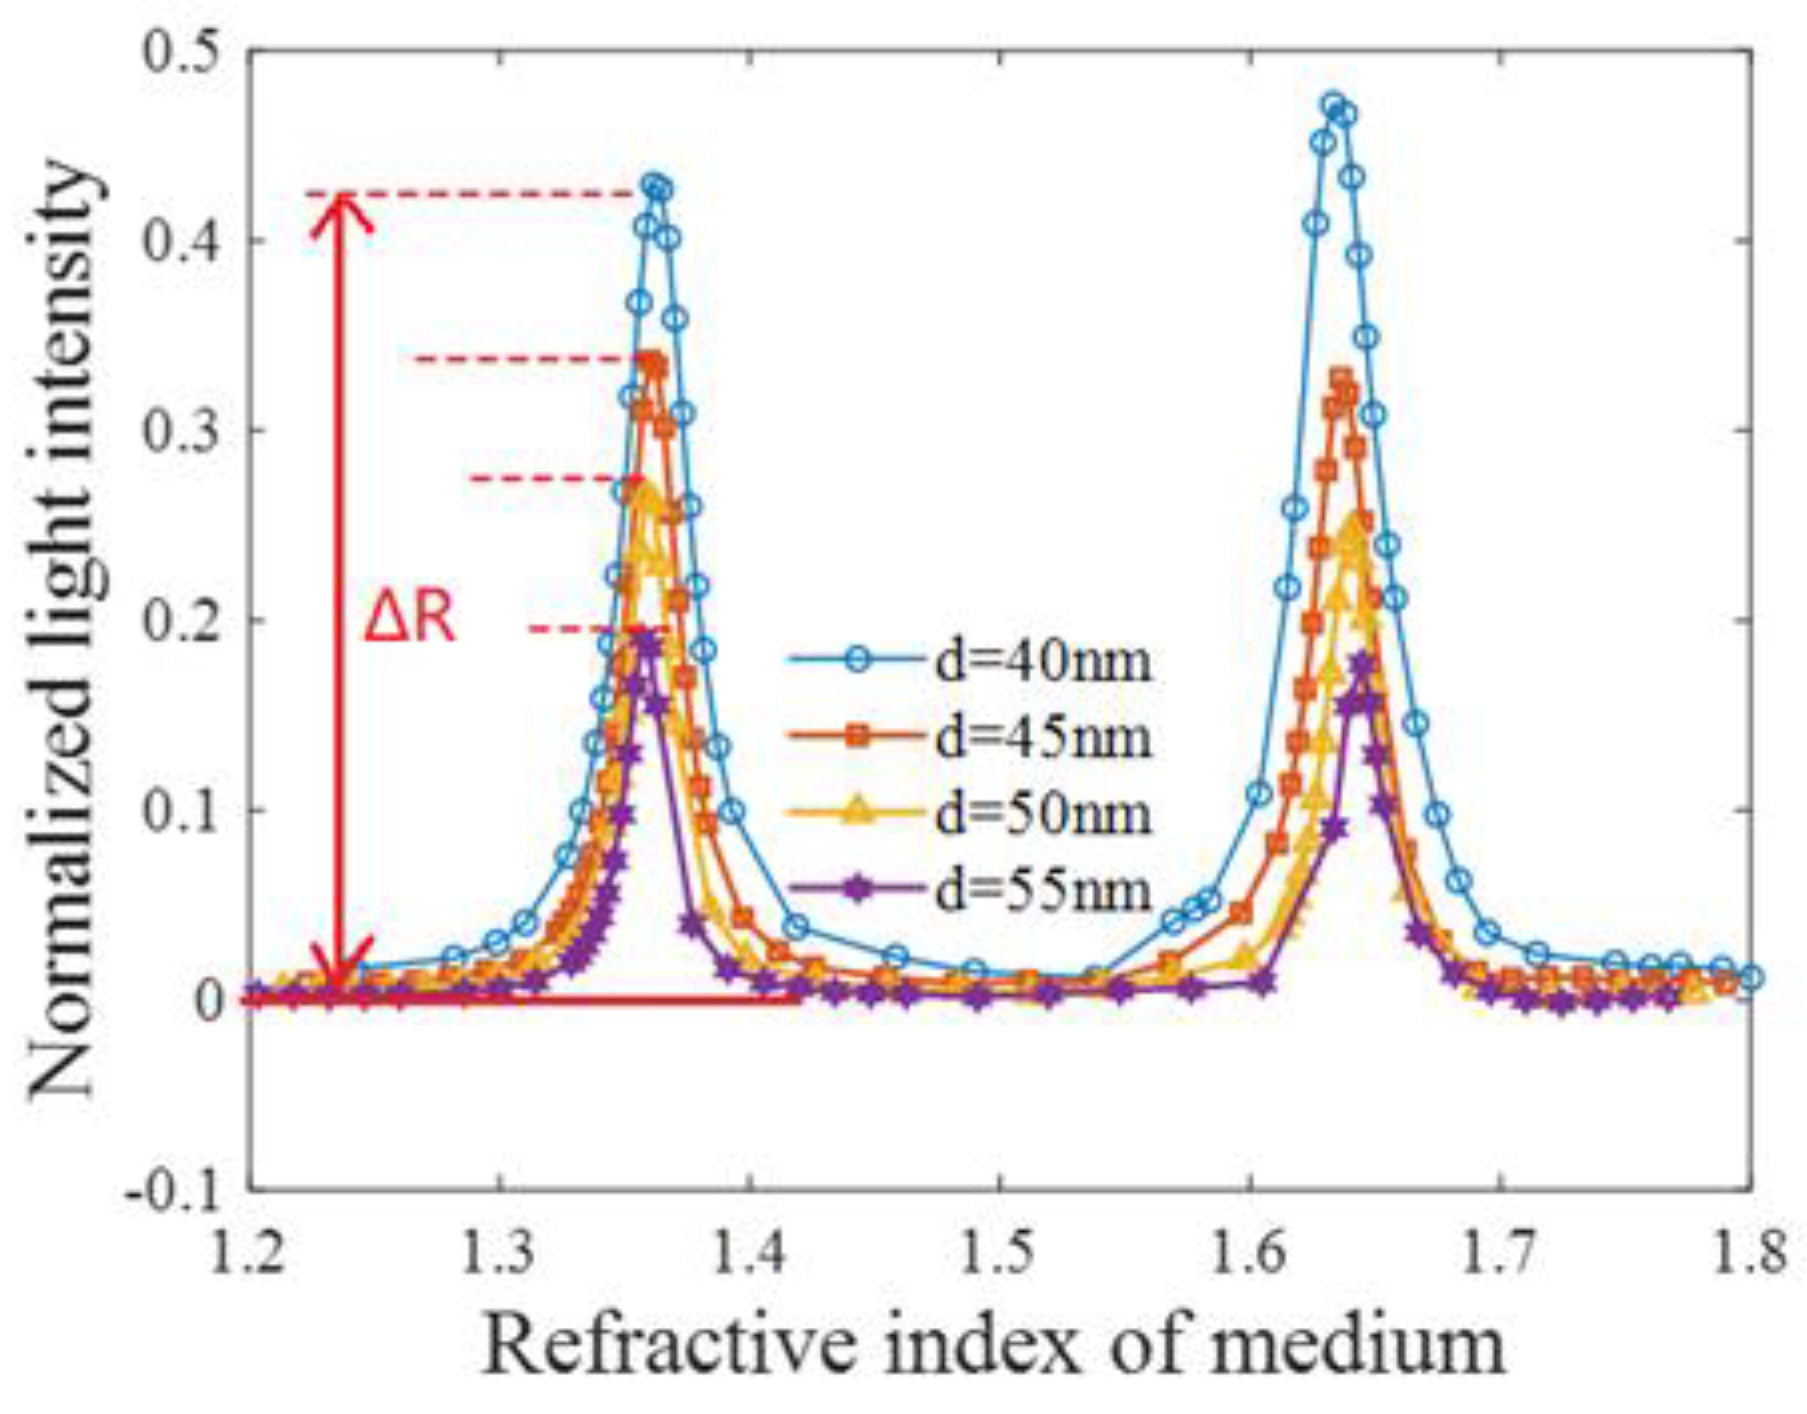
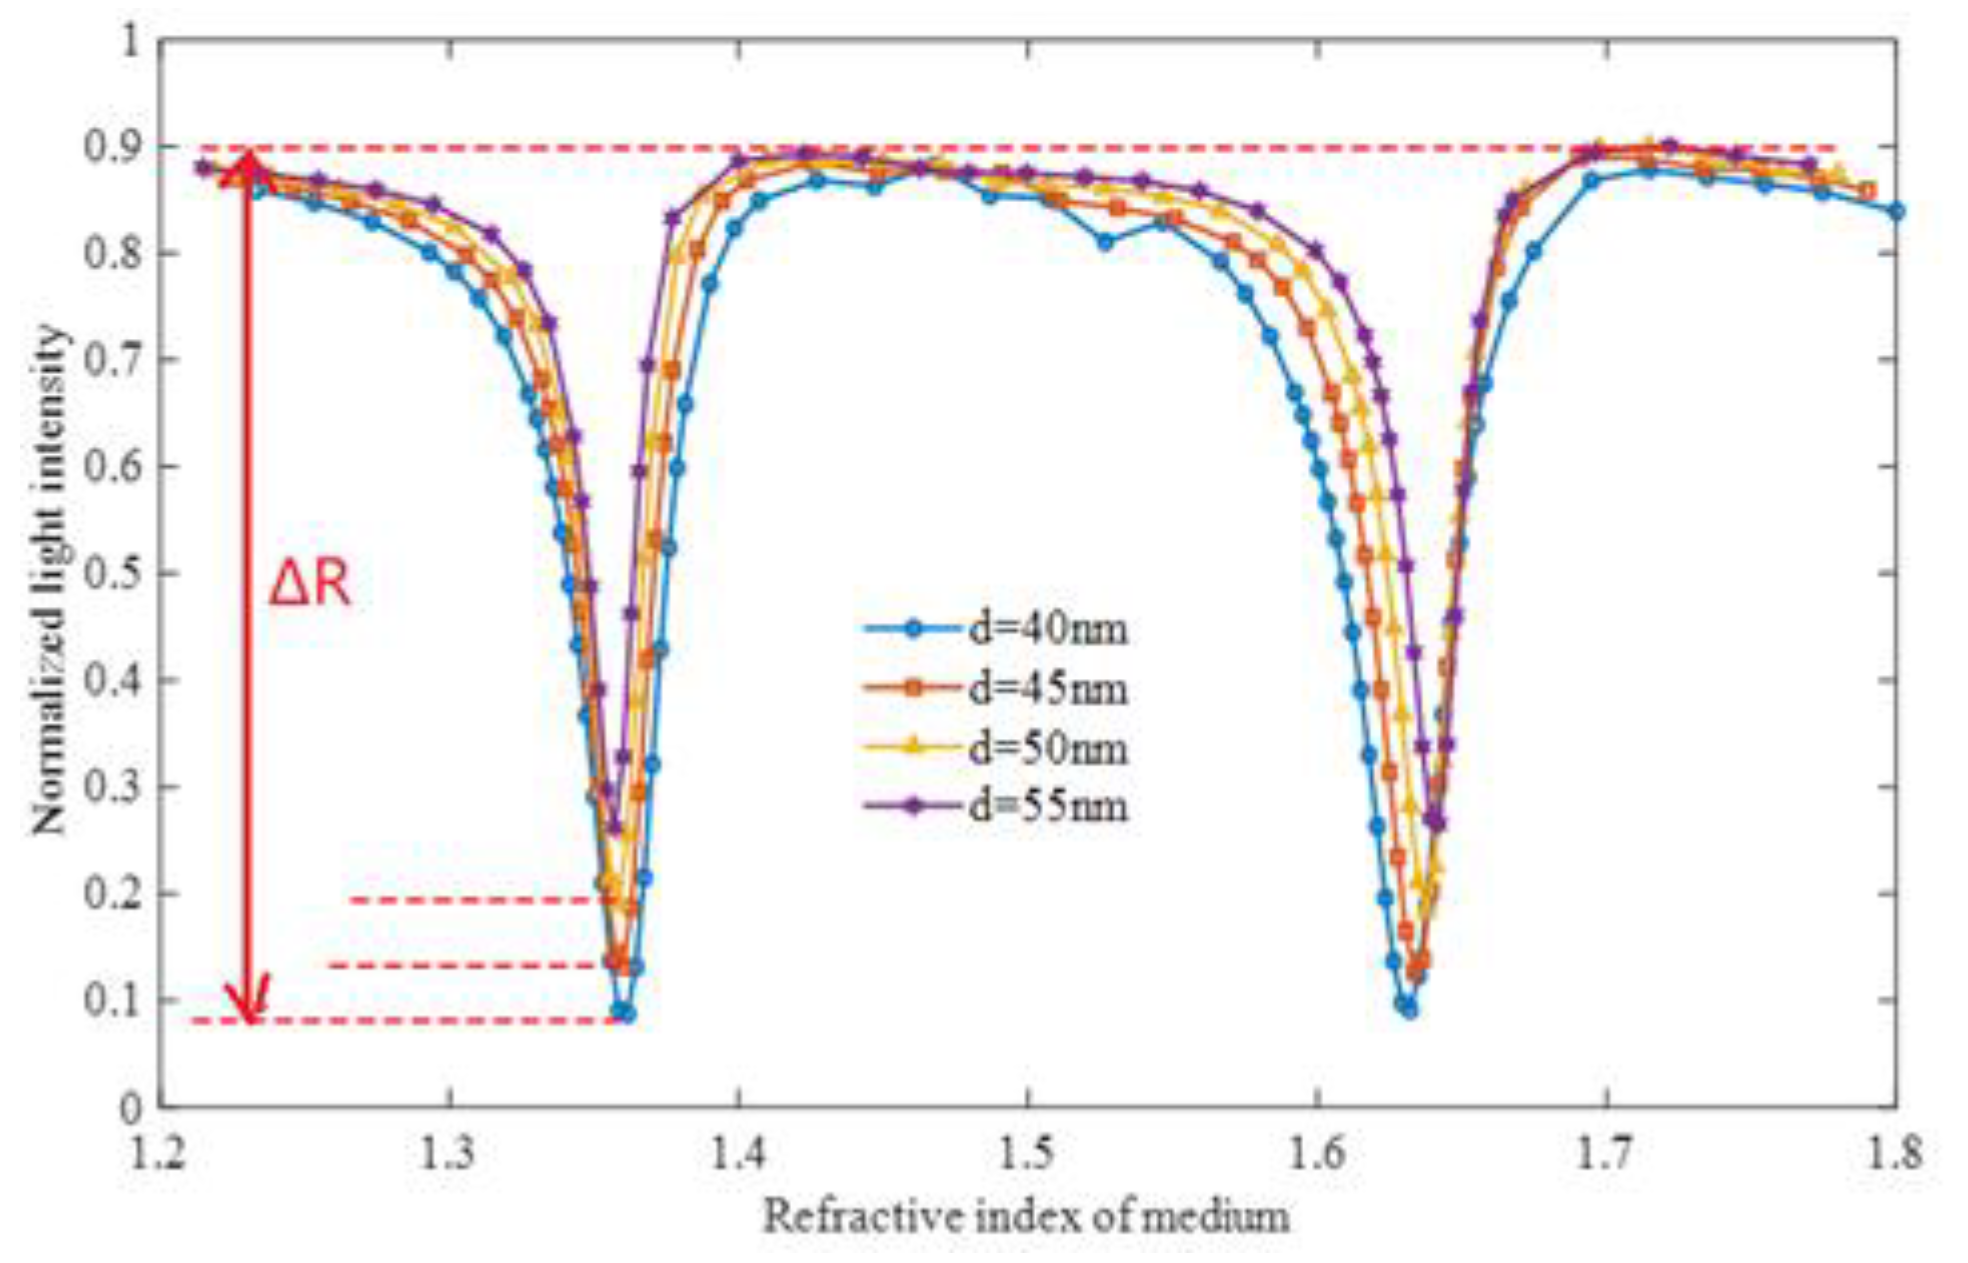
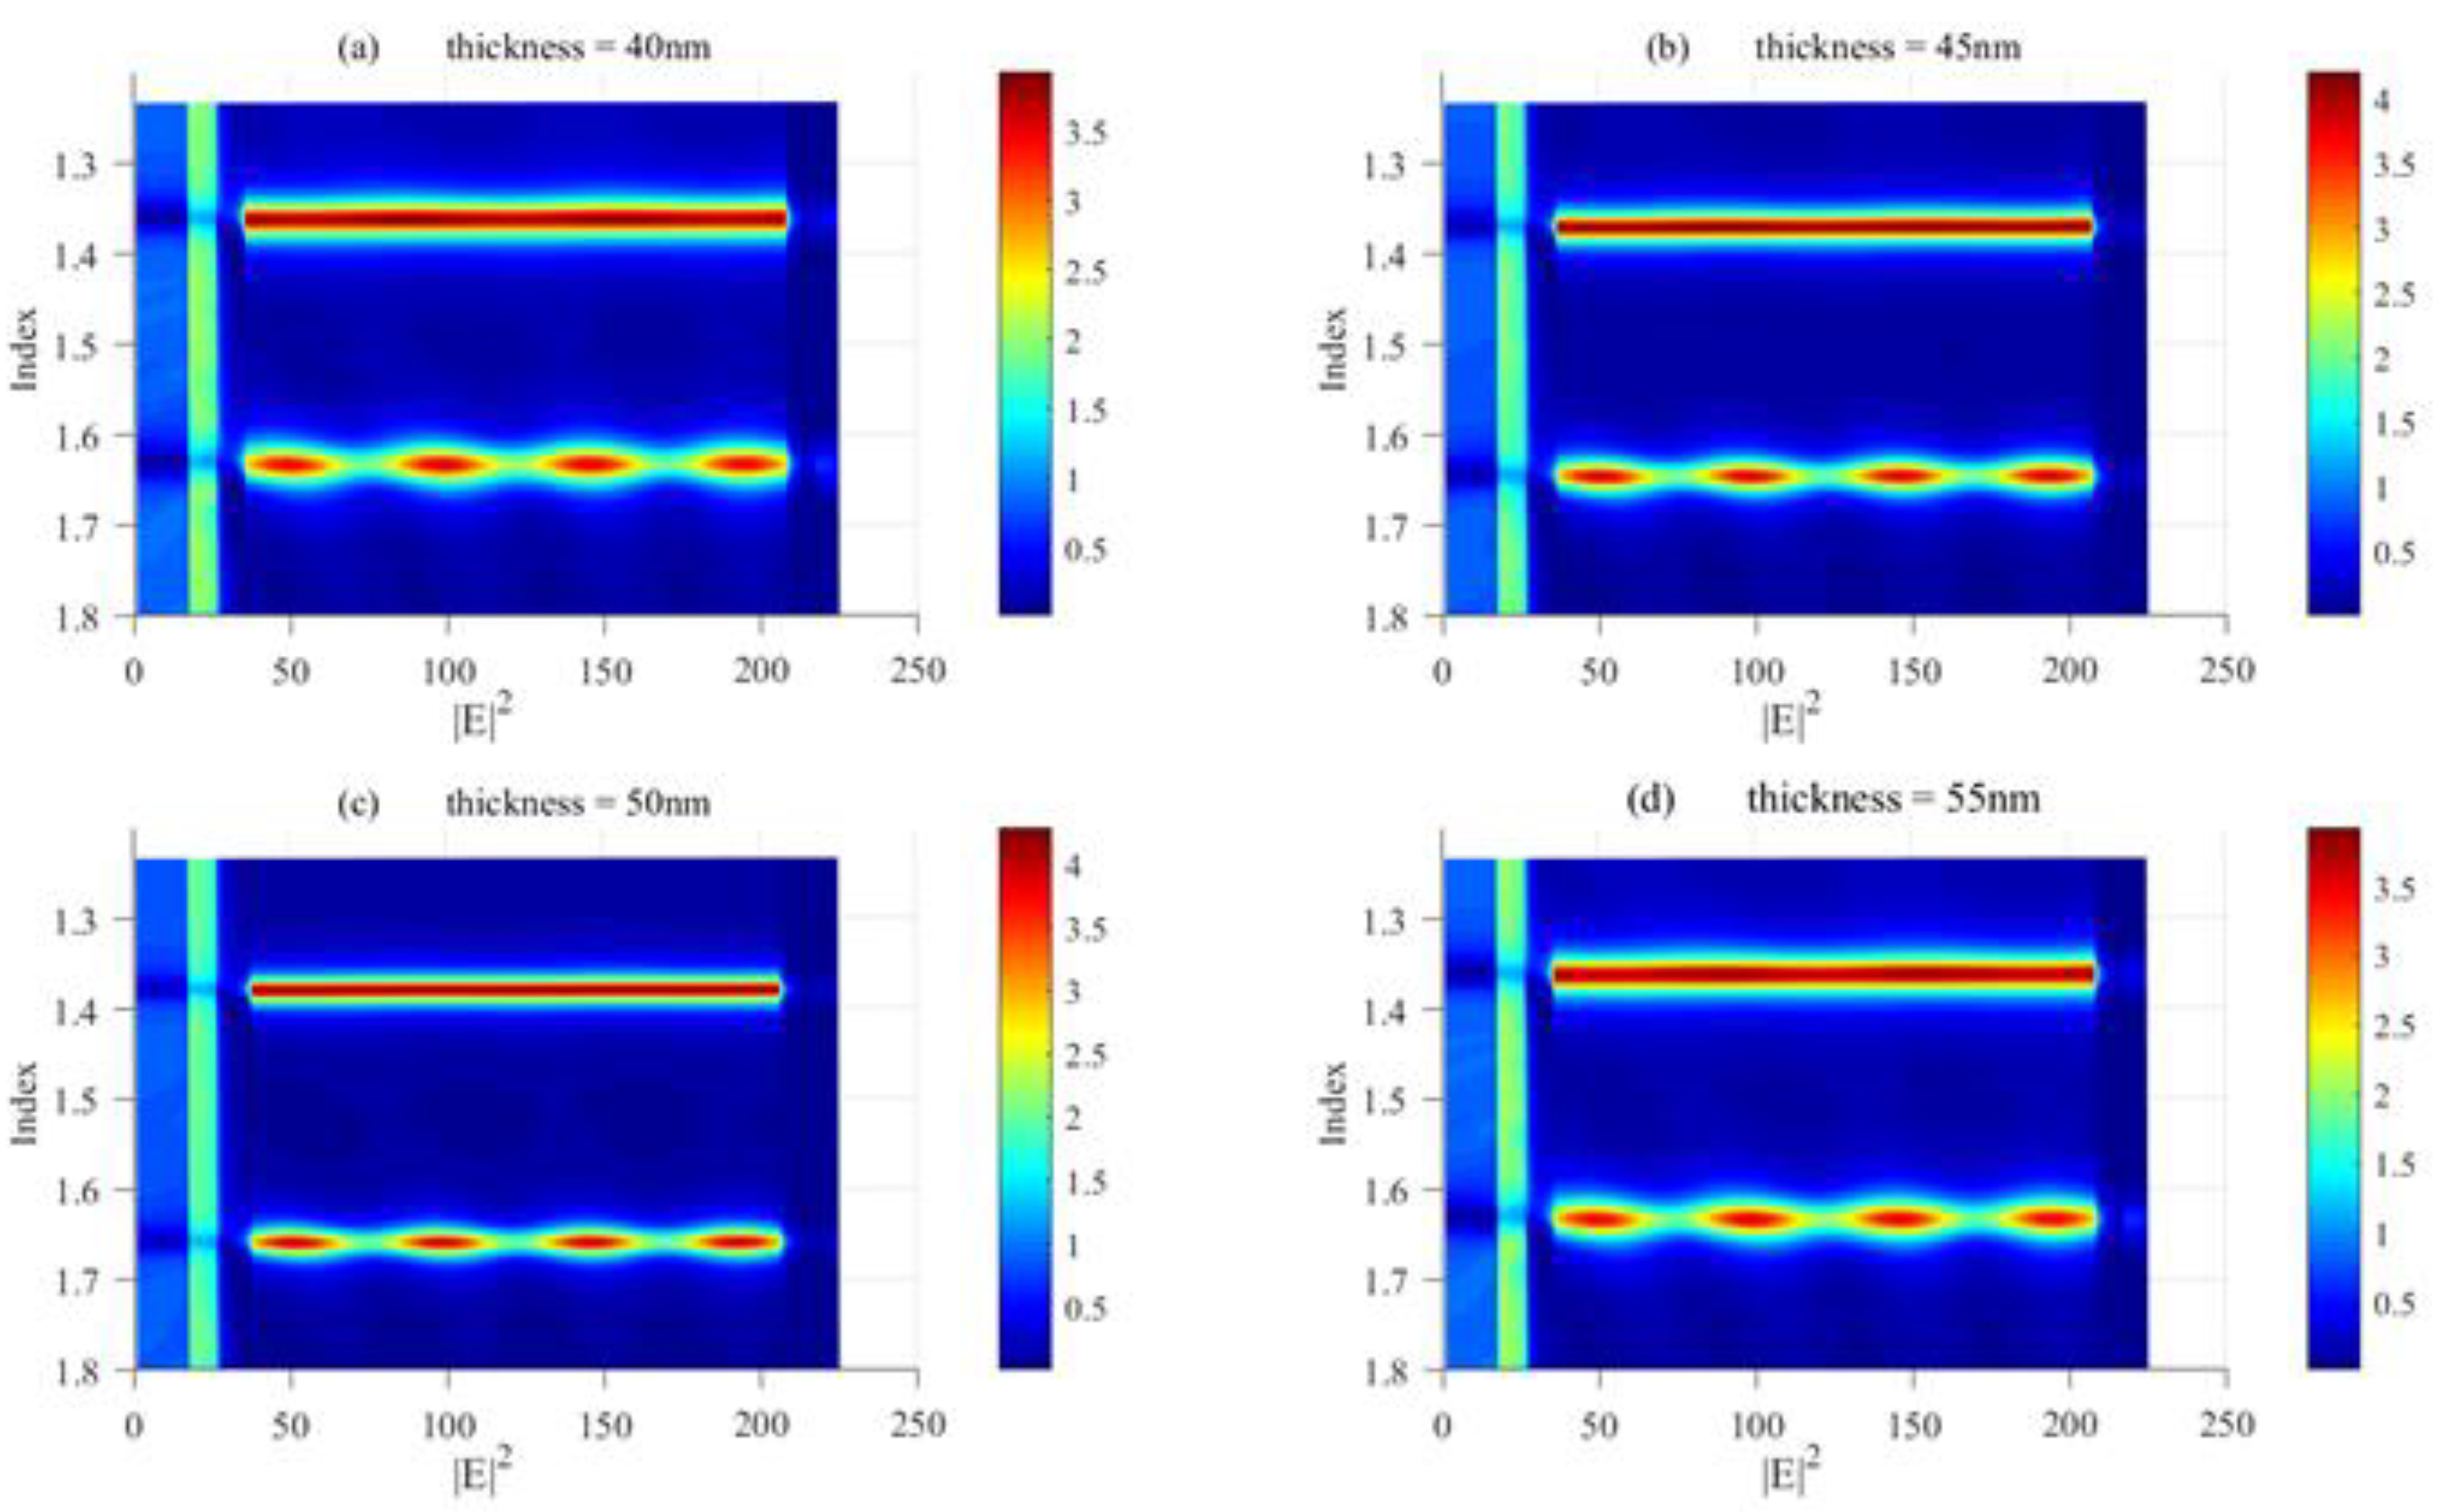
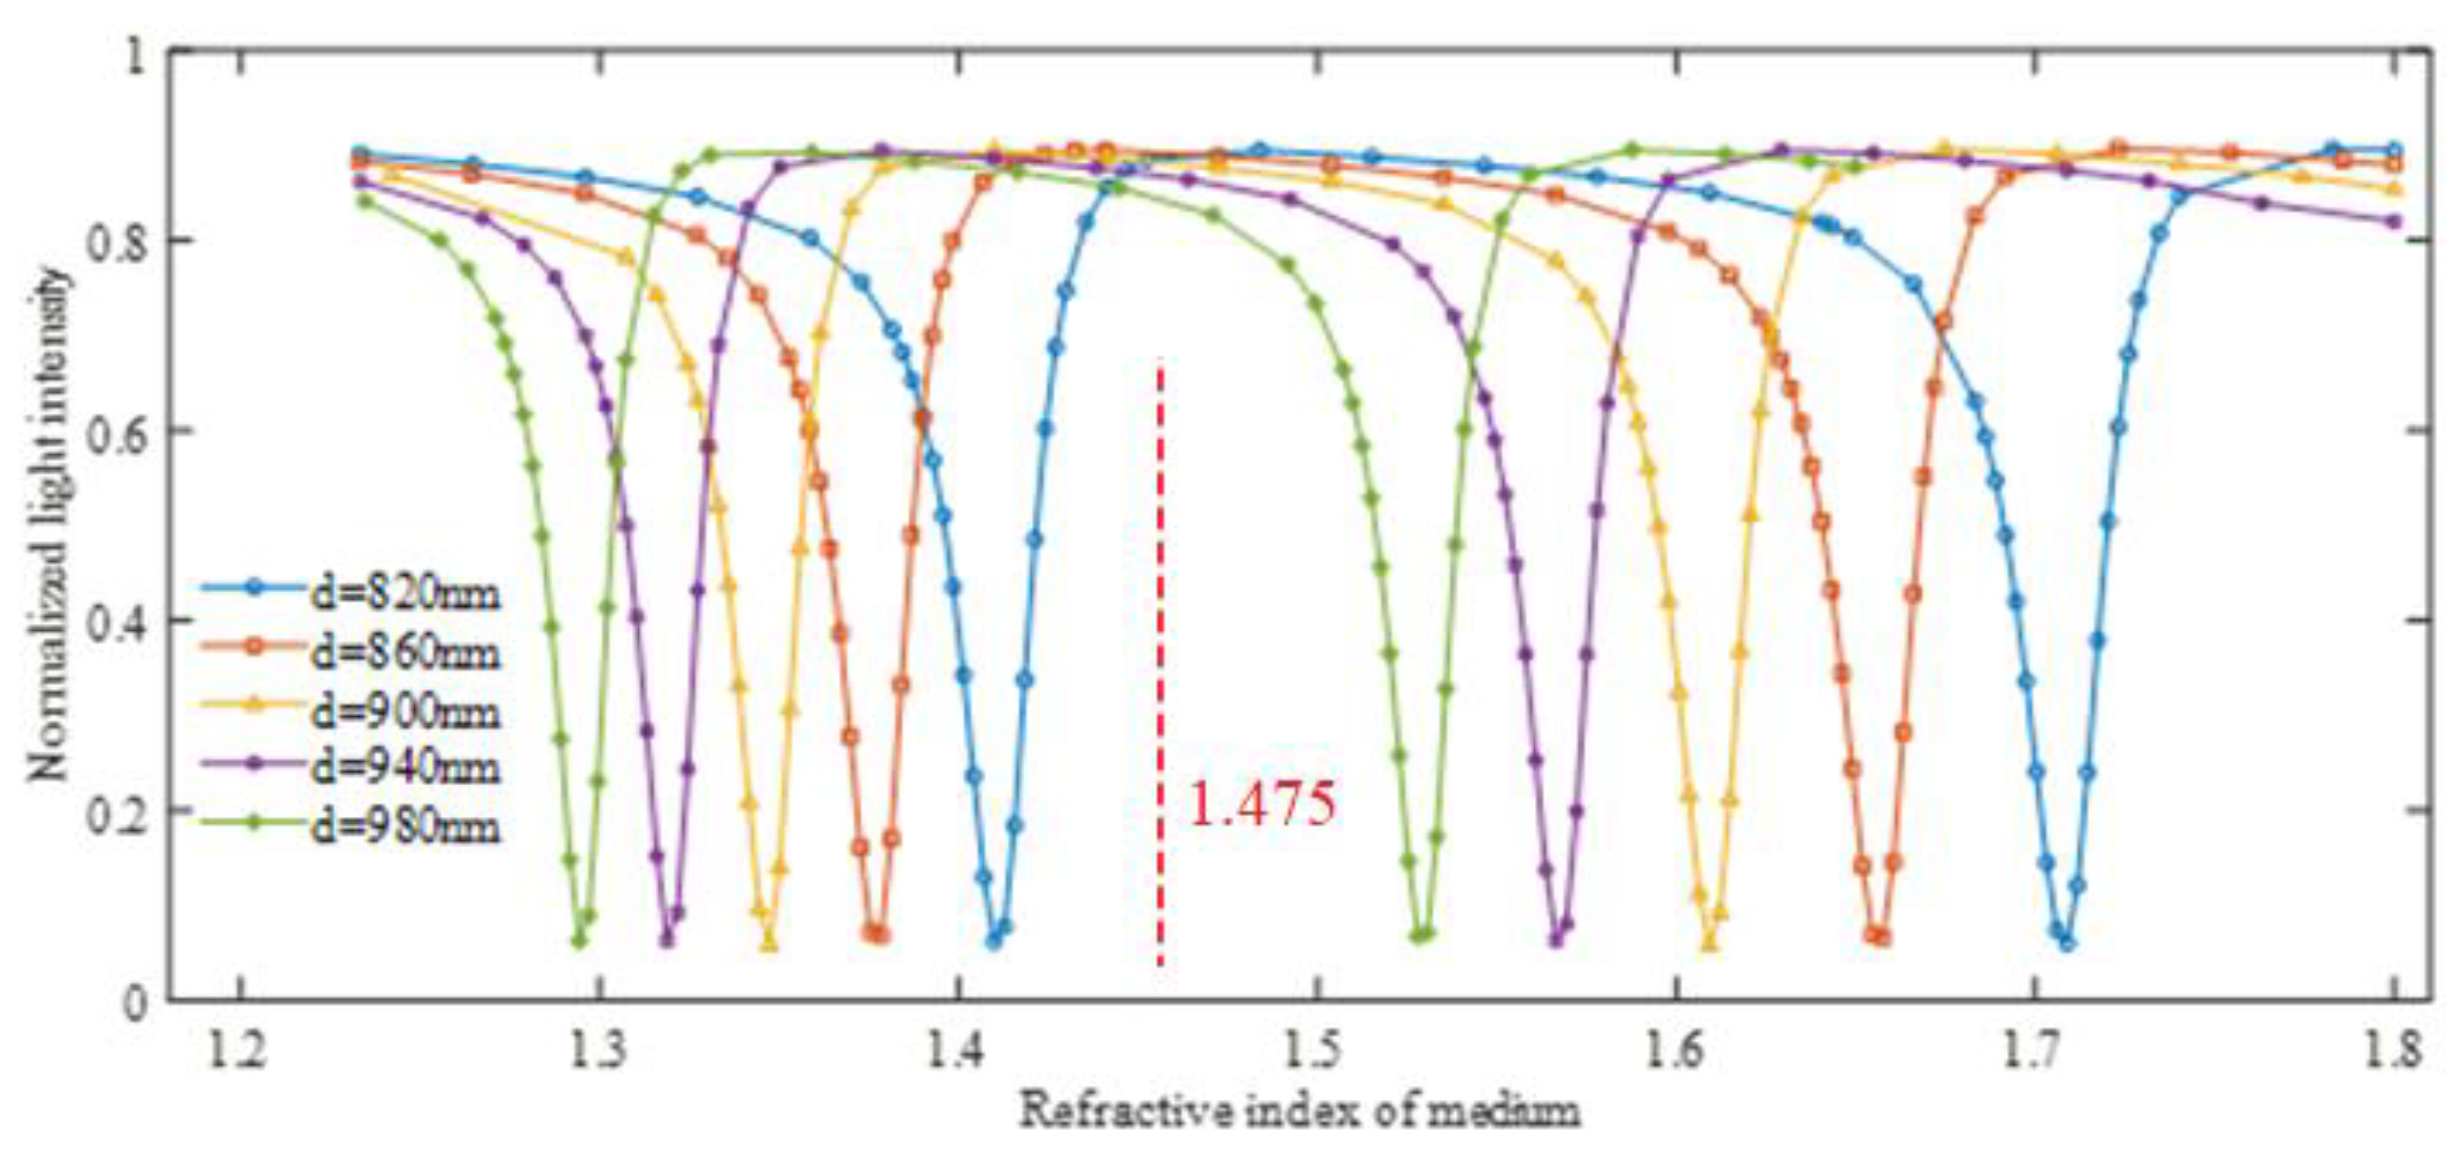
3.3. Dielectric Layer Thickness Influence on the LSPR Sensing Curve

According to the above model parameter study, it is determined that the thickness of the gold nano-disk layer is 45 nm and the disk diameter is 140 nm. Changing the thickness of the dielectric layer of the solution to be tested can adjust the linear sensing range of the sensor. When the thickness of the solution layer is between 820 and 980 nm, the quasi-linear RI sensing region is 1.294–1.737; the refractive index shown by the broken line in Figure 11 is 1.475; the dielectric layer is thinned; and the resonance peak curve has a low refractive index. The direction offset can be linearly fitted to a smaller area. However, the normalized reflected light intensity does not change, and the FWHW has almost no change, that is, the thickness of the adjustment medium does not affect the sensitivity of the sensor. To some extent, the sensor that forms the surface of the SPR film from nanogold disks is tunable. When the distance between the two layers is changed, the measurement range of the SPR sensor is changed. In the intensity resonance spectrum, the lowest point of the normalized reflected light intensity is the horizontal reference axis (horizontal double arrow) [33]. When a certain light intensity value corresponds to four refractive index points on the intensity spectrum, the refractive index rising region on the right side of the minimum light intensity refractive index point is selected as a fitting sensing channel, and the light intensity value on the spectral line is effectively positioned. Resonance sensing refractive index points improve detection accuracy and efficiency.

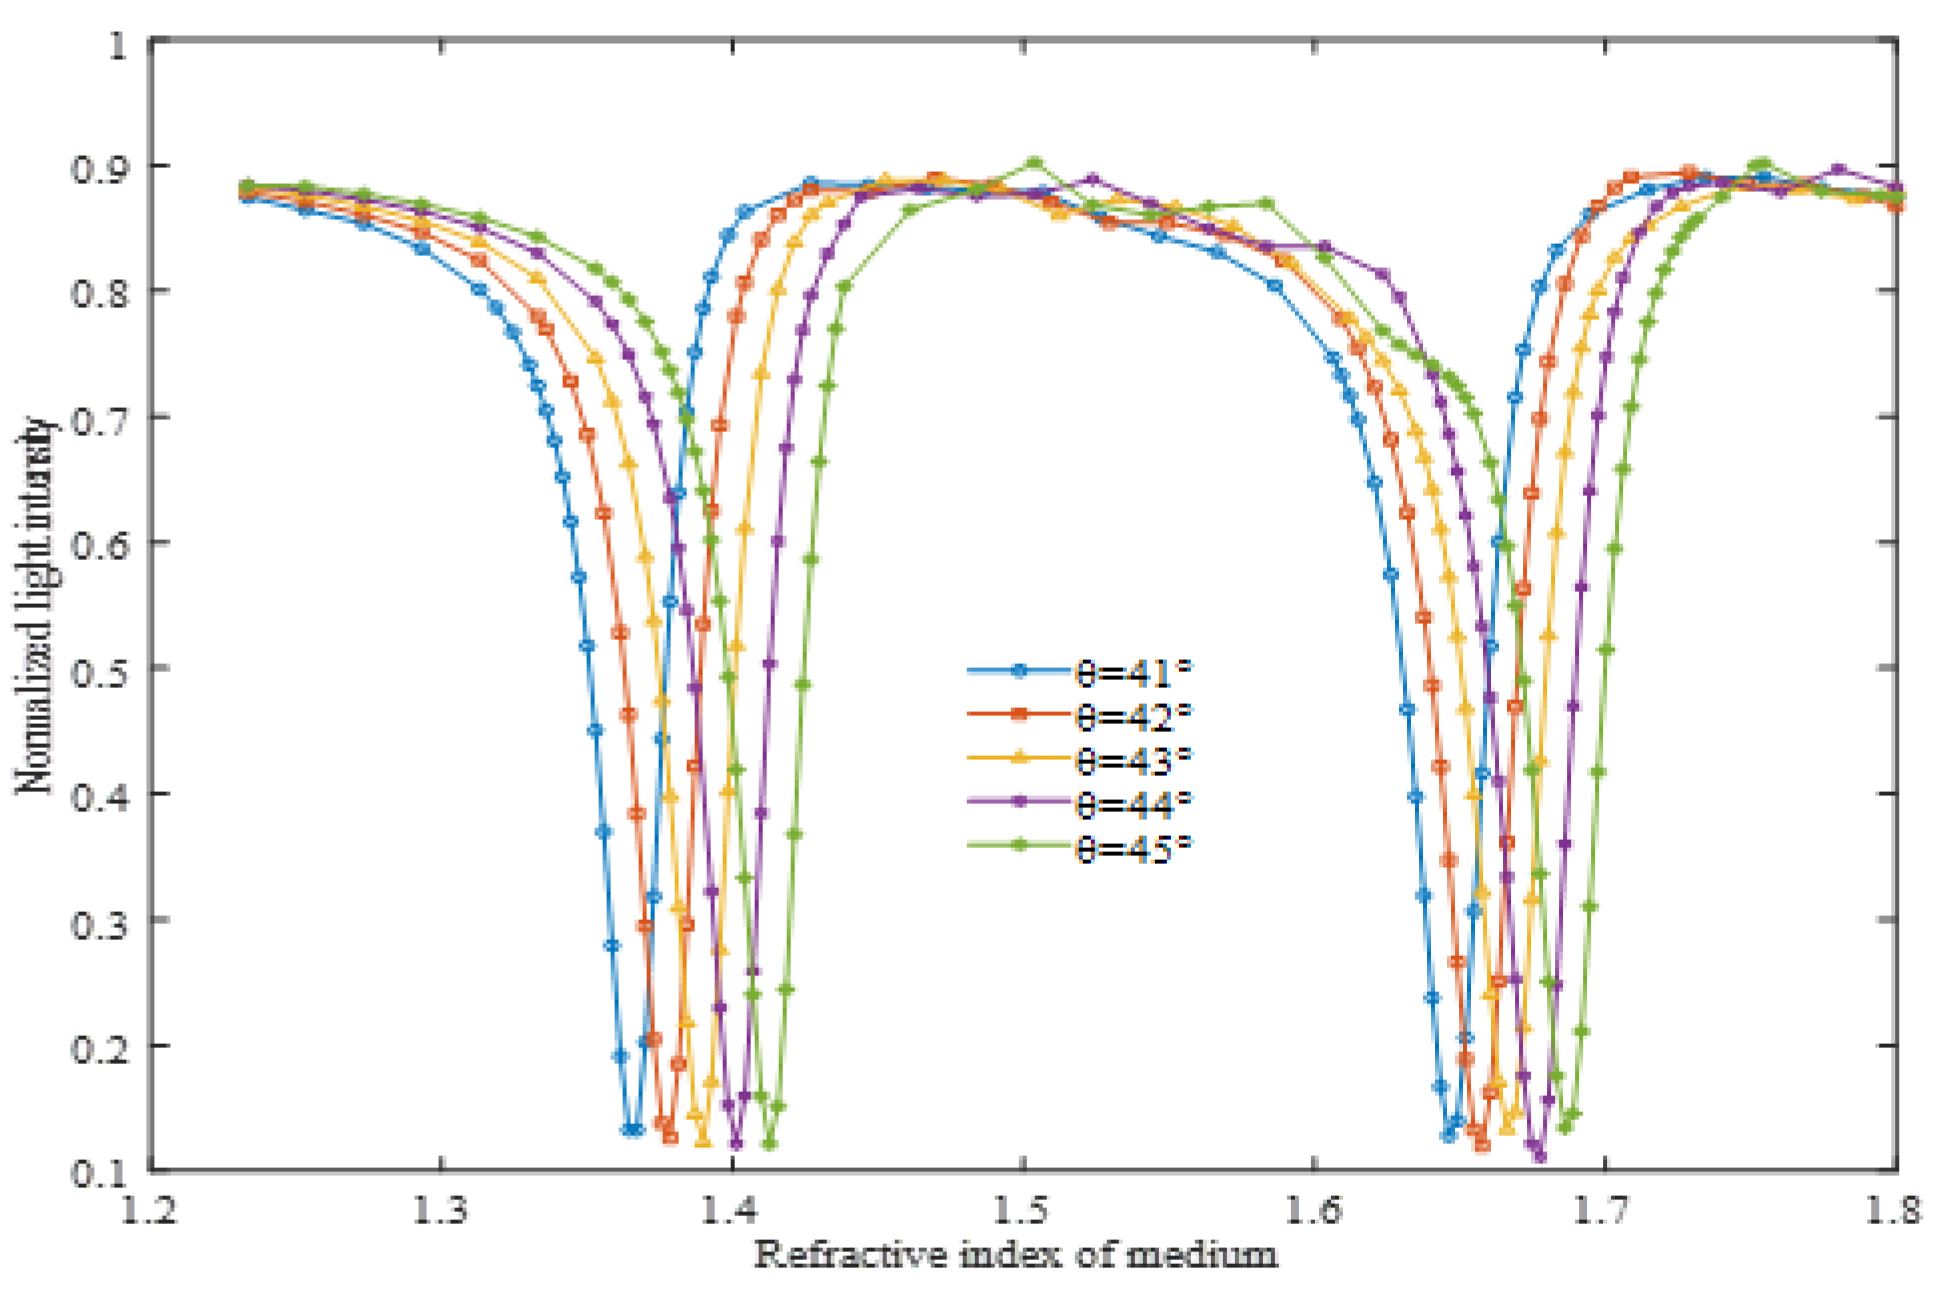
3.4. Effect of Incident Angles on SPR Sensing Curve

A group of structures with a thickness of 860 nm on the solution is selected, and the remaining parameters remain unchanged. The parameters of incident angle of the light source increases from 41 to 45, and the normalized light intensity minimum remains basically unchanged, all around 0.112. The shape and size of the curve remains almost unchanged, and the curve follows the incident angle in Figure 12. Increasing the horizontal shift to the direction of increasing refractive index, the full peak half width does not change. The offset of the angle reflection intensity curve is changed less than the offset of the reflected light intensity curve, which changes the thickness of the disc layer to be tested. This structure is shown to be more sensitive to angular of change. In the actual measurement process, to achieve the best linear fit matching of the RI detection range, we can first adjust the thickness of the solution to be measured (large range of coarse adjustment) and then control the angle of incidence (small range of fine adjustment).

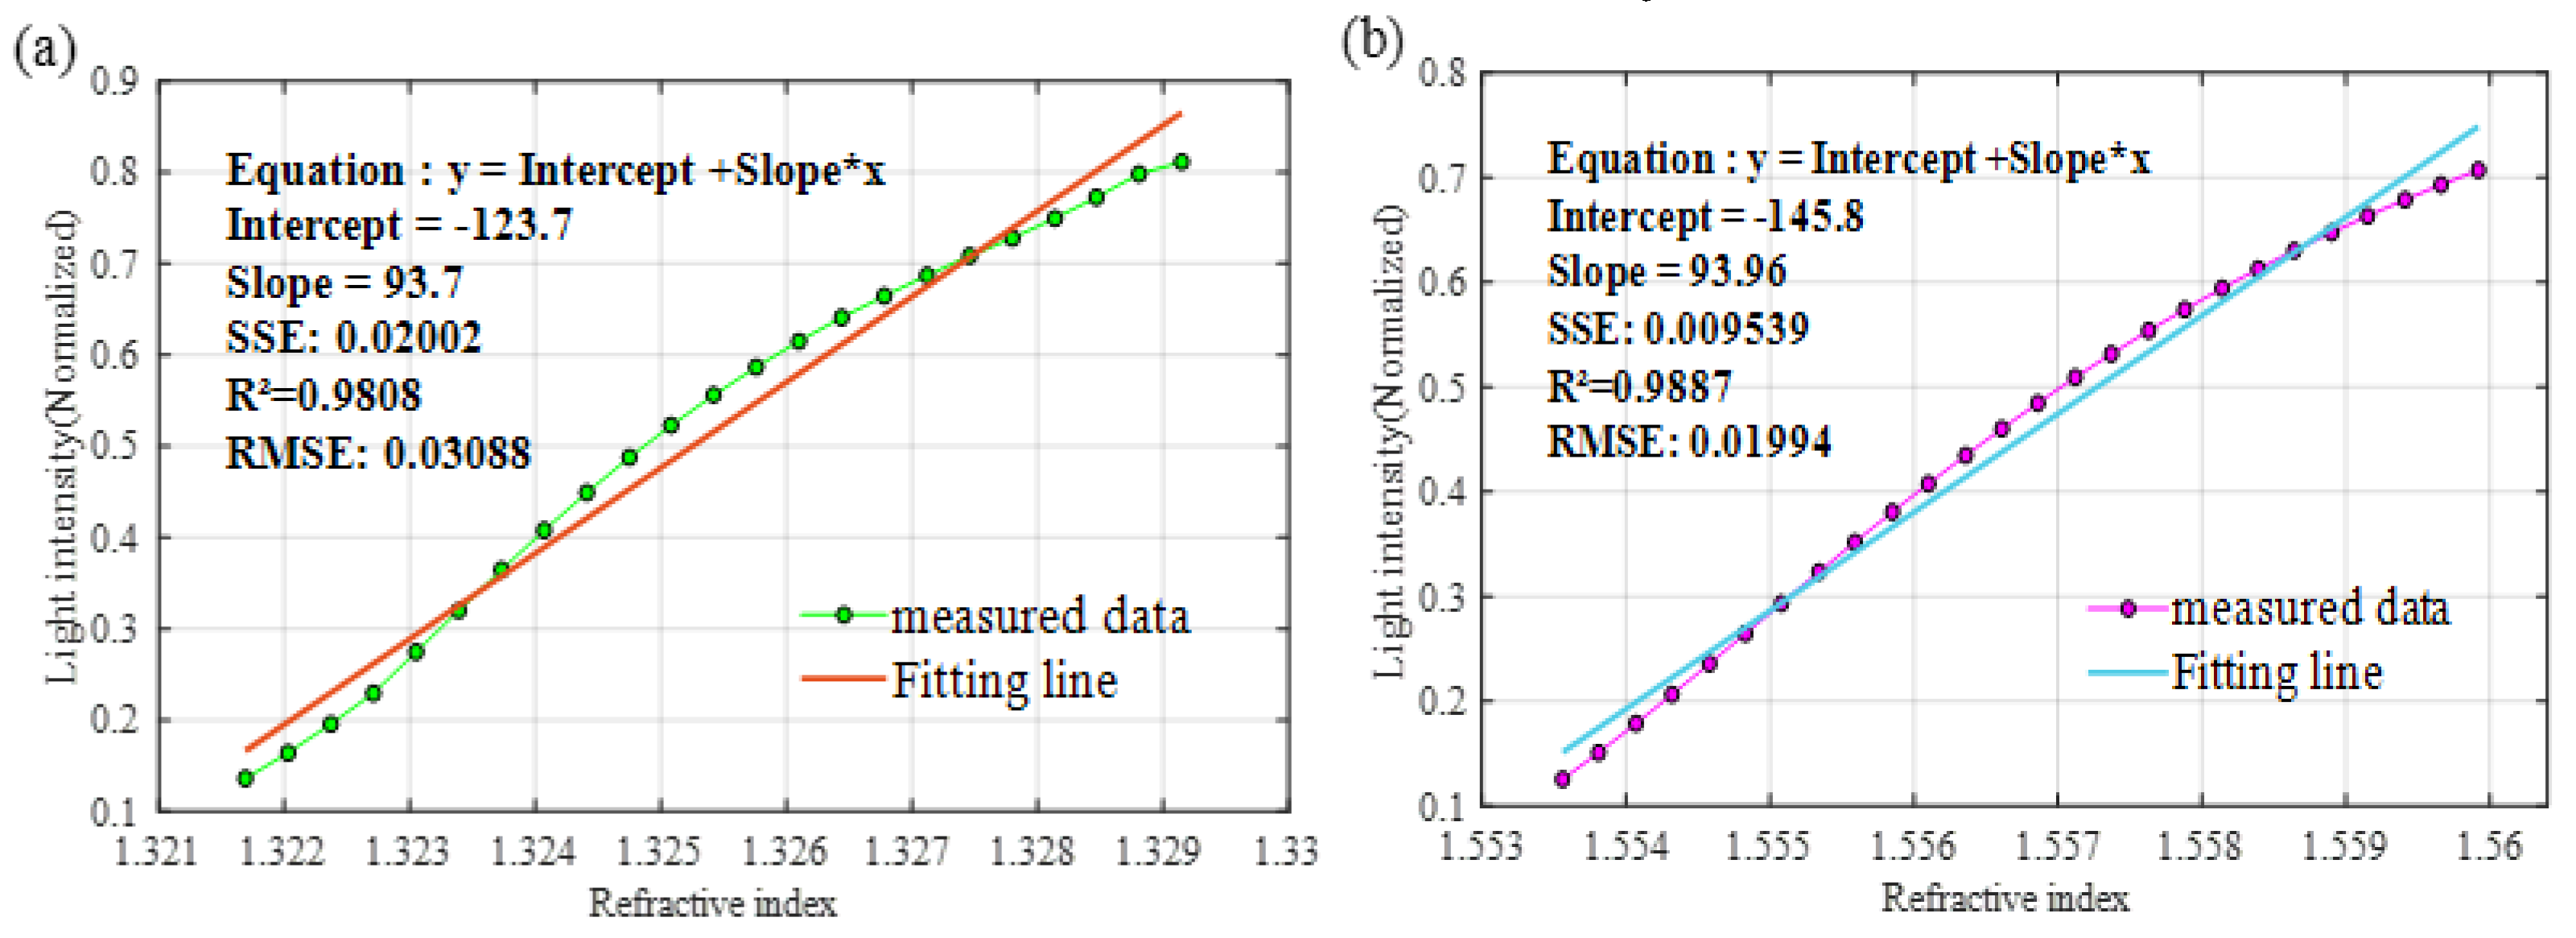
3.5. Linear Fitting Model

Extensive detection of water content in aqueous solutions has always been a problem in industry. By the “Lichtennecher” equivalent refractive index method, at 20 °C, the relationship between the water content of the honey aqueous solution and the refractive index satisfies y = −0.0025x + 1.537 [34], where x is the percentage of water content and y is the corresponding RI value. The RI of honey aqueous solution increases with the decrease of water content of honey aqueous solution and vice versa. The quantity varies from 1.287 to 1.537, and the coverage of conventional LSPR detection system is small. The structure of the detection system realizes a single inspection, multi-point sensing, to make up for the shortcomings of traditional instruments in large-scale refractive index detection. It can also improve sensitivity and resolution. The diameter of the golden nano-disk layer is 140 nm, the incident angle is 42°, the thickness of the dielectric layer is 860 nm, and the LSPR is excited by intensity modulation. As shown in Figure 13a,b, the LSPR structure proposed in this paper stimulates two collimated sensing channels in the RI range. The low RI channel range is 1.321–1.333 and the large channel range is 1.553–1.560. Fitting data points by least squares shows that the fitting coefficients are all greater than 0.99 and the maximum slope is 93.96. Among them, the low channel can be used to detect transparent solutions such as methanol solution. The high channel can be used to detect viscous and turbid solutions (such as honey in water) [35].

4. Conclusions

The simulation results of FDTD solutions show that the displayed double resonance peaks are caused by the second attenuation reflection of symmetric prism. The thickness and diameter of the symmetrical nano-disk array, the minimum attenuation of the double resonance peaks, and the half width of the full peak are analyzed synthetically, and the optimal resonance curve of the nano-disk array with different thickness and diameter is determined. The stability of the sensor was improved by adding graphene between the nano-disk and the silver film. Adding graphene can improve the stability of the system, which means that the solution oxidation of silver film is avoided from graphene coating, increasing the reliability of the system. Ultra-high strength graphene improves the performance of LSPR sensor. However, the effect of graphene thickness on the experimental results is not studied in this paper. By adjusting the incident angle of the source and the thickness of the solution layer, the matching of the wave front conditions in a wide RI range can be realized.
The LSPR sensor effective detection index range is 0.23177. For the low refractive index part, thin solution such as alcohol can be detected and, for the high refractive index part, dense colorless solution such as titanium tetrachloride can be detected. Overcoming the defect that the single-point LSPR detection system can detect a small refractive index range. The correlation coefficient of the fitting line of the sensor is superior to 0.98. High refractive index may not be of much use in current conditions, but it may play a role in biology to measure high refractive indices in the future. The LSPR sensor evidences that the proposed structure can achieve a wide range of measurement. In comparison with the traditional prism single point detection system, the LSPR sensor improves the detection efficiency of the sensor, realizes fast and accurate sensor measurement, and widens the method of developing a more practical and accurate tunable distributed LSPR sensor detection system. Additionally, the LSPR sensor provides theoretical and experimental basis for further quantitative analyses of specific molecular concentrations.

Author Contributions

Methodology, F.Y.; software, F.Y.; validation, J.L., H.Y. and A.K.; formal analysis, F.Y.; investigation, J.L.; resources, J.L.; data curation, F.Y.; writing—original draft preparation, F.Y.; writing—review and editing, A.K.; visualization, B.H.; supervision, J.L.; project administration, J.L.; funding acquisition, J.L. All authors have read and agreed to the published version of the manuscript.

Funding

This work was supported by National Natural Science Foundation of China under Grant 61701296, the Joint Funds of the National Natural Science Foundation of China (U1831133), a project supported by the Natural Science Foundation of Shanghai (17ZR1443500), and project supported by the Shanghai Aerospace Science and Technology Innovation Fund (SAST2017-062).

Conflicts of Interest

The authors declare no conflict of interest.

References

  1. Kodoyianni, V. Label-free analysis of biomolecular interactions using SPR imagin. Biotechniques 2011, 50, 32–40. [Google Scholar] [CrossRef] [PubMed]
  2. Brueck, S.R.J.; Diadiuk, V.; Jones, T.; Lenth, W. Enhanced quantum efficiency internal photoemission detectors by grating coupling to surface plasma waves. Appl. Phys. Lett. 1985, 46, 915–917. [Google Scholar] [CrossRef]
  3. Kretschmann, E.; Raether, H. Notizen: Radiative Decay of Non Radiative Surface Plasmons Excited by Light. Z. Für Nat. A 1968, 23, 2135–2136. [Google Scholar] [CrossRef]
  4. Harris, R.D.; Wilkinson, J.S. Waveguide surface plasmon resonance sensors. Sens Actuators B Chem. 1995, 29, 261–267. [Google Scholar] [CrossRef] [Green Version]
  5. Deng, H.Y. A universal macroscopic theory of surface plasma waves and their losses. J. Phys. 2019, 21, 20. [Google Scholar] [CrossRef]
  6. Yong, W.; Yudong, S.; Chunlan, L.; Yonghui, Z.; Xiangfei, N.; Zhihai, L.; Yu, Z.; Feng, P. Segmented detection SPR sensor based on seven-core fiber. Opt. Express 2017, 25, 21841–21850. [Google Scholar]
  7. Zhao, Y.; Wu, Q.-l.; Zhang, Y.-N. Simultaneous measurement of salinity, temperature and pressure in seawater using optical fiber SPR sensor. Measurement 2019, 148, 106792. [Google Scholar] [CrossRef]
  8. Zeng, S.; Baillargeat, D.; Ho, H.-P.; Yong, K.-T. Nanomaterials enhanced surface plasmon resonance for biological and chemical sensing applications. Chem. Soc. Rev. 2014, 43, 3426–3452. [Google Scholar] [CrossRef]
  9. Mihaela., P.; Camelia, B. SPR and SPR imaging: Recent trends in developing nanodevices for detection and real-time monitoring of biomolecular events. Sensors 2016, 16, 870. [Google Scholar]
  10. Smirnov, Y.; Smolkin, E. On the existence of non-polarized azimuthal-symmetric electromagnetic waves in circular dielectric waveguide filled with nonlinear isotropic homogeneous medium. Wave Motion 2018, 77, 77–90. [Google Scholar] [CrossRef]
  11. Singh, P. SPR Biosensors: Historical Perspectives and Current Challenges. Sens. Actuators B Chem. 2016, 229, 110–130. [Google Scholar] [CrossRef]
  12. Singh, M.; Datta, A. LSPR Excitation on Au Nanorings From Integrated Hybrid Plasmonic Aperture Waveguide and Its Application in Methanol Detection in the IR-Band. IEEE Sens. J. 2019, 19, 6119–6125. [Google Scholar] [CrossRef]
  13. Shi, D.Y.; Liu, G.; Zhang, H.; Ren, W.H.; Wang, Q.S. A three-dimensional modeling method for the trapezoidal cavity and multi-coupled cavity with various impedance boundary conditions. Appl. Acoust. 2019, 154, 213–225. [Google Scholar] [CrossRef]
  14. Sheng, X.; Liu, J.; Yang, H.; Chen, L.; Li, J.; Liu, H. Optimization of tunable symmetric SPR sensor based on Ag-graphene. Optik 2019, 184, 339–347. [Google Scholar] [CrossRef]
  15. Schriver, M.; Regan, W.; Gannett, W.J.; Zaniewski, A.M.; Crommie, M.F.; Zettl, A. Graphene as a Long-Term Metal Oxidation Barrier: Worse Than Nothing. ACS Nano 2013, 7, 5763–5768. [Google Scholar] [CrossRef] [PubMed]
  16. Kim, S.-W.; Lee, J.-S.; Lee, S.-W.; Kang, B.-H.; Kwon, J.-B.; Kim, O.-S.; Kim, J.-S.; Kim, E.-S.; Kwon, D.-H.; Kang, S.-W. Easy-to-Fabricate and High-Sensitivity LSPR Type Specific Protein Detection Sensor Using AAO Nano-Pore Size Control. Sensors 2017, 17, 856. [Google Scholar] [CrossRef] [Green Version]
  17. Jing, J.-Y.; Wang, Q.; Zhao, W.-M.; Wang, B.-T. Long-range surface plasmon resonance and its sensing applications: A review. Opt. Lasers Eng. 2019, 112, 103–118. [Google Scholar] [CrossRef]
  18. Wang, H.Y.; Song, W.Q.; Zio, E.; Wu, F.; Zhang, Y.Y. Remaining Useful Life Prediction for Lithium-ion Batteries Using Fractional Brownian Motion and Fruit-fly Optimization Algorithm. Measurement 2020, 161, 107904. [Google Scholar] [CrossRef]
  19. Gao, Y.; Villecco, F.; Li, M.; Song, W. Multi-Scale Permutation Entropy Based on Improved LMD and HMM for Rolling Bearing Diagnosis. Entropy 2017, 19, 176. [Google Scholar] [CrossRef] [Green Version]
  20. Farmani, A.; Mir, A. Graphene Sensor Based on Surface Plasmon Resonance for Optical Scanning. IEEE Photonics Technol. Lett. 2019, 31, 643–646. [Google Scholar] [CrossRef]
  21. Dewan, S.; Paliwal, A.; Tomar, M.; Kapoor, A.K.; Tandon, R.P.; Gupta, V. Surface plasmon resonance aided analysis of quantum wells for photonic device applications. Mater. Des. 2018, 150, 94–103. [Google Scholar] [CrossRef]
  22. Peterson, A.W.; Halter, M.; Tona, A.; Bhadriraju, K.; Plant, A.L. Surface plasmon resonance imaging of cells and surface-associated fibronectin. BMC Cell Biol. 2009, 10, 16. [Google Scholar] [CrossRef] [Green Version]
  23. Oh, S.Y.; Lee, M.J.; Heo, N.S.; Kim, S.; Oh, J.S.; Lee, Y.; Jeon, E.J.; Moon, H.; Kim, H.S.; Park, T.J.; et al. Cuvette-Type LSPR Sensor for Highly Sensitive Detection of Melamine in Infant Formulas. Sensors 2019, 19, 3839. [Google Scholar] [CrossRef] [Green Version]
  24. Martínez-Hernández, M.E.; Goicoechea, J.; Arregui, F.J. Hg2+ Optical Fiber Sensor Based on LSPR Generated by Gold Nanoparticles Embedded in LBL Nano-Assembled Coatings. Sensors 2019, 19, 4906. [Google Scholar] [CrossRef] [PubMed] [Green Version]
  25. Descrovi, E. Resonant diffraction of symmetric and antisymmetric Bloch surface waves on a corrugated periodic multilayer slab. Opt. Lett. 2009, 34, 1973–1975. [Google Scholar] [CrossRef] [PubMed]
  26. Song, W.Q.; Cattani, C.; Chi, C.H. Multifractional Brownian Motion and Quantum-Behaved Particle Swarm Optimization for Short Term Power Load Forecasting: An Integrated Approach. Energy 2020, 194, 116847. [Google Scholar] [CrossRef]
  27. Chen, W.; Hu, X. Intensity modulation in laser with asymmetric optical feedback. Optik 2016, 127, 2083–2085. [Google Scholar] [CrossRef]
  28. Cennamo, N.; Trigona, C.; Graziani, S.; Zeni, L.; Arcadio, F.; Pasquale, G.D.; Pollicino, A. An Eco-Friendly Disposable Plasmonic Sensor Based on Bacterial Cellulose and Gold. Sensors 2019, 19, 4894. [Google Scholar] [CrossRef] [Green Version]
  29. Liu, H.; Song, W.Q.; Li, M.; Kudreyko, A.; Zio, E. Fractional Lévy stable motion: Finite difference iterative forecasting model. Chaos Solitons Fractals 2020, 133, 109632. [Google Scholar] [CrossRef]
  30. Song, W.Q.; Cheng, X.X.; Cattani, C.; Zio, E. Multifractional Brownian Motion and Quantum-Behaved Partial Swarm Optimization for Bearing Degradation Forecasting. Complexity 2020. [Google Scholar] [CrossRef]
  31. White, M.; Oveys, I.H.; Fan, X. Liquid-core optical ring-resona.tor sensors. Opt. Lett. 2006, 31, 1319–1321. [Google Scholar] [CrossRef] [PubMed]
  32. Madani, A.; Naz, E.S.G.; Harazim, S.; Kleinert, M.; Yin, Y.; Ma, L.; Schmidt, O.G. Multiplexing and tuning of a double set of resonant modes in optical microtube cavities monolithically integrated on a photonic chip. Opt. Lett. 2018, 43, 4703–4706. [Google Scholar] [CrossRef] [PubMed]
  33. Cheema, M.I.; Shi, C.; Armani, A.M.; Kirk, A.G. Optimizing the Signal to Noise Ratio of Microcavity Sensors. IEEE Photonics Technol. Lett. 2004, 26, 2023–2026. [Google Scholar] [CrossRef]
  34. Abbas, M.; Harazim, S.M.; Quiñones, V.A.B.; Moritz, K.; Andreas, F.; Saei, G.N.E.; Libo, M.; Schmidt, O.G. Optical microtube cavities monolithically integrated on photonic chips for optofluidic sensing. Opt. Lett. 2017, 42, 486. [Google Scholar]
  35. Zhou, X.; Zhang, L.; Armani, A.M.; Zhang, D.; Duan, X.; Liu, J.; Zhang, H.; Pang, W. On-chip biological and chemical detection with reversed Fano line-shape enabled by embedded microring resonators. IEEE J. Sel. Top. Quantum Electron. 2014, 20, 5200110. [Google Scholar] [CrossRef]
Figure 1. (a) Schematic diagram of the LSPR with prism; and (b) a fragment of the membrane with symmetrical sensing chip.
Symmetry 12 00841 g001
Figure 2. Absorption intensity curve of gold disk film with different thickness.
Symmetry 12 00841 g002
Figure 3. Reflected intensities for different spacing between.
Symmetry 12 00841 g003
Figure 4. Distribution of electric field intensity under different thicknesses.
Symmetry 12 00841 g004
Figure 5. Reflection intensity of different apertures with the same thickness.
Symmetry 12 00841 g005
Figure 6. Reflective intensity of gold disks with different diameters at 45 nm thickness.
Symmetry 12 00841 g006
Figure 7. Three kinds of prism with one side structure.
Symmetry 12 00841 g007
Figure 8. Reflection intensity curves of three structures.
Symmetry 12 00841 g008
Figure 9. Quality factor for different thicknesses and diameters.
Symmetry 12 00841 g009
Figure 10. Local surface plasma with d1 = 45 nm, d2 = 140 nm, d3 = 3.35 nm, and d4 = 35 nm.
Symmetry 12 00841 g010
Figure 11. Reflectance intensity curves for different solution media thicknesses.
Symmetry 12 00841 g011
Figure 12. Reflected light intensities versus refractive indexes for different incident angles.
Symmetry 12 00841 g012
Figure 13. Fitting line of two sensing channels with double resonance peaks. (a) Refractive index of low concentration (b) Refractive index of high concentration.
Symmetry 12 00841 g013
Table 1. Parameters of three kinds of structures.
Three Kinds of StructureΔRTΔnFWHWFOM
prism + disc0.60220.3280.024772
prism + silver film + disc0.81710.2420.0113069
prism + silver film + graphene + disc0.69140.2760.0181391

