Article

Similar Seismic Activities Analysis by Using Complex Networks Approach

1
College of Medicine & Biological Information Engineering, Northeastern University, Shenyang 110169, China
2
School of Computer Science & Engineering, Northeastern University, Shenyang 110169, China
*
Author to whom correspondence should be addressed.
Symmetry 2020, 12(5), 778; https://doi.org/10.3390/sym12050778
Submission received: 15 April 2020 / Revised: 27 April 2020 / Accepted: 7 May 2020 / Published: 7 May 2020

Abstract

:
Seismic activities show a space-time symmetry in some research. They have been recently studied using complex network theory. Earthquake network similarity is studied by us from seismic catalogs in the same region for a given period of time. In this paper, we first calculate the distance between feature vectors which represent the topological properties of different networks. A hierarchical clustering of earthquake networks in the same region is shown by using this method. It is found that similar networks are not the networks of adjacent years but those with decades time difference. To study the period of similar earthquake networks in the same region, we use wavelet analysis to obtain the possible periods at different time scales of the regions of the world, California and Japan. It is found that some of the possible periods are consistent with the results which have been already found by seismologists. The study of similar seismic activities from the perspective of the complex network will help seismologists to study the law of earthquake occurrence in a new way, which may provide possible research thinking for earthquake prediction.

1. Introduction

Complex networks have been applied in various complex systems. Some important fields, such as biology [1], economics [2,3], social sciences [4,5], computer science [6], and transportation [7], are covered in these systems. Researchers describe and explain the complex interactions among components in the systems from a novel perspective [8]. Particularly, complex network theory has been applied to the seismic activity in the past two decades [9,10,11,12,13,14,15,16,17,18,19,20,21,22]. The network properties of seismicity has been calculated and analyzed by using network theory. These characteristics help us in understanding possible relevance of various seismic phenomena.
Abe and Suzuki first studied seismic activity by the approach of a complex network. An earthquake network was proposed considering event time series by Abe and Suzuki. They analyzed the complex network properties of seismicity [9]. They found that the earthquake network is a scale-free [9] and small-world [10] network. The network also shows hierarchical clustering as well as mixing properties, which explained the important role of weak earthquakes for deeper understanding of seismicity [11]. Other researchers also did plenty of valuable work. Some of them focused on how to construct an earthquake network by using similar activity patterns [12], mutual information [13], space–time influence domain [14], hybrid model [15], etc. In particular, the models using similar activity patterns have been useful for earthquake prediction [23,24,25] when applying natural time analysis [26,27]. Some of the researchers studied the network topological characteristics [16], dynamic evolution [17], and centrality [18] of earthquake networks, aiming to explain their physical meaning of seismic phenomenon by complex networks.
Network topological characteristics, such as the average shortest path, clustering coefficient, degree distribution, and so on, have been studied widely in various earthquake networks. Abe and Suzuki found that before main shocks, the clustering coefficient is stable [19] while the modularity presents a large value [20]. However, they both change suddenly when the main shocks occur. Lin et al. found that before main shocks occurring, the network structure entropy presents a small value, but suddenly jump to a great value when the main shocks occur. Then it recovered to normal values gradually [21]. These characteristics indicate the underlying organizational principles of earthquake networks. Changes in the structure of the network, as determined by the evolution of these characteristics, have suggested precursory before main shocks occurrence. However, they did not show consistent fluctuations trend before the main shock. Single topological characteristics or indicator can only describe the feature of seismicity from one particular perspective. In this study, we use these features combined to describe an earthquake network feature from multi-dimension study.
The earthquake network similarity in the same geographical region for a given period of time will be studied in this paper aiming to find the similar seismic activities. We believe it is necessary to combine the different indicators to comprehensively assess the network similarity. In this way, we analyze the multivariate features of similar seismic activities in the same region from the perspective of complex network.
The rest of this paper is organized as follows. In Section 2, the data used in our study is introduced in detail. The network construction method and relevant data preprocessing method are also introduced in this section. Several relevant definitions about network properties are introduced and a multivariate network similarity assessing method is proposed in Section 3. The hierarchical clustering result is shown in Section 4, and the definition of wavelet analysis and its application in the period analysis of seismicity are introduced in this section. Finally, in Section 5, the discussions of this paper are presented.

2. Data and Network Construction

Earthquakes occur frequently in seismically active zones. A large number of seismic data records in these areas are conducive to the analysis of seismic activity. Three data sets with a large number of records are applied in this paper. More information for these data sets is shown in Table 1.
Through the analysis of distances and time intervals between successive earthquakes using non-extensive statistical mechanics, Abe and Suzuki have found that two successive earthquakes are indivisibly correlated, no matter how much spatially far they are from each other [28]. Some researchers [29,30,31] provided the evidence that earthquakes around the world are not independent. They found the physical mechanism of time and spatial symmetry of earthquakes. So in our study, we are also interested in the study of global networks.
a
Southern California Seismic Network (SCSN). California belongs to the Pacific Rim seismic zone, where earthquakes occur frequently. The center provides seismic data for the California region for more than 80 years from 1932 to the present, with more than 500,000 public seismic records. With the continuous improvement of data acquisition and measurement methods, SCSN has more than 400 detection stations in different places.
b
Japan University Network Earthquake Catalog (JUNEC). Japan is located at the junction of the Asia–Europe plate and the Pacific plate, belongs to the Pacific Rim seismic zone. The crustal movement is active, so Japan is a country with frequent earthquakes. JUNEC provides seismic data for the geographical region of Japan from 1985 to 1998.
c
Advanced National Seismic System (ANSS). ANSS includes a national Backbone network, the National Earthquake Information Center (NEIC), the National Strong Motion Project, and 15 regional seismic networks operated by USGS and its cooperative organizations. This system provides a huge amount of worldwide seismic data, close to 3 million records.
These three data sets all include date, exact time of occurrence, geographical location of the epicenter, and magnitude for each event. epicenter, and magnitude for each event. In particular, the earthquakes with magnitude M ≥ 3.0 are only considered due to the completeness of the catalog of California and Japan. Since the global seismic data is relatively stable above 4.0 by ANSS, we use 4.0 as the magnitude threshold of global seismicity. The geographical location of the epicenter is specified by latitude ( θ ) and longitude ( ϕ ). The minimum and maximum values of the latitude–longitude coordinates, i.e., ( θ 0 , θ m a x ) and ( ϕ 0 , ϕ m a x ) characterize the extent of a certain region. The entire region is divided into equally-sized cells, following the approach in Ref. [9]. Here, the North-South distance between ( θ i , ϕ i ) and ( θ 0 , ϕ 0 ) is d i N S = R ( θ i θ 0 ) and the East-West distance is d i E W = R ( ϕ i ϕ 0 ) cos θ a v , where the radius of the earth is R 6370 km and θ a v is the average of latitude of all the events. In this method, the cell size C S is the parameter of the model. We can obtain the cell coordinate of event i by calculating d i N S / C S and d i E W / C S .
We use our method (space-time influence domain) to construct an earthquake network [14]. We first divide the chosen geographical region into small equal cells, following Abe and Suzuki’s method [9]. If any event occurred in a cell, the cell is represented by a node in the network. Then we use a space-time correlation metric to link a pair of events. The metric is based on the discovery by J.K. Gardner et al. [32] that an earthquake with a certain magnitude will influence certain areas in a certain time range. If its magnitude is bigger, the value of time and space influence will be bigger. They found the formulas of influence time and radius of an earthquake with a given magnitude. So our process of constructing earthquake network is as follows. From the first record i of the earthquake catalog, we calculate its space-influence region L i and time-influence T i according to its magnitude M. For any event j occurring after i, the time interval Δ t and distance Δ d between event i and j are calculated. If Δ t and Δ d both satisfy the constraints: Δ t T i , Δ d L i , then it will generate a link from the node of event i to that of event j. From the first record in the earthquake catalogue under consideration, this procedure is replicated until all the events in the catalogue have been processed. After processing all the events in this way from the earthquake catalog under consideration, an earthquake network is constructed. We found that the earthquake network exhibits a scale-free and small-world nature [14]. We verified the hierarchical structure of the earthquake and using k-core decomposition to reveal the feature of the highest core [33]. In addition, we also made preliminary relation prediction for a pair of nodes [34].
It is worth noting that the cell here is a two-dimensional not a three-dimensional since more than 80% of the earthquakes occurred in-depth less than 20 km. Moreover, we set the length of the cell, which employed to divide the geographical region, to 20 km according to the approach [35].
Here, the weight w i j of a link is the total number of edges between two connected nodes i and j. In the earthquake network based on the space-time influence domain, w i j means the degree of correlation between nodes i and j. An unweighted network is often used to investigate the network structure while a weighted network is often used to study the interactive process of network flows. As our interests are in the study of earthquakes in the same geographical region among different time spans, we focus on the weighted earthquake network in our study. The earthquake topological structure of California is shown in Figure 1. We can see from Figure 1, the east and southeast part of the network is highly clustered, showing frequent seismic activities.

3. Method

3.1. Basic Network Properties

In the context of earthquake network, degree distribution [9], clustering coefficient [10] and average path length [10] are usually investigated. In addition, the change of some properties including average node strength [36], coreness [33], and entropy [21] are found to be correlated with seismic activities. We briefly introduce the definitions of these network properties. First, let G = ( V , E ) be a graph with | V | = n nodes and | E | = e edges. The definitions about these properties are as follows:
a
Degree distribution is the probability distribution of the degrees k over the whole network. Scale-free property of earthquake networks with P ( k ) k λ has been studied by many studies [9,14,16]. The exponent λ is proved to approach a fixed value, remaining invariant, as the cell size becomes larger than a certain value [35].
b
Strength of the i t h node is defined as s i = j w i j , where w i j is the weight of a connection between two different nodes as mentioned before. Here we use average strength S = ( i = 1 n s i ) / n to describe the average influencing degree among nodes in the network. It has been observed that the probability distributions of nodal strengths follow power law decay forms. Chakraborty et al. used strengths to analyze the rich-club feature in the weighted earthquake network. However, this feature is not found in unweighted network [36].
c
Clustering coefficient is the ratio of existing edges connecting a node’s neighbors to each other to the maximum possible number of such edges. The weighted clustering coefficient [37] is defined as C w ( i ) = ( 1 s i ( k i 1 ) ) j , h ( ( w i j + w i h ) / 2 ) a i j a i h a j h where a i j (s) are the elements of the adjacency matrix. The average clustering coefficient is defined by C = ( i = 1 n C w ( i ) ) / n . The clustering coefficient has been investigated in many studies of earthquake network [10,14,19]. It implies the degree of clustering of the network. Abe et al. found that before main shocks, the values of the clustering coefficient is stable but suddenly jump up when the main shocks occur, and then slowly decay following a power law to become stable again [19].
d
Average path length l is defined as the average number of steps along the shortest paths for all possible pairs of network nodes. Let l ( v 1 , v 2 ) , where v 1 , v 2 V , denotes the shortest distance between v 1 and v 2 . Then, the average path length L is L = 1 n ( n 1 ) i j l ( v 1 , v 2 ) . Many researchers have found that earthquake networks have a very short average path length leading to the concept of a small world where one node is connected to another through a very short path [10,14]. Short average path length in earthquake network may implies quick transfer of energy [10].
e
Coreness. K-core decomposition analysis is used to define the location of the node. This process assigns an integer index or coreness k s to each node, representing its position according to successive layers (k shells) in the network. The coreness index k s is a very robust metric, and in the case of incomplete information, the node is not significantly influenced. The max value of coreness K represents the number of layers of the network. He et al. [33] found different values of K in different regions. They also found that the highest core (or layer) is generally related to a deep hierarchy of the earthquake network structure.
f
Entropy is a metric of uncertainty for a network. The weighted entropy is defined as H = i = 1 n p ( s i ) log p ( s i ) , where p ( s i ) is the probability distribution of s i . The network entropy is an important indicator describing the heterogeneity of network. Lin et al. [21] focused on the dynamic evolution of the structure entropy of the earthquake network and captured the changes of network structure entropy before and after the main shocks.
For simplicity, we summarize the symbol and implication of each network property in Table 2. Every property has been proved to be important for identifying the seismic activity. Each property in the earthquake network can reveal the rules of seismicity from a certain point of view with corresponding physical meanings. Therefore, we propose a method in the following to comprehensively consider the basic network properties in order to fully express the characteristics of earthquake networks.

3.2. Network Similarity

In Ref. [38], the authors introduced many methods to study the network similarity. Common methods to calculate the similarity of complex network is to find the features which represent the network and use them as vectors, then calculate the distance between two vectors. The shorter distance between them, the more similar the two networks are.
In the previous study of earthquake network, Deyasi et al. [22] used Jensen-Shannon divergence to study the structural similarity of earthquake networks of different geographical regions. They compared the similarity between different regions. Tenenbaum et al. [12] proposed a novel network approach to describe the correlation between earthquake events. In their study, nodes represent spatial locations while links between two nodes represent similar activity patterns of the two different locations. The similar activity patterns are the similar time series of event magnitude in different regions.
Here, we propose a method that is different from the above two methods. We use the basic network properties as the multivariate feature vectors of the earthquake network. By calculating the distance between two feature vectors which represent the two networks properties, we obtain the result of similarity. Different from the above two methods, our method is aiming to observe the similarity of the network structure in different time spans but in the same region.
Definition: First, we define a “time-window” (w) where we construct an earthquake network G from the seismic catalogs within this window. Then the time window is moved forward so that we start to construct another earthquake network from catalogs within this window. The length of the step we move forward is represented as s t . A 6-tuple vector f = { λ , S , C , L , K , H } is defined to represent a feature vector of certain earthquake network constructed from the catalog within one-time window, where λ , S, C, L, K and H denote the exponent of the power law, strength, clustering coefficient, average path length, max coreness and entropy of the network. Then the set F denotes the feature matrix that we get from g networks G = { G 1 , G 2 , , G g } after the time window moving from the start time to the end time. F is a g × m matrix, where the element f i j ( i = 1 , 2 , , g ; j = 1 , 2 , , m ) represents the value of the jth feature of the ith network.
Based on the definitions above, feature vectors f i and f j are calculated from earthquake networks G i and G j , respectively. The structural distance d ( G i , G j ) between vectors f i and f j in a m-dimensional real vector space is defined as Ref. [38].
d ( G i , G j ) = k = 1 m | f i k f j k | / ( | f i k | + | f j k | ) ,
where m is the total number of features in f i and f j . Therefore, the similarity s ( G i , G j ) between a pair of networks is defined as:
s ( G i , G j ) = 1 d ( G i , G j ) .
In particular, to prevent the abnormal effect caused by a large or small magnitude of a feature, it is necessary to normalize each feature of the matrix f (i.e., each column) before calculating the similarity s ( G i , G j ) according to the formula
x i = x i x m i n x m a x x m i n , i = 1 , 2 , , m ,
where x i represents the value of certain feature of all the networks, x m i n and x m a x represent the minimum and maximum value of x i .

4. Results

4.1. Hierarchical Clustering Result

The structural distance d ( G i , G j ) between a pair of earthquake networks G i and G j has been calculated using Equation (1). Then we got the distance matrix D, which is used for the hierarchical clustering of earthquake networks. Given a set of g items to be clustered, and a g × g distance matrix D, the four steps of the common hierarchical clustering method [39] are as follows: (i) Each network in this set is treated as a cluster, so we have g clusters at first, each containing just one item(network); (ii) two clusters with the shortest distance are merged to a single cluster; (iii) the distance between all pairs of clusters are recalculated; (iv) steps (ii) and (iii) are repeated until all the clusters merged to one cluster.
In step (iii), we use a complete linkage algorithm, which is a common method to calculate the intercluster distance. The complete linkage clustering algorithm considers the maximum distance between the pair of clusters. The distance between these two clusters is defined to be the maximum distance between the elements of each cluster. Therefore, the dendrogram (like a hierarchical tree) is formed by gradually linking nodes and building the tree from the leaf-nodes onward.
We constructed the earthquake networks from the seismic catalogs in SCSN in the period between 1 January 1960 and 31 December 2015. The time window w is 1 year and as well as the length of the step s t . Then we can have each earthquake network constructed from the catalog of each year. To find the earthquake networks that have similar structures over the past decades in the same region, we clustered the networks based on the pairwise distances. For this step, we cluster the earthquake networks by the approach complete-linkage hierarchical clustering. The cluster dendrogram can be seen in Figure 2.
We use G i to represent the earthquake network constructed from the catalogs of year i. We observed that there are three categories at the higher level. We found that the networks G 1992 , G 2010 , G 1968 , G 1980 , G 1979 and G 1999 together form a cluster, which is shown on the left of the dendrogram. It is noted that there was a great shock in the year of 1992, 1999 and 2010 as shown in Table 3. However, we observe that G 1999 is similar to G 1979 , which has no great shocks in this year. Similarly, the pairs of structural similar networks include ( G 1964 , G 2005 ), ( G 1960 , G 2015 ), ( G 1961 , G 1995 ), ( G 1988 , G 2000 ), ( G 1963 , G 2002 ), ( G 1982 , G 2012 ), and so on. We found that similar networks are not the networks of adjacent years. In contrast, the time difference between a pair of similar networks is ten years or even decades. Naturally, we perform a statistical analysis of the period of seismicity.

4.2. Wavelet Analysis

Wavelet analysis is a powerful statistical tool [40]. It was first used in the field of signal processing. The continuous wavelet transform (CWT) is widely used in geophysical research as a tool for time series intermittent wave feature extraction. It is usually used to estimate periodicity of seismicity by analyzing a variation of earthquake frequency or magnitude for a time series. In our study, we use the network property as the input. We calculate the Euclidean distance between the feature vector f = { λ , S , C , L , K , H } and the zero vector for every network within a time series, and used it to indicate the degree of seismic activity. This value is used as a measure of the amplitude of wavelet analysis. Then we used wavelet analysis to estimate the period of seismic activity. An example is the Morlet wavelet, having a good balance between time and frequency localization [41]. In addition, the Morlet wavelet contains more vibration information. Therefore, in the analysis of seismic activity time series, we choose the “Morlet" wavelet whose function is defined as:
ψ 0 ( t ) = π 1 / 4 e i ω 0 t e t 2 / 2 ,
where t represents time, while ω 0 represents the nondimensional frequency.
The wavelet transform for the signal x ( t ) is defined as:
W x ( a , τ ) = 1 a x ( t ) ψ * ( t τ a ) d t = x ( t ) ψ a , τ * ( t ) d t ,
where ψ a , τ * is the wavelet function, while * means that the function ψ a , τ is a complex conjugate function. a and τ represent the scale and time position of the wavelet function, respectively. x ( t ) is a given time series. | W x ( a , τ ) | 2 is defined as the wavelet power spectrum, which represents the fitting result of the wavelet function ψ a , τ * and x ( t ) . When the two functions match well, the value of | W x ( a , τ ) | 2 is larger, otherwise it is smaller. According to the Ref. [42], when ω 0 = 6 in Equation (4), the wavelet scale a is substantially equal to the Fourier period T ( T = 1.03 a ) , so the scale a and the period T can be substituted for each other. To analyze the wavelet power spectrum at different scales a, it is necessary to analyze the wavelet variance. When the scale a is determined, the cumulative sum of | W x ( a , τ ) | 2 corresponding to the change value τ is defined as follows:
V a r ( a ) = 0 N | W x ( a , τ ) | 2 d τ ,
where N is the length of time for a given time series. The average wavelet variance is defined as
V a r ¯ ( a ) = σ 2 N 0 N | W x ( a , τ ) | 2 d τ ,
where σ 2 is the variance of the given time series.
Whether the wavelet power spectrum is significant or not, it is tested with a red noise or white noise standard spectrum. Wavelet power spectrum follows the χ 2 distribution [40]. First, the effective degree of freedom of the wavelet power spectrum distribution is calculated. Then the significance level of the χ 2 distribution is given, such as 95% or 90% confidence rate. Finally, the theoretical power spectrum of red noise or white noise is calculated. When the overall wavelet power spectrum is greater than the theoretical spectrum, it indicates that the result is significant. Since many geophysical time series have red noise characteristics, the red spectrum is often used as the background spectrum to verify the wavelet spectrum. Here we use the red spectrum and the confidence rate is set to 90%.

4.3. Period Analysis of Seismicity

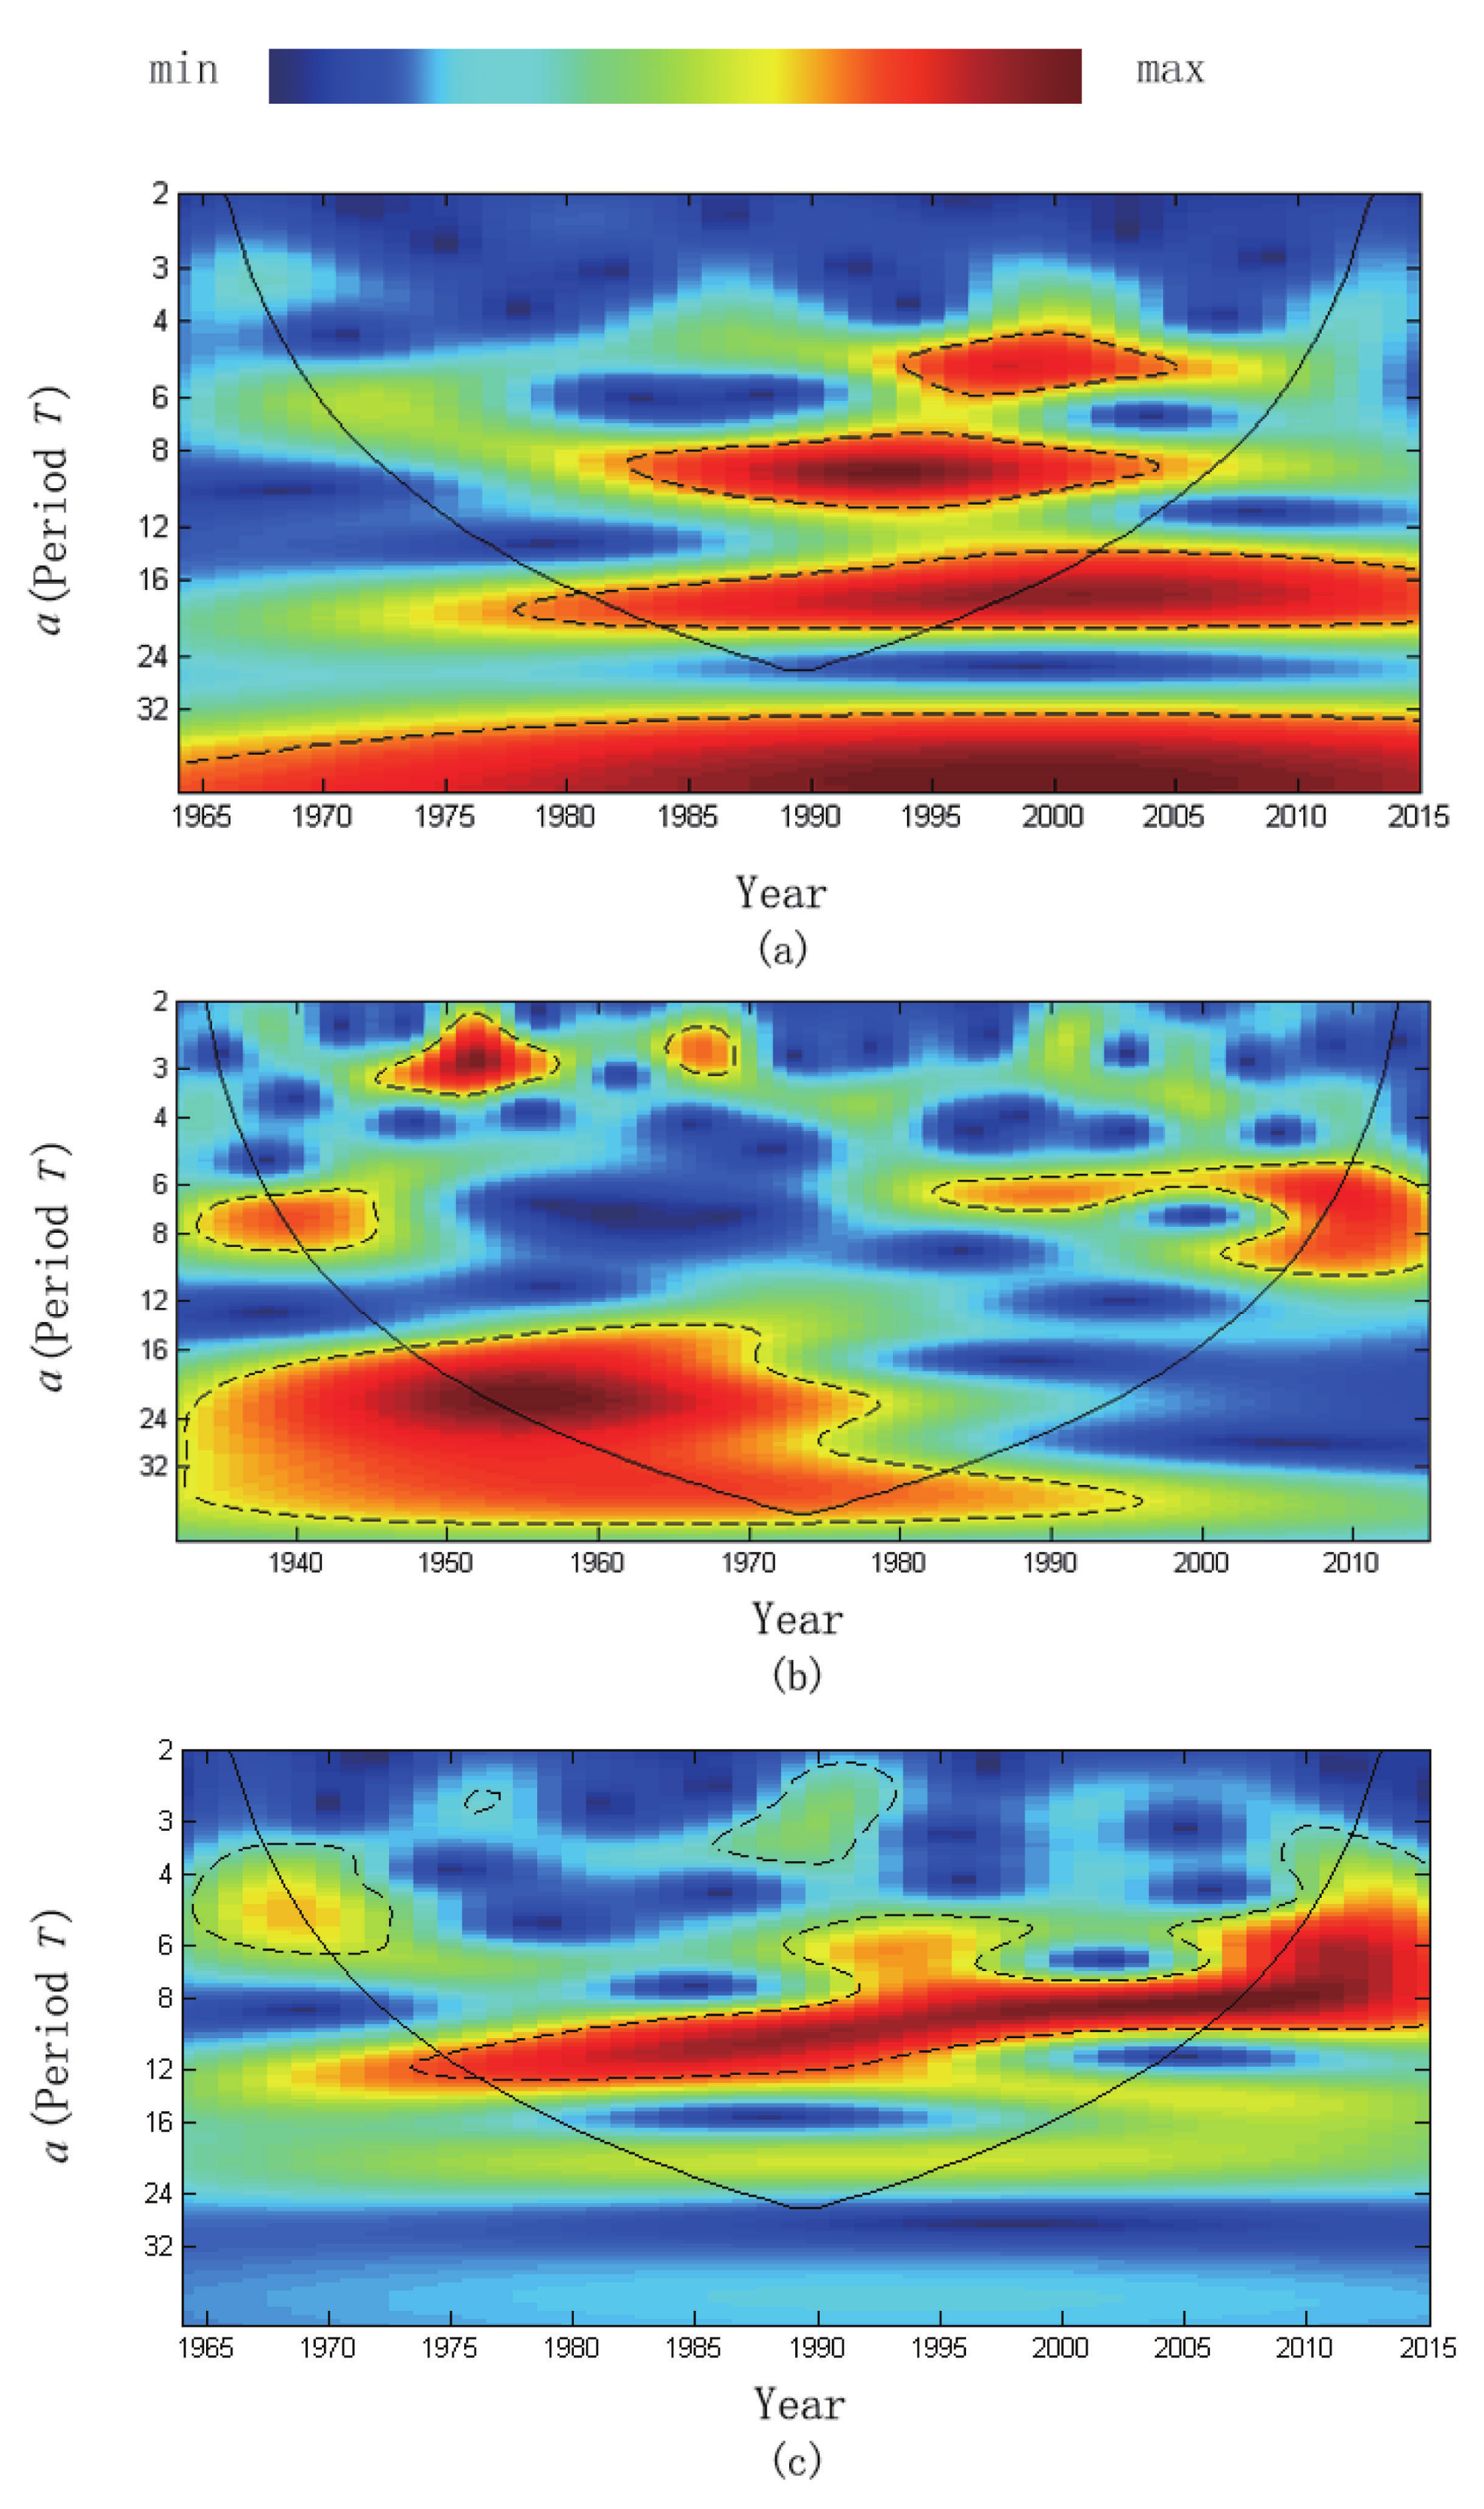
In the following study, we will analyze the periodic trend of the global network and the networks of California and Japan by using wavelet analysis. The time window w here is 2 years and the length of the step s t for moving forward is 1 year.
According to the statistics of global data observation reports provided by ANSS, it is found that the frequency of seismic data from 1964 is relatively stable above 4.0. In order to eliminate the impact of seismic detection techniques in different regions on seismic data, we selected global seismic data of magnitude which is higher than 4.0 from ANSS. Here, we considered data from a long period of time. Since the data of JUNEC is very limited, we use ANSS for Japan here. We chose the data from years 1964 to 2015 and construct earthquake networks according to the time window and length of step. Then, we analyzed the period by using wavelet analysis. The results are shown in Figure 3a and Figure 4a.
The wavelet power spectrum obtained by wavelet transforming x ( t ) is shown in Figure 3a. The horizontal coordinate represents time while the vertical coordinate represents the scale a(the period T). The red region is corresponding to the wavelet power with a bigger value while blue is corresponding to the wavelet power with a smaller value. As shown in Figure 4a, the vertical coordinate represents the scale a(the period T) while the horizontal coordinate represents the average wavelet variance of the corresponding scale (calculated by Equation (7)). The significance test results are displayed by the right part of the dashed line, which represents a confidence level higher than 90%.
In Figure 3a, the area with red color represents a high value of wavelet power. The corresponding ordinate value is the time scale, that is, the possible period. Observing Figure 3a, it is found that from 1980 to 2005, there are 8–10-year and 16–20-year periods. In addition, there is a 5-year period during 1992 to 2007. It shows that the variation waveform of global seismic activity is superimposed by periodic waves of different time scales, and the seismic activity shows different periods in different time spans. The significance test result is shown in Figure 4a. The corresponding ordinate value with the peaks on the right side of the dashed line is the period which has a 90% confidence rate. It shows a period scale of 8–10 years and 16–20 years with a confidence rate greater than 90%. However, the 5-year period scale shows a lower confidence rate.
By using the seismic data of California, we chose the data from 1932 to 2015 and constructed earthquake networks of a time series according to the time window and length of step. The results are shown in Figure 3b and Figure 4b. It is shown that from 1932 to 1980, there is an 18–24-year period. While from 1980 to 2015, there is a 6-year period. These two periods are both shown with a confidence rate greater than 90%.
By using the above method, we chose the seismic data of Japan from 1964–2015 and constructed earthquake networks for a given period of time. The result of the wavelet power spectrum and the average wavelet variance of the corresponding scales are shown in Figure 3c and Figure 4c, respectively. It can be seen from Figure 3c, there are three different period scales, which are 6-year, 8–10-year and 20-year periods. From these results, it is found that periods of 6 and 8–10 years have a confidence rate greater than 90% while period 20 have a lower confidence rate, which is shown in Figure 4c.
The possible periods of different regions are summarized in Table 4. In recent decades, scientists have extensively discussed the periods of seismic activities. For global earthquake activities, they found that there is a statistically significant 18.6-year period for major earthquakes [43,44]. In this paper, the 16–20-year period calculated by wavelet analysis is obtained as one of the possible periods at global scale. For the region of California, Barbot et al. [45] used a fully-dynamic earthquake cycle model, found that there exists a 20-year period in California. For the region of Japan, a 5.35 years recurrence interval of great earthquakes was found from a statistical point of view [46,47].
Scientists found the cycle or period of seismic activities by many different methods. Therefore, many different conclusions have been obtained. Scientists agreed that the earthquakes are not independent. They have a correlation with each other. The system of seismic activities is very complex, as it is often related to the motion of lunar, solar, and others in the universe.

5. Discussion

The main contribution of this paper is that we calculate similar seismic activities by using multivariate topological properties. It is defined as the distance between two feature vectors representing the two network properties. By calculating the distance, we obtain similar networks from the same region for a period of time. We found that the time difference between a pair of similar networks is ten years or even decades.
Considering that the research of similarity could be helpful for the period analysis, we use wavelet analysis to analyze the periods in the region of the world, California, Japan as preliminary research. The results show that there exist obvious 8–10-year and 16–20-year periods on the global scale. Similarly, there exist obvious 6-year and 18–24-year periods in California and obvious 6-year and 8–10-year periods in Japan. Some researchers also found that the periods of seismic activities by different calculating methods. Their results are consistent with some of our results.
As far as we are concerned, this is a preliminary research that some points should be discussed deeply in the future. In this paper, we employed a classical structural distance method to calculate the network similarity of different years. We should test other methods in the future. Besides, many different conclusions about the cycle or period of seismic activities have been drawn by seismologists. We can not compare our results with a baseline.
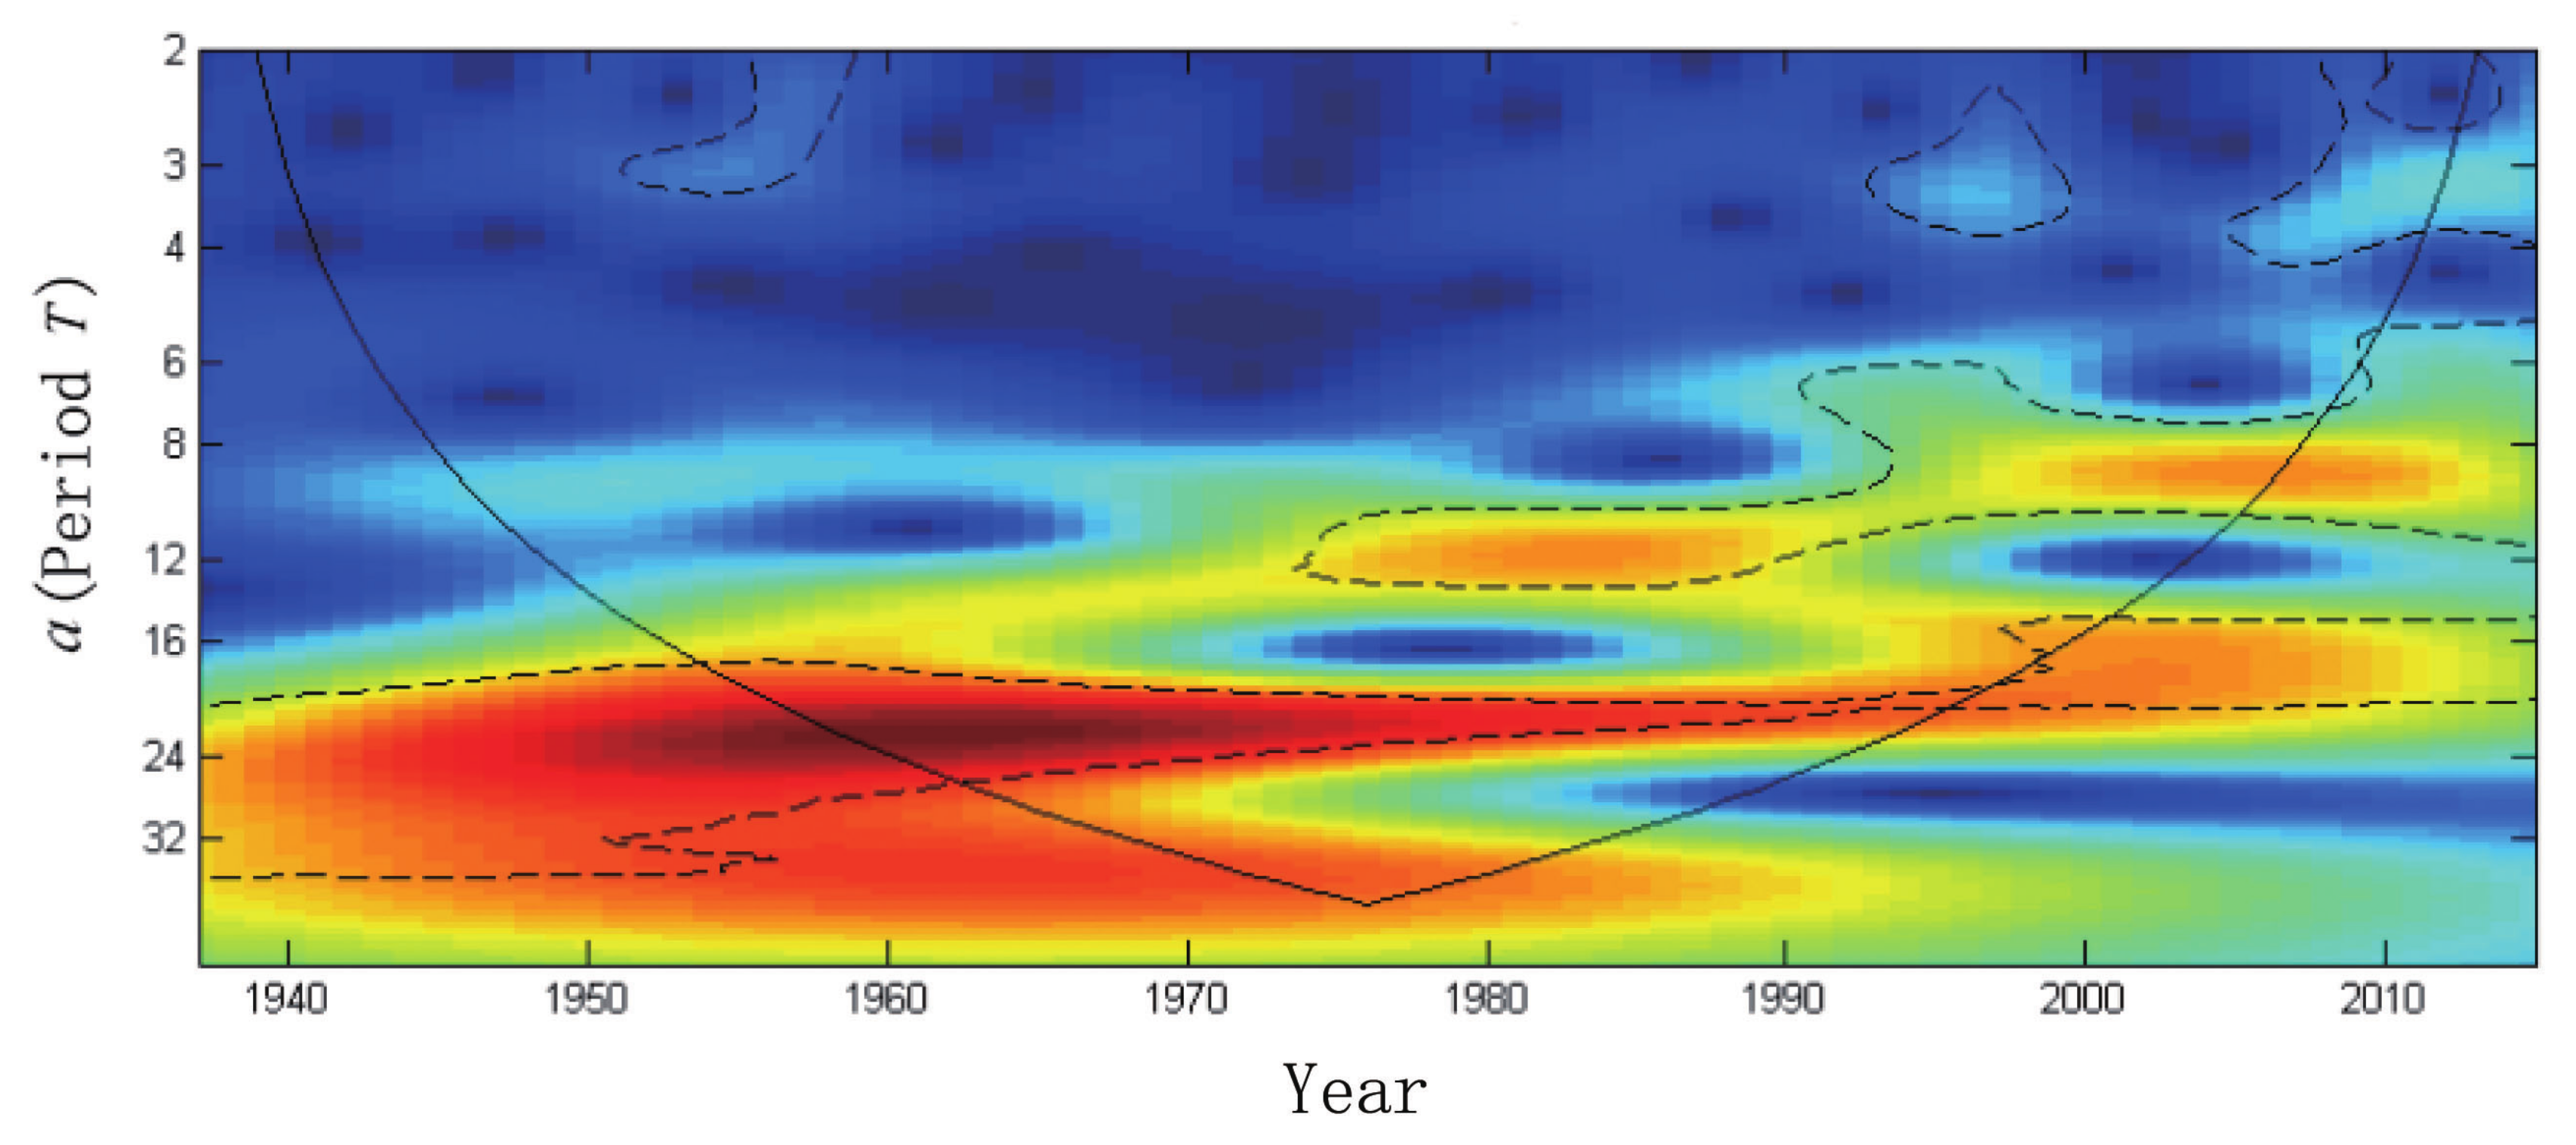
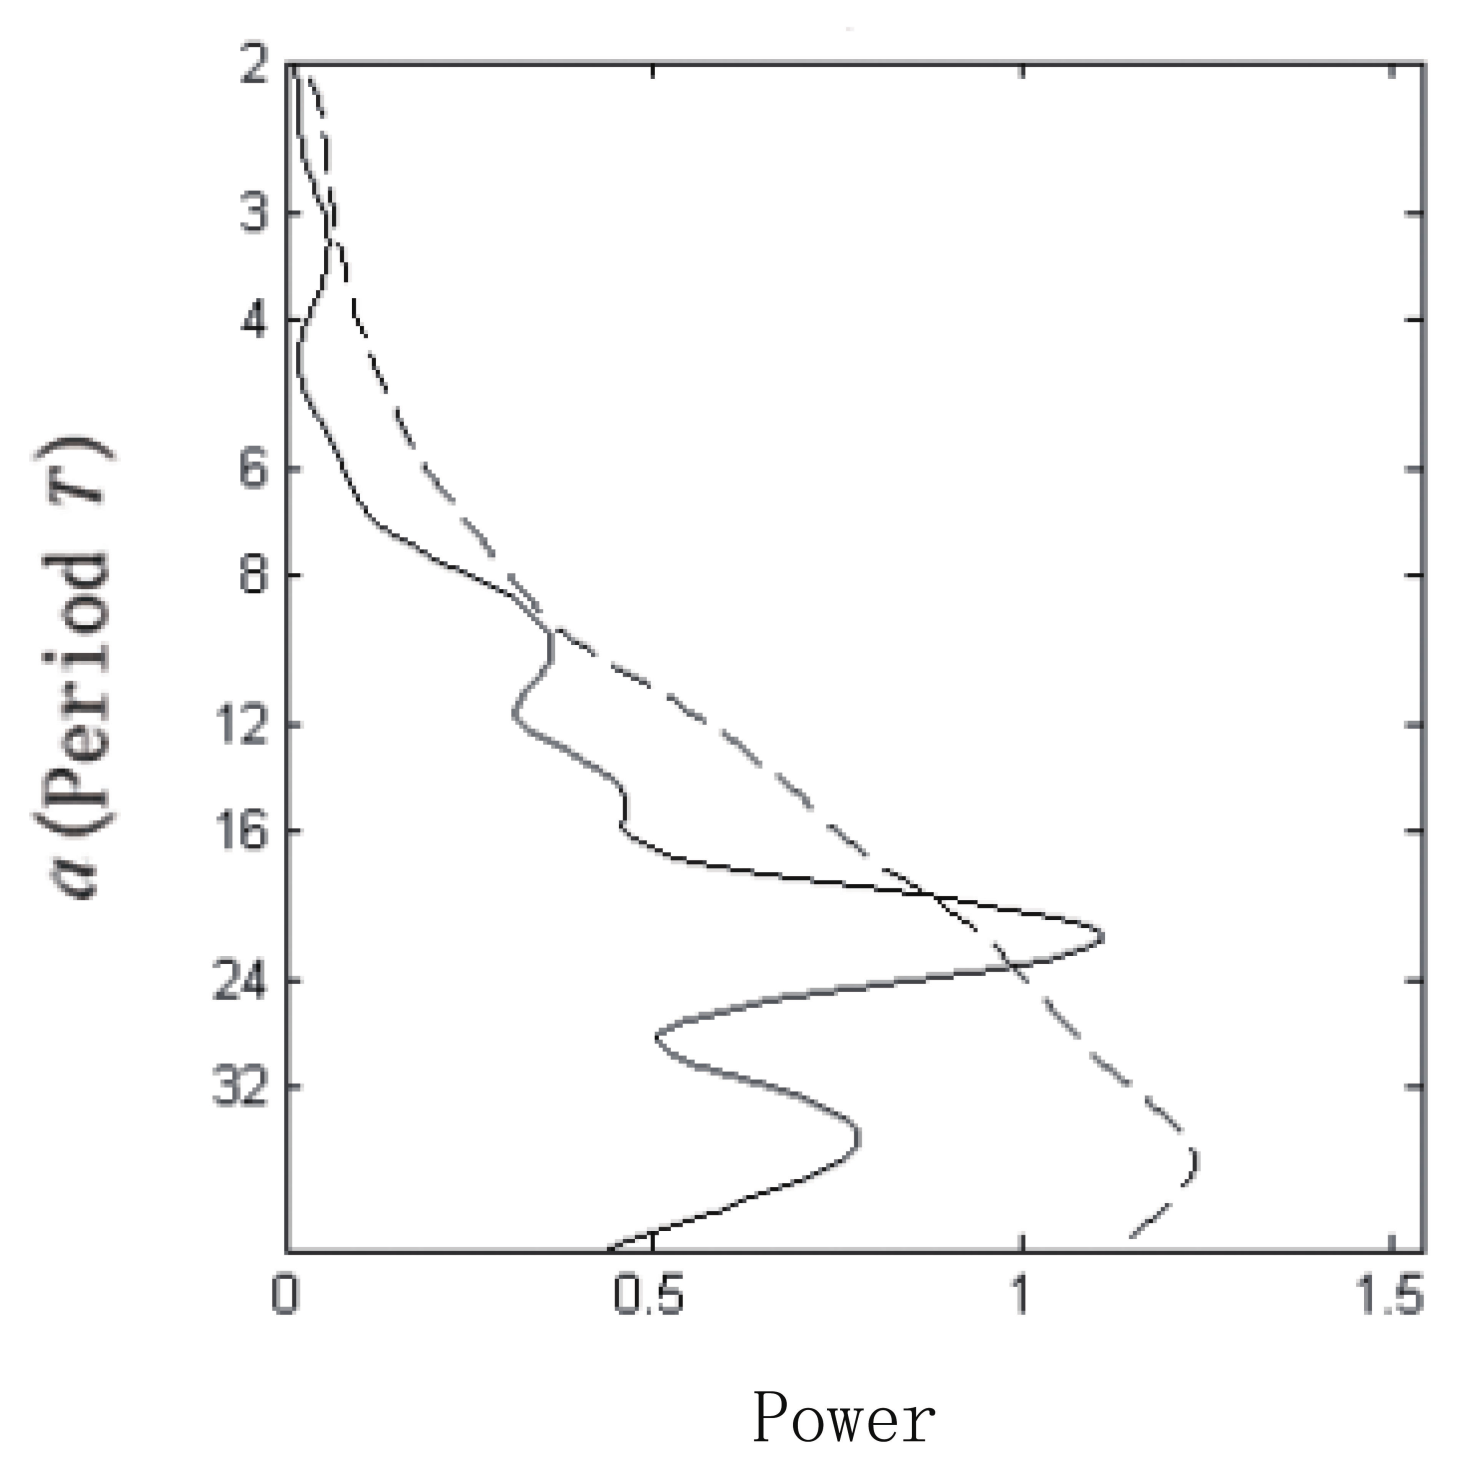
In addition, whether time sliding windows w will affect the results is also a very important issue. Here, we use different time windows to construct sub-networks of the earthquake of a time series. The time sliding window w is enlarged to five years, and the wavelet power spectrum and mean wavelet variance are shown in Figure 5 and Figure 6. It can be seen from them that when the window increases to five, it still shows a period of 18–24 years, but the confidence of 6 years does not reach 90%. This shows that when the window increases, the short period disappears, but the significance of the long period is not affected. Therefore, we prefer to use short time sliding windows. We found that some shorter periods could be disappeared when we use larger time windows. So in this paper, we only show the results from the sub-networks which are calculated with small time windows.
In general, wavelet analysis can be used to analyze the various characteristics of seismic activity in the time domain from multiple time-scales. It can reveal periodic waves in different scales, as well as reflect the specific time spans for a certain period. However, due to the limitation of the amount of seismic data, we can only analyze the seismic data for the past several decades. It is not enough for us to understand the seismic activity of the whole earth. However, we believe that our new method could be helpful for us to suggest the similarity of seismic activity.

Author Contributions

X.H. proposed the fundamental idea of the study. X.H. conceived and conducted the experiments. Y.L. selected the data. L.W. wrote and performed the program. X.H. analyzed the results. X.H. wrote the article. X.H. and Z.L. led the project. All authors reviewed and validated the manuscript. All authors have read and agreed to the published version of the manuscript.

Funding

This work has been supported by National Natural Science Foundation of China (NSFC) (Grant No. 61806048).

Acknowledgments

The authors thank SCSN (Southern California Seismic Network), JUNEC (Japan University Network Earthquake Catalog) and ANSS (Advanced National Seismic System) for providing the seismic data of the study area.

Conflicts of Interest

The authors declare no conflict of interest.

References

  1. Hohmann, S. Unicellsys—Understanding the cell’s functional organization. J. Biotechnol. 2010, 150, 545. [Google Scholar] [CrossRef]
  2. Garlaschelli, D.; Battiston, S.; Castri, M.; Servedio, V.D.P.; Caldarelli, G. The scale-free topology of market investments. Phys. A Stat. Mech. Appl. 2005, 350, 491–499. [Google Scholar] [CrossRef] [Green Version]
  3. Kitsak, M.; Riccaboni, M.; Havlin, S.; Pammolli, F.; Stanley, H.E. Scale-free models for the structure of business firm networks. Phys. Rev. E Stat. Nonlinear Soft Matter Phys. 2010, 81, 036117. [Google Scholar] [CrossRef] [Green Version]
  4. Girvan, M.; Newman, M.E. Community structure in social and biological networks. Proc. Natl. Acad. Sci. USA 2002, 99, 7821–7826. [Google Scholar] [CrossRef] [PubMed] [Green Version]
  5. Borgatti, S.; Mehra, A.; Brass, D.J.; Labianca, G. Network Analysis in the Social Sciences. Science 2009, 323, 892–895. [Google Scholar] [CrossRef] [PubMed] [Green Version]
  6. Li, H.; Zhao, H.; Cai, W.; Xu, J.-Q.; Ai, J. A modular attachment mechanism for software network evolution. Phys. A Stat. Mech. Its Appl. 2013, 392, 2025–2037. [Google Scholar] [CrossRef]
  7. Roth, C.; Kang, S.M.; Batty, M.; Barthelemy, M. Structure of Urban Movements: Polycentric Activity and Entangled Hierarchical Flows. PLoS ONE 2011, 6, e15923. [Google Scholar] [CrossRef] [Green Version]
  8. Albert, R.; Barabási, A.-L. Statistical mechanics of complex networks. Rev. Mod. Phys. 2002, 74, 47–97. [Google Scholar] [CrossRef] [Green Version]
  9. Abe, S.; Suzuki, N. Scale-free network of earthquakes. EPL 2004, 65, 581. [Google Scholar] [CrossRef] [Green Version]
  10. Abe, S.; Suzuki, N. Small-world structure of earthquake network. Phys. A Stat. Mech. Appl. 2004, 337, 357–362. [Google Scholar] [CrossRef] [Green Version]
  11. Abe, S.; Suzuki, N. Complex earthquake networks: Hierarchical organization and assortative mixing. Phys. Rev. E Stat. Nonlinear Soft Matter Phys. 2006, 74, 026113. [Google Scholar] [CrossRef] [PubMed] [Green Version]
  12. Tenenbaum, J.N.; Havlin, S.; Stanley, H.E. Earthquake networks based on similar activity patterns. Phys. Rev. E Stat. Nonlinear Soft Matter Phys. 2012, 86, 046107. [Google Scholar] [CrossRef] [PubMed] [Green Version]
  13. Jiménez, A. A complex network model for seismicity based on mutual information. Phys. A Stat. Mech. Appl. 2013, 392, 2498–2506. [Google Scholar] [CrossRef]
  14. He, X.; Zhao, H.; Cai, W.; Liu, Z.; Si, S.-Z. Earthquake networks based on space–time influence domain. Phys. A Stat. Mech. Appl. 2014, 407, 175–184. [Google Scholar] [CrossRef]
  15. Rezaei, S.; Darooneh, A.H.; Lotfi, N.; Asaadi, N. The earthquakes network: Retrieving the empirical seismological laws. Phys. A Stat. Mech. Appl. 2017, 471, 80–87. [Google Scholar] [CrossRef]
  16. Min, S.; Chang, K.-H.; Kim, K.; Lee, Y.-S. Feature of topological properties in an earthquake network. Phys. A Stat. Mech. Appl. 2016, 442, 268–275. [Google Scholar] [CrossRef]
  17. Pasten, D.; Czechowski, Z.; Toledo, B. Time series analysis in earthquake complex networks. Chaos Interdiscip. J. Nonlinear Sci. 2018, 28, 083128. [Google Scholar] [CrossRef]
  18. Lotfi, N.; Darooneh, A.H.; Rodrigues, F.A. Centrality in earthquake multiplex networks. Chaos Interdiscip. J. Nonlinear Sci. 2018, 28, 063113. [Google Scholar] [CrossRef]
  19. Abe, S.; Suzuki, N. Dynamical evolution of clustering in complex network of earthquakes. Eur. Phys. J. B 2007, 59, 93–97. [Google Scholar] [CrossRef] [Green Version]
  20. Abe, S.; Suzuki, N. Dynamical evolution of the community structure of complex earthquake network. EPL 2012, 99, 313–316. [Google Scholar] [CrossRef] [Green Version]
  21. Lin, M.; Fan, X.X.; Wang, G.; Zhao, G. Network structure entropy and its dynamical evolution for recurrence networks from earthquake magnitude time series. Eur. Phys. J. B 2016, 89, 131. [Google Scholar] [CrossRef]
  22. Deyasi, K.; Chakraborty, A.; Banerjee, A. Network similarity and statistical analysis of earthquake seismic data. Phys. A Stat. Mech. Appl. 2017, 481, 224. [Google Scholar] [CrossRef] [Green Version]
  23. Varotsos, P.; Sarlis, N.V.; Skordas, E.S.; Lazaridou, M. Seismic Electric Signals: An additional fact showing their physical interconnection with seismicity. Tectonophysics 2013, 589, 116–125. [Google Scholar] [CrossRef]
  24. Varotsos, P.; Sarlis, N.V.; Skordas, E.S. Study of the temporal correlations in the magnitude time series before major earthquakes in Japan. J. Geophys. Res. Phys. 2014, 119, 9192–9206. [Google Scholar] [CrossRef]
  25. Mintzelas, A.; Sarlis, N.V. Minima of the fluctuations of the order parameter of seismicity and earthquake networks based on similar activity patterns. Phys. A Stat. Mech. Appl. 2019, 527, 121293. [Google Scholar] [CrossRef]
  26. Varotsos, P.; Sarlis, N.V.; Skordas, E.S. Scale-specific order parameter fluctuations of seismicity in natural time before mainshocks. Europhys. Lett. 2011, 96, 59002. [Google Scholar] [CrossRef] [Green Version]
  27. Varotsos, P.; Sarlis, N.V.; Skordas, E.S.; Lazaridou, M.S. Identifying sudden cardiac death risk and specifying its occurrence time by analyzing electrocardiograms in natural time. Appl. Phys. Lett. 2007, 91, 064106. [Google Scholar] [CrossRef]
  28. Abe, S.; Suzuki, N. Complex-network description of seismicity. Nonlinear Process. Geophys. 2006, 13, 145–150. [Google Scholar] [CrossRef]
  29. Ferreira, D.; Papa, A.R.; Menezes, R. Small world picture of worldwide seismic events. Phys. A Stat. Mech. Appl. 2014, 408, 170–180. [Google Scholar] [CrossRef] [Green Version]
  30. Sarlis, N.V. Magnitude correlations in global seismicity. Phys. Rev. E 2011, 84, 022101. [Google Scholar] [CrossRef]
  31. Sarlis, N.V.; Christopoulos, S.-R. Natural time analysis of the Centennial Earthquake Catalog. Chaos Interdiscip. J. Nonlinear Sci. 2012, 22, 023123. [Google Scholar] [CrossRef] [PubMed]
  32. Gardner, J.; Knopoff, L. Is the sequence of earthquakes in southern california, with aftershocks removed, poissonian? Bull. Seismol. Soc. Am. 1974, 64, 1363–1367. [Google Scholar]
  33. He, X.; Zhao, H.; Cai, W.; Li, G.-G.; Pei, F.-D. Analyzing the structure of earthquake network by k-core decomposition. Phys. A Stat. Mech. Appl. 2015, 421, 34–43. [Google Scholar] [CrossRef]
  34. Zhang, Y.; Zhao, H.; He, X.; Pei, F.-D.; Li, G.-G. Bayesian prediction of earthquake network based on space–time influence domain. Phys. A Stat. Mech. Appl. 2016, 445, 138–149. [Google Scholar] [CrossRef]
  35. Abe, S.; Suzuki, N. Determination of the scale of coarse graining in earthquake networks. EPL 2012, 87, 48008–48012. [Google Scholar] [CrossRef] [Green Version]
  36. Chakraborty, A.; Mukherjee, G.; Manna, S.S. Weighted network analysis of earthquake seismic data. Phys. A Stat. Mech. Appl. 2015, 433, 336–343. [Google Scholar] [CrossRef]
  37. Alain, B.; Marc, B.; Alessandro, V. The Architecture of Complex Weighted Networks: Measurements and Models; World Scientific: Singapore, 2007; pp. 67–92. [Google Scholar]
  38. Soundarajan, S.; Eliassi-Rad, T.; Gallagher, B. A Guide to Selecting a Network Similarity Method. In Proceedings of the 2014 SIAM International Conference on Data Mining, Philadelphia, PA, USA, 24–26 April 2014. [Google Scholar]
  39. Johnson, S.C. Hierarchical clustering schemes. Psychometrika 1967, 32, 241–254. [Google Scholar] [CrossRef]
  40. Torrence, C.; Compo, G.P. A practical guide to wavelet analysis. Bull. Am. Meteorol. Soc. 1998, 79, 61–78. [Google Scholar] [CrossRef] [Green Version]
  41. Grinsted, A.; Moore, J.C.; Jevrejeva, S. Application of the cross wavelet transform and wavelet coherence to geophysical time series. Nonlinear Process. Geophys. 2004, 11, 561–566. [Google Scholar] [CrossRef]
  42. Torrence, C.; Webster, P.J. Interdecadal changes in the enso–monsoon system. J. Clim. 1999, 12, 2679–2690. [Google Scholar] [CrossRef] [Green Version]
  43. Du, P. The 18.6 year seismic cycle in global major seismic regions. J. Seismol. Res. 1993, 3, 03. [Google Scholar]
  44. Pin-Ren, D.U. 18.6 years seismic cycle and the preliminary exploration for its cause. Chin. J. Geophys. 1994, 37, 362–369. [Google Scholar]
  45. Barbot, S.; Lapusta, N.; Avouac, J.-P. Under the Hood of the Earthquake Machine: Toward Predictive Modeling of the Seismic Cycle. Science 2012, 336, 707–710. [Google Scholar] [CrossRef] [PubMed]
  46. Uchida, N.; Matsuzawa, T.; Ellsworth, W.L.; Imanishi, K.; Okada, T.; Hasegawa, A. Source parameters of a m4.8 and its accompanying repeating earthquakes off kamaishi, ne japan:implications for the hierarchical structure of asperities and earthquake cycle. Geophys. Res. Lett. 2007, 34, 153–175. [Google Scholar] [CrossRef] [Green Version]
  47. Matsuzawa, T.; Igarashi, T.; Hasegawa, A. Characteristic small-earthquake sequence off Sanriku, northeastern Honshu, Japan. Geophys. Res. Lett. 2002, 29, 381–384. [Google Scholar] [CrossRef]
  48. Zhang, C. Periodic analysis of global seismic activity. Earthq. Res. China 1985, 1, 24–31. [Google Scholar]
  49. Kilston, S.; Knopoff, L. Lunar–solar periodicities of large earthquakes in southern California. Nature 1983, 304, 21–25. [Google Scholar] [CrossRef]
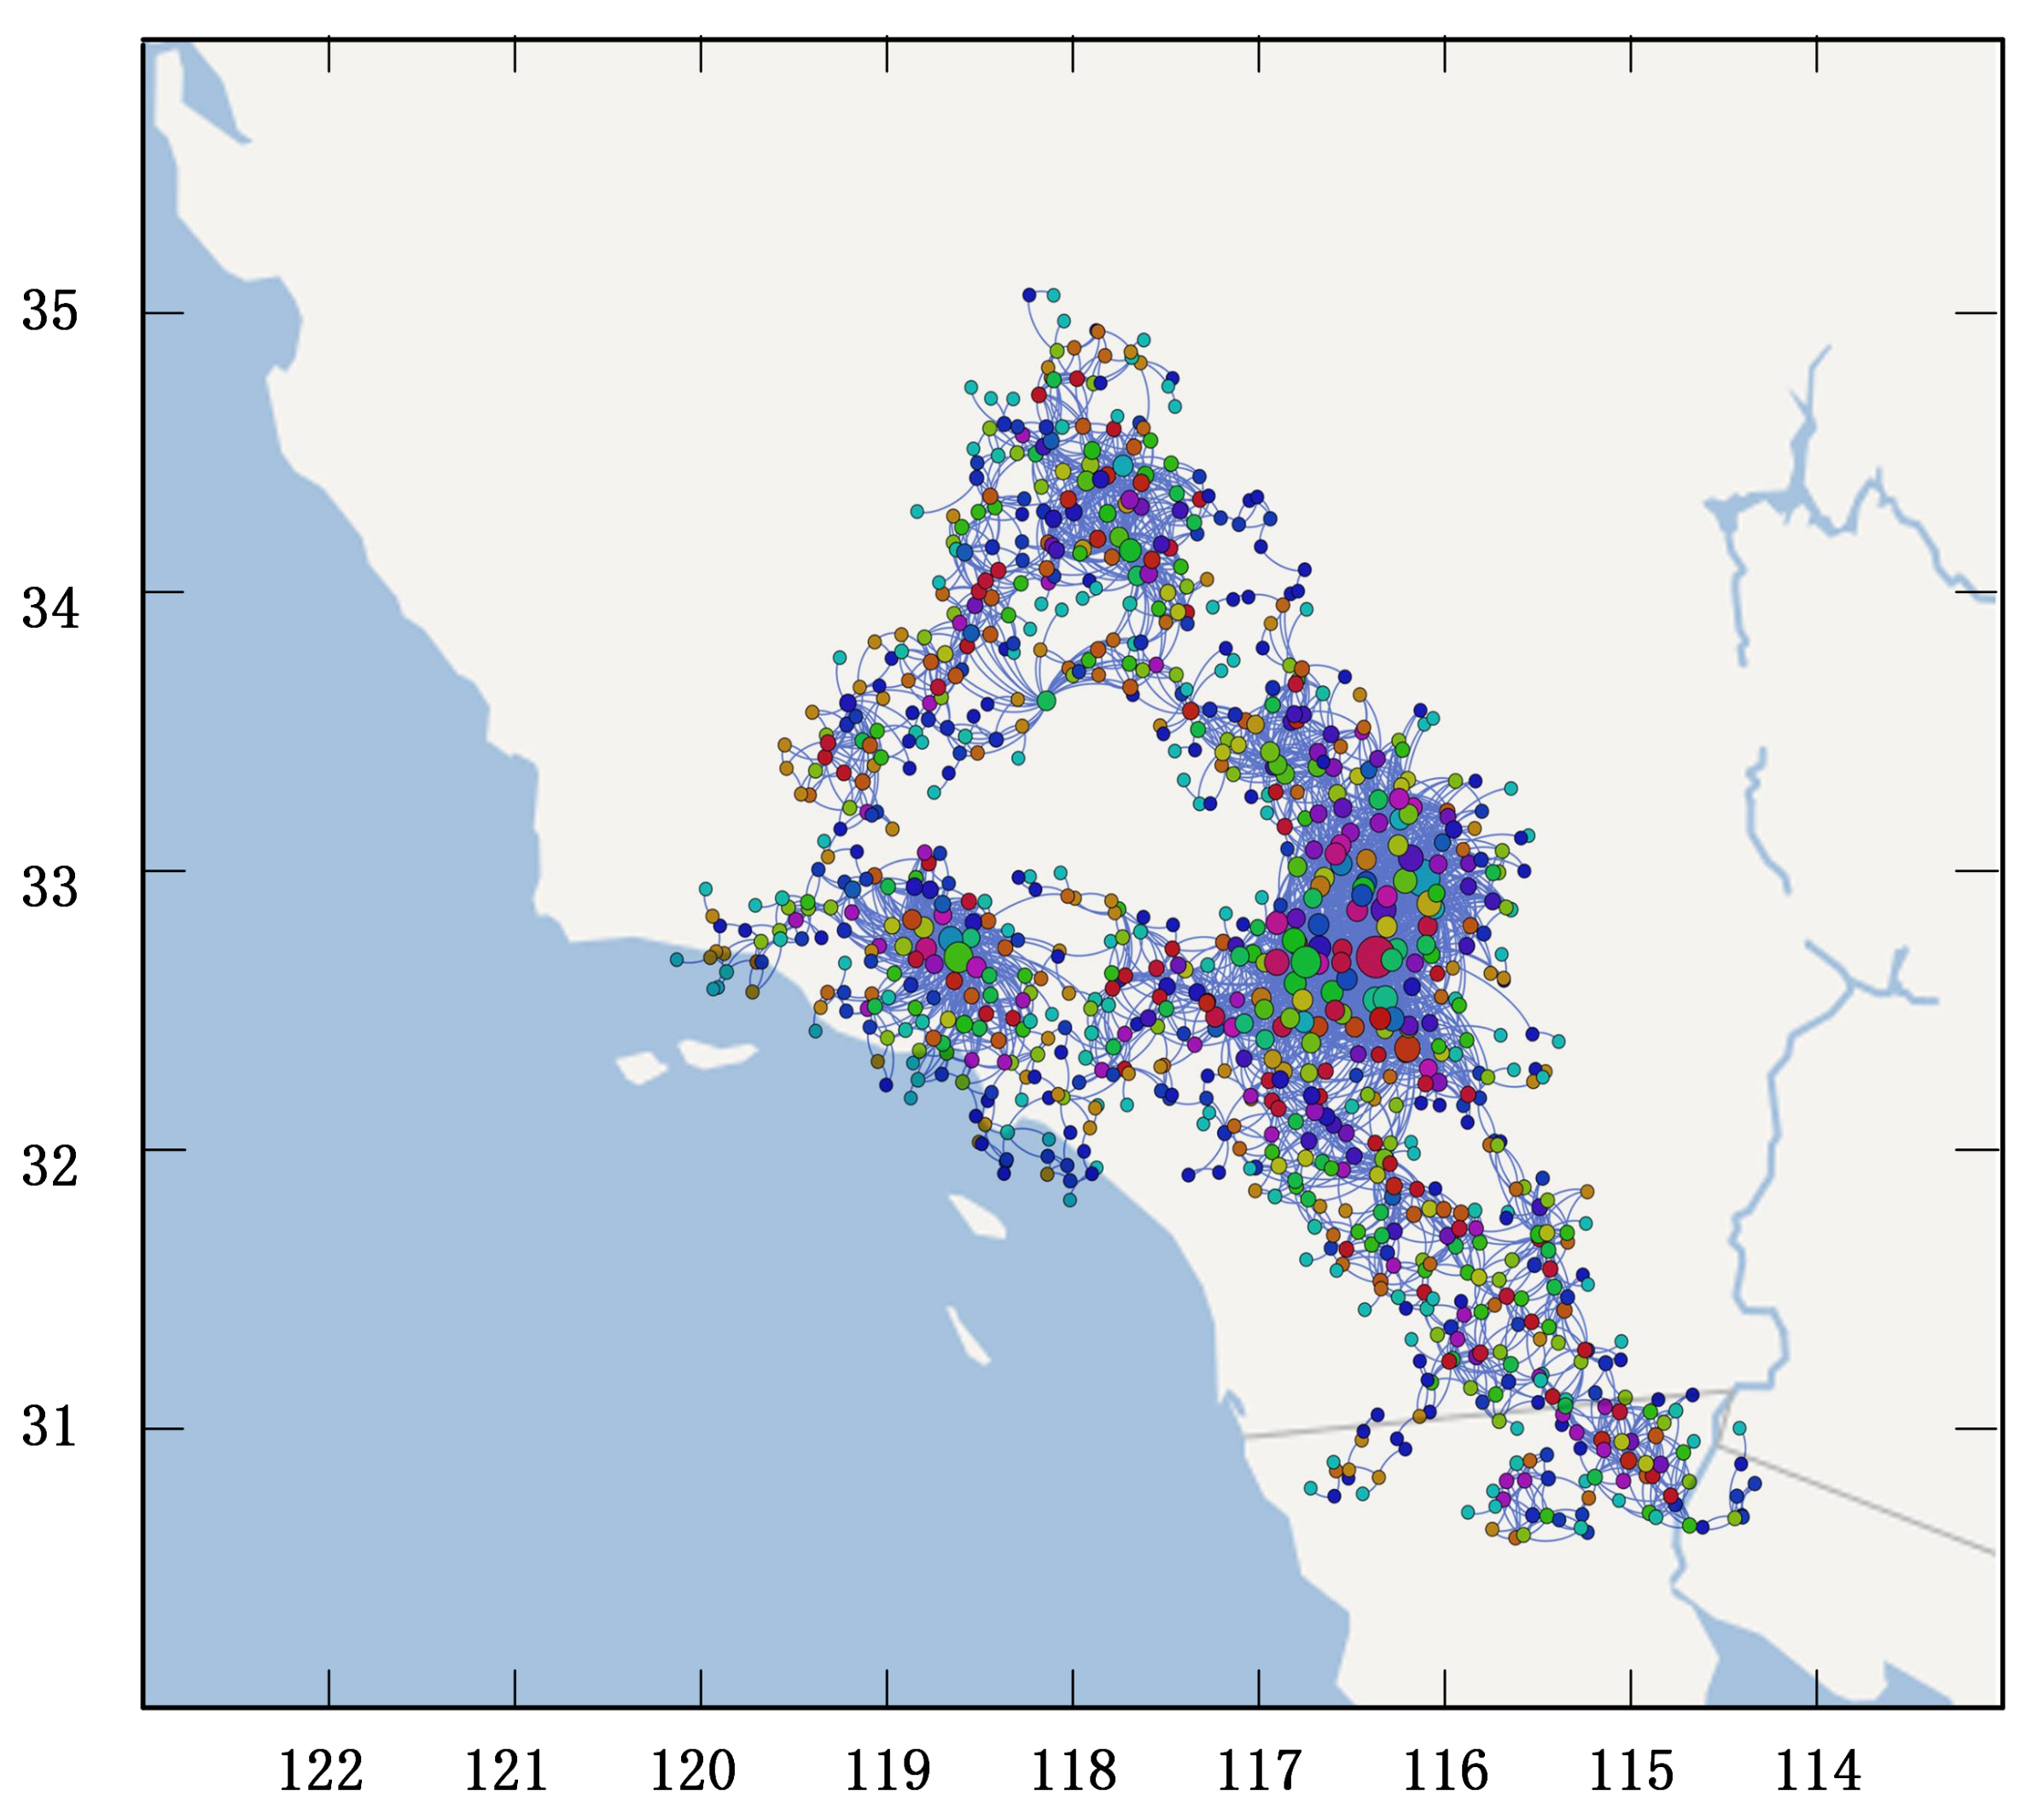
Figure 1. The topological structure of earthquake network constructed from the catalog of the Southern California Seismic Network (SCSN) covering the region 30 N–39 N latitude and 111 W–124 W longitude in the period between 1 January 1992 and 31 December 2011. The total number of events is 395274.
Symmetry 12 00778 g001
Figure 2. Dendrogram representing the hierarchical clustering of the different earthquake networks in California over the past decades.
Symmetry 12 00778 g002
Figure 3. Wavelet power spectrum of time series for (a) the world, (b) California and (c) Japan. The red region represents the wavelet power with a bigger value while the blue region represents the wavelet power with a smaller value. We can see the specific time span for certain time scale.
Symmetry 12 00778 g003
Figure 4. Average wavelet variance of time series for (a) the world, (b) California and (c) Japan. The right part of the dashed line indicate confidence level of 90%.
Symmetry 12 00778 g004
Figure 5. Wavelet power spectrum of time series for California with w = 5 . The red region represents to the wavelet power with bigger value while blue region represents the wavelet power with smaller value. We can see the specific time span for certain time scale.
Symmetry 12 00778 g005
Figure 6. Average wavelet variance of time series for California with w = 5 . The right part of the dashed line indicate confidence level of 90%. Its corresponding period is said to be with high confidence.
Symmetry 12 00778 g006
Table 1. The information of different earthquake catalogs. The abbreviation for the name of earthquake catalogs, the time spans for the collecting data, and the URL of the corresponding catalogs are shown in this table.
NamePeriodSite URL
SCSN1932 to the presentscedc.caltech.edu/
JUNEC1985–1998kea.eri.u-tokyo.ac.jp
ANSS1863 to the presentwww.quake.geo.berkeley.edu/anss/
Table 2. The symbols and implications of basic network properties of earthquake networks.
NameSymbolImplication
Exponent of power law λ The heterogeneity of degree distribution
StrengthSInfluencing degree among nodes
Clustering coefficientCThe degree of clustering of earthquake network
Average path lengthLEfficiency of transfering energy
Max corenessKHierachy of earthquake network
EntropyHThe heterogeneity of nodal strength
Table 3. The time, magnitude, latitude and longitude of the great shocks in California in the year 1992, 1999 and 2010.
TimeMagnitudeLatitudeLongitude
1992/06/287.334.200−116.437
1999/10/167.134.603−116.265
2010/04/047.232.286−115.295
Table 4. The summary of possible periods in different regions. The mark “√” represents the possible period with 90% confidence rate.
RegionPossible Period T(years)With 90% Confidence RateReferences
World5--
8∼10[48]
16∼20[43,44]
California3--
6-
18∼24[45,49]
Japan6[46,47]
8∼10-
20--