1. Introduction
Classification is a supervised method in machine learning that is utilized to predict the output class (category) based on the input data. The input data have a set of attributes called features, and the classification method predicts its class label. The classification method has been applied in various areas, e.g., engineering, biology, human science, robotics, financial, business, social science, and in education technology. In the robotics field, machine learning is used as the core of robots’ artificial intelligence systems to carry out missions, e.g., path planning mapping and object recognition, [
1,
2,
3]. One machine learning challenge is that of classification in multi-modal data [
4]. The multi-modal condition is a condition where a feature of data is distributed in multiple areas. Multi-modal data come from heterogeneity, both in the natural and human social worlds. The fusion of the data that comes from a heterogeneous source produces multi-modal data. For example, several users in an online shopping website have different preferences for the same choice (item). Another example is the prediction of an election result. Say there are candidates in an election. Candidate A is voted for by residents that are aged below 40 (0 − 40), while candidate B is voted for by residents that are aged in the range of 40–60, and candidate C is voted for by residents that are aged below 30 (0 − 30) and between 45 and 60 (45–60). We can say that candidate C (class C) has multi-modal data because its feature spreads in two areas, while candidates A and B (class A and class B) have unimodal distribution. Research of multi-modal data analysis has been conducted in various areas, e.g., medical image analysis, video analysis, facial expression, surveillance, and sentiment analysis [
5,
6,
7,
8,
9]. Other studies have been conducted in the special cases of multi-modal classification, such as real-time and large-scale multi-modal classification [
10,
11]. Because of their high variability characteristics, multi-modal data need special treatments to learn [
12,
13]. In some cases, regular classifiers cannot properly fit the data because the data have multi-modality. This causes the performance of classifiers to drop significantly. This study was conducted to solve the challenge. This study was aimed at developing a classification model to handle multi-modal data classification.
In order to classify multi-modal data, a classifier should be improved from its basic structure. The improvement of classifiers can be conducted by using several approaches, e.g., clustering, incremental learning, and ensemble learning [
14,
15,
16,
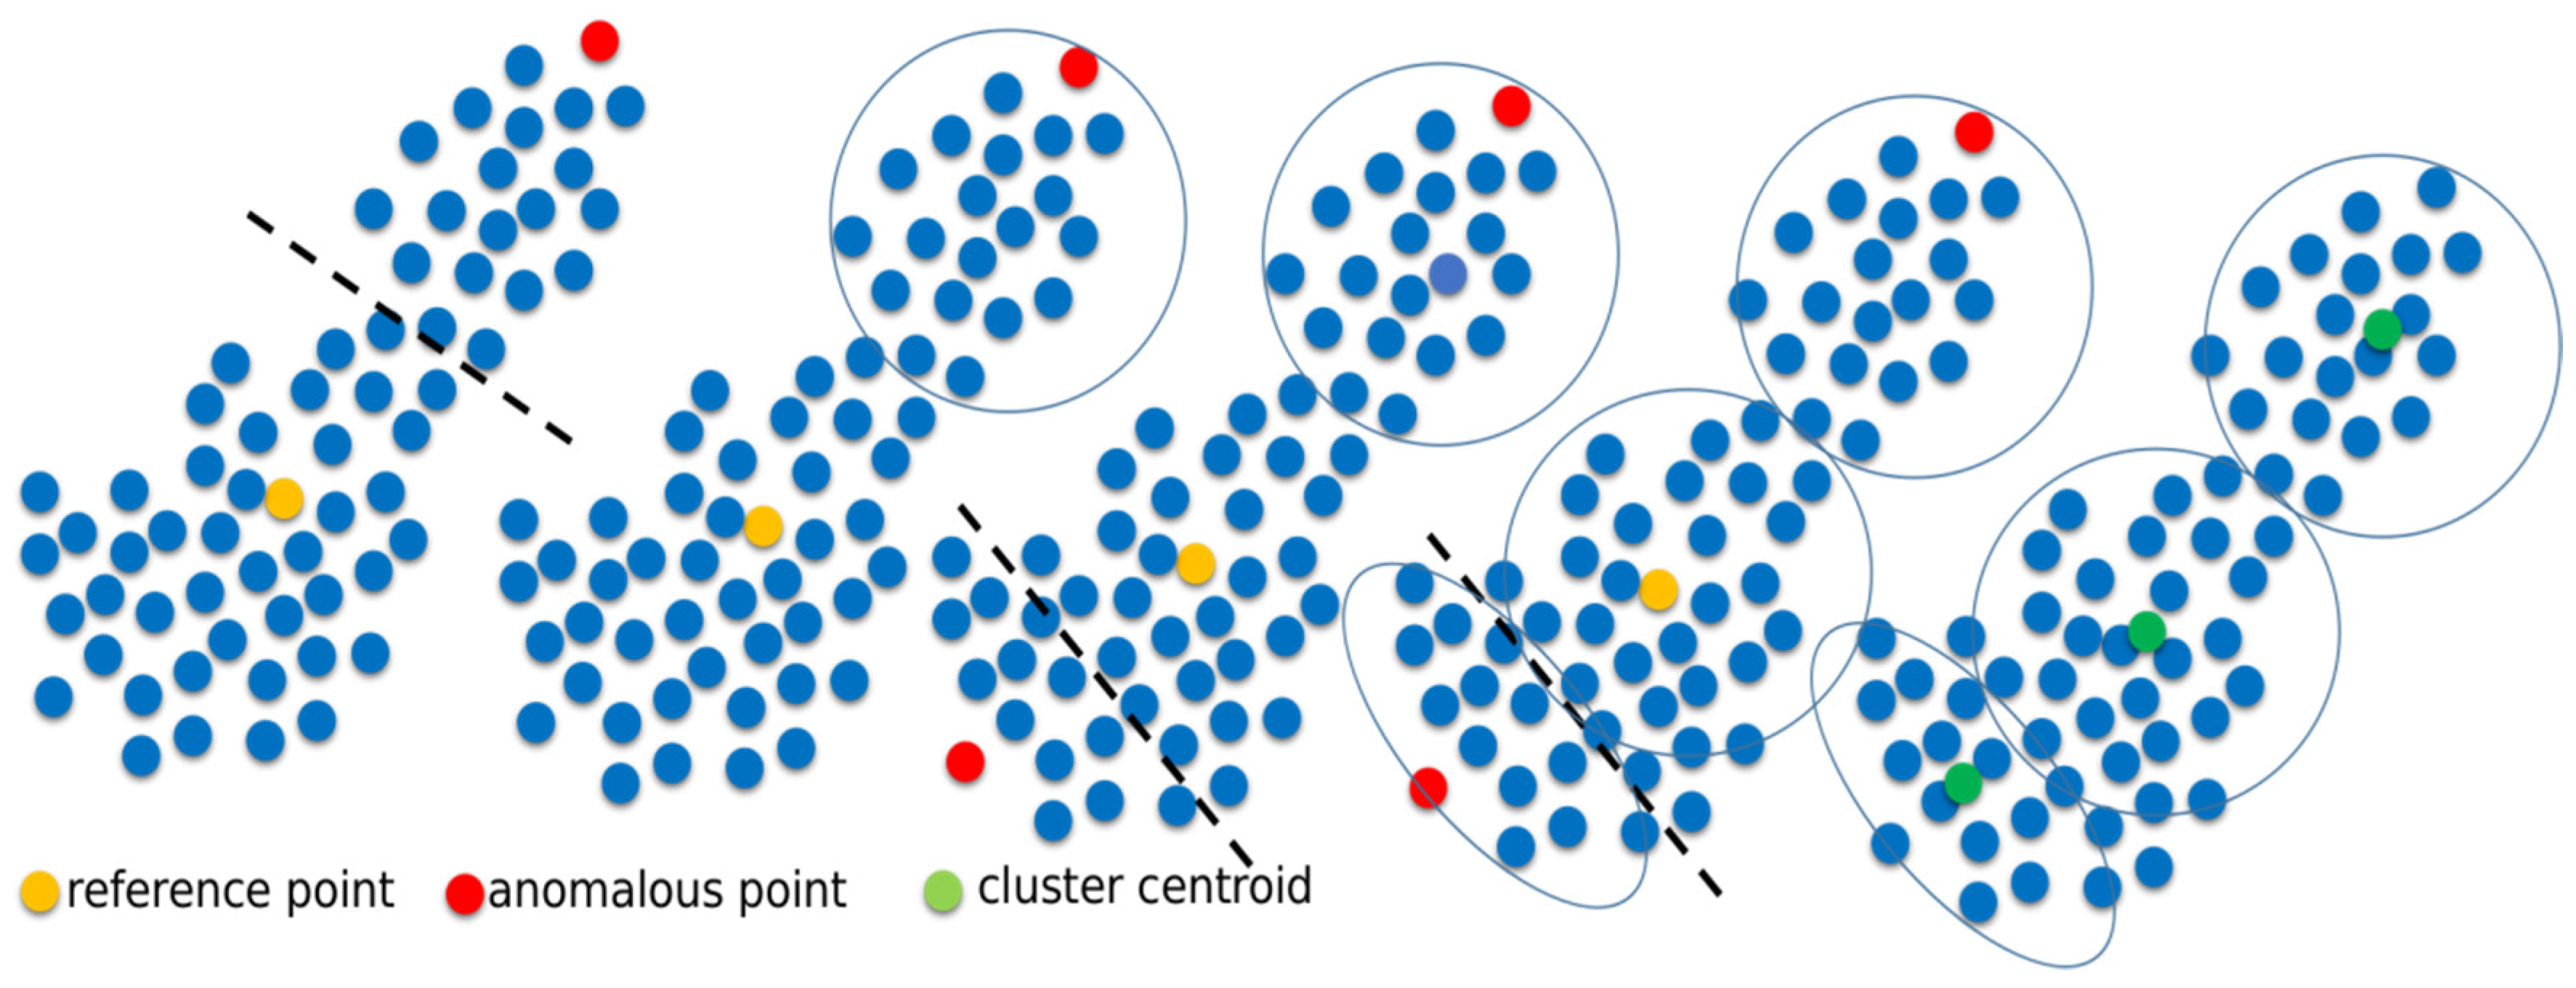
17]. In an ensemble approach, the method generates and trains multiples prototypes and then combines them by using some defined rules. The samples of ensemble approaches are voting, weighted voting, and bagging. The other approach to improve classifier structure is that of incremental learning. By using an incremental learning approach, the classifier gradually builds its structure by adding new references (codebooks) during the training process. In the incremental learning method, the classifier generates a new reference if the condition to generate a new codebook is sufficient. Clustering is a method for grouping data. The data are grouped (clustered) into several groups (clusters). After being clustered, the data in each group are used to form classifier references (codebooks) before the training process.
This study is a continuation of previous studies. In a previous study, we proposed a multi-codebook Learning Vector Quantization (LVQ)-based neural networks by using clustering methods [
14]. In that study, we used K-means [
18], a Gaussian mixture model (GMM) [
19], and intelligent K-means based on anomalous pattern clustering [
20]. In another study, we tried to search for alternative intelligent clustering for generating multi-codebook neural networks [
21]. In the previous study, we proposed a multi-codebook based on an intelligent K-means method based on histogram information. This study is also a continuation of our preliminary study about multi-codebook fuzzy neural networks that use incremental learning [
15]. Our preliminary research showed that static incremental learning improves the performance of the neural networks, but, in some cases, its performance is lower than the original version. However, the dynamic thresholds performs better than the static incremental learning and original neural networks. In this study, we propose two types of multi-codebook fuzzy neural networks for multi-modal data classification, one using intelligent clustering and the other using dynamic incremental learning. The first contribution of this study is the further investigation into the multi-codebook neural networks based on intelligent K-means clustering that have been previously proposed [
14,
21]. The second contribution is the proposal of new versions of multi-codebook neural networks that use dynamic incremental learning, which is hereafter referred to as the multi-codebook fuzzy neural networks that use version 2 of incremental learning. Additionally, we continue the investigation of multi-codebook neural networks by using static incremental learning. Third, we compare multi-codebook neural networks by using intelligent clustering and incremental learning in the synthetic and benchmark datasets. Additionally, we compare the proposed method with existing popular classifiers in the benchmark datasets such as Naïve Bayes, support vector machine (SVM), multi-layer perceptron (MLP), tree bagging, and random forest [
22,
23,
24,
25,
26,
27]. We additionally compare the proposed method to convolutional neural networks (CNNs) in the benchmark dataset [
28]. The last contribution of this paper is the proofing of a significant improvement of the proposed methods from the original neural networks by using ANOVA statistical testing.
Clustering is used to separate the data per class and build codebooks for a class. This approach is simple but can effectively increase the performance of a classifier. An intelligent clustering or non-parametric clustering is a variant of clustering where the algorithm can measure the number of the clusters on its own, while in parametric clustering, the algorithm needs a cluster number as input. In parametric clustering, we need to try several values of cluster numbers to achieve the best result, while in intelligent clustering, we do not need to observe the variation of cluster numbers. Therefore, in this study, we propose intelligent clustering to generate multi-codebook neural networks. An incremental learning method is utilized to enhance neural networks because of the method’s adaptive characteristics to the dataset during the training process. The method generates new references during the training process only when necessary. In another hand, the ensemble learning and clustering approaches generate several references before the training process. The incremental learning can be conducted by using static and dynamic thresholds. A threshold is a value that is used in the condition for generating a new codebook. In this study, we propose dynamic thresholds for incremental learning to reduce experimental costs for finding the best thresholds parameter.
In this study, we utilized a single hidden layer fuzzy neural network called fuzzy neuro generalized vector quantization (FNGLVQ) as the base classifier. FNGLVQ was proposed by Setiawan et al. for arrhythmia classification [
29]. The original FNGLVQ uses one codebook per class. The codebook of each class is a vector with m elements, where m is the number of features. FNGLVQ has a good performance in a unimodal dataset, although the dataset has high overlapping features. In the other side, the performance of FNGLVQ in a high overlapping multi-modal dataset is low. The other reason for choosing FNGLVQ is its simple structure compared to other popular neural networks such as deep neural networks and MLP. Because of these reasons, this study proposes the development of a multi-codebook FNGLVQ by using intelligent clustering and incremental learning. The multi-codebook FNGLVQ that uses intelligent clustering builds several prototypes (codebooks) before the training process to cover the multi-modal distribution of the features, while the multi-codebook FNGLVQ that uses incremental learning generates a new codebook during the training process when the existing codebook cannot cover the multi-modal distribution of the input data. FNGLVQ is a single hidden layered fuzzy neural network that was developed from generalized learning vector quantization (GLVQ), and GLVQ itself is an enhancement of learning vector quantization (LVQ) version 2.1 that is usually called LVQ2.1. Learning vector quantization (LVQ) is a simple artificial neural networks (ANN) that utilizes the winner take all approach for its update rule [
30]. LVQ2.1 is a modification of LVQ that uses a limitation called window for the update process, while GLVQ minimizes errors during the training process [
31]. Adding fuzzy a membership function to GLVQ results in FNGLVQ [
29].
This paper is organized in several sections. The first section is the introduction of the study. The second section discusses the related works. The third section discusses FNGLVQ, which is used as the base classifier in the proposed method. Section four explains the intelligent clustering dynamic that uses incremental learning. The fifth section discusses the proposed method in detail. Then, the fifth section discusses the experiment results along with analysis. The seventh section is the conclusion of the study and is followed by the future works section.
2. Related Works
Multi-modal data classification has become a challenge in the field of machine learning. Several studies have been conducted to deal with multi-modal data. Corneanu et al. analyzed multi-modal data for facial expression recognition [
5]. Their study used red-green-blue (RGB), 3D, and thermal data. Soleymani et al. conducted a survey regarding multi-modality in sentiment analysis problems [
6]. Kumar et al. conducted a survey regarding multi-modality and multi-dimensionality in medical imaging analysis [
7]. Oskouie studied multimodal feature extraction and fusion for the semantic mining of soccer videos [
8]. Zhang et al. study multi-modality in Alzheimer’s disease classification [
32]. Several studies have been conducted to improve classifiers through the use of incremental learning. Cauwenberghs et al. utilized incremental learning to enhance SVM classifiers [
33]. Molina et al. also developed a similar approach for prostatic adenocarcinoma classification [
34]. Huang et al. improved extreme learning (ELM) by using incremental learning [
35]. On the other hand, several studies have been conducted to improve neural networks by using clustering approaches. In the previous study, Ma’sum et al. utilized K-means, the GMM, and IK-means to enhance LVQ-based neural networks [
14]. In another study, Ma’sum et al. combined clustering with unsupervised extreme learning machines to enhance neural network algorithms [
36]. The other approach for enhancing classifier performance is by using ensemble learning, as was done by Krawczyk et al. and Ortiz et al. [
17,
37]. In this study, we only discuss intelligent clustering and incremental learning.
As mentioned before, this study used FNGLVQ as the base classifier. FNGLVQ was developed from GLVQ, and GLVQ was developed from LVQ. LVQ is a simple neural network classifier that uses the winner take all principle [
29]. The winner is the class whose reference vector is closest to the input vector. LVQ uses the winner vector as the center of the training/learning and testing processes. LVQ was proposed by Kohonen et al. as the supervised version of the self-organizing map (SOM). LVQ has several variants, e.g., LVQ1, LVQ2, LVQ2.1, and LVQ3. The variants of LVQ were developed by using a limitation called the window for updating conditions in the learning process. LVQ2.1 was then enhanced by adding optimization procedures, resulting in GLVQ [
30]. The optimization is applied during the training process. Therefore, the error rate is minimized from iteration to iteration. In many cases, the performance of GLVQ has been shown to be superior to all variants of LVQ. GLVQ was modified by Setiawan et al. by using a fuzzy membership function [
28]. FNGLVQ was originally used for arrhythmia classification based on electrocardiogram (ECG) signals. The other development of the LVQ classifier was conducted by Kusumoputro et al., who used the fuzzy principle in LVQ, resulting in fuzzy neuro learning vector quantization (FNLVQ) [
38]. FNLVQ was optimized by using particle swarm optimization (PSO), resulting in FNLVQ-PSO [
39]. Another study enhanced GLVQ by engineering its adaptation property as the integration of feature extraction and classification algorithm [
40].
A popular development of neural networks classifiers has been in the deep learning area. Many deep learning methods have developed from convolutional neural networks. One popular algorithm is that of the deep convolutional neural network (deep CNN) [
41]. The other popular model of CNNs is that of the very deep convolutional neural networks that are as popular as the Visual Geometry Group (VGG) model [
28]. The other notable development of CNNs is that of densely connected convolutional networks (DenseNet) [
42], residual neural networks (ResNet) [
43], neural architecture search network (NASNet) [
44], and MobileNet [
45]. All the above-mentioned methods have been developed for image classification. Many of the methods mentioned earlier require a 32 × 32 image as input, and the others require a bigger sized image as input. As for the comparison in this study, we used the modified version of the VGG model that only uses the first block of its convolution blocks. The above-mentioned methods did not handle the data used in this study, as many of the data have a far smaller number of features.
3. Fuzzy-Neuro Generalized Learning Vector Quantization (FNGLVQ)
Fuzzy-neuro generalized learning vector quantization (FNGLVQ) is an improvement of generalized learning vector quantization (GLVQ) by adding a fuzzy membership function. The fuzzy membership function can be used to handle overlapping data. FNGLVQ was proposed by Setiawan et al. for heart disease classification based on ECG signals [
3]. GLVQ improves upon LVQ2.1 (a variant of LVQ) by adding error minimization during the training process. LVQ is a simple neural network that uses a winner take all approach for the learning process. The algorithm defines the winner class (w
1) as the class in which its weight (codebook/reference vector) is the closest to the input vector. During the training process, the weight of the winner vector is updated. If the winner class is the same as the input vector, then its weight is adjusted closer to the input vector. Otherwise, its weight is adjusted further from the input vector. LVQ2.1 modifies LVQ by adding an update rule for the runner up class. In the LVQ2.1 algorithm, the runner up class (w
2) is a class whose weight is closest to input vector but comes from different class labels. GLVQ and FNGLVQ are enhancements of LVQ2.1 that use the same approach. These algorithms use the winner and runner up classes in their training processes. During the training process, the methods minimize misclassification errors.
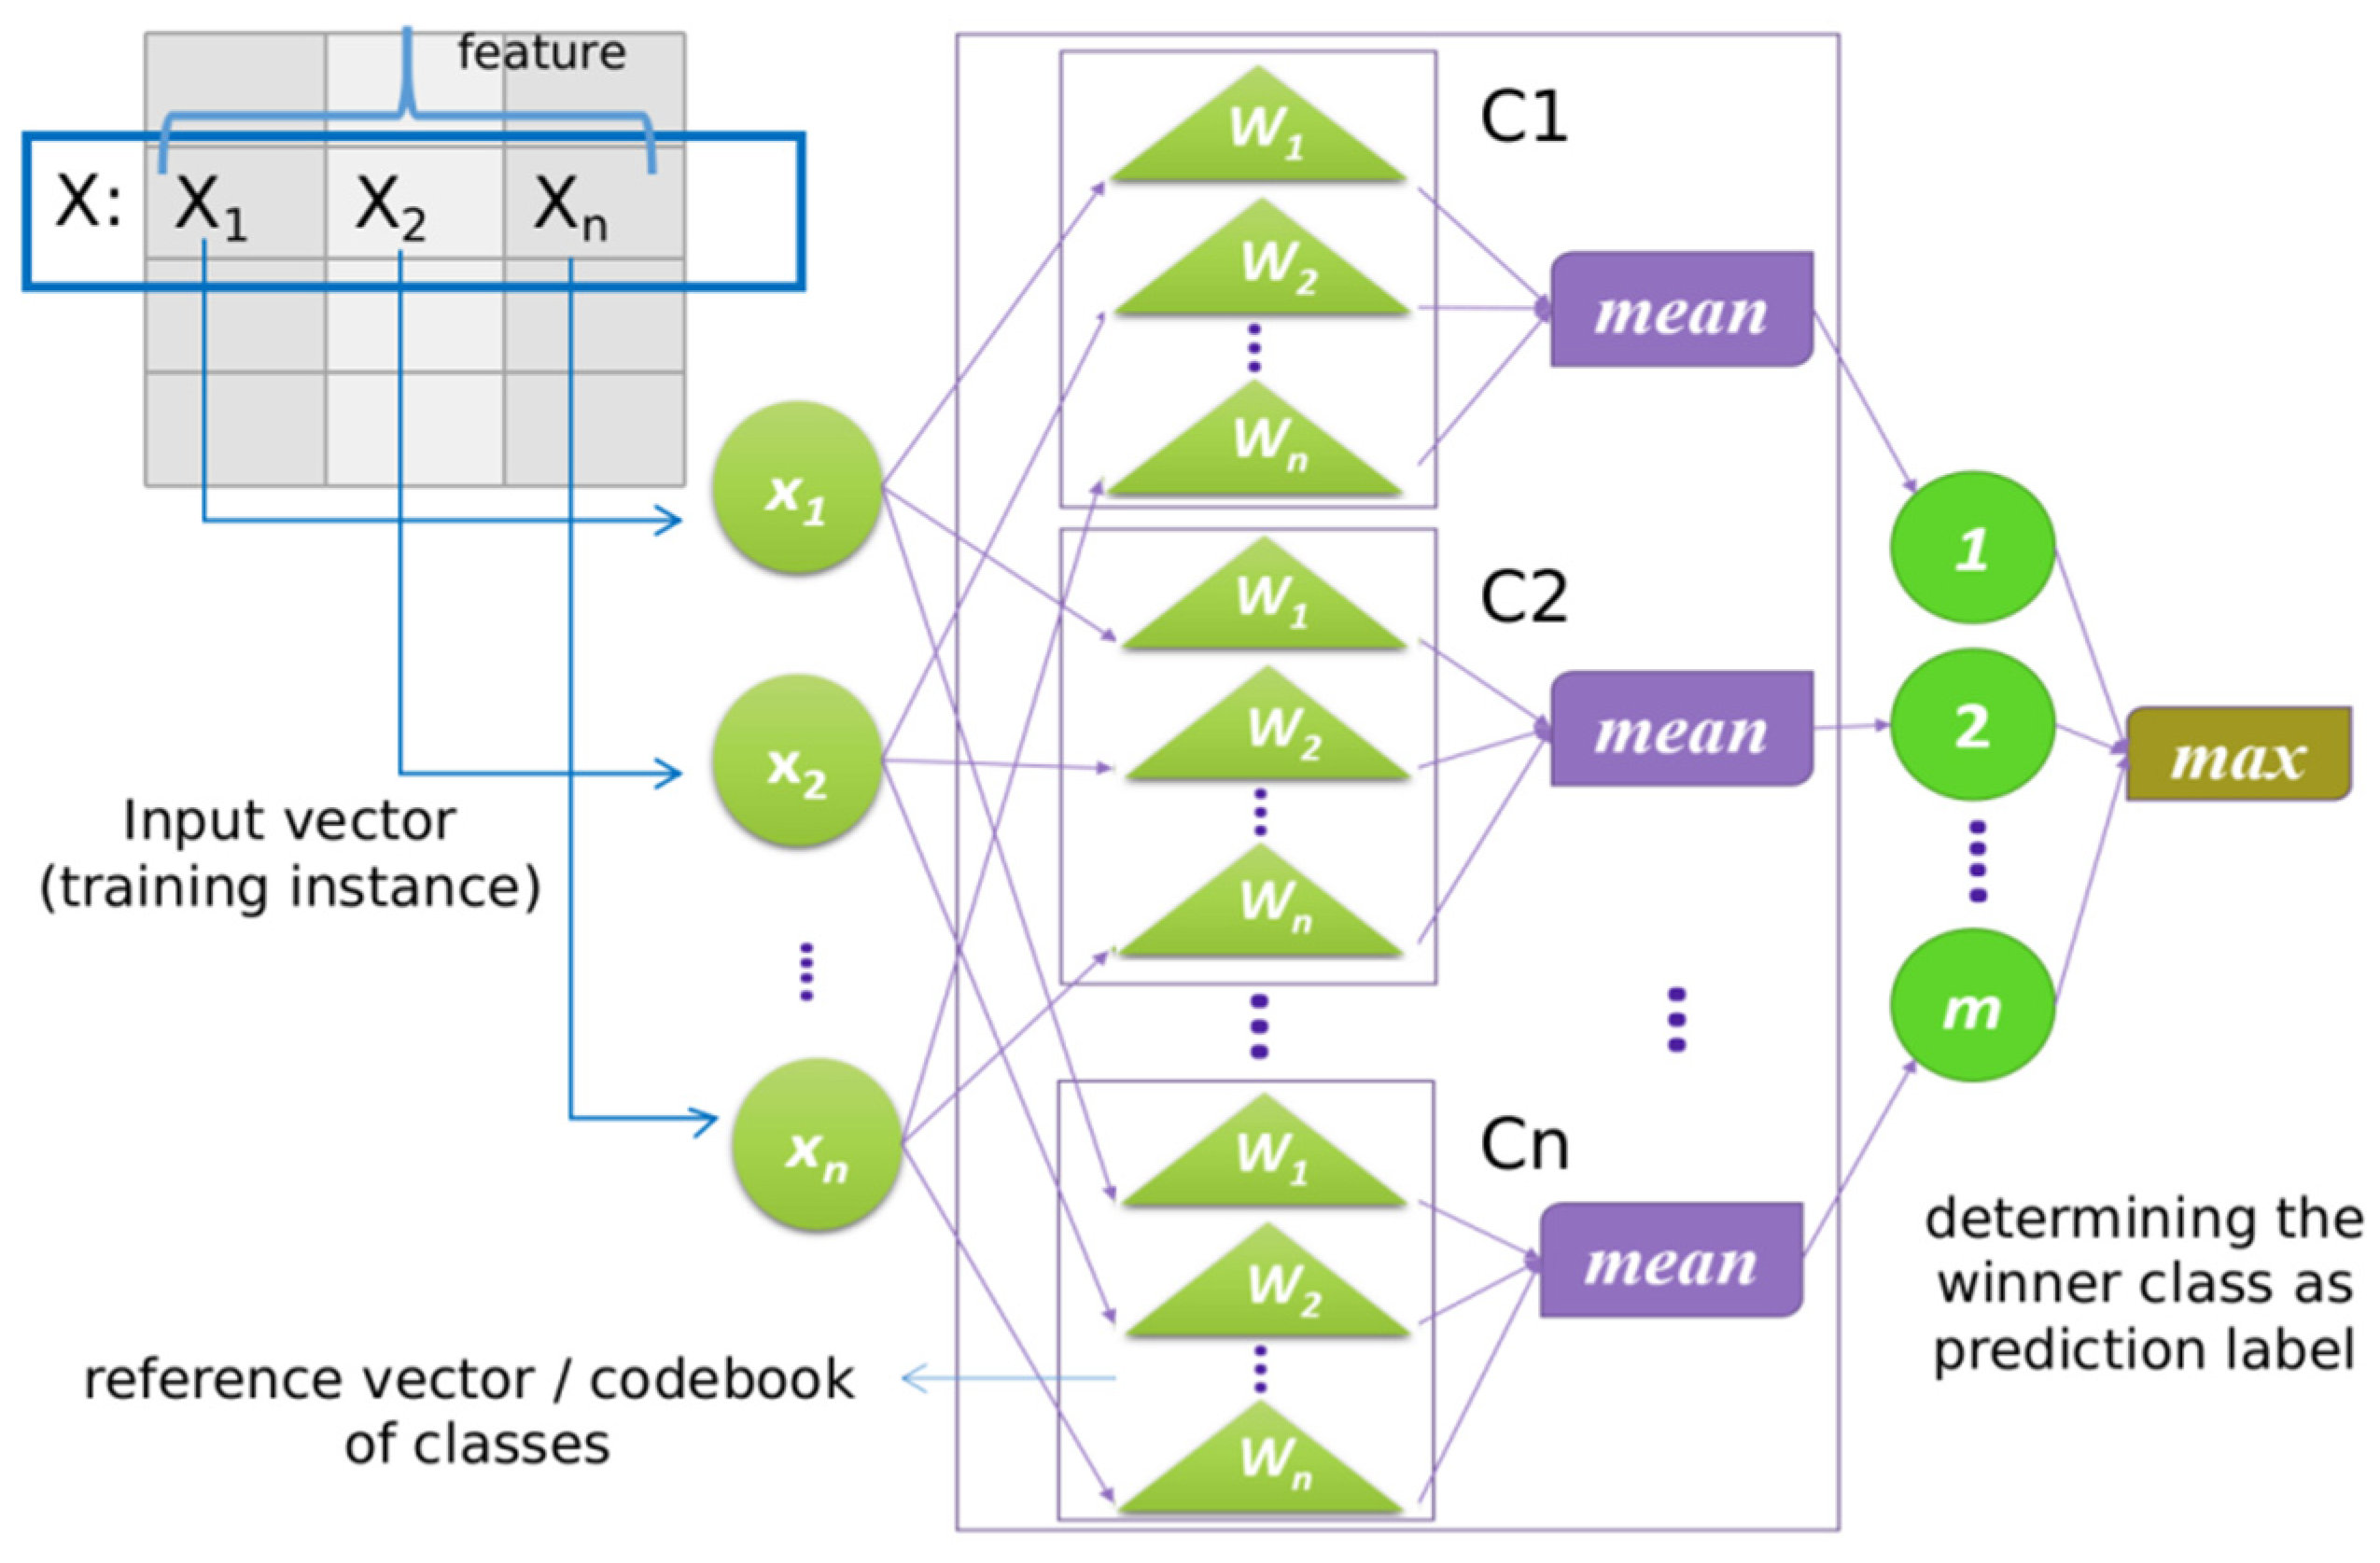
The FNGLVQ architecture is illustrated in
Figure 1. The figure shows that the vector x is an input for the algorithm. In FNGLVQ, each class has a weight, as illustrated by triangle shape in the figure. Each class has n weights (w
1, w
2, w
3, …, w
n) where n is the number of features of the dataset. Please note that w
1 and w
2 in this context are the weights of features 1 and 2 of their class, not the symbols of the winner and runner up vector, as discussed before. Each weight has three values (w
i min, w
i mean, w
i max) because the method uses fuzzy membership. In the learning process, the method computes the distance between input vectors and the weights of each class. As the data have n features, the measurement of the distances is conducted for all features, and then the mean of the distances is calculated. Then, the method finds the winner and runner up classes based on the mean distance from the classes to the input vector. Last, the method updates the weight of the winner and runner up classes. The GLVQ classifier defines misclassification error as written in the equation below:
where
is the distance of the input class and winner class and
is the distance of the input and the runner up classes. FNGLVQ adapts the approach from GLVQ. In the training process, the FNGLVQ method uses a similarity value instead of distance to determine the winner and runner-up vectors. The distance is defined as d = 1 − µ. Substituting the distance equation into the misclassification error modeled in GLVQ results in the equation below:
where µ
1 is the similarity value between the input sample (input vector) and the winner vector, whereas µ
2 is the similarity between the input sample (input vector) and the runner up vector. The winner vector is the closest existing reference vector (codebook) from the same class C
x = C
w1, whereas the runner up vector is the closest existing reference vector from a different class C
x = C
w2. The similarity value is computed by the equation below:
FNGLVQ uses a cost function, as defined in GLVQ, to minimize misclassification errors during the training process. The cost function (
S) is defined in the equation below:
where
f is monotonically increasing function and N is the number of iterations (epoch) in the training process. GLVQ uses the sigmoid function for
f. In the training process, FNGLVQ uses the steepest descent method used in GLVQ, as defined in the equation below:
The derivation of the cost function (
S) to the weight (
w) is defined by the equation below:
The FNGLVQ method uses a triangular function for its reference vectors (codebooks). Therefore, each of the reference vectors (weights) has three values (wmin, wmean, wmax). The derivation of the update rule to (wmean) is divided into three conditions and leads to the FNGLVQ learning (training) formula, as follows:
If
If
If
and
where
w1 (winner class) is the closest reference vector (codebook) from the same class as the input vector
Cx =
Cw1, and
w2 (runner up class) is the closest reference vector (codebook) from a different class. The update rules for the other two values in fuzzy membership (
wmin and
wmax) are conducted by using the equation below:
The symbol
represents the learning rate that has a value between 0 and 1. In FNGLVQ, the learning rate value decreases along with the iteration number (t). The update of the learning rate value follows in the equation below:
FNGLVQ defines additional rules to adjust
wmin and
wmax to gain better performance as follows. If (μ1 > 0 or μ2 > 0) and
< 0, then the method increases fuzzy triangular width by using the equation below:
If input data are predicted into the wrong class (
≥ 0), then the method decreases the triangular width by using the equation below:
If μ1 = 0 and μ2 = 0, then the width of fuzzy triangular vectors must be increased by using equation below (the
is a constant):
The training process of FNGLVQ is conducted with the following steps:
Given that the training set consist of m record instances (X1, X2,…, Xm), each instance is a vector of n elements because the data have n features.
Initiate the codebook (reference vector/weight) of each class (w) by a random selection of training set for the respective class.
For each instance of the training data, train the weights of the classes by using Equation (3) and Equations (7)–(20)
Repeat step 2 until N number of iterations (epoch)
The testing process of the FNGLVQ algorithm is simply conducted by measuring the similarities between the input vector and the codebooks of the classes. Then, the method takes the most similar class as the prediction.
5. Proposed Method: Multi-Codebook Fuzzy Neuro Generalized Learning Vector Quantization (Multi-codebook FNGLVQ)
5.1. The Problem, Motivation, and Idea
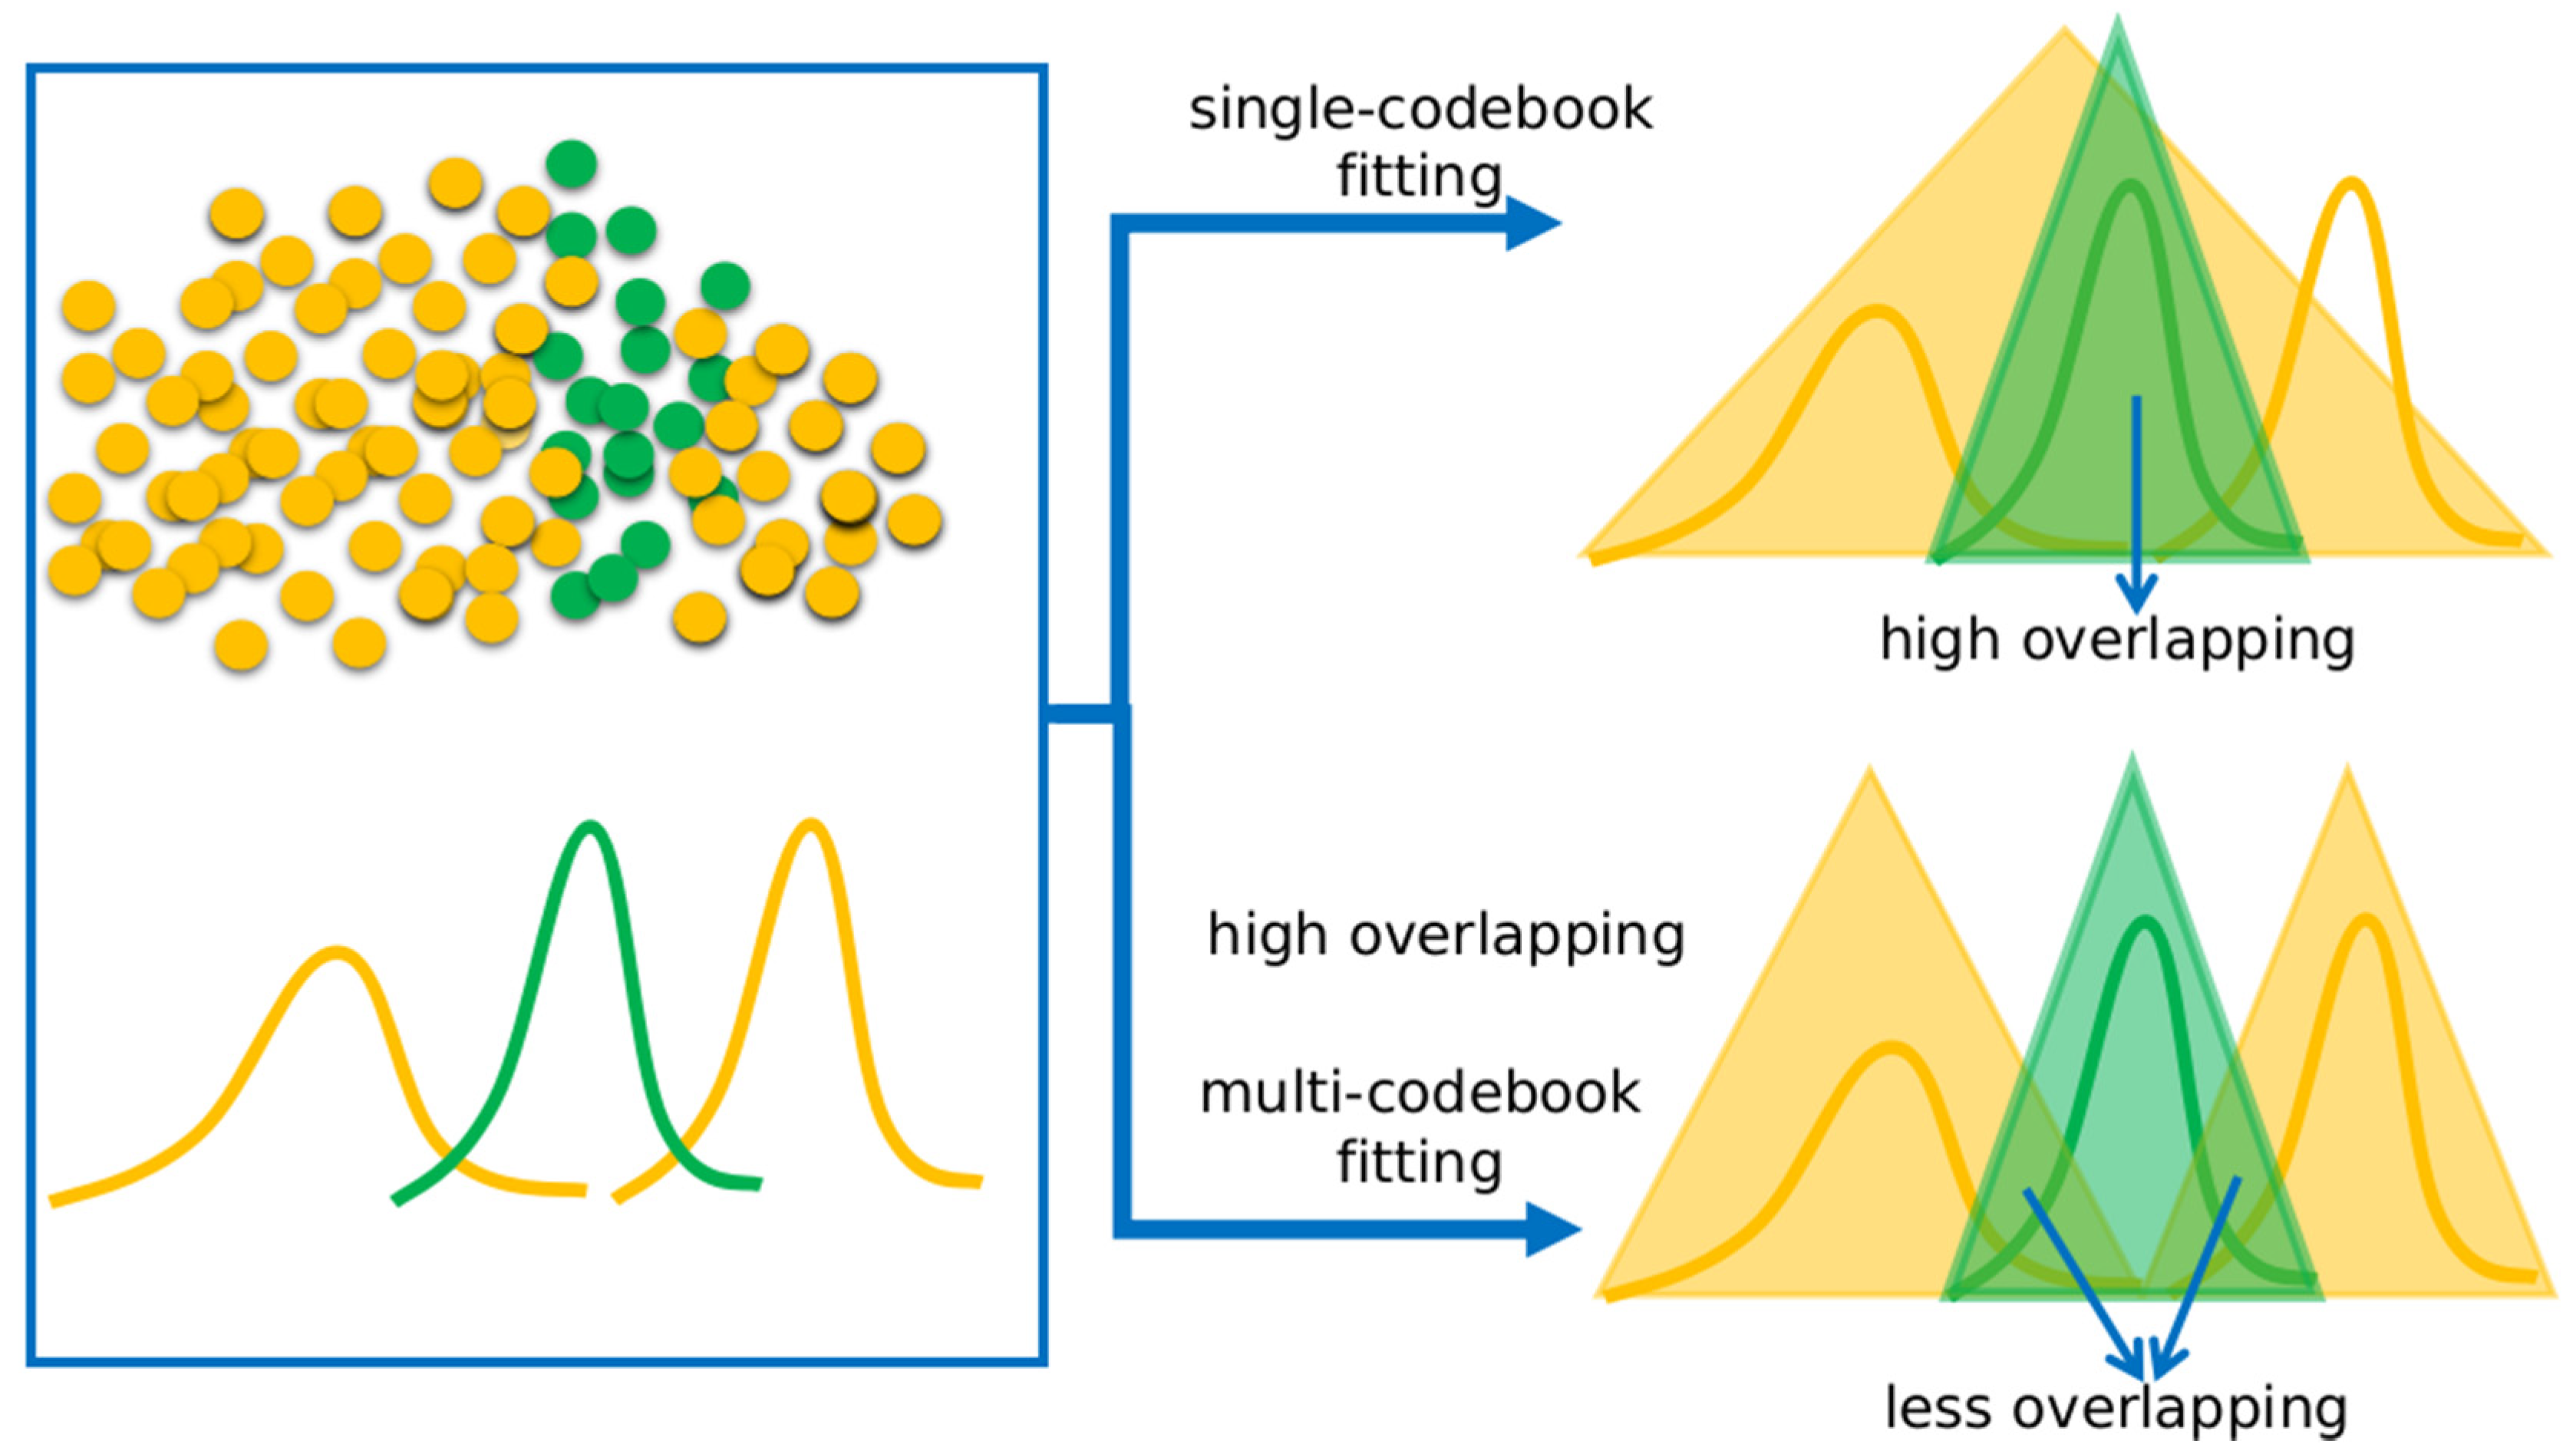
As mentioned in the introduction section, multi-modal data are data who features are spread in several areas. An illustration of multimodal-data is shown in
Figure 4. Look at the
X-axis in
Figure 4. The figure shows the scatter plot and distribution of two classes—A (orange) and B (green). The figure shows that the features of class A are distributed in two areas, while the features of class B are distributed only in one area. We can say that class A has a multi-modal distribution, while class B has a unimodal distribution. The figure also shows that the features of class B are distributed in the area between the class A areas. To fit the data distribution, the fuzzy neural networks generate a fuzzy reference vector (codebook), as illustrated by the triangle.
Figure 4 demonstrates the two approaches of fitting: by using a a single codebook (single reference vector), which is shown in the upper image, and a multi-codebook (multiple reference vectors), which is shown in the bottom image. The figure shows that the fitting done by using a single codebook produces a high overlap between class A and class B, while fitting by using a multi-codebook produces less overlapping between class A and class B. Therefore, the multi-codebook approach fits the multi-modal data better than the single-codebook approach. The following paragraph continues the discussion between a single-codebook and a multi-codebook fitting by using mathematical and numerical analyses.
Figure 4 and
Figure 5 show that the overlapping of class A and class B when using a multi-codebook is less than the overlapping of A and class B when using a single-codebook. In a single-codebook, the codebook of class A is illustrated by triangle 1, whereas the codebook of class B is illustrated by triangle 2, and the similarity (overlapping) between the classes is noted as h
12. Each fuzzy triangle has three values (min, mean, and max), e.g., triangle 1 has a
1, b
1, and c
1 representing its min, mean, and max. FNGLVQ uses a balance triangle so that c1–b1 is the same as b1–a1. In multi-codebook approach, triangle 1 is substituted by triangles 3 and 4, and the similarity between classes is noted as h
23 and h
24. Since there are two codebooks, the worst case overlapping value is max (h
23, h
24) The figure shows that h
23 and h
24 are less than h
12. By using the fuzzy membership function, as used in FNLVQ [
37], we could measure h
12, h
23, and h
24. In the triangle 1 perspective, we could compute h
12 as follows:
In the triangle 2 perspective, we could compute h
12 as follows:
By combining Equations (23) and (25) for same x, we could compute h
12 as follows:
By using the same method, we could obtain the values of
and
as follows:
Assuming that we used a normalized feature space, for the case above we used the following conditions: a
1 = 0, c
1 = 1, l
1 = 0.5, 0 < a
2 < 0.5, 0.5 < c
2 < 1, 0.5 < c
3 < 1, a
4 = c
3, a
3 = a
1, c
4 = c
1, l
4+l
3 = l
1 = 0.5, c
3 < c
2, 0 < l
2 < 0.5, and 0 < l
3 < 0.5.
Table 1 shows several probable values of the triangles that result in values of h
12, h
23, and h
24 that satisfy the conditions above.
Table 1 shows that the value of h
23 and h
24 were less than h
12. The table supports visual description in
Figure 5 that by using the multi-codebook approach, the similarity (overlapping) between class A and class B in FNGLVQ was less than the similarity (overlapping) between class A and class B when using single-codebook approach.
Because of the motivation and analysis above, in this study, we propose multi-codebook FNGLVQ. In this paper, we propose two types of a multi-codebook FNGLVQ—one that uses intelligent clustering and another type that uses dynamic incremental learning. The use of the multi-codebook in fuzzy neural networks is aimed at properly fitting the multi-modal distribution of the dataset. Intelligent clustering is utilized to produce codebook instances before the training process, while dynamic incremental learning is used to build codebooks during the training process. In a multi-codebook method that uses intelligent clustering, codebooks are generated by using intelligent clustering before the training process, and then the codebooks are updated during the training process. The motivation of using intelligent clustering is to minimize the parameter tuning of the classifier. By using intelligent clustering, the method does not need the input cluster number. Therefore, in the experiment, there is no need to find the best cluster number. The intelligent clustering methods in this study are the intelligent K-means clustering based on anomalous patterns and intelligent K-means based on histogram information.
The second type of the proposed method is multi-codebook FNGLVQ that uses dynamic incremental learning. This is the type of the proposed multi-codebook fuzzy neural networks that gradually builds its structure during the training (learning) process. When the condition to generate a new codebook is satisfied, the method generates a new codebook. Similar to the intelligent clustering case, the motivation of using dynamic incremental learning is to minimize parameter tuning in the experiment. By using dynamic incremental learning, there is no need to find the best thresholds for the condition to generate a new codebook. Additionally, our preliminary research showed that incremental learning with dynamic thresholds shows better performance compared to incremental learning with a static thresholds [
15].
5.2. Architecture
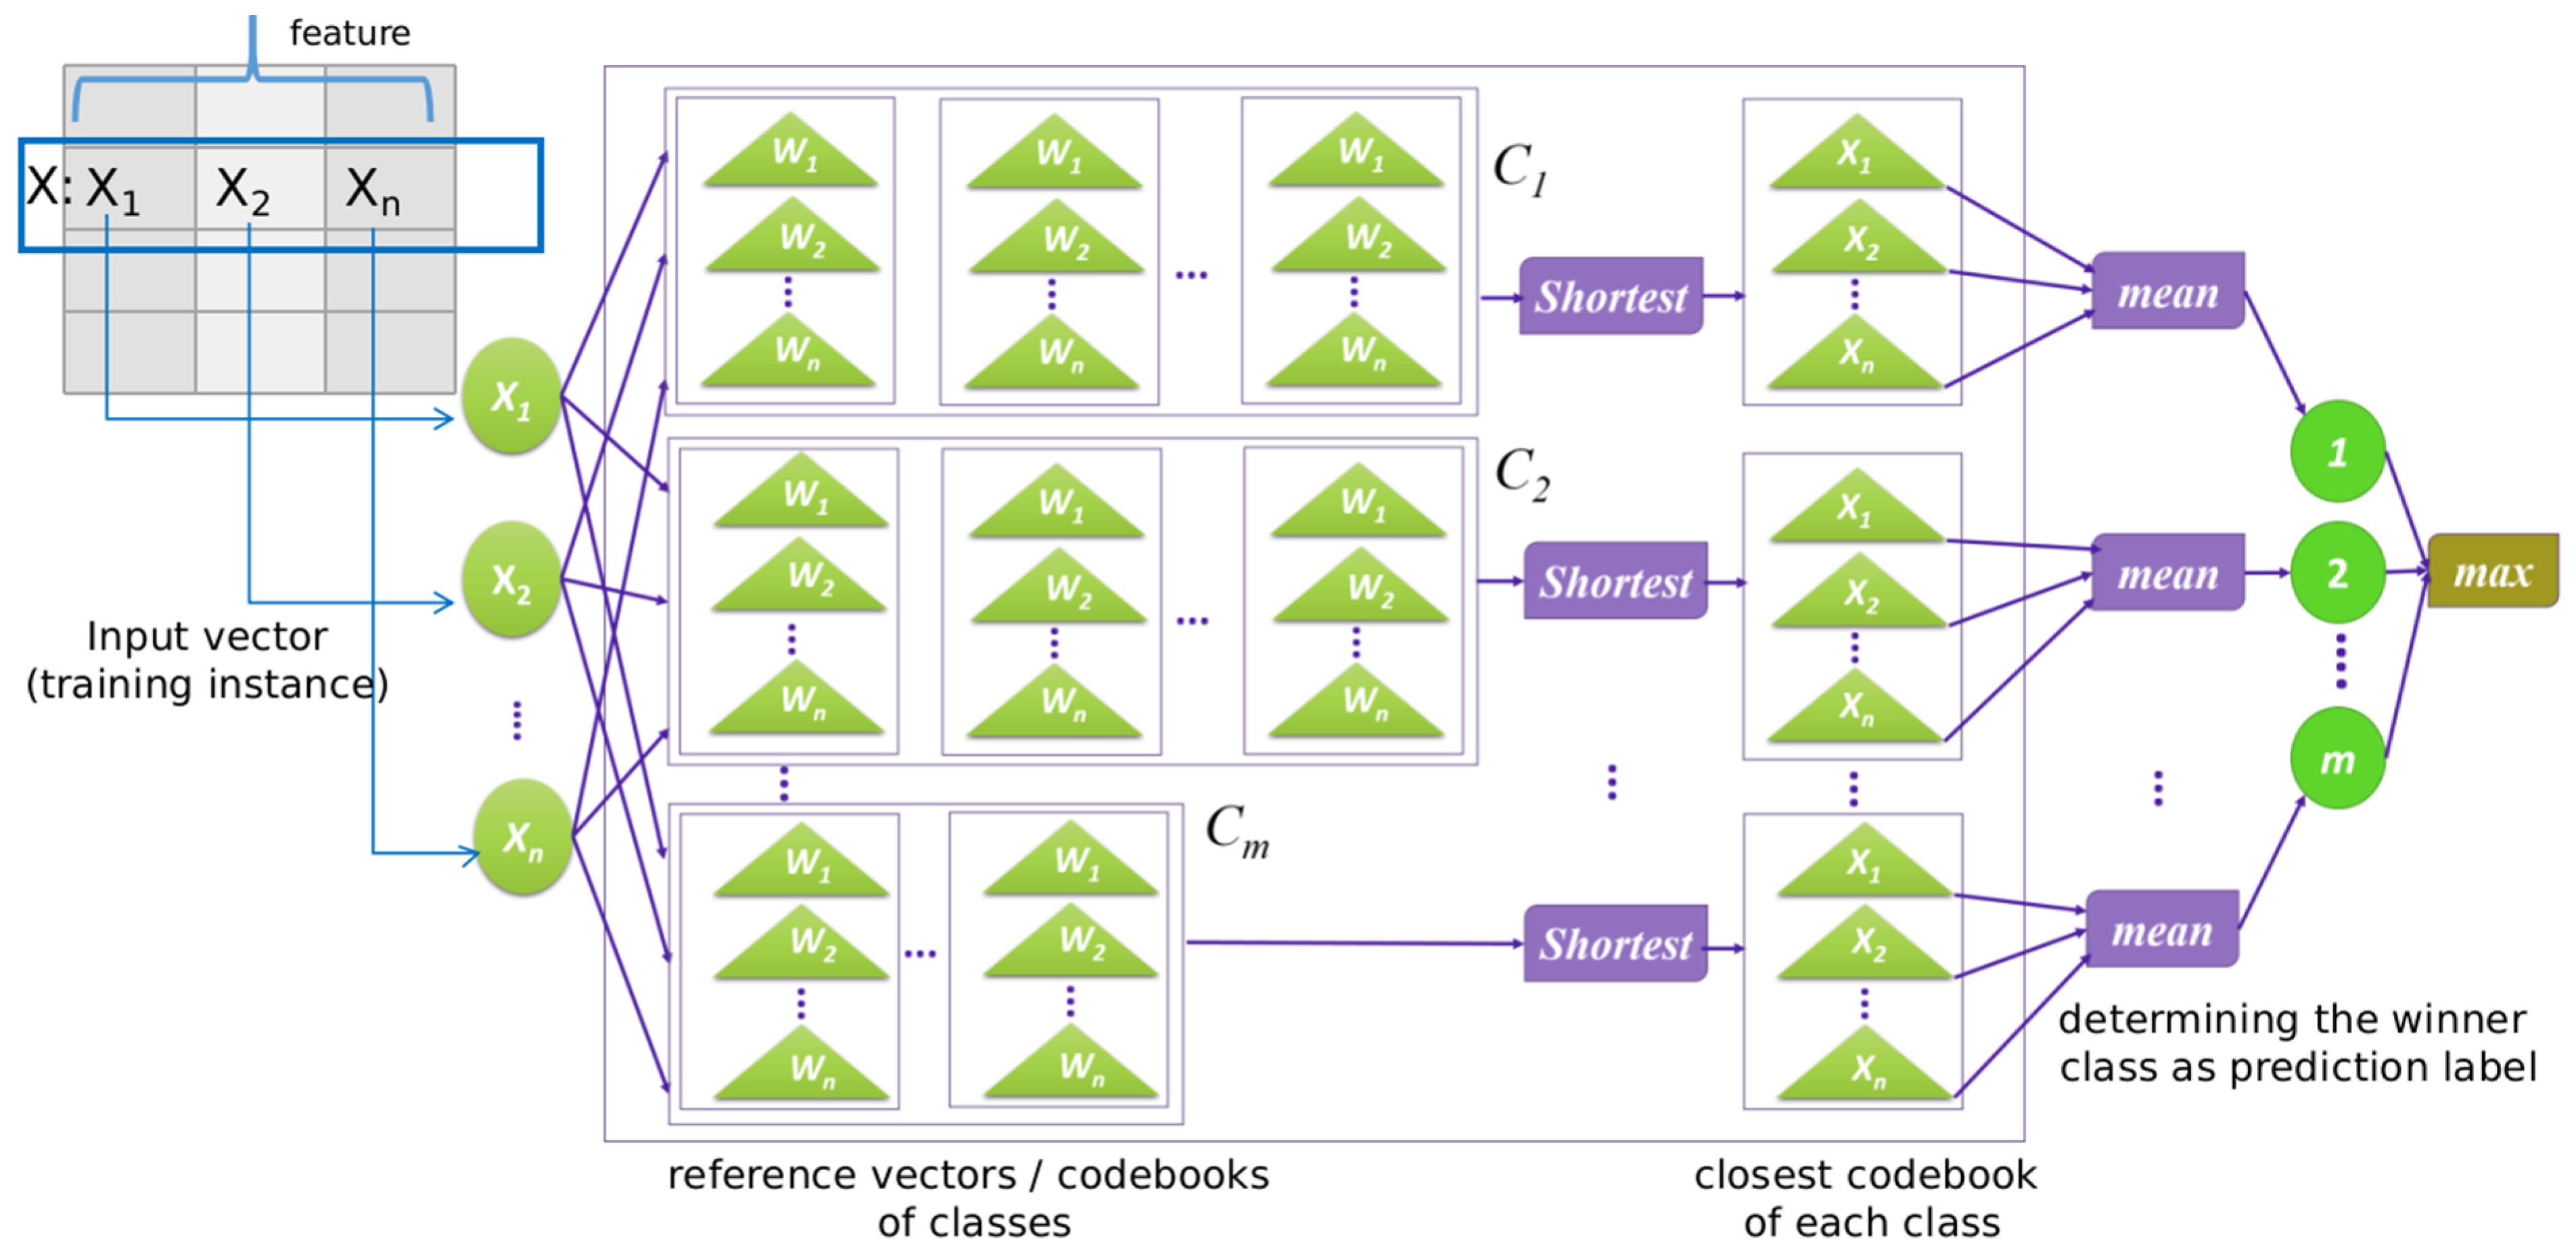
The architecture of the multi-codebook FNGLVQ is similar to the architecture of the original FNGLVQ. As shown in
Figure 6, the multi-codebook FNGLVQ has three layers: the input layer, the middle (hidden) layer, and the output layer. The input layer acquires the input sample for the classifier, the middle layer contains the reference vectors (codebooks) for each class, and the output layer determines the winner vector. The main difference between the multi-codebook FNGLVQ and the original FNGLVQ is in its middle layer. The original FNGLVQ has one codebook for each class, while the multi-codebook FNGLVQ has several codebooks for each class. The number of codebooks between a class and another class may differ. For example, class A and class B have three codebooks, but class C has only two codebooks.
In this study, we propose two types of multi-codebook FNGLVQ methods. The first type is multi-codebook FNGLVQ that uses intelligent clustering. This type has two versions; the first version is a multi-codebook FNGLVQ that uses intelligent K-means clustering based on anomalous patterns, and the second version is multi-codebook FNGLVQ that uses intelligent K-means clustering based on histogram information. The multi-codebook FNGLVQ that uses dynamic incremental learning also has two versions, and we call them the multi-codebook FNGLVQ that uses dynamic incremental learning 1 and the multi-codebook FNGLVQ that uses dynamic incremental learning 2. Those two versions have different conditions for generating a new codebook. Detailed explanations for proposed methods are discussed in the following sub-section.
5.3. Proposed Method: Multi-codebook Fuzzy Neuro Generalized Learning Vector Quantization by Using Intelligent Clustering
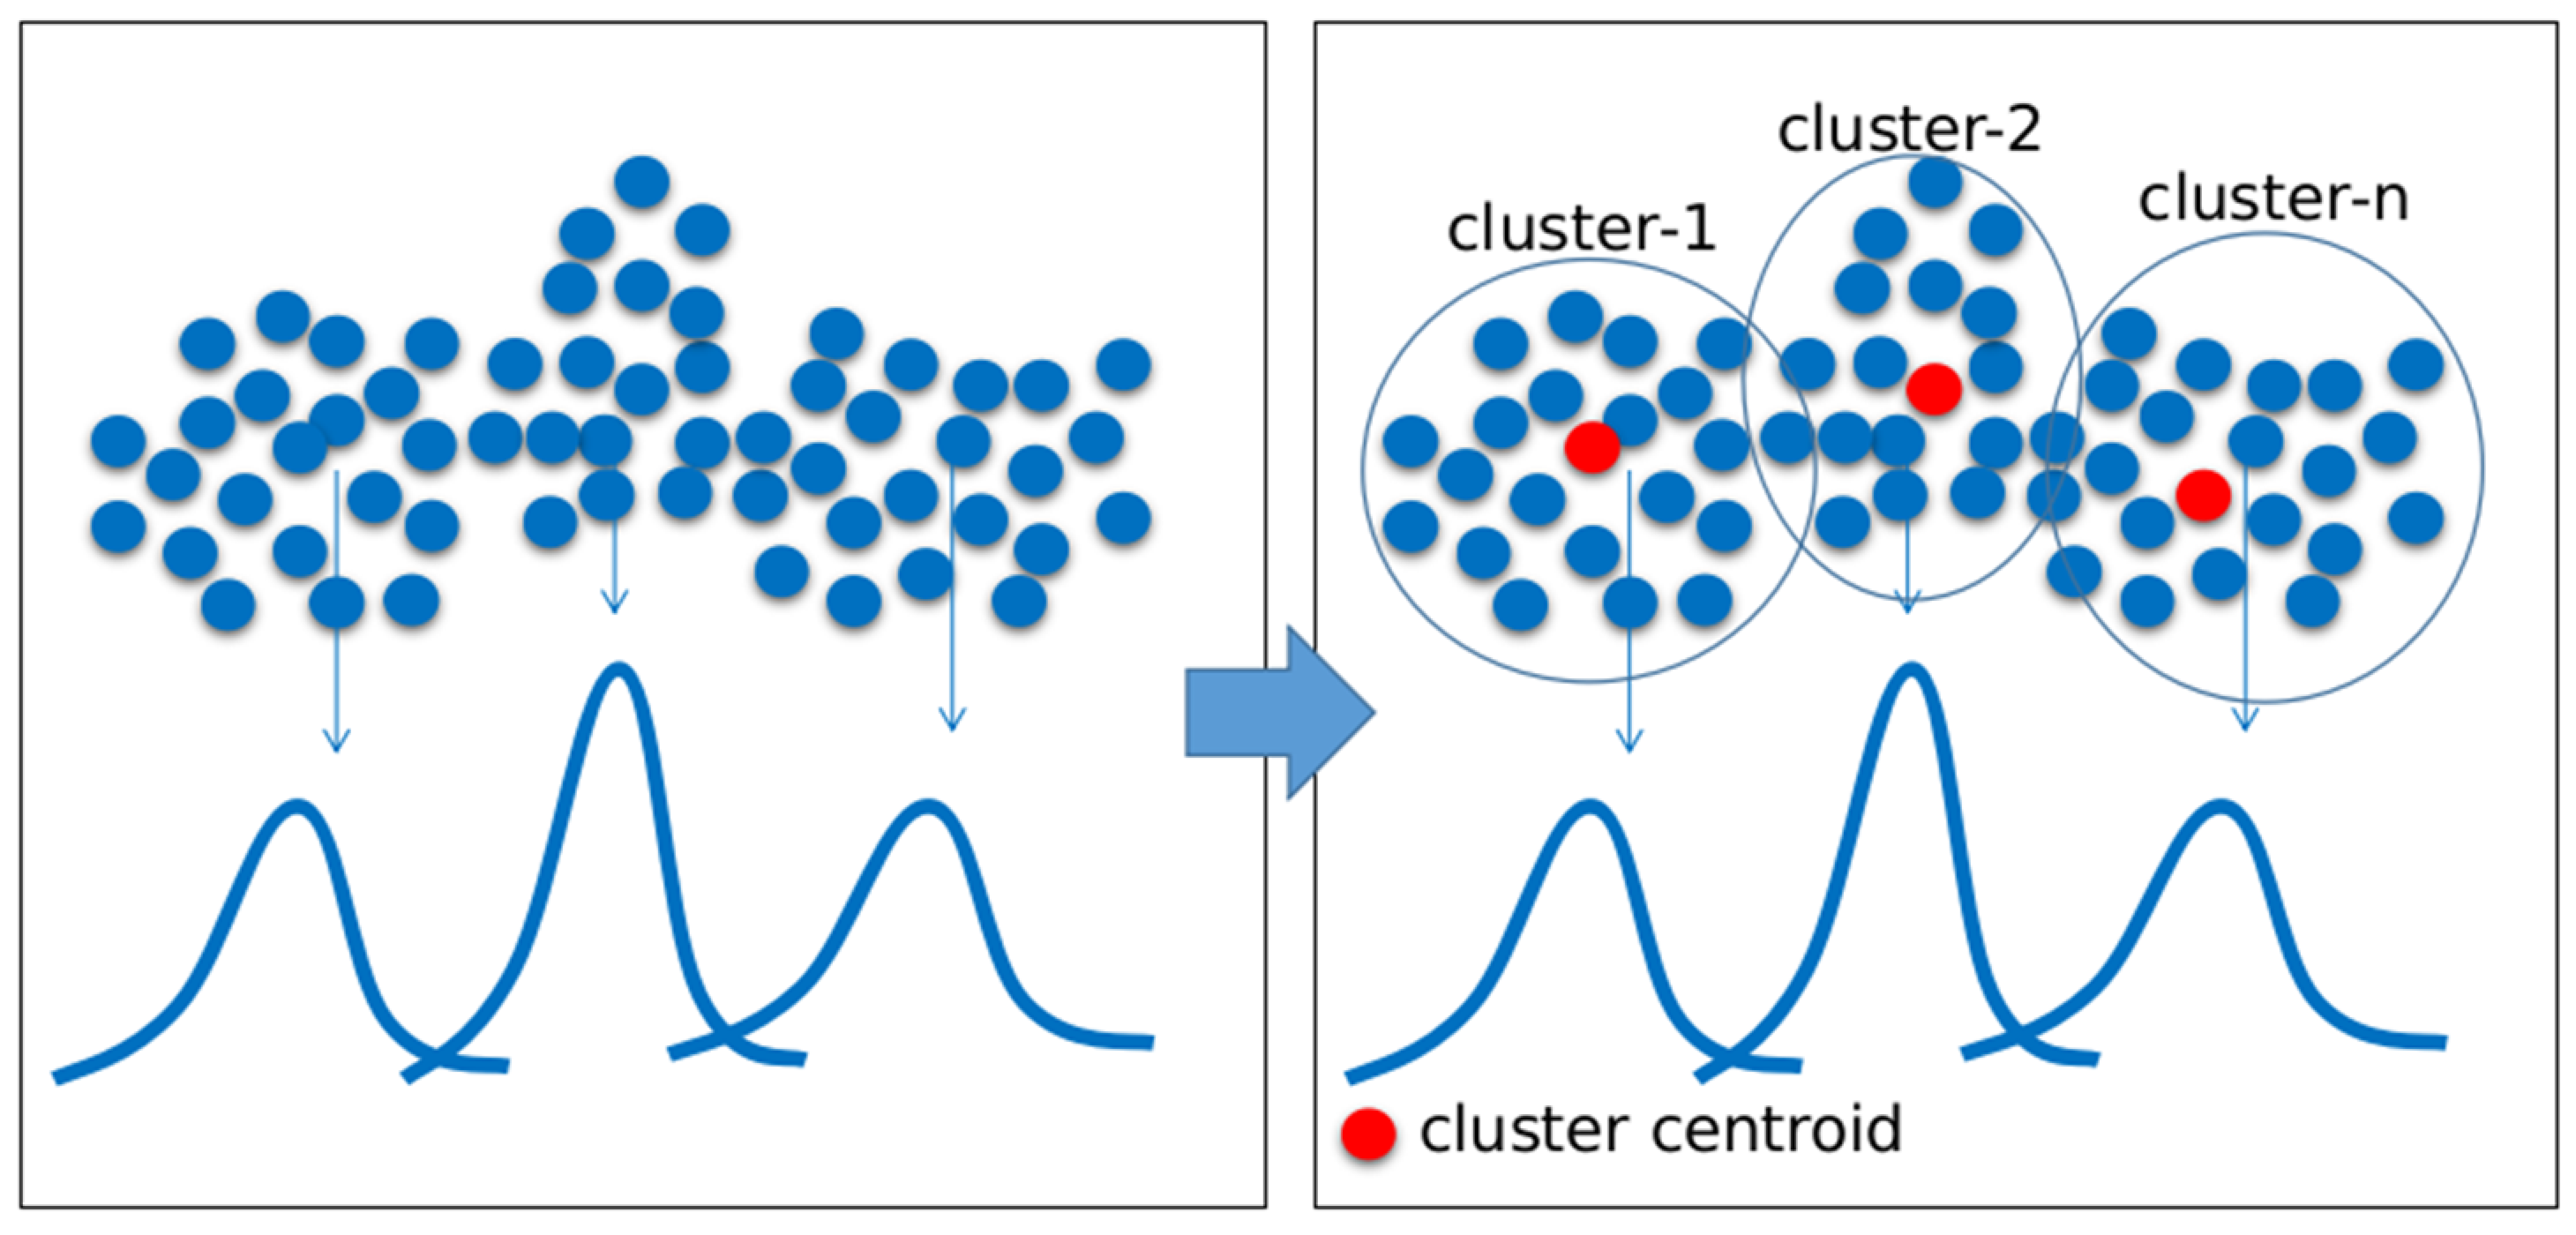
As mentioned before, the first type of the proposed method is the multi-codebook FNGLVQ that uses intelligent clustering. In this type, codebooks are generated by using intelligent clustering. The idea of this method is to divide the data into several groups by using the clustering method. Then, each group is approximated by a reference vector (codebook) of the FNGLVQ classifier. Therefore, multiple codebooks are expected to fit the multiple groups of the data. In other words, the multiple codebooks are expected to cover the multi-modality of the data. The clustering methods utilized in this study are intelligent K-means based on anomalous patterns and K-means based on histogram information. As mentioned before, the motivation of using intelligent clustering is to minimize the parameter tuning during the experiment, as the intelligent clustering does not need the cluster number as the input. The clustering method automatically determines the best cluster number.
There multi-codebook FNGLVQ that uses intelligent clustering has several steps. The first step is dividing the dataset based on class label. The second step is the clustering of the data of each class into a number cluster. Say that the number of clusters is C: In intelligent clustering, the value of C is automatically calculated by the method, not given manually. The next step is the pruning of the small cluster. The clusters with small members are removed from groups. However, the pruning process is optional due to the preference. The next step is the codebook initiation. The method generates a codebook from each cluster. The method then calculates the min, mean, and max values from the instances in each cluster. The process is called fuzzification. The tuple (min, mean, and max) then becomes a codebook for its class in FNGLVQ. If a class has C clusters, then it has C codebooks that are generated before training. Then, the method performs the training process by using the FNGLVQ training procedure. The training process of the multi-codebook FNGLVQ that uses intelligent clustering is conducted with the procedure shown in Algorithm 3.
| Algorithm 3: Multi-codebook Fuzzy Neuro Generalized Vector Quantization By Using Intelligent Clustering |
| 01: | procedure MC-FNGLVQ-CLUSTERING |
| 02: | denote x1, x2, x3, ….xn as instances |
| 03: | denote f1, f2, f3, ….fm as data features |
| 04: | denote c1, c2, c3, ….cy as class labels |
| 05: | for ci = c1:cy do |
| 06: | denote C as number of clusters |
| 07: | denote fc = f1:fm where cc = ci |
| 08: | do clustering to fc, where C is a number of clusters as the result of intelligent clustering |
| 09: | for j = 1:C do//C = number of cluster |
| 10: | denote Cj as member of cluster-j |
| 11: | find min, mean, meax of Cj |
| 12: | Use the min, mean, max to generate FNGLVQ codebook |
| 13: | end for |
| 14: | end for |
| 15: | for xi = x1:xn do |
| 16: | train x by using FNGLVQ method |
| 17: | end for |
| 18 | Repeat step 15–17 until the number of iteration (epoch) is satisfied |
5.4. Proposed Method: Multi-Codebook FNGLVQ by Using Dynamic Incremental Learning
As stated in the introduction section, the second type of the proposed method is the multi-codebook FNGLVQ that uses dynamic incremental learning. Different from the previous type of multi-codebook methods, in the multi-codebook FNGLVQ that uses incremental learning, the reference vector (codebook) of each class is gradually adjusted in the training process. Before training, the method generates one reference vector per class. The generation of the initial codebook is the same as in the original FNGLVQ. The initial codebook can be generated by using all instances or samplings of the data. Then, in the training process, its codebook is gradually built (adjusted). The adjustment is conducted if the condition to generate a new codebook in respect to the current input data is sufficient.
In this paper, we developed two variants of multi-codebook FNGLVQ methods that use static incremental learning and dynamic incremental learning. In the static version, the condition to generate a new codebook is set by using an input thresholds, while in the dynamic version, the condition to generate a new codebook is set by using variables whose values change during the training process. In this study, we propose two versions of multi-codebook methods that use dynamic incremental learning, and these are named multi-codebook that uses dynamic incremental learning 1 and multi-codebook that uses dynamic incremental learning 2. Presented here are the conditions for the static and dynamic versions of the proposed methods.
Multi-codebook FNGLVQ that uses static incremental learning: In this version, a new codebook is generated if the similarity of the winner vector is less than the given thresholds. The winner vector is the nearest codebook/reference vector to the class that is the same as the input vector class. The condition is written in the equation below, and the threshold is a constant that is defined before training:
Multi-codebook FNGLVQ that uses dynamic incremental learning 1: In this version, a new codebook is generated if the similarity of the input vector to its codebooks is less than the minimum similarity of the input vector to the codebooks of other classes. The condition is written in the equation below:
Multi-codebook FNGLVQ that uses dynamic incremental learning 2: In this version, a new codebook is generated if the similarity of the input vector to its codebooks is less than the mean similarity of the input vector to the codebooks of other classes. The condition is written in the equation below:
There is no codebook removal in the proposed multi-codebook FNGLVQ. It is applied to avoid a create-and-delete loop. The flow multi-codebook FLGLVQ that uses dynamic incremental learning is shown in Algorithm 4:
| Algorithm 4: Multi Codebook Fuzzy Neuro Generalized Vector Quantization Using Incremental Learning |
| 01: | procedure MC-FNGLVQ-CLUSTERING |
| 02: | denote x1, x2, x3, ….xn as instances |
| 03: | denote w1, w2, w3, ….wp as reference vector of class 1,2,…p |
| 04: | initiate w1, w2, w3, ….wp |
| 05: | denote T as the condition of generating a new codebook as defined in eq 34 or 35//eq 33 for the static version |
| 06: | for xi = x1:xn do |
| 07: | denote y as the class label of x |
| 08: | compute µ of x using equation 3, compute the similarity of x to codebooks of all classes |
| 09: | if µ does not satisfy T then//T can be equation 34 or 35 |
| 10: | train x using FNGLVQ method |
| 11: | else |
| 12: | state wynew as new codebook for class y |
| 13: | wynewmean = x |
| 14: | wynewmin = x − average(wymean − wymin) |
| 15: | wynewmax = x − average(wymax − wymean) |
| 16: | end for |
6. Experiment Result and Analysis
6.1. Dataset
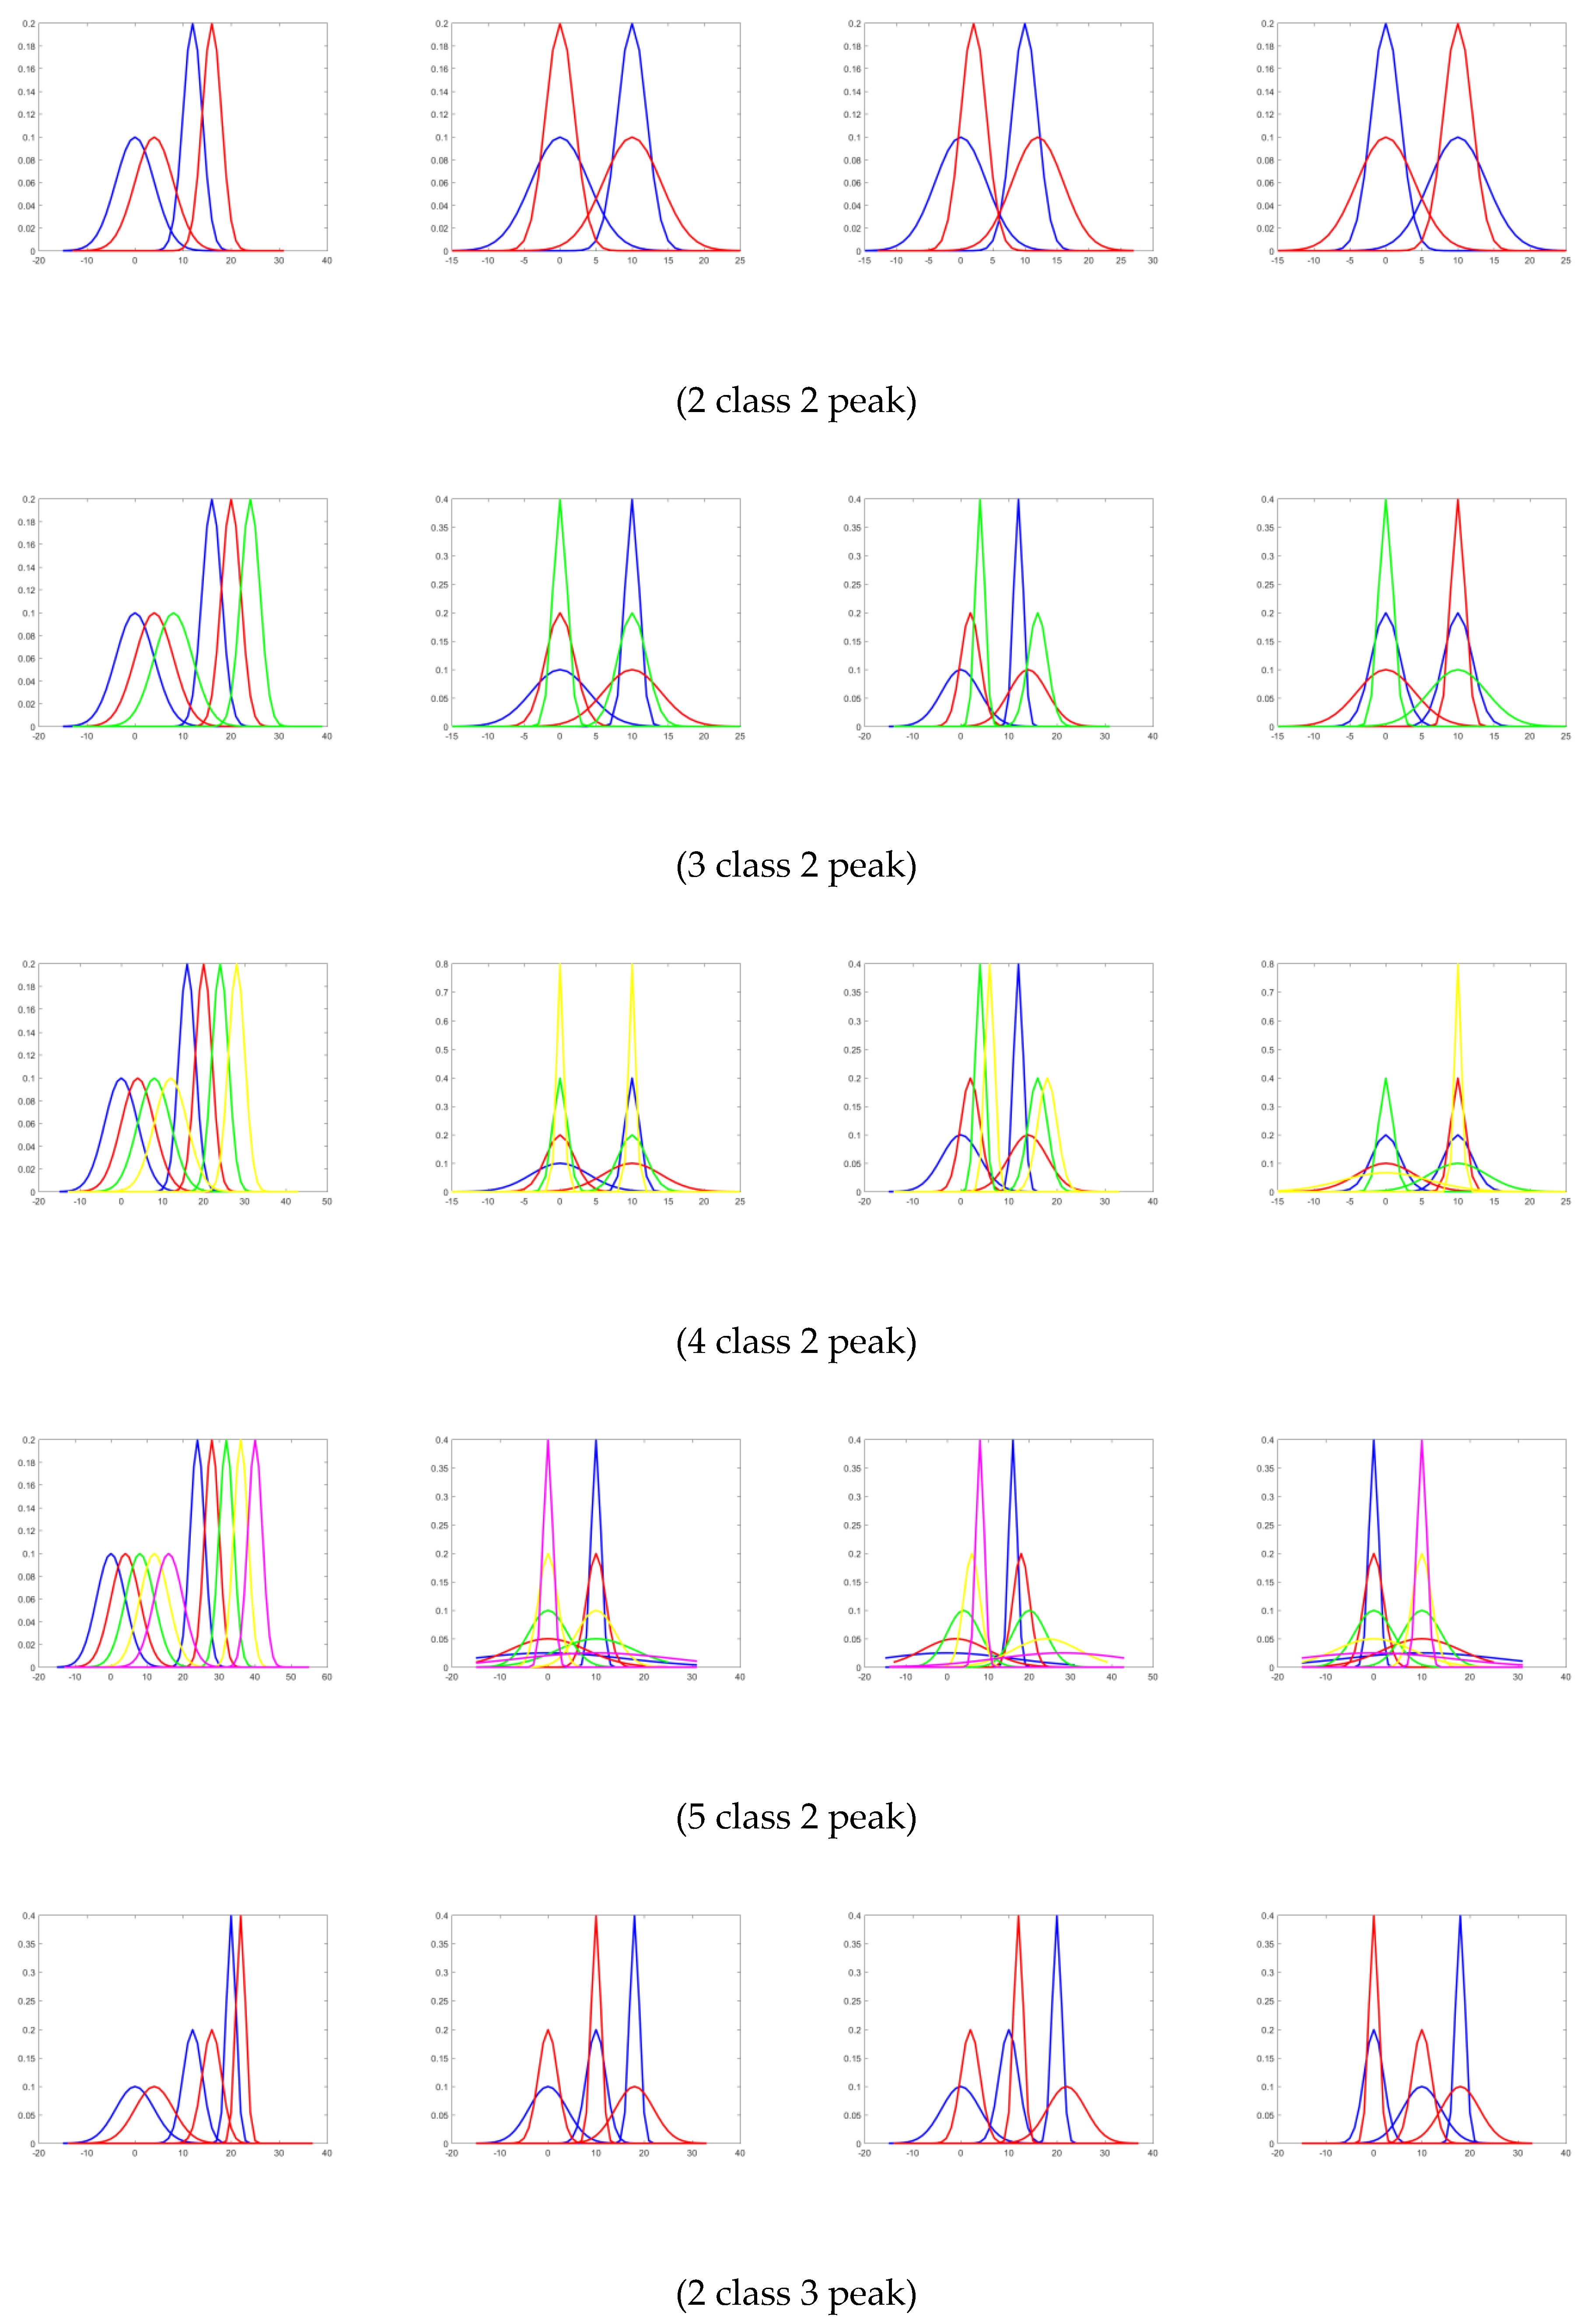
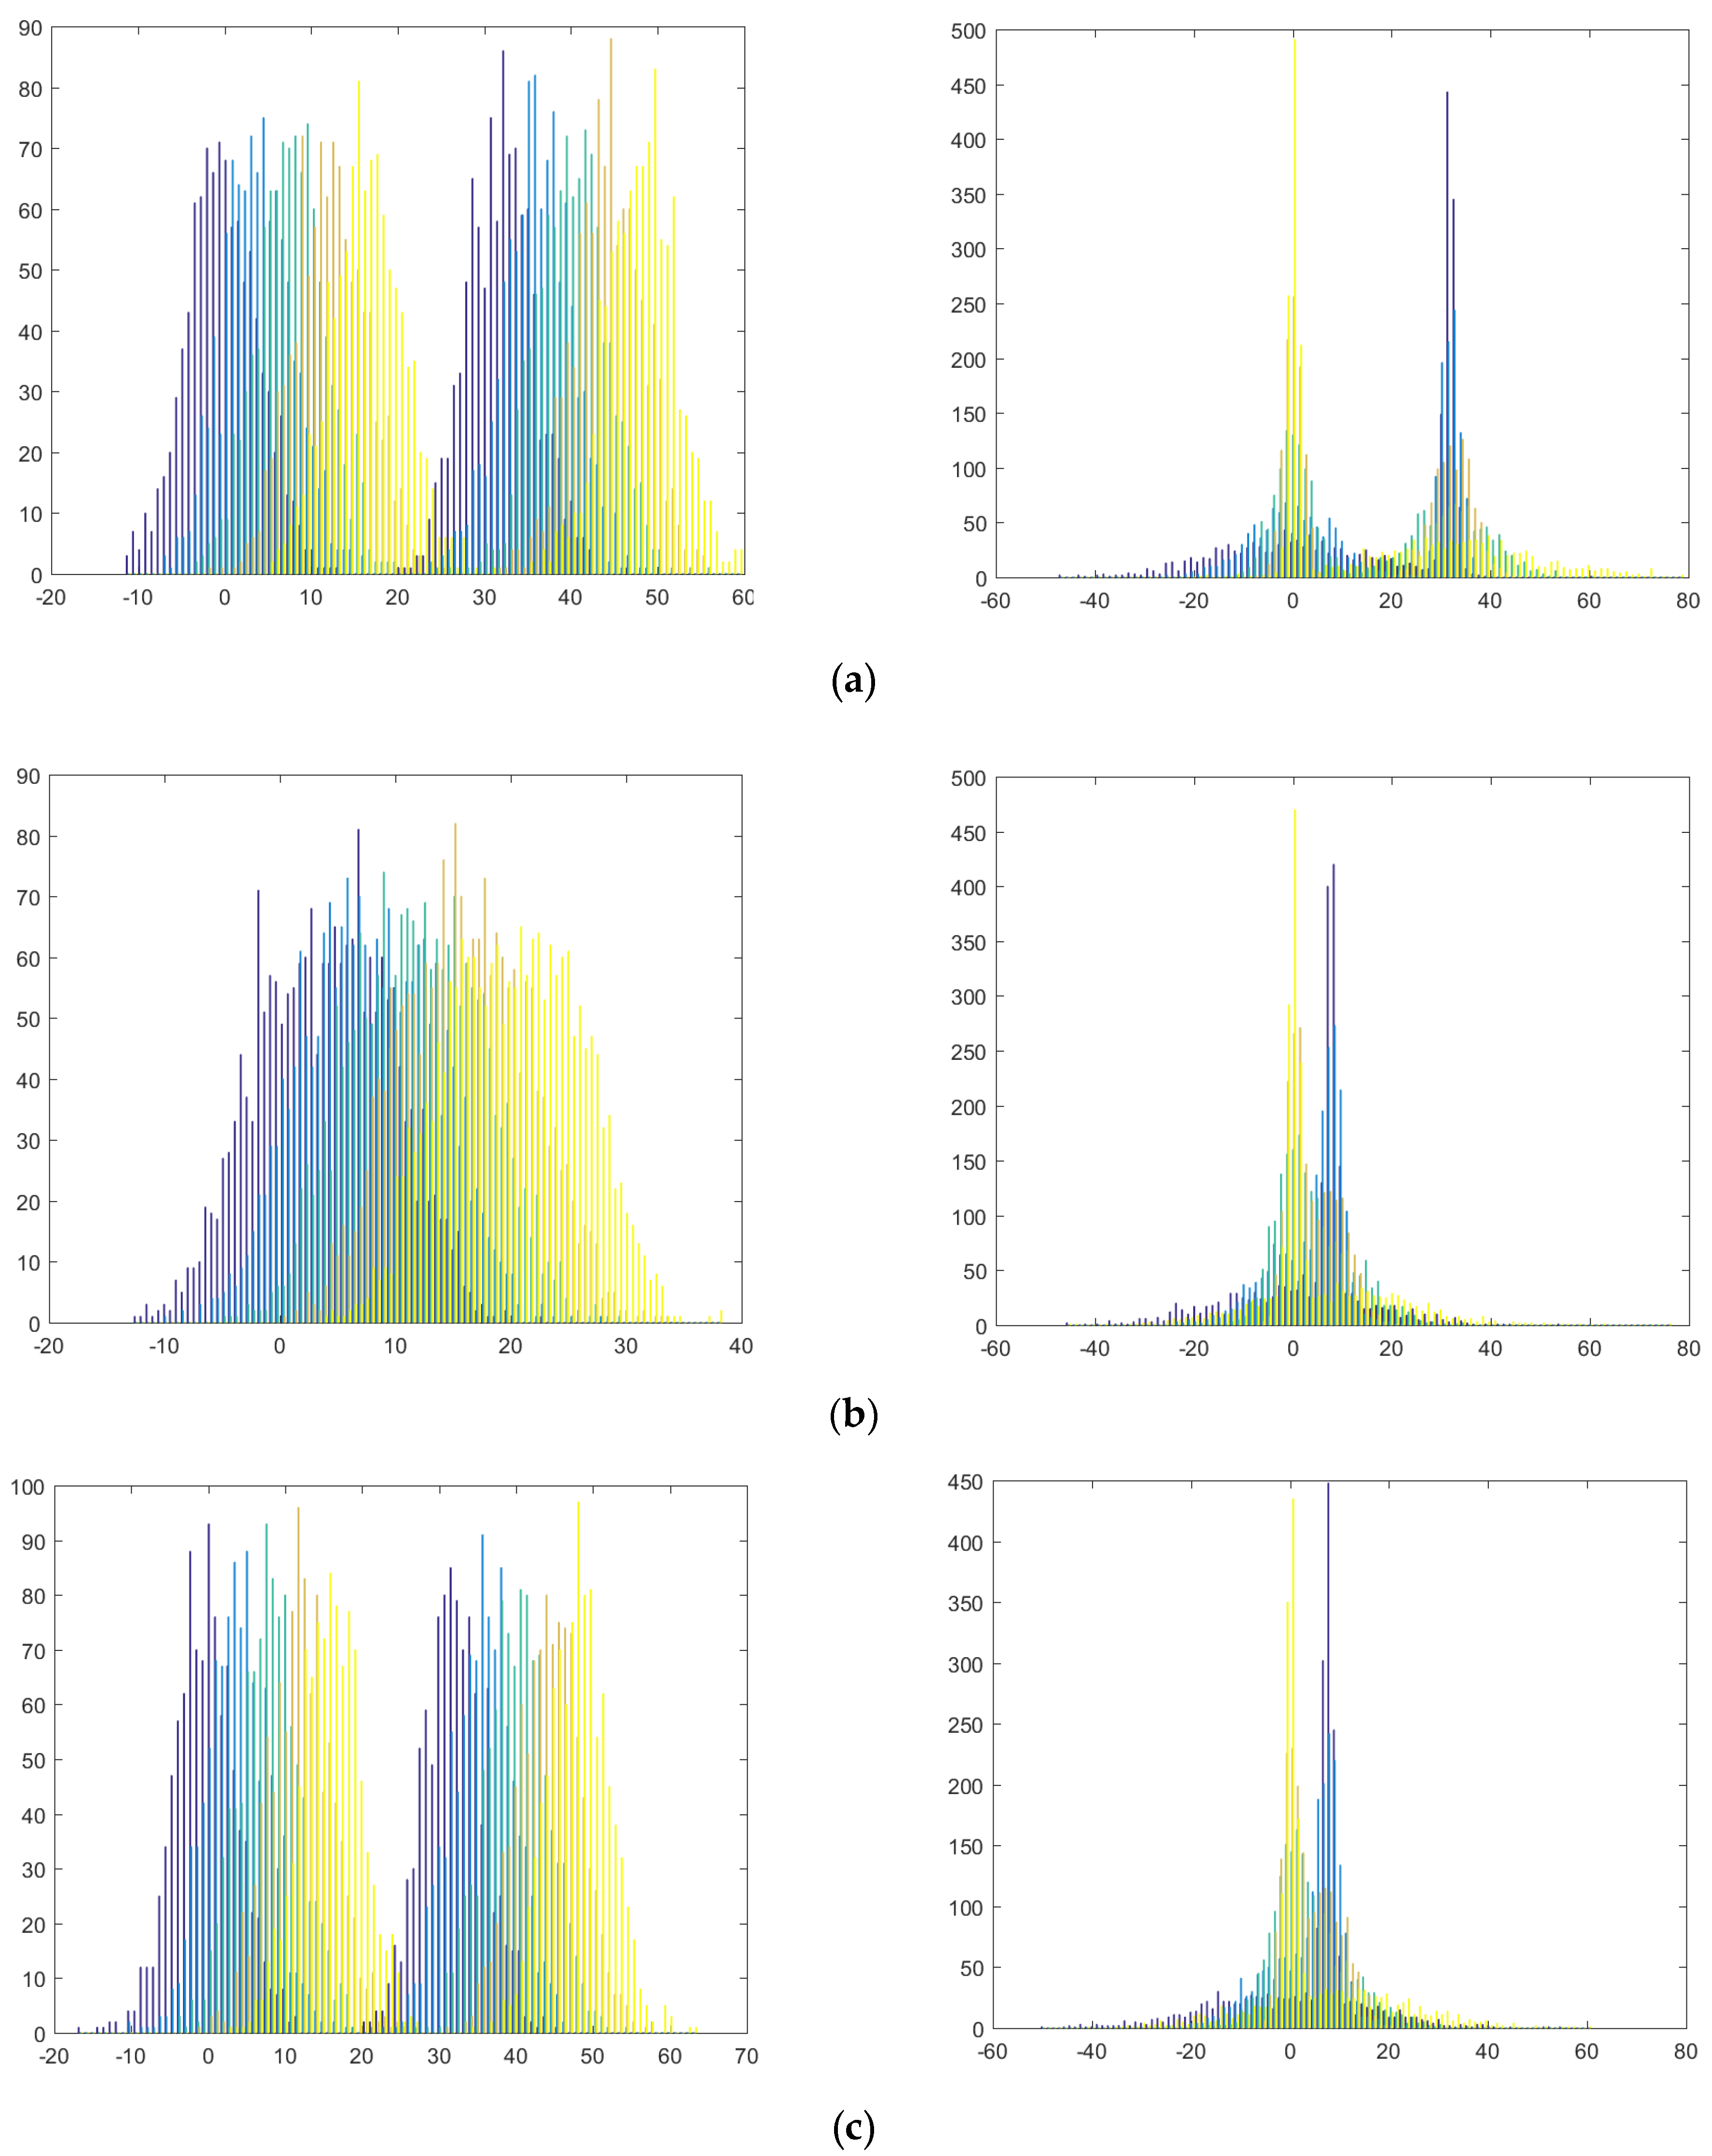
In this paper, we used a three package dataset that consisted of synthetic and benchmark datasets. The SyntheticA package is a simple synthetic dataset that has two peaks, five classes, and two features. This package has four instances, and the distribution of the data is shown in
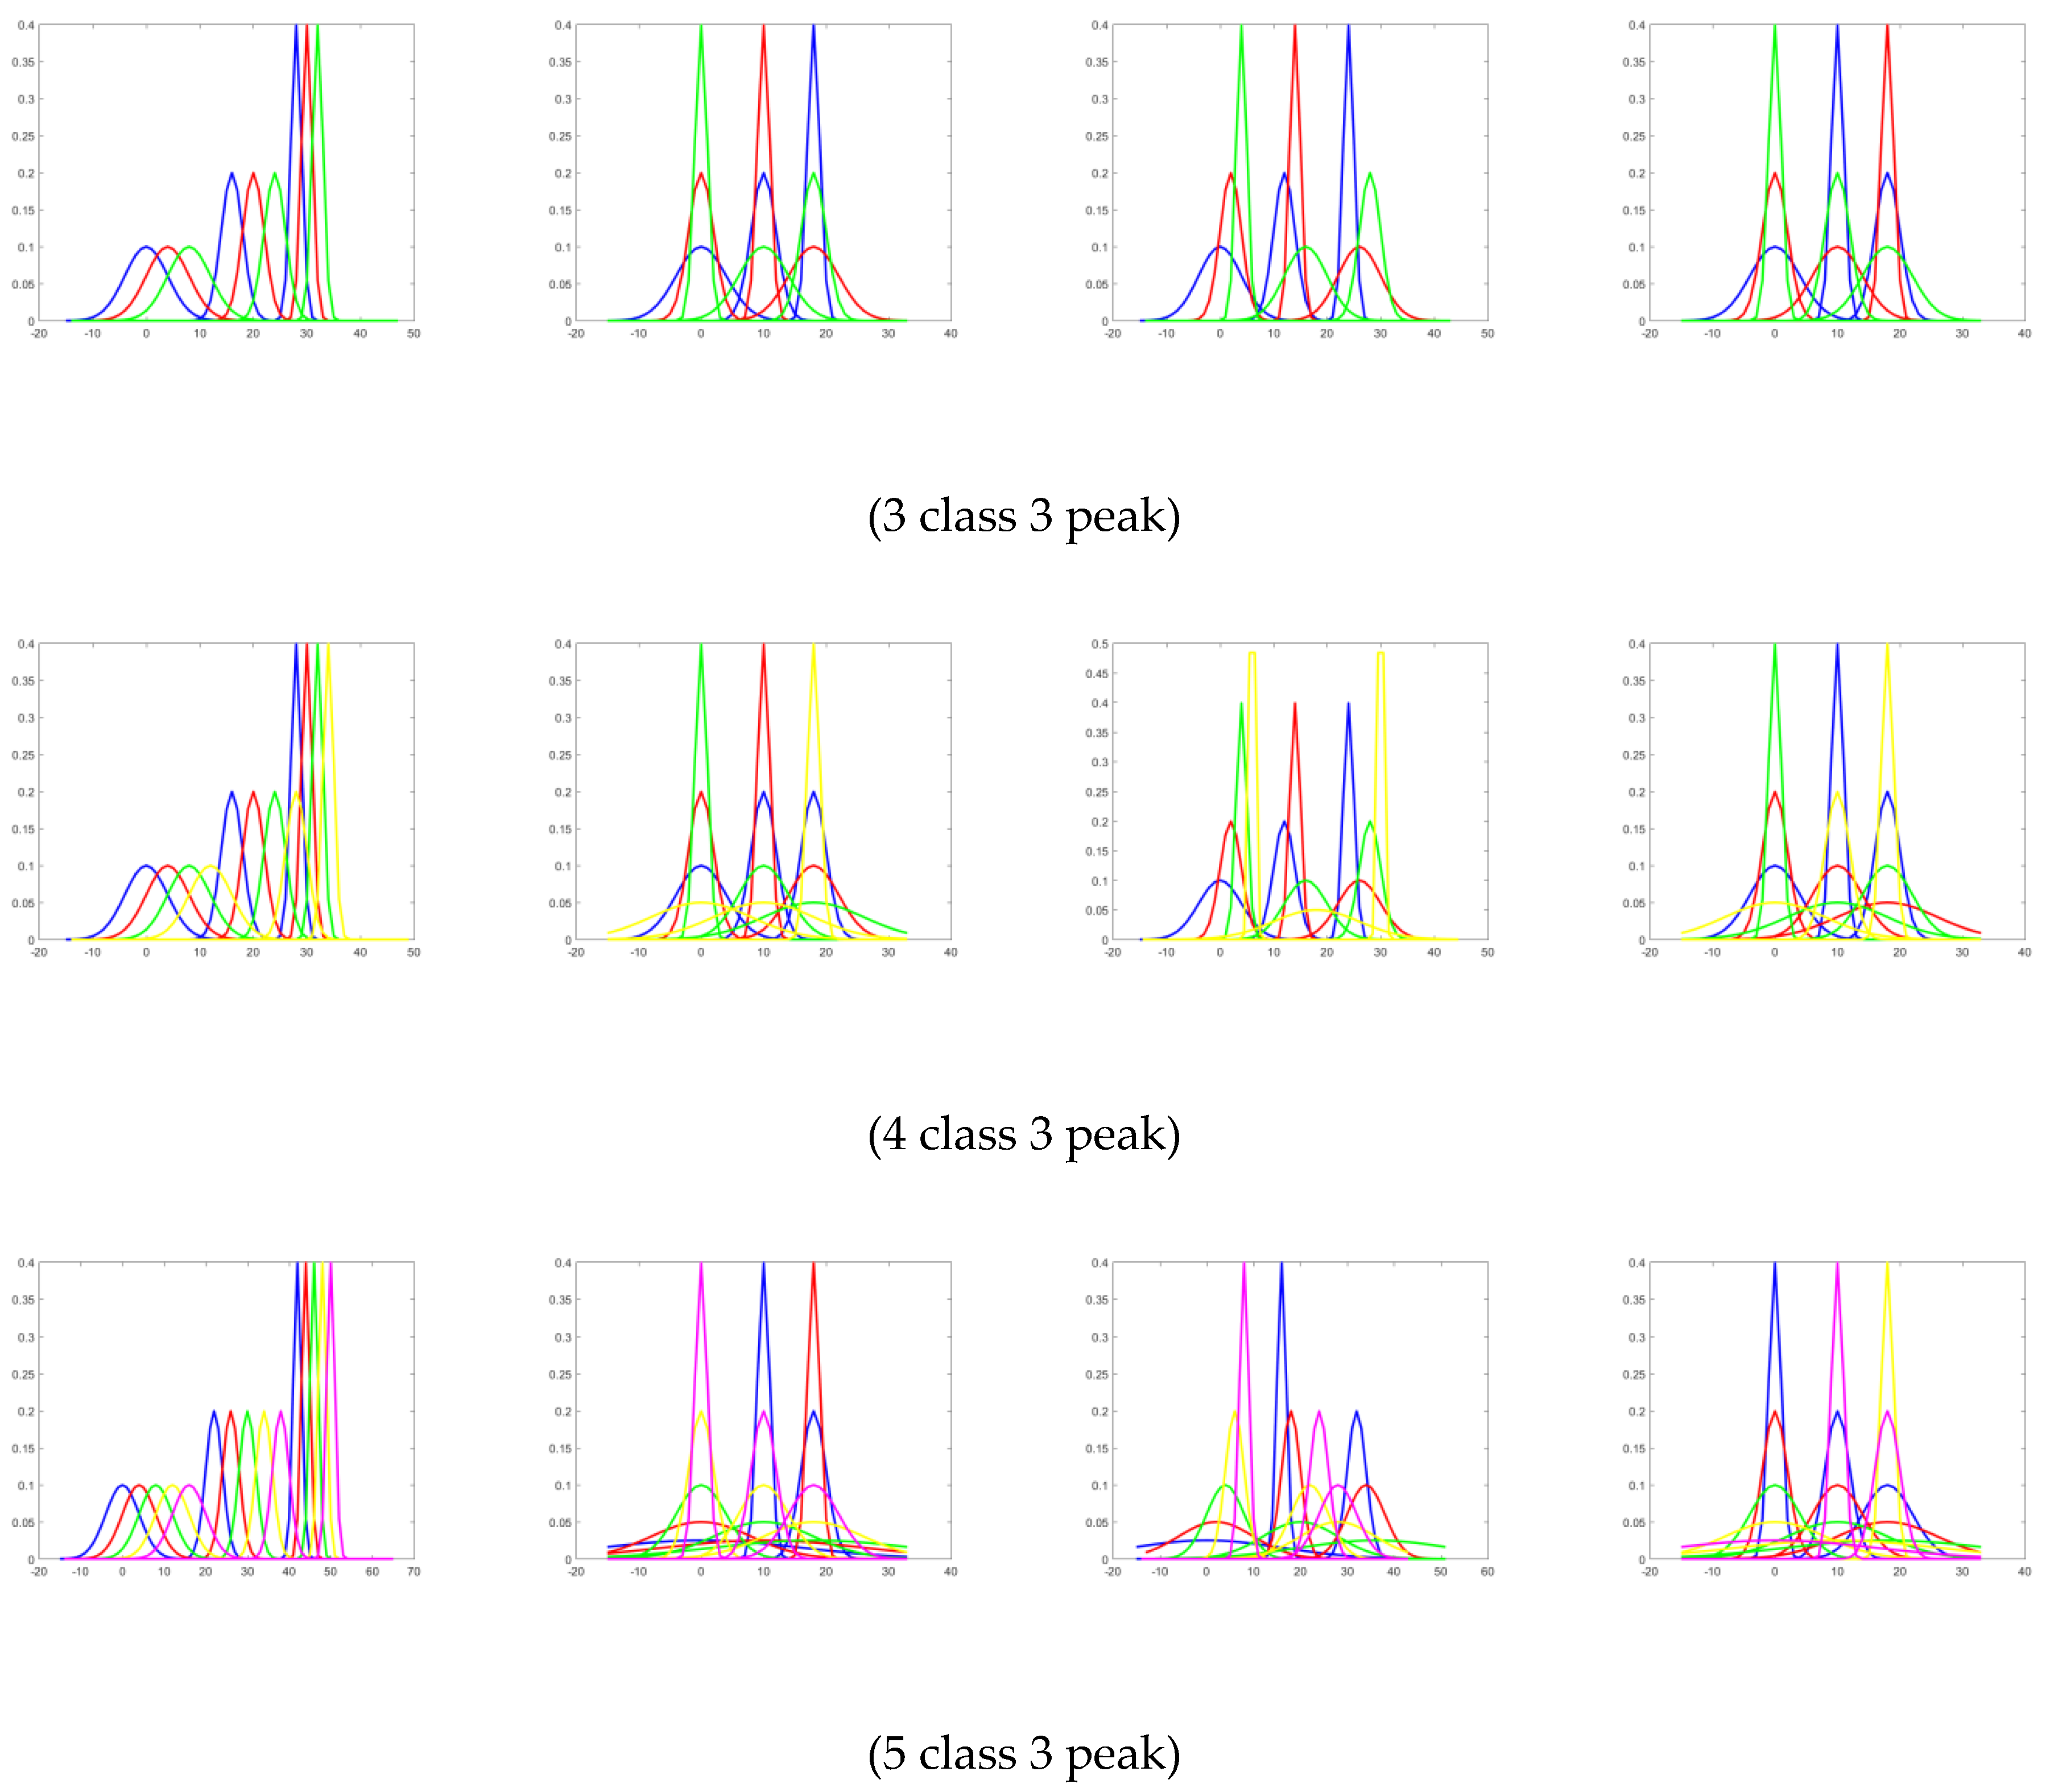
Figure 7. The second package is SyntheticB, which is a synthetic dataset that contains eight instances of data. The datasets have different numbers of classes and peaks, but all of them have five features.
In addition to synthetic datasets, in this paper, we used a benchmark dataset. In this study, we utilized an open dataset that was published in the UCI online database. The benchmark dataset also consisted of the dataset from previous research. The benchmark dataset that was used in this study has multi-modality in its features. The detail of the dataset used in this paper is described in
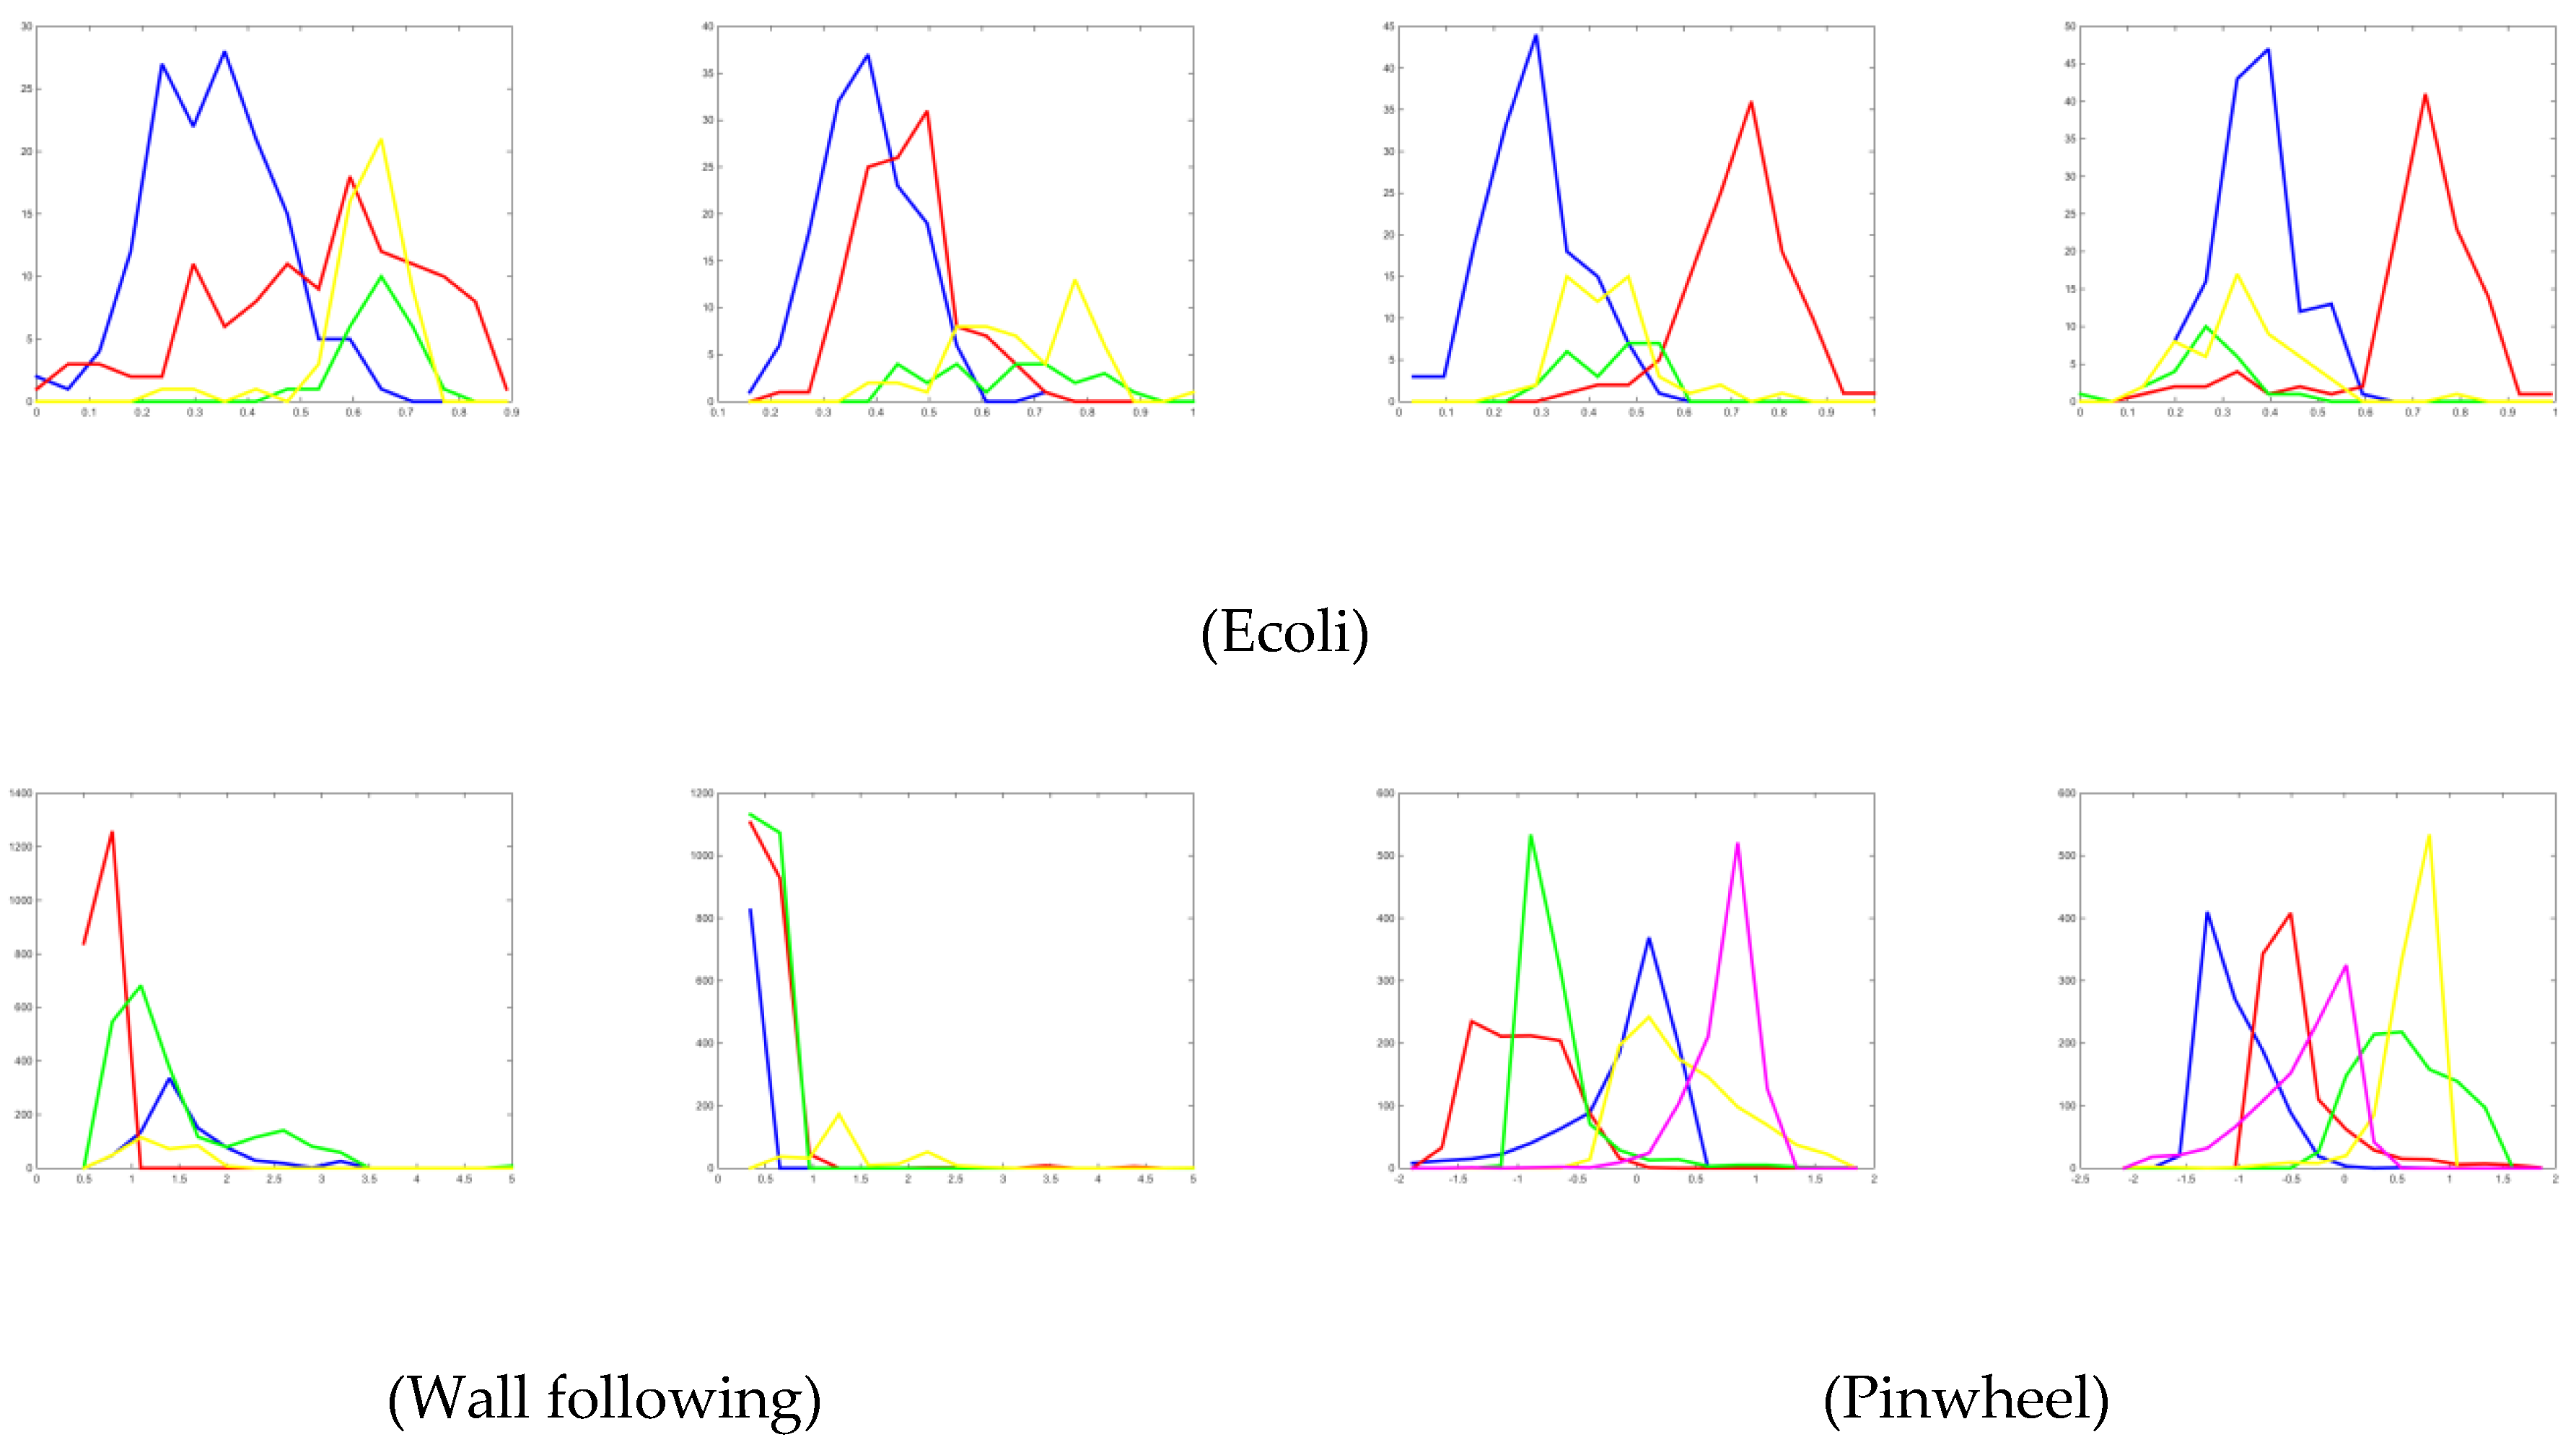
Table 2. The SyntheticA dataset is a small feature (two features) dataset, where all classes have multi-modal distribution. The SyntheticB dataset is similar to the previous SyntheticA dataset, but there are variations of numbers of classes and peaks, and its feature size is larger. The benchmark dataset was taken from real datasets collected in previous studies where some features may have multi-modal distribution and some features may not have had such. The distribution of all synthetic and benchmark datasets is shown in
Appendix section.
6.2. Experiment Setup
In this paper, we developed two versions of multi-codebook FNGLVQ that use intelligent clustering, three versions of multi-codebook FNGLVQ that use static incremental learning, and two versions of multi-codebook FNGLVQ that use dynamic incremental learning.
Three packages of datasets were used in the experiment, and these consisted of synthetic and benchmark datasets. The SyntheticA dataset was used in the first experiment. The aim of the first experiment was to evaluate the performance of the proposed methods in the multi-modal dataset because all features in the SyntheticA dataset had multi-modal distribution. In the experiment, we analyzed the performance of the proposed method compared to the original FNGLVQ. The SyntheticB dataset was used in the second experiment. The second experiment aimed to observe the performance of the proposed methods in the variation of peaks and classes of the multi-modal dataset. Overall, the synthetic dataset was used to evaluate the proposed methods in multi-modal data because all features in the synthetic dataset had multi-modality. The benchmark dataset was used in the third experiment. The benchmark dataset used in this study had a multi-modal distribution of its features. The aim of this experiment was to observe the performance of the proposed method in a real dataset. The benchmark dataset had a sign of multi-modality in its features. However, not all features in the data had multi-modal distribution. This meant that some features had multi-modal distribution but some features did not. Therefore, the benchmark dataset was used to measure the performance of the proposed methods in the partly multi-modal data.
In the experiment, we evaluated both multi-codebook FNGLVQ methods that use intelligent clustering and incremental learning. As mentioned before, we tried three static threshold values, i.e., 0.1, 0.2, and 0.25, for the multi-codebook method that uses static incremental learning. We had two versions of multi-codebook FNGLVQ that use dynamic incremental learning. Version 1 used Equation (34) to generate a new codebook, while version 2 used Equation (35) to generate a new codebook. For the multi-codebook FNGLVQ that uses clustering, we used intelligent clustering based on anomalous patterns and intelligent K-means clustering that uses histogram information. In this study, the proposed method was run for 100 iterations (epoch), alpha = 0.05, gamma = 0.00005, beta = 0.00005, and delta = 0.1. The experiment was conducted by using five-fold cross-validation. The parameter was chosen based on a preliminary experiment to find the most suitable FNGLVQ parameter. In the preliminary experiment, we tried the combination of alpha = {0.1, 0.05}, beta = {0.00001, 0.00005}, and gamma = {0.00001, 0.00005}, and we found that the last parameter had the best performance.
In the benchmark dataset, we compared the proposed method to the classical machine learning methods such as Naïve Bayes, SVM, MLP, tree bagging, and random forest. Additionally, the proposed method was compared to convolutional neural network (CNN) and dense layer methods. The comparator methods were implemented in Python, while the proposed method and original FNGLVQ were implemented in Matlab. The SVM method uses the radial basis function (RBF) kernel. The MLP uses a quasi-Newton optimizer, epoch = 200, and a 3 x 10 hidden layer size. The tree bagging and random forest use 10 estimators (weak classifiers) and the Gini index as criteria. There were two versions of the CNN used in the experiment. The first CNN version was CNN2L, which was taken from the VGG16 model, but it only uses one convolution block. The second version of the CNN has 10 convolution layers, but the previous version only used 2 layers. There are three versions of dense layer classifiers: the first version has two dense layers, the second version has 10 layers, and the third version has 10 layers and a dropout value of 0.2. The previous version of the classifiers including CNN used a dropout value of 0.5. The CNNs and dense layers used in this experiment had the following structure:
CNN2L: Input-Padd-Conv-Padd-Conv-Pool-Flat-Dense-Drop-Dense-Drop–Output.
CNN10L: Input-Padd-Conv-Padd-Conv-Padd-Conv-Padd-Conv-Padd-Conv-Padd-Conv-Padd-Conv-Padd-Conv-Padd-Conv-Padd-Conv-Pool-Flat-Dense-Drop-Dense-Drop-Output.
Dense2L: Dense-Drop-Dense-Drop-Output.
Dense10L: Dense-Drop-Dense-Drop-Dense-Drop-Dense-Drop-Dense-Drop-Dense-Drop-Dense-Drop-Dense-Drop-Dense-Drop-Dense-Drop–Output.
Dense10L02: Dense-Drop-Dense-Drop-Dense-Drop-Dense-Drop-Dense-Drop-Dense-Drop-Dense-Drop-Dense-Drop-Dense-Drop-Dense-Drop-Output, dropout value = 0.2.
6.3. Result of Scenario 1: Experiment on SyntheticA Dataset
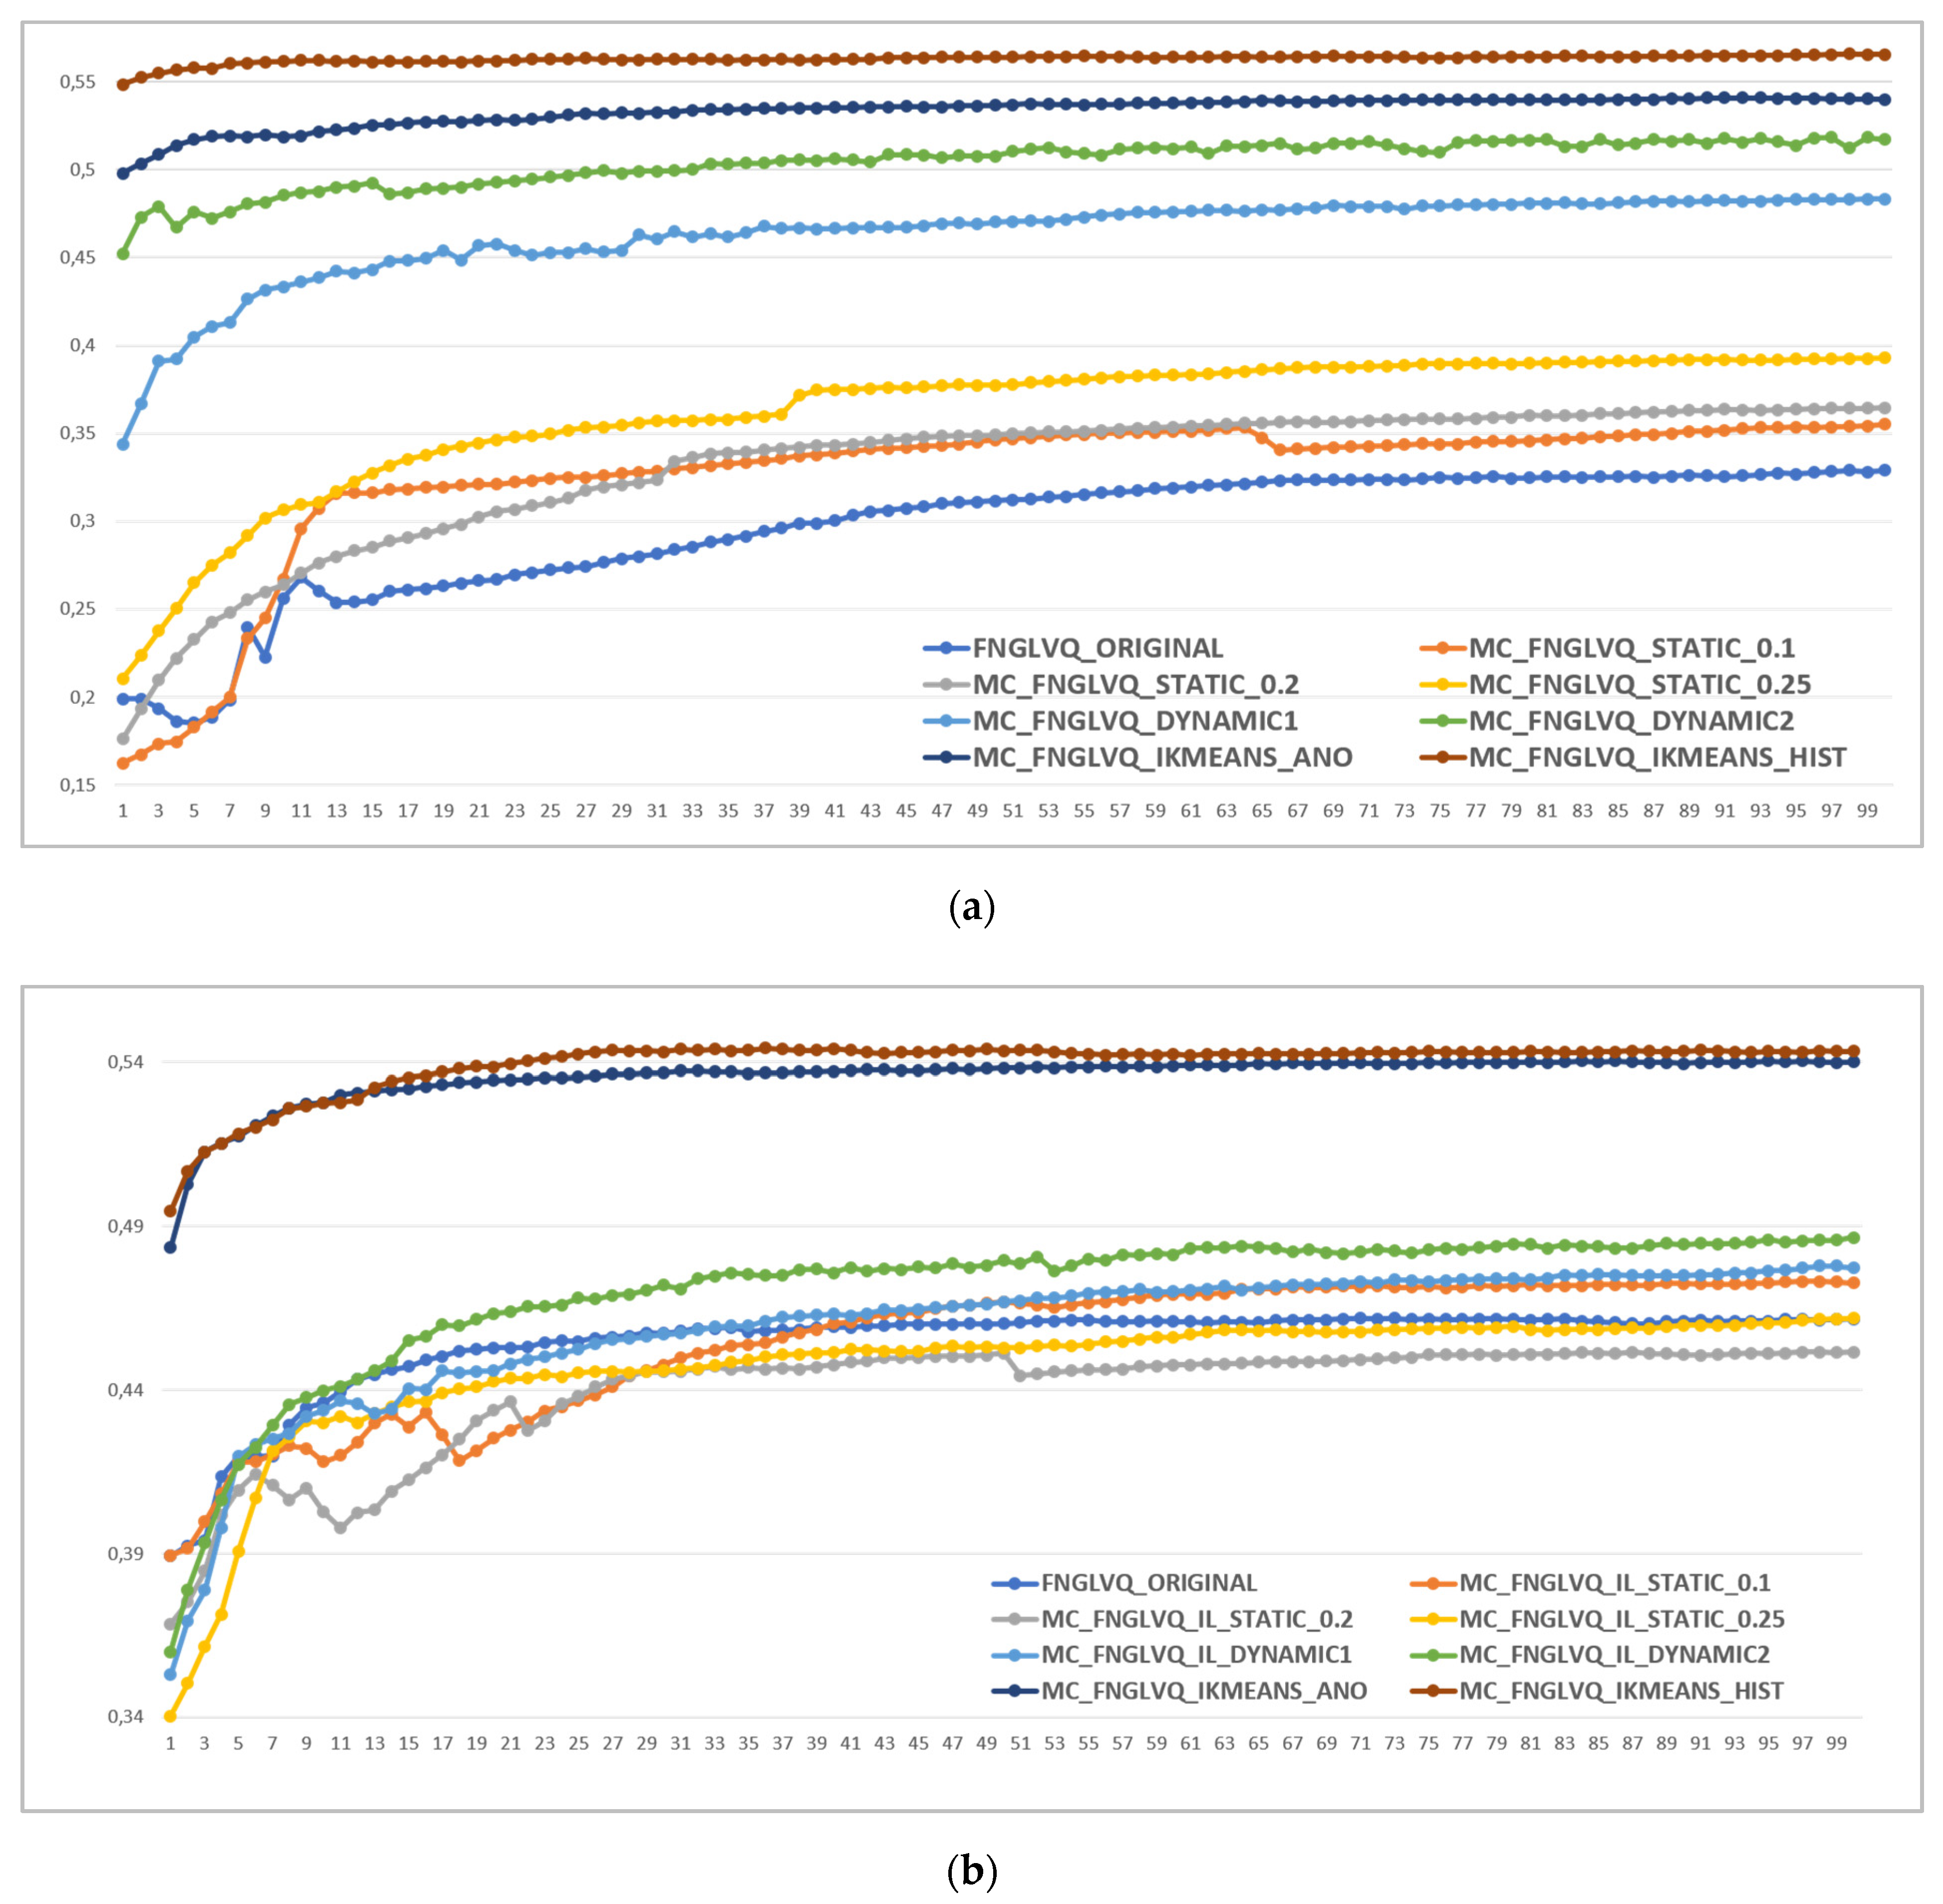
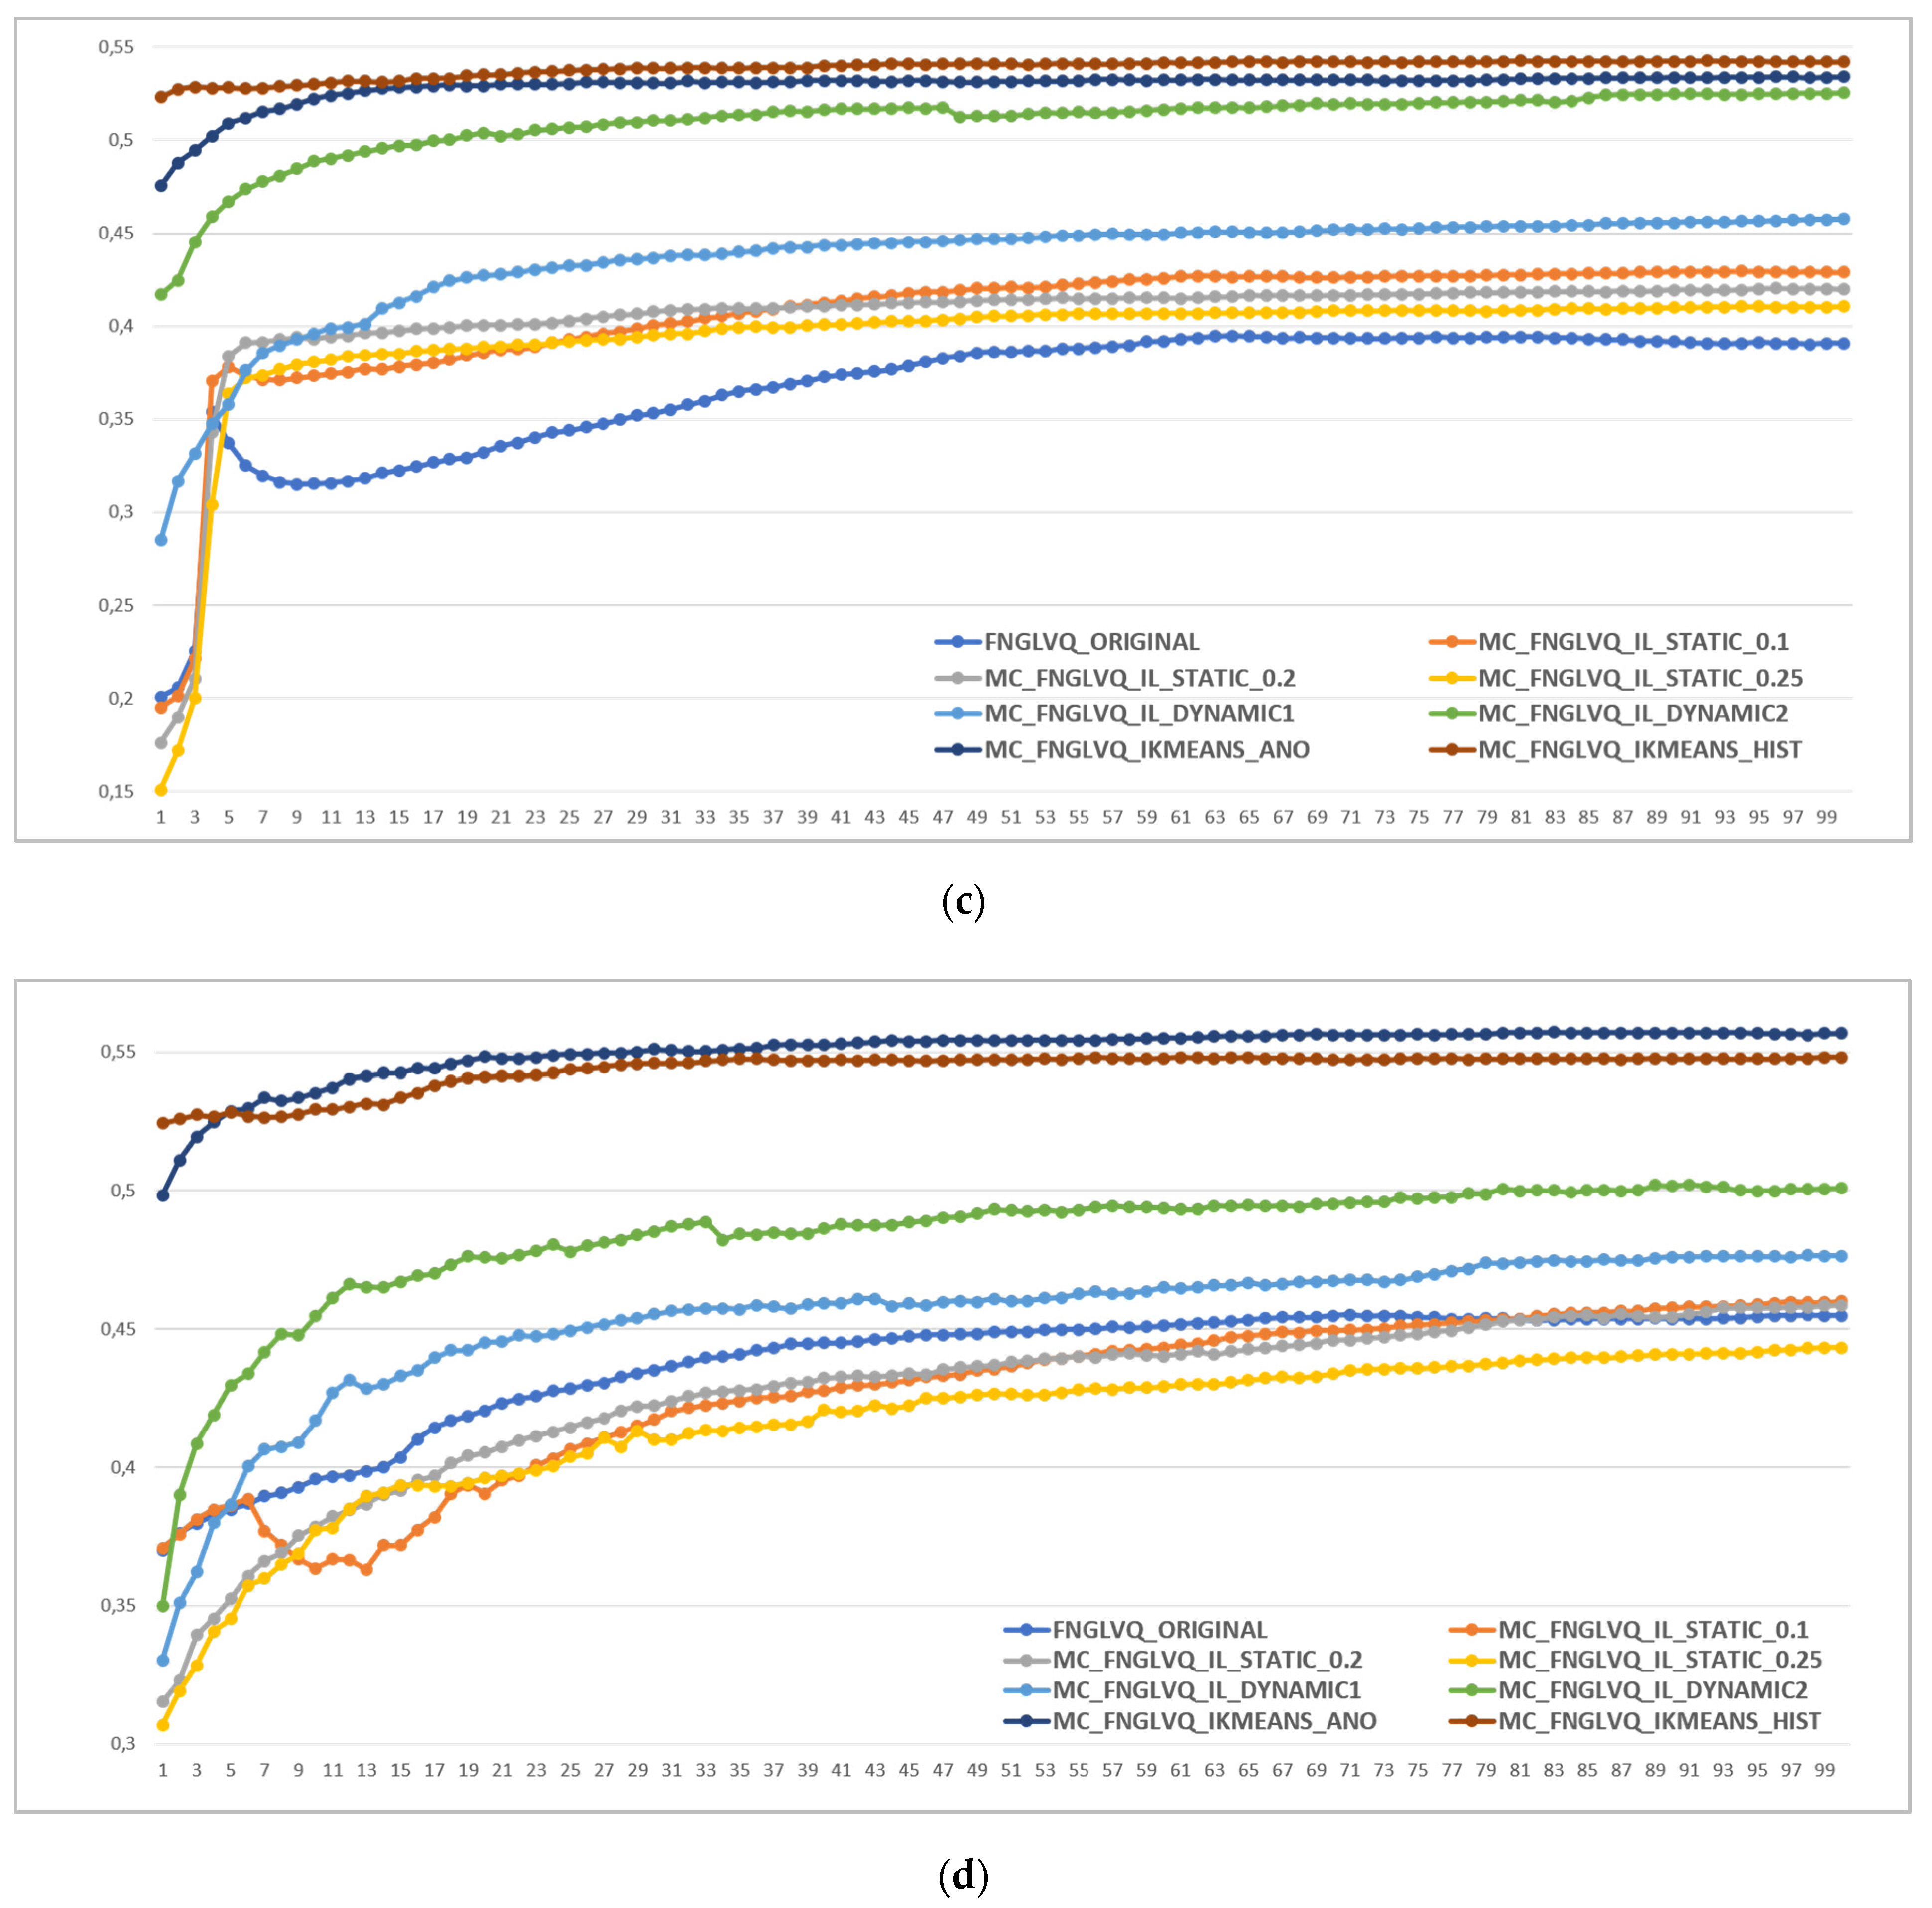
The result of the scenario 1 experiment is shown in
Figure 8. The figure shows that from four instances of the SyntheticA package dataset, multi-codebook FNGLVQ that uses intelligent clustering had a higher accuracy than incremental learning by a 4% margin. The dynamic incremental learning achieved a better performance than static incremental learning by a 5% margin.
The highest accuracy was achieved by multi-codebook FNGLVQ that uses intelligent K-means clustering based on histogram information, followed by the multi-codebook FNGLVQ that uses intelligent clustering based on anomalous patterns, the multi-codebook FNGLVQ that uses dynamic incremental learning 2, the multi-codebook FNGLVQ that uses dynamic incremental learning 1, and the multi-codebook FNGLVQ that uses static incremental learning. However, the performance of the static incremental learning versions was not stable. It is shown in the figure that in SyntheticA instance 1, the static incremental learning version with 0.2 thresholds had a better accuracy than the original FNGLVQ, but in SyntheticA instances 2, 3, and 4, it had a lower accuracy than the original FNGLVQ. The static incremental learning version with 0.1 thresholds achieved a good performance in SyntheticA instances 1 and 2, but its performance in SyntheticA instances 3 and 4 dropped. Similar to the previous cases, static incremental learning with 0.25 thresholds achieved a good performance in SyntheticA instances 1, 3 and 4, but on the other hand, it had low performance in SyntheticA instance 2.
Overall, both multi-codebook methods that use intelligent clustering and dynamic incremental learning had better performances than the original FNGLVQ. However, the multi-codebook FNGLVQ that uses static incremental learning has worse performance than the original FNGLVQ in some cases, i.e., instances 2 and 4 in the SyntheticA dataset. The scenario 1 experiment also showed that in the SyntheticA dataset, the multi-codebook FNGLVQ that uses intelligent clustering had a better performance than the multi-codebook FNGLVQ that uses dynamic incremental learning.
6.4. Result of Scenario 2: Experiment on SyntheticB Dataset
The experiment result in the SyntheticB dataset is shown in
Table 3. Here, the multi-codebook FNGLVQ that uses intelligent K-means based on histogram information had the highest performance of 83.91%, on average. This was followed by the multi-codebook FNGLVQ that uses dynamic incremental learning 2, the multi-codebook FNGLVQ that uses IK-means based on anomalous patterns, and the multi-codebook method that uses incremental learning 1 with 81.79%, 81.77%, and 75.33% performances, respectively.
Both multi-codebook FNGLVQ methods that use intelligent clustering and dynamic incremental learning had better accuracy values than the original FNGLVQ in all instances of the SyntheticB dataset. On average, the dynamic incremental learning version 1 achieved a margin of more than 25% compared to the original method, while the dynamic incremental learning version 1 achieved a margin greater than 20%. The multi-codebook method that uses intelligent K-means clustering based on histogram information achieved an improvement greater than 28%, while the intelligent K-means clustering based on anomalous patterns version achieved an improvement greater than 26%, as compared to the original classifier. The static incremental learning version with 0.1 thresholds achieved the lowest accuracy on average, which was even less than the original classifier accuracy. The static incremental learning version with the 0.25 thresholds achieved a better accuracy with a 10% margin on average, though not in all instances of the SyntheticB dataset. It had a better performance than the original classifier. The static incremental learning with 0.2 thresholds also had a higher accuracy than the original method with a 7% margin on average, even though it had the same case as the static version when it had 0.25 thresholds where not in all instances of the SyntheticB dataset It had better performance than the original version. Those static versions with 0.2 and 0.25 thresholds had lower accuracy values than the original version in some instances of the SyntheticB dataset, e.g., in the fourth instance.
6.5. Result of Scenario 3: Experiment on Benchmark Dataset
The results of the experiment on the benchmark dataset is shown in
Table 4. The table shows that on the benchmark dataset, on average, all versions of the proposed method had a better accuracy than the original FNGLVQ. In the benchmark dataset experiment, the best accuracy was achieved by the multi-codebook method that uses dynamic incremental learning version 1, followed by dynamic incremental learning version 2, static incremental learning 0.25, static incremental learning 0.2, intelligent K-means clustering based on histogram information, intelligent K-means clustering based on anomalous patterns, and static incremental learning 0.1, with 83.91%, 83.23%, 81.92%, 80.92%, 80.78%, 78.88% and 78.74% average accuracy values, respectively. Compared to the original FNGLVQ, the multi-codebook methods that use dynamic incremental learning 1 and dynamic incremental learning 2 achieved 5.31% and 4.63% margins, respectively. Surprisingly, the multi-codebook method that uses intelligent clustering had a lower performance of 3% below the dynamic incremental learning version. However, It was still higher than the original version with a 2% margin. The static incremental learning versions also had a better accuracy than the original version with 3%, 2% and 0.16% margins for static incremental learning with thresholds 0.25, 0.2 and 0.1, respectively.
Compared to the commonly used classifiers, the proposed method still had a better performance overall. The proposed method achieved 3%. 5%, 9%, 10%, 10%, and 27% performances compared to the tree bagging, SVM, random forest, Naïve Bayes, and MLP methods. The CNN and dense layers classifiers performed very well in some datasets, but they performed very poorly in other datasets. For example, the classifiers performed very well in the pinwheel, wall following, ecoli, and odor datasets, but they performed very poorly in the glass and segment datasets. Overall, the best achievement came from the CNN and dense layers methods at 68.28% and 56.88%, respectively. This means that, compared to the CNN and dense layers methods, the proposed had a higher accuracy with a margin of more than 15%.
Table 4 also shows than adding layers to the CNN and dense layers methods did not increase their performances. It did increase the performance in a few datasets but decreased the performances in other datasets by a significant amount. Using a dropout value of 0.2 in Dense10L02 version increased the performance of the classifiers from 37.20% to 46.46%, on average. However, if we look closer, the improvement only occurred in three of the eight tested datasets.
6.6. Improvement of Proposed Method Compared to Original FNGLVQ
The improvement of the proposed methods compared to original FNGLVQ on both the synthetic and benchmark datasets is summarized in
Table 5.
Table 5 shows that multi-codebook FNGLVQ that uses intelligent K-means based on anomalous patterns achieved 22.24%, 0.28%, and 13.26% margins on the synthetic dataset, the benchmark dataset and the average of all datasets, respectively. The multi-codebook FNGLVQ that uses intelligent K-means based on histogram information achieved 23.90%, 2.10% and 15.02% margins on the synthetic dataset, the benchmark dataset and the average of all datasets, respectively. The multi-codebook FNGLVQ that uses dynamic incremental learning version 1 achieved 15.65%, 5.31%, and 11.42% margins on the synthetic dataset, the benchmark dataset, and the average of all datasets, respectively. The multi-codebook FNGLVQ that uses dynamic incremental learning version 2 achieved 21.08%, 4.63%, and 14.35% margins on the synthetic dataset, the benchmark dataset, and the average of all datasets, respectively. The multi-codebook FNGLVQ that uses static incremental learning with a 0.25 threshold value achieved 7.70%, 3.32%, and 5.91% margins on the synthetic dataset, the benchmark dataset, and the average of all datasets, respectively. The static incremental learning version with a 0.2 threshold value achieved 5.44%, 2.33% and 4.16% margins on the synthetic dataset, the benchmark dataset, and the average of all datasets, respectively. However, the static incremental version with a 0.1 threshold value a had a slight improvement. The improvement was less than 1% in the synthetic dataset, the benchmark dataset, and the average of all datasets.
6.7. Analysis of Variance (ANOVA) Test for Significance Testing
In the previous subsection, we showed that the proposed multi-codebook methods had performance improvements over the original FNGLVQ. This sub-section discusses whether the improvements are significant. We conducted significant testing by using a one-way analysis of variance (ANOVA) test. A one-way ANOVA test is a statistical technique that is used to compare means of two or more samples by using F-distribution [
50]. The ANOVA tests a null hypothesis if two or more sets of observations are drawn from populations with the same mean. In this study, the ANOVA test was used to test the significance difference between two classifiers based on their performance on the tested datasets. In this analysis, if the null hypothesis was not rejected, then the two tested classifiers were not significantly different. In the other side, if the null hypothesis was rejected, then the performance of the two tested classifiers was significantly different.
Each of the proposed multi-codebook versions was tested by using an ANOVA test with the original FNGLVQ. The ANOVA test was conducted by using all 20 instances of the datasets (12 synthetic datasets and 8 benchmark datasets), as mentioned in the previous subsection. The test was conducted by using a significant level (α) 0.05. There were two conditions that could be used to reject the null hypothesis. The first condition was based on the F-test, where the null hypothesis was rejected if the F value was more than Fc. The second condition was based on the p-value, where the null hypothesis was rejected if the p-value was less than 0.05.
Table 6 shows the summary of significance testing by using NOVA for the proposed methods compared to the original method. The table shows that from 20 cases of the tested dataset, the proposed multi-codebook FNGLVQ that use intelligent clustering and dynamic incremental learning had significant improvements compared to the original classifier, whereas the multi-codebook method that uses static incremental learning version had no significant improvement. However, looking to the values of F, Fc, and
p-value, it can be seen that the multi-codebook FNGLVQ that uses dynamic incremental learning version 1 had a slightly different value from the thresholds. The F value of the method was 4.355, which is close to the Fc value 4.098. Its
p-value was also near the thresholds (0.05) with 0.0437.
6.8. Discussion and Recommendation
The proposed multi-codebook FNGLVQ was tested in the synthetic and benchmark datasets. The synthetic dataset was the dataset where all features of the data had multi-modal distribution. The synthetic dataset consisted of two, and tree modals (peaks), and two to five classes. The synthetic dataset also had a high overlap between classes. The high overlap between classes is shown in the
Appendix A section. Both multi-codebook FNGLVQ methods based on intelligent clustering and dynamic incremental learning achieved higher performances than the original FNGLVQ on each dataset instance. On the SyntheticB dataset, the proposed method achieved 83.91% and 81.79% performances for multi-codebook methods that use intelligent clustering and incremental learning, respectively, while the original FNGLVQ achieved a performance of 55.09%. The proposed method’s performance was indeed still below 90%. However, this study was intended to show the improvements of the proposed method compared to the original FNGLVQ. The proposed method achieved a 23.90% improvement on the SyntheticA and SyntheticB datasets. The good news is the proposed multi-codebook FNGLVQ still has room for improvements in future studies.
Beside being tested in the synthetic dataset, the proposed multi-codebook methods were also tested in the benchmark dataset. The aim of the experiment on the benchmark dataset was to test the method with real data that were naturally taken from the real world. The datasets had signs of multi-modal on their features (but not all features). This is shown in
Appendix figures. The experiment result showed that overall the proposed methods achieved better performance than the original FNGLVQ. The highest performance was achieved by a multi-codebook method that uses dynamic incremental learning 1, with a 5.3% improvement compared to the original FNGLVQ. This was followed by the multi-codebook method that uses dynamic incremental learning 2, with a 4.63% improvement. In the benchmark dataset, the multi-codebook method that uses intelligent clustering performed below the dynamic incremental version, with only a 2.19% improvement, on average. Based on the experiment results, the author recommends using the multi-codebook FNGLVQ that uses intelligent K-means clustering based on histogram information in datasets where all features have multi-modal distribution. Meanwhile, in datasets where only several (not all) features have multi-modal distribution, the author recommends using the multi-codebook FNGLVQ that uses dynamic incremental learning.
This study also proves that the proposed multi-codebook FNLGVQ that use intelligent clustering and dynamic incremental learning have significant improvements compared to the original FNGLVQ. The significant improvement was tested by using the ANOVA test from 20 instances of the synthetic and benchmark datasets. The ANOVA test also proved that the multicode-book FNGLVQ that uses static incremental learning has a insignificant improvement over the original FNGLVQ
7. Conclusions
In this study, we proposed multi-codebook FNGLVQ that use intelligent clustering and dynamic incremental learning. There are two variations of the multi-codebook FNGLVQ that uses the intelligent clustering approach: One uses intelligent clustering based on anomalous patterns, and the other uses intelligent clustering based on histogram information. There are two variations of the multi-codebook FNGLVQ that uses the dynamic incremental learning approach: One compares the similarity of the winner class and the mean of other class similarities, and the other compares the similarity of the winner class and the min of other classes similarities to generate a new codebook. Overall, the multi-codebook FNGLVQ that uses incremental learning 1 was found to achieve improvements of 15.65%, 5.31% and 11.42% on the synthetic dataset, the benchmark dataset and the average of all datasets, respectively. The multi-codebook FNGLVQ that uses incremental learning 2 was found to achieve improvements 21.08%, 4.63%, and 14.35% on the synthetic dataset, the benchmark dataset, and the average of all datasets, respectively. The multi-codebook FNGLVQ that uses intelligent clustering based on anomalous patterns was found to achieve improvements of 22.24%, 0.28%, and 13.26% on the synthetic dataset, the benchmark dataset, and the average of all datasets, respectively. The multi-codebook FNGLVQ that uses intelligent clustering based on histogram information was found to achieve improvements of 23.90%, 2.10%, and 15.02% on the synthetic dataset, the benchmark dataset, and the average of all datasets, respectively. An ANOVA test concluded that the multi-codebook FNGLVQ that use intelligent clustering and dynamic incremental learning have significant improvements compared to the original FNGLVQ. The author recommends utilizing multi-codebook FNGLVQ that uses intelligent K-means clustering based on histogram information if all the features have multi-modal distribution and utilizing the multi-codebook FNGLVQ that uses dynamic incremental learning 1 if only several features have multi-modal distribution.

