Article

A 3D Mask Presentation Attack Detection Method Based on Polarization Medium Wave Infrared Imaging

1
Key Laboratory of Specialty Fiber Optics and Optical Access Networks, Joint International Research Laboratory of Specialty Fiber Optics and Advanced Communication, Shanghai Institute of Advanced Communication and Data Science, Shanghai University, Shanghai 200444, China
2
Shanghai Institute of Technical Physics, Chinese Academy of Sciences, Shanghai 200083, China
3
University of Chinese Academy of Sciences, Beijing 100049, China
4
Key Laboratory of Intelligent Infrared Perception, Chinese Academy of Sciences, Shanghai 200083, China
*
Authors to whom correspondence should be addressed.
Symmetry 2020, 12(3), 376; https://doi.org/10.3390/sym12030376
Submission received: 4 January 2020 / Revised: 13 February 2020 / Accepted: 14 February 2020 / Published: 3 March 2020

Abstract

:
Facial recognition systems are often spoofed by presentation attack instruments (PAI), especially by the use of three-dimensional (3D) face masks. However, nonuniform illumination conditions and significant differences in facial appearance will lead to the performance degradation of existing presentation attack detection (PAD) methods. Based on conventional thermal infrared imaging, a PAD method based on the medium wave infrared (MWIR) polarization characteristics of the surface material is proposed in this paper for countering a flexible 3D silicone mask presentation attack. A polarization MWIR imaging system for face spoofing detection is designed and built, taking advantage of the fact that polarization-based MWIR imaging is not restricted by external light sources (including visible light and near-infrared light sources) in spite of facial appearance. A sample database of real face images and 3D face mask images is constructed, and the gradient amplitude feature extraction method, based on MWIR polarization facial images, is designed to better distinguish the skin of a real face from the material used to make a 3D mask. Experimental results show that, compared with conventional thermal infrared imaging, polarization-based MWIR imaging is more suitable for the PAD method of 3D silicone masks and shows a certain robustness in the change of facial temperature.

1. Introduction

Biometric techniques have become a part of daily life, and the most widely used technique is facial recognition. However, the vulnerability of the data capture subsystem, and even the whole system in general, greatly reduces the security of facial recognition applications [1]. Face presentation attack [2,3] creates this problem. Biometric features or objects used in a face presentation attack are called presentation attack instruments (PAI) [ISO/IEC JTC1 SC37 Biometrics 2016] [3,4,5]. Facial presentation attacks mainly originate from three types of PAI: photos of a whole face, replaying videos of a face, and three-dimensional (3D) masks [3].
Many researchers are now working on research of the presentation attack detection (PAD) method, which is also referred to as a countermeasure or an anti-spoofing technique in some of the literature [2,6,7,8]. Most PAD methods, however, have only been developed to detect 2D presentation attacks. As 3D printing technology has matured in recent years, a large number of cheap and realistic 3D masks have appeared, which makes the PAD of 3D masks a new challenge [9].
The existing 3D mask PAD methods are mainly divided into two categories: visible-based methods and infrared-based methods. Of all the different types of visible-based methods, texture [10,11,12] and motion features [13] are the most commonly used. For example, by combining different local binary pattern (LBP) descriptors, the texture differences between a real face and a 3D face mask can be effectively obtained [9]. Recently, a method based on remote photoplethysmography has conducted the classification using various heartbeat signals [14]. Moreover, Azim et al. have used image statistics to classify real faces and their facial photos using visible light polarization imaging and achieved an accuracy of 87.84%, a true positive rate of 90%, and a false positive rate of less than 10% [15]. Due to the fact that the polarization degree of visible light reflected from a real face with black skin has similar statistical characteristics (such as mean) to those of printed photos, Azim et al. have proposed a method to distinguish the real faces with black skin from facial photos by using the Mean_BC algorithm, which improves the accuracy rate to 93.24% [16]. However, one major potential shortcoming of most existing visual spectrum spoofing detection methods is that the observed texture of a face is quite sensitive to the environment, such as illumination and expression.
In addition to the visible spectrum, the infrared spectrum has also been considered, especially the near-infrared (NIR) spectrum [17]. Wang Y. et al. combined visible and NIR spectrum bands to model gradient features to detect PVC faces, silicone face masks, and photographs of faces, which produced good results [18]. Their attempt shows that difference in reflectivity can be a powerful clue in the detection of a real or fake face. Jun Liu et al. conducted spoofing detection to differentiate between a real face and a 3D face mask by means of deep learning and multi-spectral imaging that included both the visible and NIR spectrum [19]. Three convolutional neural networks (CNN) were selected for statistical analysis, and the results showed that the lowest average classification error rate was 0.05% [20]. The significance of this experiment lies in the fact that NIR imaging has a better performance than visible light imaging in the detection of 3D masks. However, the amount of training data is too small, which may result in the over-fitting of the network, and the accuracy of the results and generalization ability of the algorithm may be reduced. Several multispectral-based methods try to overcome the problem of face presentation attack. However, the zeroth-order and first-order statistics of mask images in both visible and NIR domains are quite similar to those of bona fide presentations [21]. Some NIR-based methods are also reported as being susceptible to nonuniform illumination conditions [15,18,22].
Recently, researchers have attempted to explore PAD methods using the thermal infrared imaging technique. However, most previous studies on 3D mask PAD have considered rigid masks, not flexible silicone masks. Firstly, Marcel et al. conducted a systematic study on the vulnerability of face recognition systems to impersonation attacks based on custom-made silicone masks [23]. Furthermore, they found that real human faces and 3D silicone masks showed significantly different low-order statistics in the thermal domain, which means that thermal imaging can be used to detect 3D mask presentation attacks [24]. However, since the temperature information is easily changed by attackers, resulting in a similar temperature reading for spoof faces and real faces, the expression of the thermal infrared radiation information for real and fake faces will become similar, which may lead to the degradation of the detection performance.
Based on the thermal infrared PAD method, a PAD method based on the medium wave infrared (MWIR) polarization characteristics of material surfaces is proposed in this paper for countering 3D silicone mask presentation attacks. Different targets have different polarization characteristics. Even if these targets have similar thermal infrared radiation intensity characteristics, their polarization characteristics are still quite different [25]. This work chooses the spectral band of 3.7–4.8 μm and collects facial images by means of a polarization imaging system so that the images are not restricted by external light sources. Based on the collected polarization MWIR face images, this paper constructs local maximum gradient amplitude feature vectors before being trained by a Support Vector Machine (SVM) classifier to distinguish the skin of a real human face from the silicone material used to make a 3D mask, regardless of the appearance differences. Through the comparative experiments, it is found that the polarization MWIR imaging is more suitable for 3D silicone masks than conventional MWIR imaging. This method becomes a reference for exploring other detection methods of 3D silicone mask spoofing based on infrared imaging.
The remainder of this paper is organized as follows: Section 2 explains, in detail, the PAD method proposed in this paper based on the MWIR polarization characteristics of the material surface; Section 3 introduces the experimental results and analysis; Section 4 is the summary.

2. Methods

Figure 1 is a flow chart of the PAD method developed in this paper. A polarization MWIR imaging system is used to capture a group of facial images for feature extraction. Based on the polarization degree of each region, a feature extraction method with a local maximum gradient value is proposed. Subsequently, an SVM classifier is used for training and classification.

2.1. Polarization MWIR Imaging

2.1.1. Imaging System

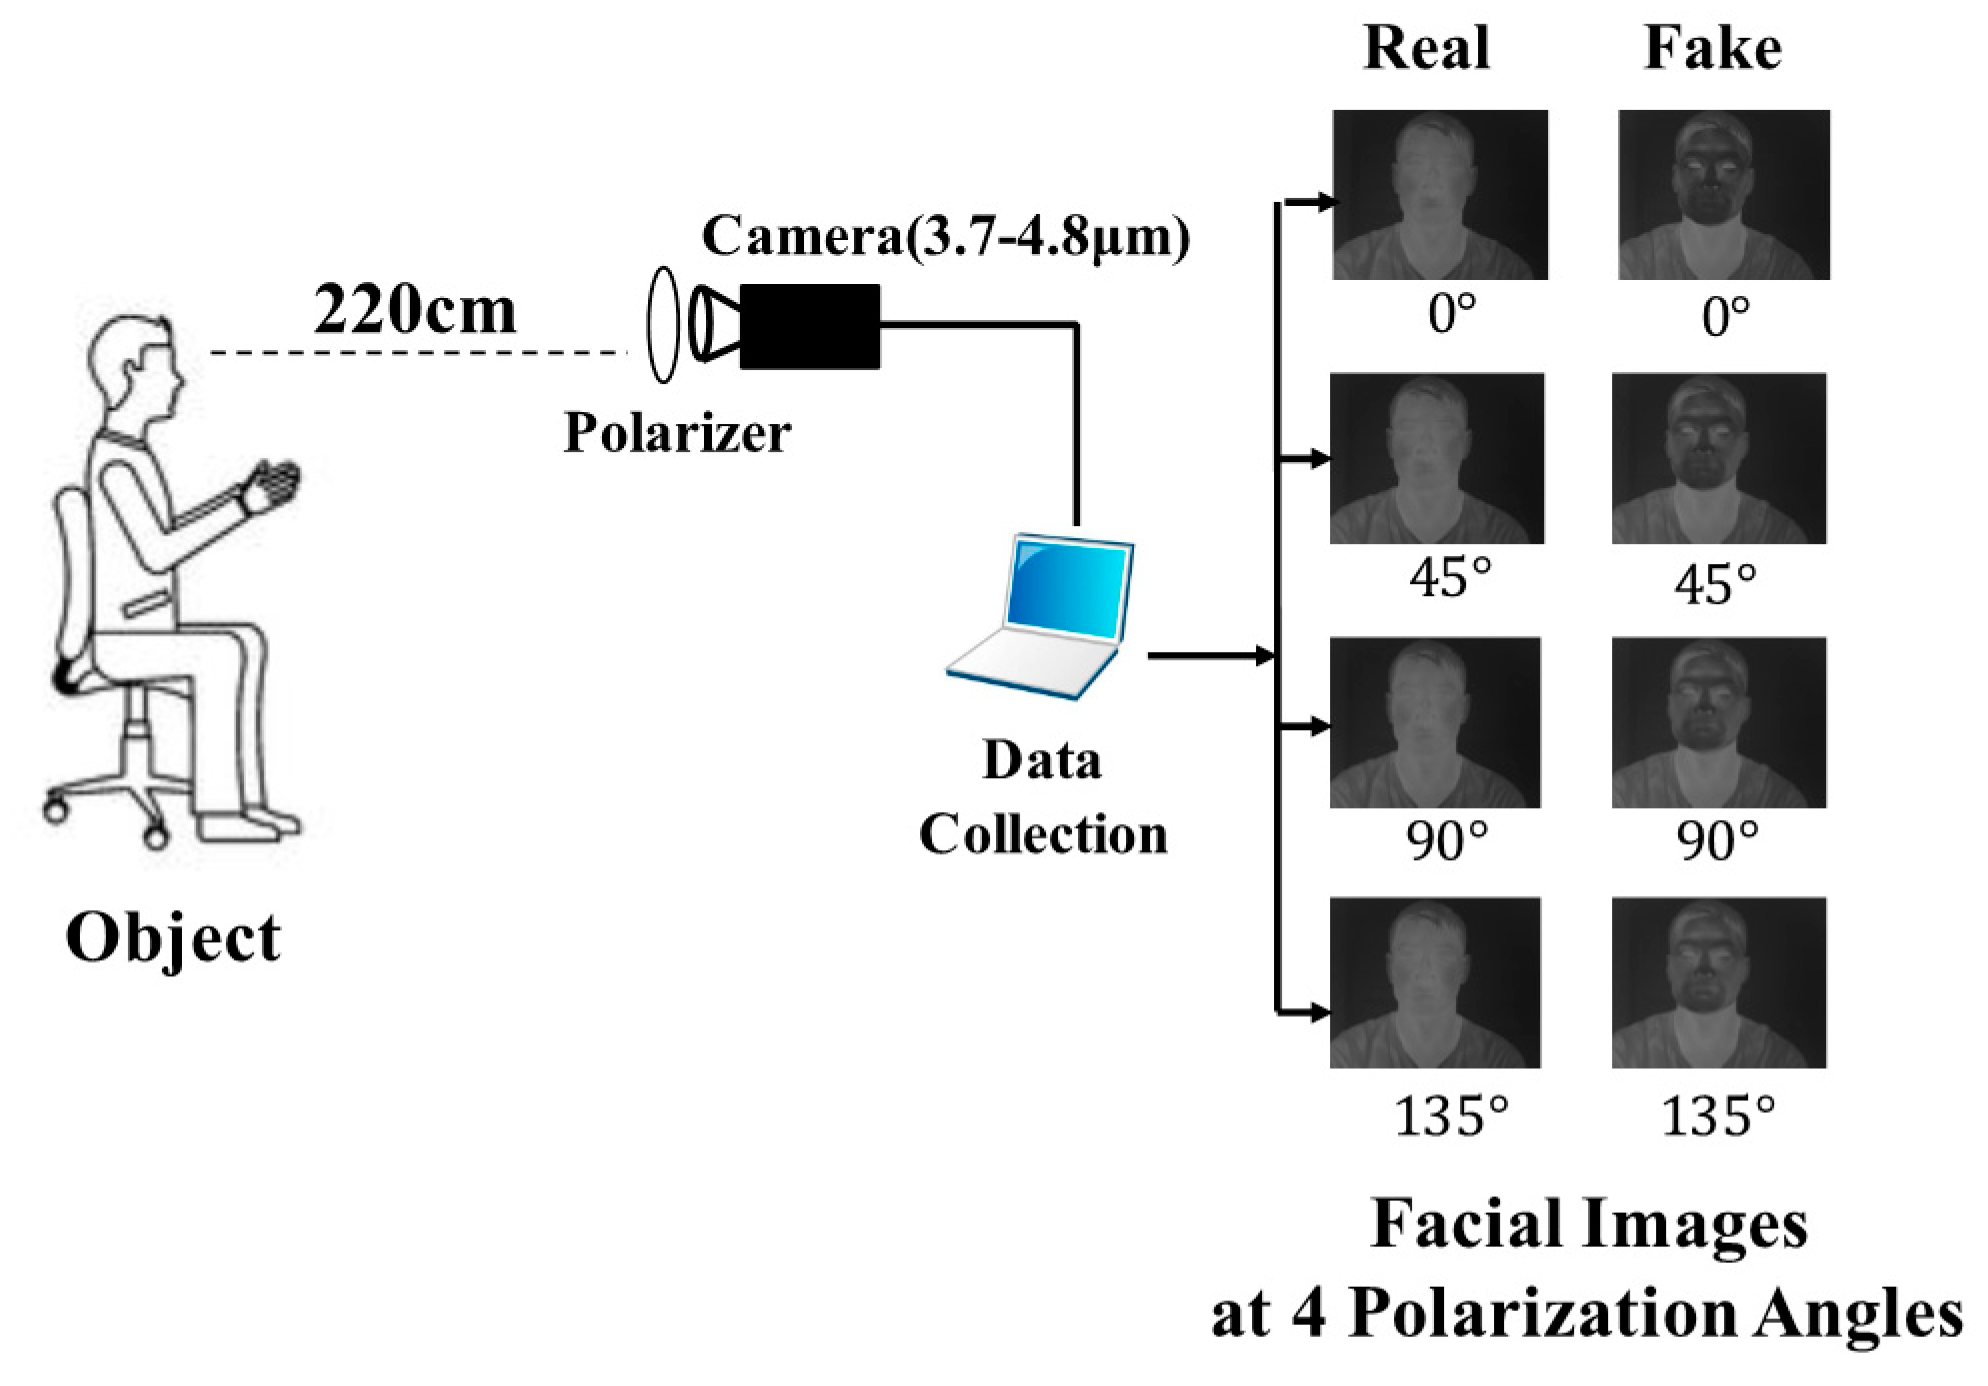
A time-dependent polarization imaging system is selected in this paper. The infrared intensity images obtained from four polarization angles are registered to reduce the deviation caused by the slight shaking of the experiment table and displacement of the subjects that may occur when the polarizer is rotated. Figure 2 shows the configuration of the experimental imaging system.
It is worth noting that, in addition to the normal scene radiation signal, the detector will also superimpose nonfiltered AC noise signals coming from the weak reflection of the polarizer in the cold environment of the imaging system, which forms a black spot in the center of the image’s field of view. This phenomenon is called the cold reflection phenomenon. In order to eliminate the cold reflection phenomenon, the polarizer can be tilted to defocus the cold reflection, thus removing the black spot in the center of the image’s field of view [26].
The target’s spontaneous emission in the MWIR band has a specific polarization characteristic. Polarized light in nature is mainly composed of linear polarized light, and the degree of linear polarization (DoLP) is used to measure the intensity. In this paper, a Stokes vector is used to calculate the DoLP of infrared radiation, which is expressed in terms of radiation intensity I x as:
S = [ S 0 S 1 S 2 S 3 ] = [ I Q U V ] = [ I 0 + I 90 I 0 I 90 I 45 I 135 I R I L ]
where I 0 , I 45 , I 90 , and I 135 represent the linear polarization infrared radiation intensity images taken at polarization angles (relative to horizontal direction) of 0 ° , 45 ° , 90 ° , and 135 ° , respectively. I R and I L are left and right circularly polarization infrared radiation images. S 0 represents the total conventional radiation intensity images. S 1 captures horizontal and vertical polarization information, while S 2 captures diagonal polarization information. In other words, S 1 and S 2 capture orthogonal, but complementary, polarization information, providing additional texture and geometric details, which enhances the recognition ability. Generally, very little circularly polarized light exists in nature (i.e., the component of S 3 is very small) so much so that it is generally considered to be zero [5]. The DoLP of infrared radiation can be directly calculated using Stokes parameters as:
D o L P = S 1 2 + S 2 2 S 0

2.1.2. Mathematical Model

The surface radiation from an object has different emittance in different polarization directions, which results in the polarization effect of spontaneous radiation [27]. According to the object’s infrared radiation characteristic, the numerical relationship between emissivity and reflectivity is:
ε s u r f = 1 r s u r f
where ε s u r f is the emissivity of the object’s surface, and r s u r f is the reflectivity. Therefore, the Stokes expression of the polarization radiation transmission model can be deduced by means of a polarized bidirectional reflection distribution function (pBRDF) model based on the micro-plane element theory [28] as:
S = [ S 0 S 1 S 2 S 3 ] = [ I obj + 1 8 π σ 2 1 cos 4 θ exp ( ( tan 2 θ / 2 σ 2 ) ) cos θ i ( R s + R p ) sin θ r d θ r d φ r ( I b g I o b j ) 1 8 π σ 2 1 cos 4 θ exp ( ( tan 2 θ / 2 σ 2 ) ) cos θ i cos ( 2 η i ) ( R s R p ) sin θ r d θ r d φ r ( I b g I o b j ) 1 8 π σ 2 1 cos 4 θ exp ( ( tan 2 θ / 2 σ 2 ) ) cos θ i sin ( 2 η i ) ( R p R s ) sin θ r d θ r d φ r ( I b g I o b j ) 0 ]
where σ represents the roughness of the object’s surface. The smaller the value of σ , the smoother the object’s surface. θ is the angle between the normal z μ of a micro-plane element and the surface normal z . θ i and θ r are the incident and reflecting zenith angles, respectively. φ r is the reflection azimuth angle. η i is the angle between the incident light and the normal light of the material’s surface. I bg and I obj are the infrared radiation intensity of the background and target, respectively. R s and R p are the polarized Fresnel reflectivity from a rough surface.
Based on Equation (4) and the physical definition of polarization degree, the DoLP of infrared radiation including multiple influencing factors can be obtained as:
D o L P = S 1 2 + S 2 2 S 0 = 1 8 π σ 2 | I b g I o b j | I o b j + 1 8 π σ 2 1 cos 4 θ exp ( ( tan 2 θ / 2 σ 2 ) ) cos θ i ( R s + R p ) d Ω r ( I b g I o b j ) [ 1 cos 4 θ exp ( ( tan 2 θ / 2 σ 2 ) ) cos θ i cos 2 η i ( R s R p ) d Ω r ] 2 + [ 1 cos 4 θ exp ( ( tan 2 θ / 2 σ 2 ) ) cos θ i sin 2 η i ( R s R p ) d Ω r ] 2
It can be seen from Equation (5) that DoLP is a function of certain parameters, such as the roughness, reflectivity, incidence angle and intensity contrast between the background and target.
Due to the complexity of the mathematical model, reasonable assumptions about the detection conditions can be made. (i) Assume that the incoming light and reflected light are in the same plane, so that the rotation angles η i and η r among the reference planes in the micro-plane element can be ignored. (ii) Assume that the surface smoothness of the measured object is high, so that θ can be ignored. The simplified relationship between DoLP and factors including the incident angle, material reflectivity and roughness can be expressed as:
D o L P = a | R s R p | 8 σ 2 cos θ i ± a ( R s + R p )
where a is the ratio of the intensity difference between the background and the target and the target’s radiation intensity. Under the experimental condition of this paper, further reasonable assumptions can be made. (i) Before and after wearing a 3D mask, the subject faces towards the imaging system, so the incident angle θ i can be regarded as a constant. (ii) The background is fixed, so the difference in coefficient a can be seen as being caused by the difference in radiation intensity between a positive and negative sample. As described in Section 1, attackers can easily make the conventional radiation intensity of real and fake faces very similar by changing the mask’s temperature or by other means. Thus, a can be regarded as a constant in this paper.
If the energy loss from absorption and scattering is not considered, when the incident light wave is reflected onto the interface of two different media, the light energy is redistributed between the reflected light and refracted light according to a certain law, and the total energy remains constant. Therefore, the reflectivity and refractive index meet:
{ R s + N s = 1 R p + N p = 1
Then refractive index can be expressed as:
{ N s = 1 R s N p = 1 R p
In summary, according to Equations (5) to (8), it is deduced that the DoLP of infrared radiation is a function of surface roughness σ and surface refractive index N , which is not affected by illumination conditions, and it is denoted as D o L P = F 1 ( σ , N ) . Furthermore, the DoLP decreases with the increase in σ , while it increases with the increase in N . This means that, under the same condition: (i) the rougher the target’s surface, the lower the polarization degree of infrared radiation; (ii) the higher the target’s surface refractive index, the greater the DoLP of infrared radiation [29].
Note that the calibration process of a polarization infrared imaging system is not studied in this paper, and the functional relationship between the image’s pixel value and the value of the imaging system’s response is not derived in detail. When the system is stable, it is assumed that the corresponding calibration relationship remains unchanged. Therefore, the pixel value I of polarization MWIR face image has a certain function relationship F 2 ( · ) with refractive index N and surface roughness σ as:
I = F 2 ( N , σ )

2.2. Feature Design

In view of different DoLP values of infrared radiation in different regions, a feature extraction method based on the local maximum gradient amplitude is designed in this section. In the process of feature extraction, real face images are taken as positive samples and 3D face mask images as negative samples.
Firstly, the symmetric gradient amplitudes centered on the target pixels are calculated pixel by pixel for each polarization MWIR face image as:
g ( x , y ) = g x 2 ( x , y ) + g y 2 ( x , y ) = ( I k x 2 , y I k x + 2 , y ) 2 + ( I k x , y 2 I k x , y + 2 ) 2
where I is the image’s pixel value. g ( x , y ) can be further expressed as:
g ( x , y ) = ( F 2 x 2 , y ( N , σ ) F 2 x + 2 , y ( N , σ ) ) 2 + ( F 2 x , y 2 ( N , σ ) F 2 x , y + 2 ( N , σ ) ) 2
It can be seen from Equation (11) that the gradient amplitude of a polarization MWIR face image is determined by the different refractive index and surface roughness in each region.
Secondly, the gradient amplitude image is scaled pixel by pixel as:
h ( x , y ) = { c 1 g ( x , y ) , 0 < g ( x , y ) < T c 2 g ( x , y ) , g ( x , y ) T
where T is the threshold. When the pixel value is less than T , it is multiplied by c 1 , and when the pixel value is larger or equal to T , it is multiplied by c 2 . After scaling, the face masks will show distinct contours around the eyes, nostrils and even the mouths, while the real faces will not.
Next, the gradient amplitude image h ( x , y ) is equally divided into blocks after scaling for feature extraction. In order to facilitate the extraction process of the image features, the sizes of the facial images were uniformly adjusted to 196 × 196 pixels, and the size of each block was set to 14 × 14 pixels. Additionally, different settings for the block sizes will be tried in future works.
Finally, the maximum gradient amplitude of all pixels in each block is selected and all of these are connected in a series to form a feature vector. Since statistics, such as mean and variance, are sensitive to the complexity of pixel value distribution in each block, the maximum value is selected in this paper instead of the above two parameters. The feature vector is shown as:
m k i = [ m k 1 , m k 2 , , m k M ]
where k represents the image number, m x is the maximum value of gradient amplitude of each region:
m x = max [ h ( x , y ) ]
M is the dimension of feature vector, and its calculation formula is:
M = [ ( P B ) ÷ S + 1 ] [ ( P B ) ÷ S + 1 ]
where P is the size of sample image, B is the size of block, and S is the step size. The construction process of the feature vector is shown in Figure 3.
The gradient feature is designed based on the difference in DoLP of infrared radiation in different regions of facial images. According to the modeling process described in Section 2.1, this feature is only related to the refractive index N and surface roughness σ of the face, and it is independent of the facial appearance.
After obtaining the feature vector based on the gradient, an SVM classifier is used to learn the gradient features of the polarization MWIR image of the real face and the 3D face mask, then the classification is completed to obtain the evaluation results.

3. Experiments

3.1. Data Collection System and Material

The existing public databases for the research of the PAD method are as follows: most of them are built to study the PAD methods for photos and replaying videos, including nine visible light databases, the most typical of which is the NUAA (Nanjing University of Aeronautics and Astronautics) Imposter Database; additionally, there is one multi-spectral (visible light and NIR or short-wave infrared) database called the MS-Face Database and the one (visible light) for the research of the 3D mask PAD method named the 3D MAD Database [15]. Recently, a database with several attacks that included 3D masks was published this summer, named The Wide Multi-Channel Presentation Attack (WMCA) Database [30]. However, there is no database based on the use of polarization infrared imaging in the study of the 3D silicone mask PAD method. In order to verify the effectiveness of the method proposed in this paper, the time-dependent polarization MWIR imaging system described in Section 2.1 is used for data acquisition, which shows in Figure 4.
The data collection system shown in Figure 4 consists of an MWIR camera with a resolution of 320 * 256, made by the Guide Infrared Company (pixel size: 30 μm and detection band: 3.7–4.8 μm), image acquisition software, a metal wire grid polarizer made by the Edmund Optics Company (applicable band: 2–12 μm), an optical experiment platform and several other polarization device accessories. The polarizer is fixed on the optical experiment platform and placed in front of the lens of the camera.
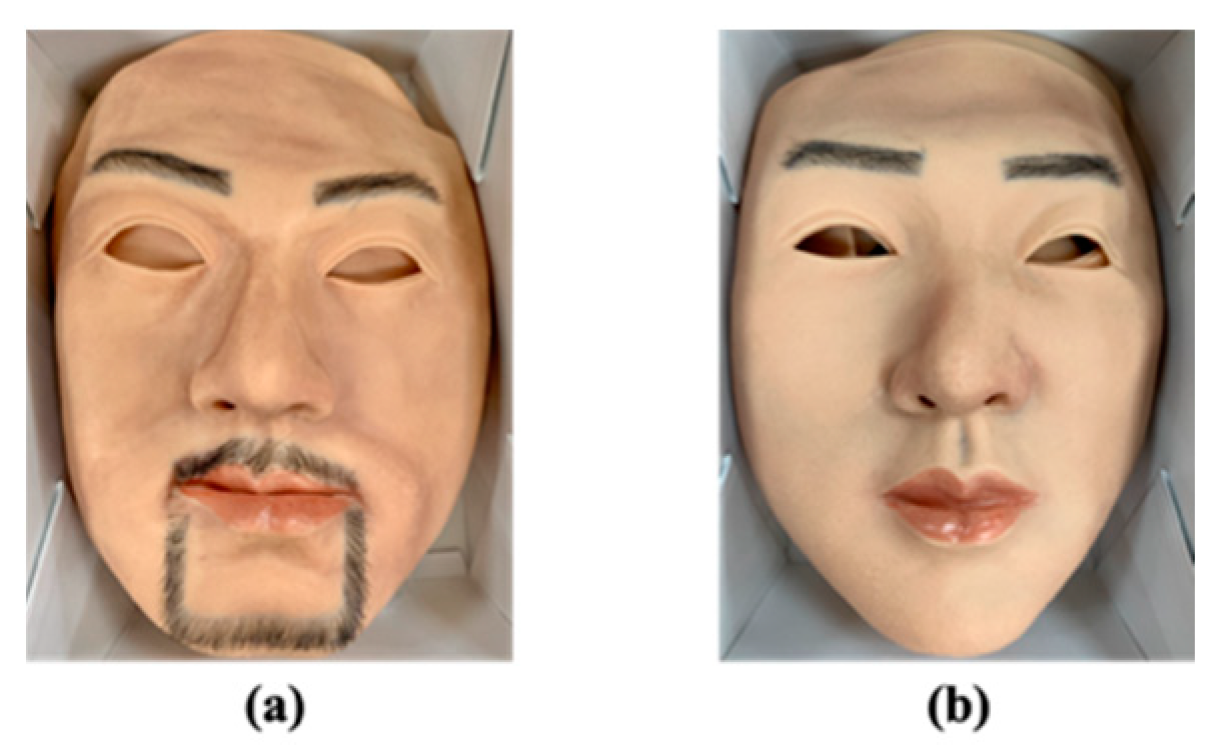
The 3D masks used in this research are made of silicone, as shown in Figure 5.
These masks are manufactured with holes in the eye and mouth locations and the facial region visually resembles real human facial skin. We tested it with an iPhone XS, as well as some other electronic devices which have facial recognition capabilities, and found that these masks can pass the verification of these systems.

3.2. Data Collection and Composition of Dataset

The temperature of the laboratory is approximately 25 ℃, and the facial temperature is about 35 °C. Subjects are asked to sit around 220 cm away from the imaging system and to face the camera. During the data collection, all the subjects do not wear eyeglasses. By rotating the polarizer, the experimenter captures the MWIR intensity images of four polarization angles (i.e., I 0 , I 45 , I 90 , and I 135 ) via image acquisition software. Figure 6 shows an example of the I 0 , I 45 , I 90 , and I 135 intensity images from one subject.
Then Stokes parameters S 0 , S 1 , and S 2 are calculated, and the MWIR polarization images can then be obtained. Figure 7 shows the MWIR images of two subjects before and after wearing 3D masks.
Generally, the surface roughness of a 3D silicone mask is smaller than that of real facial skin and its surface refractive index is larger [31,32,33]. Thus, the MWIR DoLP of a 3D silicone mask is higher than that of a real human face. In addition, presentations with masks produce darker images than those of real faces in view of conventional MWIR intensity images, but their darkness varies with the facial temperature, which may lead to small differences between the two kinds of presentations. In contrast, with the polarization images, the differences are more obvious. Besides, polarization MWIR face images have richer textures and geometric information, which are conducive to improving the stability of the detection results.
A total of 352 effective samples are collected in this experiment as a sample dataset for the experiment, including 183 conventional MWIR intensity images and 169 polarization MWIR images. Table 1 shows the composition of the dataset.
All data in the dataset are images taken by a 320*256 resolution camera and saved in PNG format. For the convenience of feature extraction, the image size is adjusted to 196 * 196 pixels.

3.3. Results and Analysis

3.3.1. Difference before and after Wearing Masks

For face presentation attack detection, we believe that the larger the difference in the low-order features of real and fake face images, the better the detection ability will be. In other words, the larger the difference value D , the better the results will be for feature extraction using the PAD method. The difference value D of real facial images and masked facial images is defined as:
D = | var ( I F a k e ) var ( I Re a l ) |
where I F a k e and I Re a l represent 3D face mask images and real face images, respectively, and var ( · ) represents the process of solving the variance.
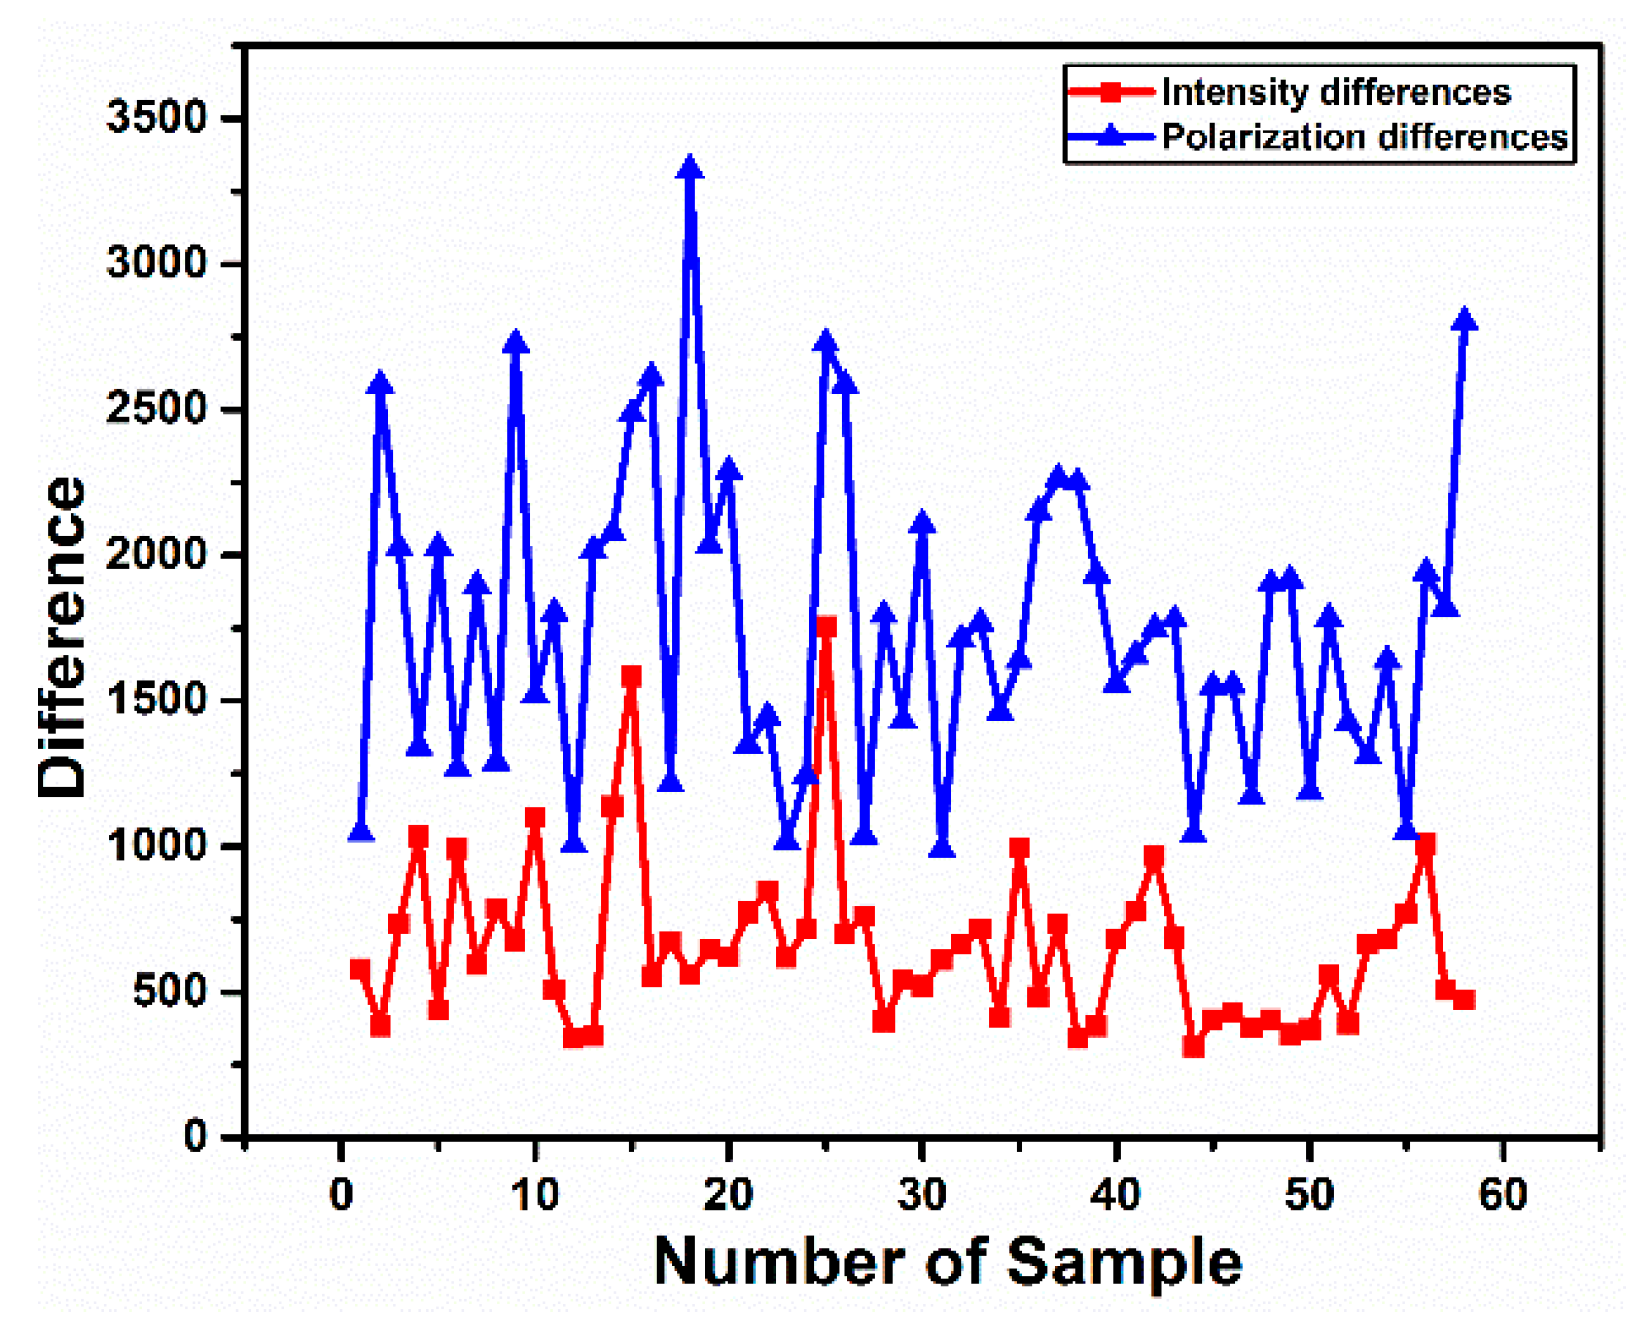
In this research, we calculated the D values of conventional WMIR images and corresponding polarization images of each subject before and after wearing the 3D silicone masks (a total of 58 sets of data). The statistical results are shown in Figure 8.
As can be seen from Figure 8, for each subject, the D values of polarization MWIR images before and after wearing 3D silicone masks are greater than the differences in conventional MWIR images. This result indicates that, compared with conventional MWIR imaging, polarization-based MWIR imaging may be more suitable for solving the PAD problem of 3D silicone masks.

3.3.2. PAD Results

In this paper, the feature vectors representing each facial image are inputted into an SVM classifier, and then the classification results are obtained after training and testing. During the classification, a seven-fold cross-validation method is used, namely, all data are divided into seven parts on average; one part is taken as a test set and other six parts are taken as a training set. Corresponding to this experiment, the sample quantity of the test set is 24, and that of the training set is 145. The cross-validation is repeated seven times, every part of which is treated as a test set once, and then averaged with the results of the seven-fold cross-validation, resulting in a single estimate. The advantage of this method is that relatively stable and reliable detection results can be obtained.
To evaluate the PAD performance, this paper uses not only three old evaluation metrics (accuracy, recall, and precision) but also two new metrics defined by the ISO/IEC 30107-3 standard, namely the attack presentation classification error rate (APCER) and the bona fide presentation classification (BPCER) error rate. Another metric which is also derived is the average classification error rate (ACER), defined as (APCER+BPCER)/2, to summarize the overall performance of the PAD method as a single number. The lower the ACER values, the better the performance [34].
As mentioned in Section 2.2, the selection of threshold T , reduction coefficient c 1 and amplification coefficient c 2 will affect the detection results. By setting different values for coefficients, observing and comparing the experimental results under different coefficient values, the heuristic parameters were determined by taking the combination of coefficient values corresponding to the optimal results. After a large number of experiments, it was found that when the parameters are set as T = 77 , c 1 = 0.07 , c 2 = 2.5 , the detection performance of the PAD method in this paper would reach the optimal state. After averaging the cross-validation results, the test result values are shown in Table 2.
As we can see from Table 2, on the premise of using the same feature extraction and classification scheme, the performance of all measures, except APCER, in polarization MWIR images is better than that in conventional MWIR images. The error in the the test results may come from the SIFT-based registration algorithm before obtaining the polarization degree.
Since accuracy, recall, precision and ACER can directly represent the detection performance of the PAD method, the standard deviations of seven cross-validation experiments under conventional MWIR data and polarized MWIR data with these four metrics are calculated to measure the stability of the PAD performance represented by these two data types, as shown in Table 3 (for conventional MWIR data) and in Table 4 (for polarization MWIR data).
As can be seen from Table 3 and Table 4, the standard deviations of the PAD results under polarization MWIR images are all significantly lower than those under conventional MWIR images. Such a distribution of standard deviation happens because PAD detection results can be maintained in a relatively small fluctuation range, compared with conventional MWIR imaging, when polarized MWIR imaging is used. This shows that the use of a polarization MWIR imaging system for silicone mask presentation attack detection can provide a relatively more stable performance.
To summarize, polarized MWIR imaging is more suitable than conventional MWIR for studying PAD methods for 3D silicone masks.
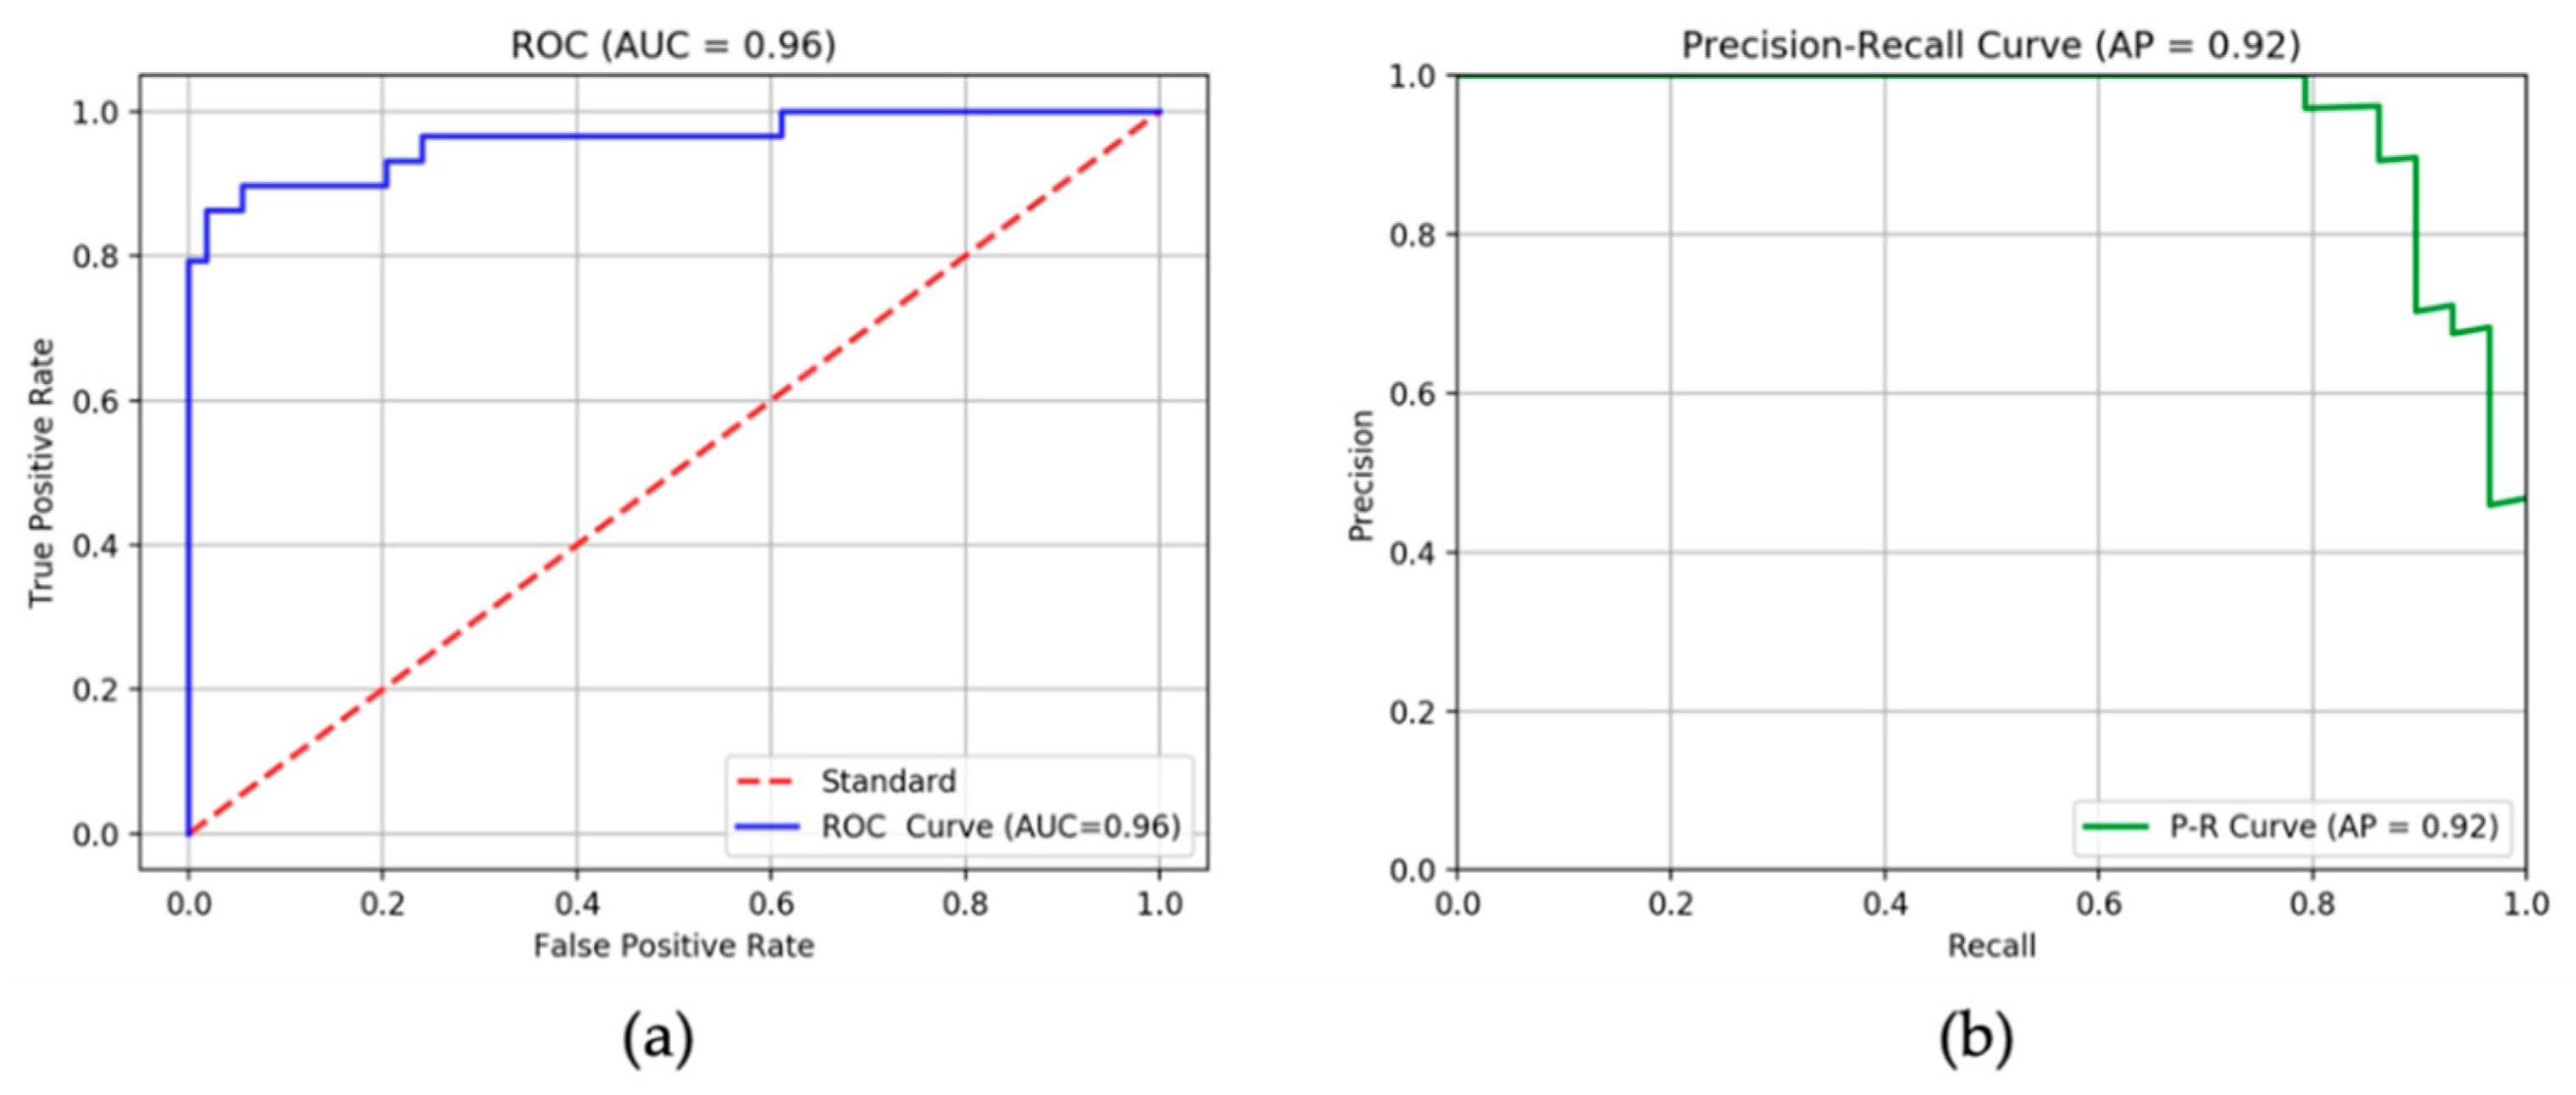
In addition, in order to reflect the stability and reliability of the classifier used in this paper, the receiver–operation curve (ROC) and precision–recall curve are drawn from the average results of all cross-validations, as shown in Figure 9. Furthermore, the area under curve (AUC) value of ROC and the average precision (AP) value (the AP value is also the area under the curve surrounding the axis) of the precision–recall curve are both calculated to numerically reflect the performance of the classifier. As can be seen from the annotation in the figure, AUC = 0.96 and AP = 0.92. Combining the trend of the two curves with the value of AUC and AP, it can be inferred that the classifier used in this paper is stable and has good performance.

3.3.3. Effect of Facial Temperature

In order to explore the influence of facial temperature on the performance of the detection method in this paper, conventional MWIR images and corresponding MWIR polarization infrared images of the real and fake faces of 10 subjects are selected from the collected database. The facial temperature of these 10 subjects is maintained at the normal temperature, and they are numbered from No. 1 to No. 10, respectively. The other 10 subjects are asked to increase their facial temperature through exercise, and then conventional infrared intensity images and corresponding polarization infrared images of their real and fake faces are taken in the same way. The 10 subjects with an increased facial temperature are numbered from No. 11 to No. 20.
The D values of the above 20 subjects’ 3D face mask images and real face images are calculated, respectively, and they are shown in Figure 10.
For convenience, the data from (a) and (b) in Figure 10 are combined, as shown in Figure 11.
Figure 11 shows that:
  • Whether or not the facial temperature is changed, the polarization infrared images of real faces and 3D face masks can maintain the large differences between them compared with the conventional MWIR intensity images.
  • After the increase in facial temperature, the difference in conventional MWIR images between the real and fake faces tends to decrease, while the differences in their polarization images remain at a high level. It is easy for an attacker to make the infrared radiation intensity of a 3D mask similar to that of a real face by changing the facial temperature, so as to reduce the detection performance of the PAD method based on conventional MWIR images. However, the results of this experiment show that changes in the facial temperature cannot reduce the detection performance of the PAD method based on the MWIR polarization characteristics of the material surface and gradient amplitude features.

4. Conclusions

This paper proposes a method to solve the problem of 3D silicone mask presentation attacks by employing polarization MWIR imaging. The method uses a polarization MWIR imaging system to capture a set of data without the need for visible or NIR light sources. The feature extraction process is designed based on the difference in infrared radiation (DoLP) in different regions of a facial image, which is only related to the refractive index N and the surface roughness σ , and is independent of the appearance of the face. The quantitative experiment in this paper shows that polarization-based MWIR imaging is more suitable for the study of the 3D silicone face mask PAD method than conventional MWIR imaging. Furthermore, the PAD method in this paper displays a certain robustness in the detection of facial temperature changes. However, due to the cost of the masks, the amount of data collected in this research is not large, so deep learning method cannot be used due to the over-fitting of the network. In future works, the data amount will be expanded to develop a more advanced deep learning method based on polarized MWIR imaging for 3D silicone masks.

Author Contributions

Conceptualization, P.S., D.Z., and F.C.; methodology, P.S., D.Z., and F.C.; software, P.S.; validation, P.S. and X.L.; formal analysis, P.S. and F.C.; investigation, P.S., D.Z., and F.C.; resources, F.C., and D.Z.; data curation, P.S., L.L., Z.C., D.Z., and F.C.; writing-original draft preparation, P.S.; writing-review and editing, P.S., D.Z., and F.C.; visualization, P.S. and F.C.; supervision, D.Z., L.Y., and F.C.; project administration, P.S.; funding acquisition, D.Z., and F.C. All authors have read and agreed to the published version of the manuscript.

Funding

This research was funded by the National Natural Science Foundation of China (No. 61572307).

Acknowledgments

The authors would like to thank teachers and students from Shanghai University, Shanghai Institute of Technical Physics, Chinese Academy of Sciences, and Shanghai Institute of Plant Physiology and Ecology, Chinese Academy of Sciences, for providing the experimental equipment and sites for this research. In particular, the authors thank everyone who participated in data collection.

Conflicts of Interest

The authors declare no conflict of interest.

References

  1. Neslihan, K.; Jean-Luc, D. On the Vulnerability of Face Recognition Systems to Spoofing Mask Attacks. In Proceedings of the IEEE International Conference on Acoustics, Speech and Signal Processing, Vancouver, BC, Canada, 26–31 May 2013; pp. 2357–2361. [Google Scholar]
  2. Shao, R.; Lan, X.; Yuen, P. Joint discriminative learning of deep dynamic textures for 3D mask face anti-spoofing. IEEE Trans. Inf. Forensics Secur. 2019, 14, 923–938. [Google Scholar] [CrossRef]
  3. Ramachandra, R.; Bush, C. Presentation attack detection methods for face recognition systems: A comprehensive survey. ACM. Comput. Surv. 2017, 50, 8. [Google Scholar] [CrossRef]
  4. ISO/IEC JTC1 SC37 Biometrics. ISO/IEC 30107-1:2016. Information Technology—Biometric Presentation Attack Detection—Part 1: Framework; International Organization for Standardization, Vernier: Geneva, Switzerland, 2016. [Google Scholar]
  5. Gurton, K.; Yuffa, A.; Videen, G. Enhanced facial recognition for thermal imagery using polarimetric imaging. Opt. Lett. 2014, 39, 3857–3859. [Google Scholar] [CrossRef] [PubMed] [Green Version]
  6. Song, X.; Zhao, X.; Fang, L.; Lin, T. Discriminative representation combinations for accurate face spoofing detection. Pattern Recogn. 2019, 85, 220–231. [Google Scholar] [CrossRef] [Green Version]
  7. Wang, Y.; Chen, S.; Li, W.; Huang, D.; Wang, Y. Face anti-spoofing to 3D masks by combining texture and geometry features. Lect. Notes Comput. Sci. 2018, 10996, 399–408. [Google Scholar]
  8. Tirunagari, S.; Poh, N.; Windridge, D.; Iorliam, A.; Suki, N.; Ho, A. Detection of face spoofing using visual dynamics. IEEE Trans. Inf. Forensics Secur. 2015, 10, 762–777. [Google Scholar] [CrossRef] [Green Version]
  9. Erdogmus, N.; Marcel, S. Spoofing face recognition with 3D masks. IEEE Trans. Inf. Forensics Secur. 2014, 9, 1084–1097. [Google Scholar] [CrossRef] [Green Version]
  10. Boulkenafet, Z.; Komulainen, J.; Hadid, A. Face spoofing detection using colour texture analysis. IEEE Trans. Inf. Forensics Secur. 2016, 11, 1818–1830. [Google Scholar] [CrossRef]
  11. Wen, D.; Han, H.; Jain, A. Face spoof detection with image distortion analysis. IEEE Trans. Inf. Forensics Secur. 2015, 10, 746–761. [Google Scholar] [CrossRef]
  12. Agarwal, A.; Yadav, D.; Kohli, N.; Singh, R.; Vatsa, M.; Noore, A. Face Presentation Attack with Latex Masks in Multispectral Videos. In Proceedings of the IEEE International Conference on Computer Vision and Pattern Recognition Workships, Honolulu, HI, USA, 21–26 July 2017; pp. 275–283. [Google Scholar]
  13. Bharadwaj, S.; Dhamecha, T.; Vatsa, M.; Singh, R. Computationally Efficient Face Spoofing Detection with Motion Magnification. In Proceedings of the IEEE International Conference on Computer Vision and Pattern Recognition Workships, Portland, OR, USA, 23–28 June 2013; pp. 105–110. [Google Scholar]
  14. Liu, S.; Yuen, P.; Zhang, S.; Zhao, G. 3D mask face anti-spoofing with remote photoplethysmography. Lect. Notes Comput. Sci. 2016, 9911, 85–100. [Google Scholar]
  15. Abd, A.; Wei, H.; Ferryman, J. Face Anti-Spoofing Countermeasure: Efficient 2D Materials Classification Using Polarization Imaging. In Proceedings of the IEEE International Workshop on Biometrics and Forensics, Coventry, UK, 4–5 April 2017. [Google Scholar]
  16. Zaliha, A.; Wei, H. Polarization Imaging for Face Spoofing Detection: Identification of Black Ethnical Group. In Proceedings of the IEEE International Conference on Computational Approach in Smart Systems Design and Applications, Kuching, Malaysia, 15–17 August 2018. [Google Scholar]
  17. Sun, X.; Huang, L.; Liu, C. Multispectral face spoofing detection using VIS–NIR imaging correlation. Int. J. Wavelets Multiresolut. 2018, 16. [Google Scholar] [CrossRef]
  18. Wang, Y.; Hao, X.; Hou, Y.; Guo, C. A New Multispectral Method for Face Liveness Detection. In Proceedings of the Second IAPR Asian Conference on Pattern Recognition, Naha, Japan, 5–8 November 2013; pp. 922–926. [Google Scholar]
  19. Liu, J.; Kumar, A. Detecting Presentation Attacks from 3D Face Masks under Multispectral Imaging. In Proceedings of the IEEE/CVF Conference on Computer Vision and Pattern Recognition Workshops, Salt Lake City, UT, USA, 18–22 June 2018; pp. 47–52. [Google Scholar]
  20. Krizhevsky, A.; Sutskever, I.; Hinton, G. ImageNet Classification with Deep Convolutional Neural Networks; NIPS. Curran Associates Inc.: New York, NY, USA, 2012; Volume 60, pp. 84–90. [Google Scholar]
  21. Kotwal, K.; Bhattacharjee, S.; Marcel, S. Multispectral Deep Embeddings as a Countermeasure to Custom Silicone Mask Presentation Attacks. IEEE Trans. Biom. Behav. Identity Sci. 2019, 1, 238–251. [Google Scholar] [CrossRef]
  22. Tan, X.; Li, Y.; Liu, J.; Jiang, L. Face liveness detection from a single image with sparse low rank bilinear discriminative model. Lect. Notes Comput. Sci. 2010, 6316, 504–517. [Google Scholar]
  23. Bhattacharjee, S.; Mohammadi, A.; Marcel, S. Spoofing Deep Face Recognition with Custom Silicone Masks. In Proceedings of the IEEE Conference on Biometrics Theory, Applications and Systems, Redondo Beach, CA, USA, 22–25 October 2018. [Google Scholar]
  24. Bhattacharjee, S.; Marcel, S. What You Can’t See Can Help You—Extended Range Imaging for 3D-Mask Presentation Attacks. In Proceedings of the IEEE Conference on Biometrics Special Interest Group, Darmstadt, Germany, 20–22 September 2017; pp. 1–8. [Google Scholar]
  25. Liu, J.; Zhang, P.; Xiao, R.; Hu, H.; Zhou, L. Image fusion algorithm at pixel level of polarization infrared image. Infrared Laser Eng. 2007, 36, 286–288. [Google Scholar]
  26. Cremer, F. Infrared polarization measurements and modeling applied to surface-laid antipersonnel landmines. Opt. Eng. 2002, 41, 1021–1032. [Google Scholar]
  27. Clerk, C.D. The physical basis of polarized emission. Phys. Bull. 1962, 13, 245. [Google Scholar] [CrossRef]
  28. Flynn, D.; Alexander, C. Polarized surface scattering expressed in terms of a bidirectional reflectance distribution function matrix. Opt. Eng. 1995, 34, 1646–1650. [Google Scholar]
  29. Gurton, K.; Dahmani, R. Effect of surface roughness and complex indices of refraction on polarized thermal emission. App. Opt. 2005, 44, 5361–5367. [Google Scholar] [CrossRef]
  30. George, A.; Mostaani, Z.; Geissenbuhler, D.; Nikisins, O.; Anjos, A.; Marcel, S. Biometric Face Presentation Attack Detection with Multi-Channel Convolutional Neural Network. IEEE Trans. Inf. Forensics Secur. 2020, 15, 42–55. [Google Scholar] [CrossRef] [Green Version]
  31. Kurimoto, M.; Azman, M.; Kin, R.; Murakami, Y.; Nagao, M. Influence of Surface Roughness on Hydrophobic Stability of Silicone Rubber Composites in Dynamic Drop Test. In Proceedings of the IEEE 10th Conference on the Properties and Applications of Dielectric Materials, Bangalore, India, 24–28 July 2012. [Google Scholar]
  32. Liu, C.; Gui, D.; Yu, S.; Chen, W.; Zong, Y. The preparation and characterization of high refractive index and heat-resistant silicone nanocomposites. In Proceedings of the IEEE 17th Conference on Electronic Packaging Technology, Wuhan, China, 16–19 August 2016; pp. 716–720. [Google Scholar]
  33. Zhong, X.; Wen, X.; Zhu, D. Lookup-table-based inverse model for human skin reflectance spectroscopy: Two-layered Monte Carlo simulations and experiments. Opt. Express 2014, 22, 1852–1864. [Google Scholar] [CrossRef]
  34. Li, L.; Correia, P.; Hadid, A. Face recognition under spoofing attacks: Countermeasures and research directions. IET Biom. 2018, 7, 3–14. [Google Scholar] [CrossRef]
Figure 1. Flow chart of the presentation attack detection (PAD) method proposed in this paper.
Symmetry 12 00376 g001
Figure 2. Configuration of polarization medium wave infrared (MWIR) imaging system.
Symmetry 12 00376 g002
Figure 3. The construction process of feature vector. The top row represents real face data, and the bottom row represents three-dimensional (3D) face mask data. The image size is 196 × 196 , block size is 14 × 14 . The feature vector dimension is 196.
Symmetry 12 00376 g003
Figure 4. Polarization MWIR imaging system. (a) Shows the imaging system. (b) Shows the measure to prevent cold reflection: rotate the polaroid horizontally so that its main axis is about 11° from the main axis of the camera lens.
Symmetry 12 00376 g004
Figure 5. Non-rigid 3D silicone masks used in this research. (a) represents the face with beard, and (b) represents the face with no beard.
Symmetry 12 00376 g005
Figure 6. MWIR intensity images of a subject before (the top row) and after (the bottom row) wearing 3D silicone masks with different polarization angles. (a) Shows I 0 images. (b) Shows I 45 images. (c) Shows I 90 images. (d) Shows I 135 images. All images are registered.
Symmetry 12 00376 g006
Figure 7. Images (a) and (e) are conventional MWIR intensity images of real human faces. Images (b) and (f) are conventional MWIR intensity images of 3D face masks. Images (c) and (g) are polarization MWIR images of real human faces. Images (d) and (h) are polarization MWIR images of 3D face masks.
Symmetry 12 00376 g007
Figure 8. The D -value distribution of 58 subjects’ face images. The red line represents the differences in subjects’ conventional MWIR images before and after wearing masks and the blue line represents those of the polarization images.
Symmetry 12 00376 g008
Figure 9. (a) Is the receiver–operation (ROC) curve of classifier used in this paper, and (b) is the precision–recall curve.
Symmetry 12 00376 g009
Figure 10. The D -value distribution for the 20 subjects’ face images. (a) Is the distribution of subjects with normal facial temperature, and (b) is the distribution of subjects with increased facial temperature.
Symmetry 12 00376 g010
Figure 11. Joint D -value distribution for real and fake face images of 20 subjects.
Symmetry 12 00376 g011
Table 1. The composition of the experimental dataset.
DataTypeGenderQuantity
Conventional MWIR ImagesRealMale52
Female18
FakeMale96
Female17
Polarization MWIR ImagesRealMale44
Female19
FakeMale91
Female15
Table 2. The average values of the cross-validation results based on conventional MWIR image and polarization MWIR image.
DatabaseConventional
MWIR Images
Polarization
MWIR Images
Metrics (%)
Accuracy93.7395.08
Recall93.6795.67
Precision95.3396.83
APCER4.765.56
BPCER6.284.34
ACER5.524.95
Table 3. Standard deviation distribution for cross-validation of conventional MWIR data (%).
AccuracyRecallPrecisionACER
Mean93.7393.6795.335.52
Standard Deviation4.13043.49835.29154.0242
Table 4. Standard deviation distribution for cross-validation of polarization MWIR data (%).
AccuracyRecallPrecisionACER
Mean95.0895.6796.834.95
Standard Deviation2.40633.49834.8553.4407