Article

Intermediate Gas Feed in Bi- or Triphasic Gas–Liquid(–Liquid) Segmented Slug Flow Capillary Reactors

Laboratory of Chemical Reaction Engineering, Department of Biochemical and Chemical Engineering, Technical University Dortmund, 44227 Dortmund, Germany
*
Author to whom correspondence should be addressed.
Symmetry 2020, 12(12), 2092; https://doi.org/10.3390/sym12122092
Submission received: 30 November 2020 / Revised: 14 December 2020 / Accepted: 15 December 2020 / Published: 16 December 2020
(This article belongs to the Special Issue Symmetry and Complexity of Catalysis in Flow Chemistry)

Abstract

:
Segmented slug flow systems in capillaries have already shown good potential for process intensification, due to their symmetry in the characteristic flow pattern. However, several challenges remain in this technology. For instance, in gas-consuming reactions, like Aliq + Bgas→Cliq, the gas droplets shrink and may even disappear, limiting the conversions and throughputs of capillary reactor systems. To overcome such shortcomings, an intermediate gas feed was developed. In order to maintain the well-defined slug flow characteristics, it is necessary to introduce the gas rapidly and precisely, in small aliquots of <10 µL. This allows us to preserve the well-defined alternating triphasic slug flow. A miniaturized electrolysis cell, together with a flow-observing system, was thus devised and implemented successfully as an intermediate gas feed. Feeding a new gas droplet into an existing liquid–liquid segmented flow had a success rate of up to 99%, whereas refilling an existing gas droplet is often limited by a lack of coalescence. Here, only at low volumetric flows, 70% of the gas bubbles were refilled by coalescence.

1. Introduction

Micro process engineering is characterized by process intensification, due to the small dimensions of the apparatuses and the resulting short transport paths. Especially multiphase systems, which are often limited by a restricted mass transfer, benefit from the intensification. In particular, segmented slug flows are characterized by high surface-to-volume ratios and are therefore particularly suitable for these systems [1,2,3,4]. Slug flows occur in liquid–liquid or liquid–gas systems in small flow channels, where the involved phases alternate regularly forming a certain symmetry in the flow pattern (see Figure 1). The phase with the better wetting properties with respect to the capillaries forms the continuous phase. The continuous phase often forms a wall film on which the longish, dispersed phase flows along. In addition to the large surface areas, the internal circulations, which are characteristic of the slug flow, are formed within each segment [5].
Although the hydrodynamics of segmented slug flows are already well characterized, actual applications in these reactor types entail additional challenges. This work focuses on catalytic gas-consuming reactions, which follow the principle reaction scheme below.
A liq + B gas   catalyst C liq
Examples of such reactions are hydrogenations, oxidations or hydroformylations. If such reactions are applied in a capillary reactor with segmented slug flows, a rapid shrinkage of the gas phase can be observed [6]. This effect is due to the large density differences between gases and liquids. In a slug flow with pure liquid reactant A in one phase and a gas phase of equal volume of pure B, the conversion is strongly limited by the low molar quantity of the gas component. In order to compensate this lack, various solutions can be considered.
A dilution of the liquid reactant A to a stoichiometric equivalence of A and B leads to a downstream purification problem in which product C needs to be separated from a very large excess of solvent. On the other hand, an increase of the volume fraction of the gas phase to a stoichiometric equivalence of substance quantities minimizes the throughput and the space–time yield of the capillary reactor substantially. A reasonable strategy is therefore to introduce further reaction gas into the reactor along the capillary.
If the reaction system has only one liquid and one gas phase, the complete disappearance of the gas bubble can be awaited and new gas bubbles can be injected via a Y- or T-junction. For the considered problem of a catalytic gas-consuming reaction, however, the question of the catalyst remains unsolved. If a two-phase slug flow is to be used, the catalyst can be heterogeneously suspended or homogeneously dissolved in the liquid phase. In both cases, downstream separation implies additional challenges. Alternatively, the catalyst can also be immobilized on the inner wall of the capillary [7,8,9]. In this case, catalyst deactivation must be considered, which hinders continuous operation under the same conditions. A more elegant possibility is to immobilize the catalyst in an additional liquid phase. Both homogeneous and heterogeneous suspended catalysts can be used [10,11]. The catalyst can be easily separated from the product at the outlet of the capillary reactor by phase separation.
However, the additional third phase in the slug flow causes other challenges. The generation of the three-phase (gas–liquid–liquid) segmented slug flow has already been successfully demonstrated by connecting two adjustable coaxial slug generators in series; therefore, it can be applied without difficulty [12,13]. The three-phase flow even shows a higher stability, as compared to two-phase segmented slug flows, at high volume flows [12]. Using three phases in a microcapillary reactor therefore brings advantages, particularly with regard to stability and the additional introduction of a catalyst phase.
Nevertheless, in this case, the problem of gas shortage remains with gas-consuming reactions. Even awaiting the complete disappearance of the gas bubble in the three-phasic flow leaves two phases remaining. If gas is injected again, it is necessary to ensure that the segments of the respective phases are not destroyed; otherwise, the advantageous properties of the segmented slug flow cannot be kept. A gas supply through Y- or T-junctions is therefore unsuitable. Even the coaxial slug generators cannot provide a solution, since the three-phasic flow is created by surrounding the existing two-phase slug flow with the continuous (liquid) phase.
One strategy is to feed the gas phase through a membrane into the capillary. For example, the oxidation of a single-phase flow has been successfully performed with high conversions [14]. However, in multiphase systems, there is a risk that, with high volumetric gas flows, small gas bubbles are forming at the membrane, and that these may influence the existing segmented flow. For this reason, Önal has used the permeation of hydrogen through a PTFE (polytetrafluoroethylene) capillary for a multiphase hydrogenation in a capillary reactor [6,15]. The hydrogen is transported in dissolved form into the capillary reactor, where it either refills an existing gas bubble or reacts directly with the liquid reaction partner. Despite a pressure difference of 20 bar, Önal could only observe a low gas permeation through the capillary and, consequently. only slight improvements in conversion [6]. This is due to a comparatively short capillary length (max 12 m) and to the temperature (50 °C), since the permeation increases with the temperature and the offered exchange area [16]. This strategy can indeed be useful, if the reaction system requires a high reaction temperature and a long capillary. Thus, for fast reactions that suffer from side reactions without gaseous reactants (e.g., isomerizations), this is not an attractive solution.
For these systems, a controlled intermediate gas feed is a suitable option. New gas is introduced into the micro capillary, in a targeted manner, either in order to replace a completely consumed gas bubble or to refill a shrunken gas bubble. This forms a new alternating triphasic slug flow. To ensure that the newly injected gas bubble does not destroy the existing flow, it is advisable to inject it into the continuous phase. In order to assure that the time of injection is accurate, it is necessary to observe and characterize the segmented flow at the point of injection. A further observation point after the intermediate gas injection allows, on the one hand, an evaluation whether the gas bubble has affected the flow and, on the other hand, a feedback control of the length of the injected bubble. Figure 2 shows, schematically, this method of intermediate gas feeding.
For the intermediate gas feed (2), various apparatuses can be utilized. A solenoid valve or a piezo element could open at an appropriate time and inject the desired gas volume into the capillary. Another possibility is the use of an electrolysis cell, which can feed defined volumes by controlling the amperage.
In this contribution, the method of gas-bubble injection in capillary reactors with multiphase segmented slug flows was investigated. A solenoid valve and an electrolysis cell were utilized in this concern. Control concepts were developed, and in this paper, different electrolysis cells are discussed, the influence of different operating and control variables on the stability of the gas injection are investigated and, finally, the intermediate gas feeding is evaluated.

2. Materials and Methods

Either a liquid–liquid or a gas–liquid slug flow in an FEP (fluorinated ethylene propylene) capillary (circular cross-section, 1 mm inner diameter) was used for the intermediate gas feeding. The FEP not only exhibits good wetting properties for many organic solvents, but it is also transparent, which allows easy optical validation of the flow. For liquid–liquid flow, 1-hexanol (Alfa Aesar, Haverhill, MA, USA, 98% purity) was used as the continuous-wetting phase, water (desalinated) as the dispersed phase. For the gas–liquid flow, water was used as the continuous phase and nitrogen (Messer, Bad Soden, Germany, 99.996% purity) as the dispersed-gas phase. Syringe pumps (Legato 100, kd Scientific, Holliston, MA, USA) with 50 mL glass syringes (SGE Analytical Science, Victoria, Australia) were used to convey the liquid media. For the continuous gas flow, a mass flow controller was used (F-201-CV, Bronkhorst, Ruurlo, The Netherlands). For comparing both electrolysis cells, silicon oil (M20, Carl Roth, Karlsruhe, Germany) was used as continuous phase. All experiments were performed at a capillary pressure and a temperature close to ambient conditions.
Since slug flows with different lengths of the respective phases were to be utilized, an adjustable coaxial slug generator was used, which made it possible to adjust the bubble lengths independently of the volumetric flow [13].
For the intermediate gas feeding, the detection of the flow was necessary. Both the flow velocity and the bubble lengths of the individual phases need to be evaluated. For this purpose, a transmissive optical sensor (Vishay, Malvern, PA, USA, TCUT1300 × 01) was used, which contains one emitter and two light detectors with a distance of 0.8 mm. When the flow past the detector, each phase generates a characteristic voltage at the detector, which is dependent on the refraction and absorption of light by the different phases in the capillary. Thus, it is possible to differentiate between the individual phases in terms of time. With the known distance between the two detectors, the flow velocity and the length of each phase can be calculated [17]. This sensor also allows a validation for a three-phase flow and can be used, accordingly, for a feedback control, after the intermediate gas feed. For the evaluation of the gas injection and its coalescence success, a high-speed camera (DMK 23G618, Imaging Source, Taipei City, Taiwan) 20 cm after the injection was additionally used. The electrical signals of the transmissive sensor were processed on a micro controller board (Arduino Uno Rev 3 SMD, Arduino LLC, Boston, MA, USA) and evaluated with respect to velocity and phase length. In all experiments, the distance between the light barrier and the location of the intermediate gas feeding was chosen to be 105 mm.
Both the solenoid valve and the electrolysis cell were installed 50 cm after slug generation to ensure a fully developed slug flow. The solenoid valve (ATS-V4, Wittko, Riedenburg, Germany) was screwed directly into a T-junction in order to keep the free gas volume as small as possible and thus minimize compression effects. The T-junction was made of PMMA (Poly(methyl methacrylate)), whereby all tubes have a diameter of 1 mm. A MOSFET (metal–oxide-semiconductor field-effect transistor) transistor can electrically control the solenoid valve. The solenoid valve is supplied with nitrogen from a pressure vessel, for which the pressure can be controlled with a pressure regulator (R414003373, Aventics, Laatzen, Germany). The schematic layout of the intermediate gas feeding via the solenoid valve is shown in Figure 3.
In order to examine, in a more detailed way, a possible utilization of electrolysis in micro process engineering, two different electrolysis cells were constructed. In both cells, the electrodes comprised nickel or nickel-coated steel, which was sealed with epoxy resin in the PMMA housing, to ensure a leak-proof joint. Both cells are shown in Figure 4. Water was electrolyzed, producing hydrogen and oxygen. The electrolyte used was a one-molar potassium hydroxide solution.
Cell 1 has the larger volume and can be equipped with a Nafion membrane for separation of oxygen and hydrogen, which is stabilized by an additional support unit. Each half cell has an electrode chamber with 65 mm diameter and 25 mm depth. The electrodes consist of 1 mm thick and 10 mm wide nickel sheet. During operation, the half cells were filled with 60 mL electrolyte, leaving a free gas volume of approximately 23 mL per half cell. The gas generated in this cell is introduced into the capillary via a T-junction. The inlet diameter of the T-junction has a diameter of 0.5 mm.
Cell 2 represents a strongly miniaturized version of the first cell, but no separation of the gases is possible. Since the amount of gas produced is very small, the mixture of hydrogen and oxygen does not cause a safety issue. The gas outlet is already connected to a T-junction (1 mm inlet diameter) within the assembly. The cell has internal dimensions of 15.5 mm height, 3 mm width and 5 mm depth. The nickel electrodes are attached directly to the PMMA chamber walls. The cell volume is approximately 0.23 mL. The gas volume during operation is between 0.005 and 0.02 mL, depending on the respective liquid level of the cell. With one electrolyte filling, up to 120 mL of gas can be produced, which is sufficient for the investigation of the intermediate gas feeding.
The electrolysis was supplied by a current source (LPS 301, Amrel, Pasadena, CA, USA). This source can either be controlled by a transistor at a preset amperage or by an external control unit, which was fabricated by the workshops of the Technical University Dortmund. The external control unit can regulate the current, but also the times supplying electricity. These variables can be controlled via a serial communication interface. The setup of the intermediate gas feeding via an electrolysis cell is shown in Figure 5.
The individual devices for the intermediate gas feeding (sensors, control of solenoid valve and electrolysis cell, gas supply via the mass flow controller and pressure regulation of the pre-pressure vessel) were controlled by the software LabView (LabView 2018, National Instruments, Austin, TX, USA). However, the syringe pumps for the liquid volume flow were operated manually.

3. Results

The principle operating concept of intermediate gas feeding and the relevant formulae are presented in the following. Then the ability to control the solenoid valve and the electrolysis cell for an intermediate gas feeding is evaluated. Thereby gas is first fed into a single-phase flow. Then the intermediate gas feeding is demonstrated with an electrolysis cell in a liquid–liquid and a gas–liquid slug flow. Finally, it is verified that it is possible to provide a closed-loop control for the length of the injected gas bubble.

3.1. Operating Concept for the Intermediate Gas Feeding in Multiphase Capillary Reactors

This section outlines the general principles for the design and operation of intermediate gas feeding into a capillary with multiphase flows, which are the fundament for the following subsections. The aim of intermediate gas feeding is to integrate a gas bubble of a given length into an existing slug flow.
The desired gas bubble length in the capillary reactor represents the desired value, Lgas,set. In principle, two possibilities are conceivable.
In a gas–liquid(–liquid) slug flow, an existing but shrunken gas bubble is filled up to reach Lgas,set. If the gas bubble is already completely dissolved at the location of intermediate gas feeding, a new gas bubble must be injected into the remaining liquid–liquid flow. Either a gas bubble has to be refilled or a new one has to be generated. The length of the bubble, and not its volume, represents the desired value, since it is easier to determine with common measuring methods, and it may influence the hydrodynamics. Accordingly, the length of the gas bubble, ΔLgas, to be injected is defined as follows, depending on the flow pattern.
Δ L gas = L gas ,   set L gas ,   actual 0 L gas ,   set , gas / liquid / liquid   , liquid / liquid
For a successful adjustment of the desired value, Lgas,set, both the correct time of injection and the necessary gas volume must be controlled, depending on the current length of the bubble to be filled.
First, the control of the injection timing is discussed, using the example of gas–liquid–liquid flow with already shrunk gas bubbles. With the help of the slug flow characterization in front of the intermediate gas feeding (Figure 1, Section 1), the actual flow velocity and the lengths of each phase involved can be determined. One of the most important requirements of the intermediate gas feeding is not to disturb the existing dispersed (liquid) phases. Therefore, feeding into the continuous phase is reasonable.
Since the duration of the continuous phase flowing past the location of the feeding depends on the flow velocity and its length, these parameters are also taken into account. Therefore, the length of a continuous phase, Lslug, and the subsequent bubble lengths, Lbubble,gas and Lbubble,liq, are considered as one unit, Lunit. After the phase triplet is detected as a unit, a new, shortened distance, s*, to the location of injection is obtained. This distance depends on the phase lengths, which can vary depending on the operation of the capillary reactor. By dividing s* by the slug velocity, vslug, the time, tdelay, can be determined, which must be awaited to inject gas into the observed phase triplet. By small variations of tdelay, the time of injection can be changed so that the gas is injected either within the slug or the gas bubble in the front or the rear.
t delay = s * v slug
Figure 6 shows the procedure and the determination of the time delay. The length and velocity measurement of a unit cell consisting of one segment of each phase (phase triplet) begins once the continuous slug of the phase triplet reaches the sensor. The length measurement of Lunit is finished by passing the last disperse phase (here liquid) at the sensor and the new distance, s*, and thus the required time delay, tdelay, can be calculated. After waiting for the calculated time, the gas is injected in the last step.
The other variable that needs be controlled for the intermediate gas feeding is the injected gas bubble length, ∆Lgas. Depending on the type of intermediate gas feeding used, the actuators and, thus, the control variables can change.
Therefore, for both of the intermediate gas feeding options considered (solenoid valve and electrolysis cell), it is discussed how the released gas volume can be controlled.
For the solenoid valve, it is assumed that the gas is fed from a vessel with a constant pressure, p1, in a subcritical state, into the capillary with the pressure, p2. If it is also assumed that the diameter of the inlet of the T-junction is the smallest cross-section, Ainlet, and the gas volume, Vgas is only fed into the capillary during a defined opening time of the solenoid valve, topen, the following simplified relationship can be used based on the Bernoulli equation and the continuity equation.
V gas = A inlet · t open · 2 p 1 p 2 ρ gas
The capillary pressure, p2, and the inlet cross-section, Ainlet, cannot be changed during operation and are therefore not suitable for actively controlling the gas volume. With the opening time, topen, and the inlet pressure, p1, two variables are available to modify the gas volume, which can be used to control the gas volume injected.
In the electrolytic cell, Faraday’s law determines, in particular, the amount of gas produced. Assuming that the ideal gas law is valid, the gas volume, Vgas, can be calculated as follows, under knowledge of the temperature, T, and the capillary pressure, p2.
V gas = t active · I · R · T z · F · p 2
In this case, two possible control variables are also available, the active time, tactive, in which the electricity is supplied (comparable with topen of the solenoid valve), and the amperage, I (comparable with p2).
In both cases, a few requirements regarding the opening time, topen, and the active time, tactive, of the electrolysis cell are needed. This time should be sufficiently short and easily variable within this range, so that the gas is only injected when the slug (or the gas bubble in case of refilling) is passing by. A reference time for phase segments between 3 and 8 mm and velocities of 15–30 mm/s is about 20–75 ms. In addition, the distance between the individual feedings must also be appropriately short, so that a gas bubble can be injected in each phase triplet. According to the abovementioned conditions, the injection frequency should be 1–5 Hz.
The front and rear of a dispersed bubble are also referred to as caps. The shape of the caps varies depending on interfacial tension, viscosity and velocity. This makes it difficult to predict the exact bubble length as a function of volume. Nevertheless, the gas volume, Vgas, is used to infer the injected gas bubble’s length. Two basic geometries are used to represent the possible extrema: a cylinder with respective flat caps and a cylinder with perfect hemispheres. Since the actual bubble length should presumably be located between these two extrema, in the subsequent sections, the actually detected bubble lengths are compared with the two estimated lengths. The formation of a wall film also reduces the diameter of the bubble from the inner diameter of the capillary, d, by the wall-film thickness, h. The wall-film thickness can be calculated by using existing models [18,19]. ΔLgas can thus be calculated from the gas volume, for the two cases, as follows.
Δ L gas = 4 · V gas π · d h 2   for   flat   cap 4 · V gas π · d h 2 + 1 3 d h   for   hemispherical   cap

3.2. Development and Results of a Solenoid Valve for Intermediate Gas Feeding

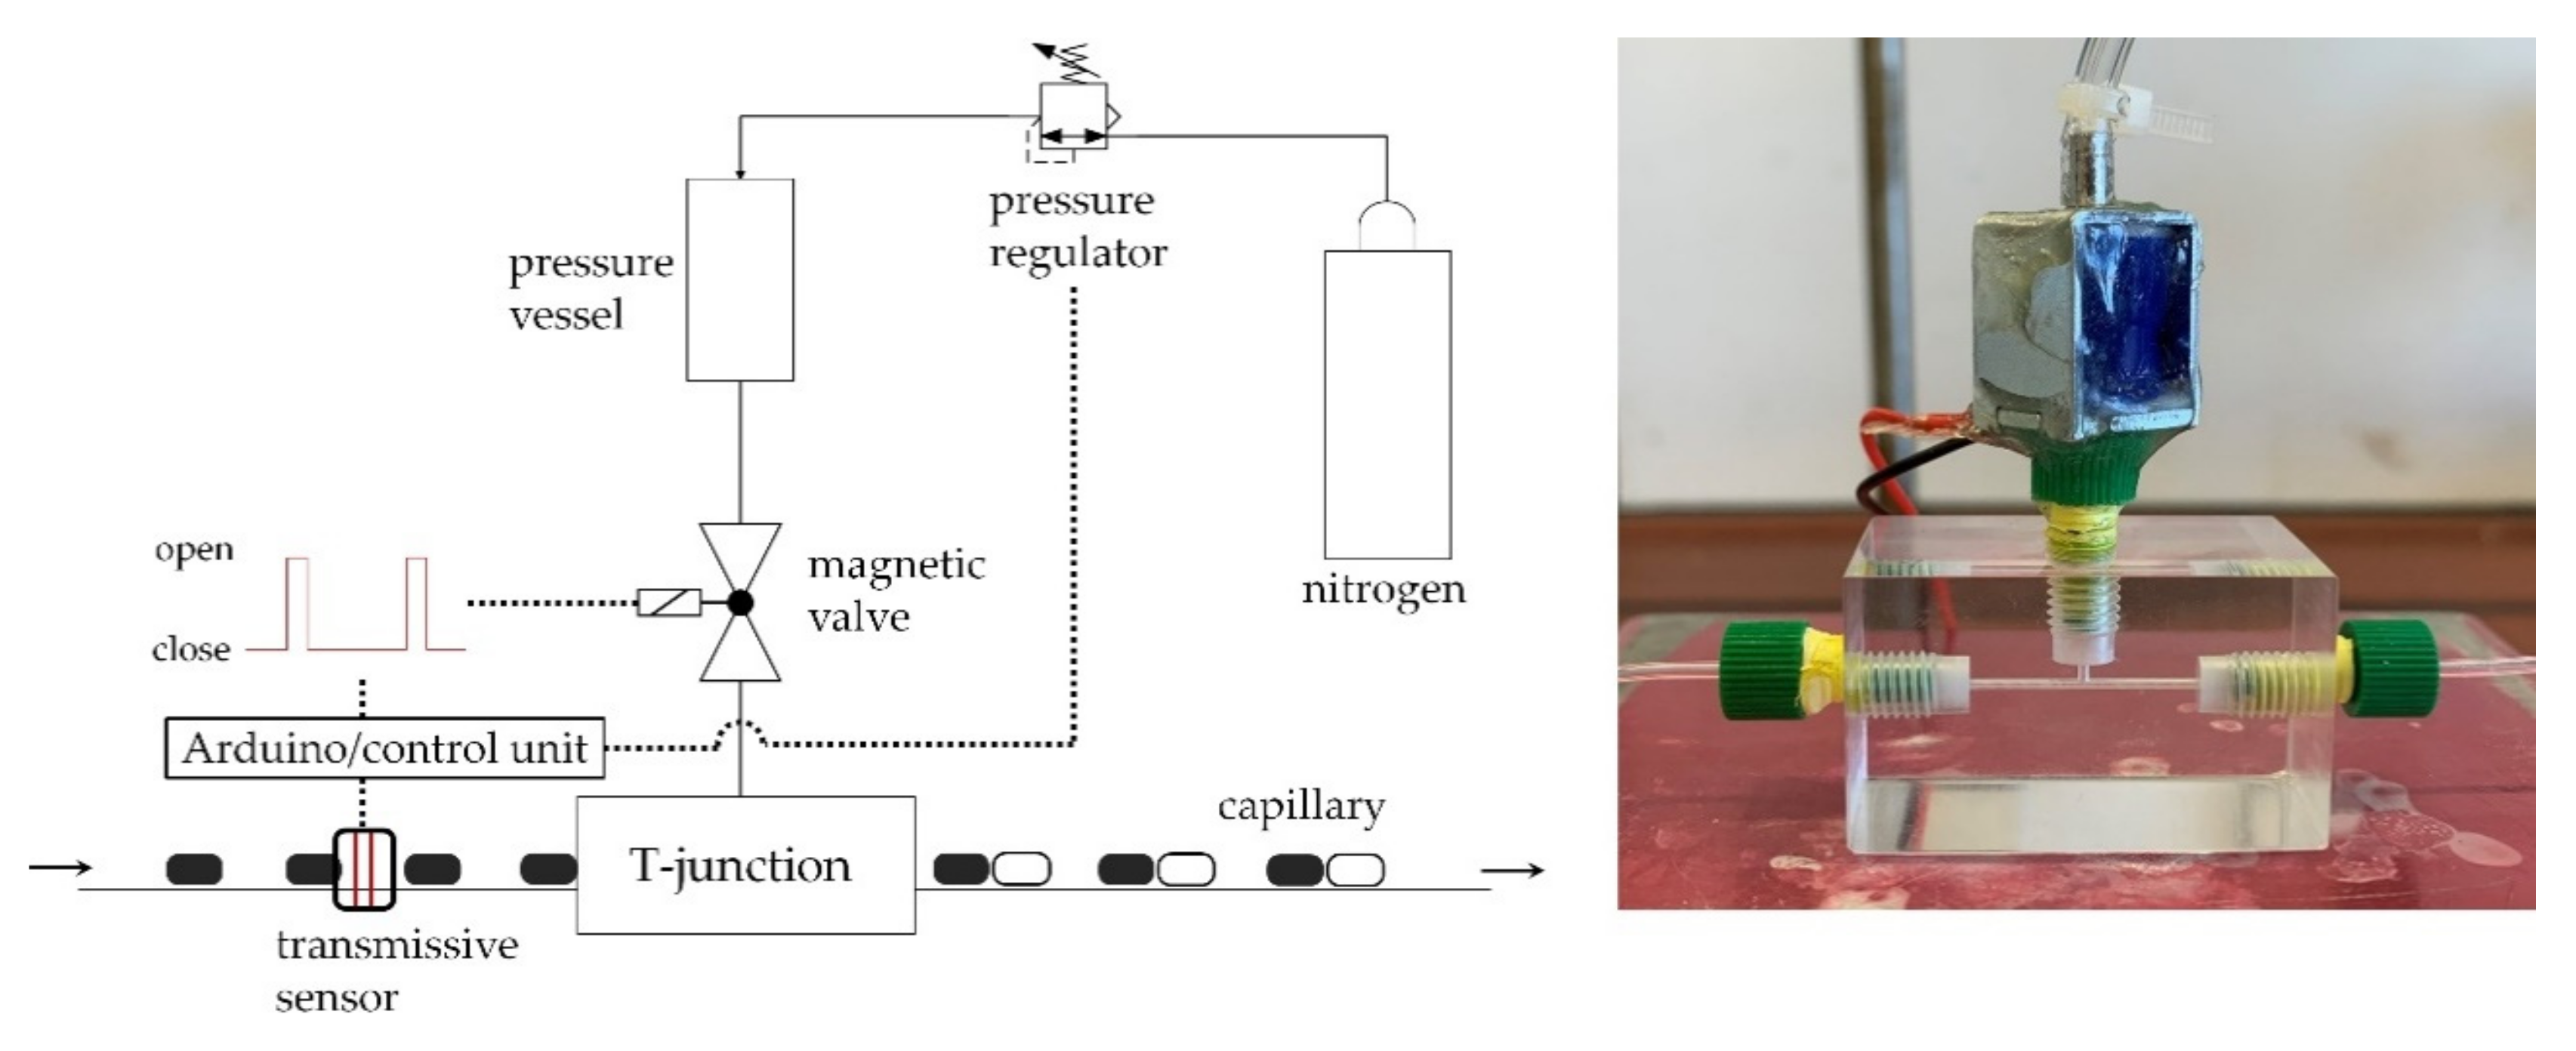
The gas feeding with the solenoid valve was first examined in a single-phase (water) flow. It was found that the solenoid valve used only partially fulfilled the requirements for feeding. The minimum opening time, topen, seemed to be limited by the time needed to close the solenoid valve. This is probably due to the mechanical closing of the valve by a spring. An exact minimum opening time could not be experimentally determined. A variation of the opening time within the reference time (20–75 ms) did not result in a variation of the bubble length. The feed-frequency was also limited for the solenoid valve, since it overheated above a frequency of 1 Hz and then no longer operated reliably. The solenoid valve used, therefore, did not meet the necessary requirements for opening time and feed-frequency. Nevertheless, the influence of the inlet pressure, p1, was investigated. The opening time was assumed to be constant and unknown, and gas was fed into the flow, with a feeding frequency of 1 Hz.
Figure 7 shows the resulting two-phase flow at different pressures. Δp represents the pressure difference between the capillary pressure, p2, and the pressure in the vessel in front of the solenoid valve, p1. An increase in the gas bubble length can be observed as a function of the pressure difference. If the lengths at 40 and 50 mbar pressure difference are compared, the gas bubble increases by more than twice the length, which does not correlate with the theoretical considerations from Equation (4) with a root relationship. This can be attributed to two causes. First, there is the unknown opening time of the valve, and second, the accuracy of the inlet pressure by the pressure regulator is not sufficient for these pressure ranges, which can lead to deviations from the set pressures. Nevertheless, the pressure seems to be a significant factor in gas injection, which requires a very precise adjustment of the pressure difference for an actual application.
Even if a dependence between pressure difference and injected bubble lengths were shown, the solenoid valve is not suitable for an intermediate gas feeding. This is mainly due to an inaccurate adjustment of the opening time and a slow feeding-frequency.
At this point, it should be noted that the solenoid valve used could not meet the requirements. If instead very precise high-performance solenoid valves and a more precise pressure regulator are used, an intermediate gas feeding is also possible with solenoid valves. However, the use of these devices would make the intermediate gas feeding not very cost-effective, and it is also limited by the lifetime of the valves’ moving parts.

3.3. Development and Results of an Electrolysis Cell for Intermediate Gas Feeding

In order to use the electrolysis cell for intermediate gas feeding, its potential for the utilization in micro process engineering is shown first. For this purpose, both electrolysis cells presented were used, and the gas volume produced by different amperages was measured. Figure 8 shows the volume of gas produced by the two electrolysis cells over time. Similar to Faraday’s law, an increase in gas volume can be observed with higher amperages. The linear characteristics also show that the volumetric flow is constant, and no pulsations can be recognized. This fact makes the electrolysis cell itself very attractive as a gas source in micro process engineering, since, in comparison, common mass flow controllers (MFC) for gases tend to fluctuate, especially in multiphase systems in micro capillaries.
The electrolysis cells were then used to generate a gas–liquid slug flow in a T-junction. The resulting bubble lengths were then compared with the models of Garstecki and Fuerstmann, which allow us to estimate the bubble lengths, depending on the inlet diameters and volumetric flow rates [20]. Figure 9 shows the measured gas-bubble lengths of the two electrolysis cells as a function of the ratio of the volumetric flow rates. The bubble lengths correlate well with the Garstecki and Fuerstmann models. It should be noted that different profiles are due to the inlet diameters of the T-junction, since Cell 1 provides a gas inlet diameter of 0.5 mm, whereas Cell 2 has a diameter of 1 mm.
However, the larger cell, Cell 1 (approximately 23 mL gas volume), showed an inertial behavior during the experiments. After switching on the electricity, the volumetric flow of gas increased over several minutes, to the expected volumetric flow, while after switching off, a gas flow continued to eject from the cell for several minutes. To explain this behavior, the generation of the gas bubbles must be considered in detail. To form a bubble, there must be a slight over-pressure relative to the capillary pressure. Due to the gas volume of 23 mL and the low gas production rates of approximately 1.1 × 10⁻⁵ mol/min, it takes several minutes before this pressure difference is reached in the cell. For verification purposes, the gas volume in the cell was reduced by greater liquid levels. The decrease of the volumetric gas flow after switching off the power supply was measured (Figure 10). The results confirm the assumption that the large gas volume in the cell is the cause of inertia.
The smaller cell, Cell 2 (approximately 0.02 mL gas volume), on the other hand, showed an almost instantaneous behavior, which also confirms the above findings. Since this instantaneous gas generation is very suitable for the controlled feeding of gas bubbles into an existing slug flow, it will be utilized in the following, to analyze the influence of different parameters on the feeding. First, gas bubbles are fed exclusively into a single-phase (water) flow, while the resulting gas-bubble lengths are studied. The influences of the volumetric flow of the continuous phase, as well as the actuation variables (tactive and I), which can be used to control the injected gas volume, are investigated.
  • Variation of the volumetric flow of the continuous phase.
The electrolysis cell was supplied with electricity via a transistor with a controlled rectangular signal to set the active time of the electrolysis tactive. The time between the pulsations, in which no electricity is supplied, is marked as toff and is set 300 ms in this case. Figure 11 shows that bubbles with a length of 2 mm can be fed in a range from 0.25 to 1 mL/min volumetric flow rate of the continuous phase. The length remains constant despite increasing volumetric flow. The low standard deviations indicate that the bubble lengths are generated very precisely and regularly. However, the bubbles become unstable above 1.25 mL/min, whereby the gas volume produced in one pulsation is divided into a larger and a smaller bubble. This is caused by the T-junction and the resulting maximum possible bubble length, due to the inlet diameter and ratio of the volumetric flows (see Garstecki and Fuerstmann) [20]. When selecting the T-junction for gas feed, care must be taken to ensure a sufficiently large inlet diameter for the gas phase to produce regular bubbles, even at high volume flows.
In addition, the experimentally determined bubble length is compared with two theoretical bubble geometries (see Equation (6) flat/hemispherical caps). The actual length is in between these two extrema, as is illustrated in Figure 12. The two extrema show a deviation of about 0.5 mm, whereby the cylinder volume predicts a smaller bubble length, and the variant with additional hemispheres predicts longer bubbles. This shows that, with the Faraday’s Law (Equation (5)), the actual bubble lengths can be predicted with good approximation.
  • Variation of the active time of electrolysis, tactive.
To examine the influence of tactive, a range of 10 to 120 ms was analyzed at intervals of 10 ms. Figure 13 indicates that stable bubble lengths are obtained with values of tactive between 30 and 80 ms. Values below 30 ms show a constant length of about 1.5 mm; however, a reduction in length would be expected. This is due to the fact that a bubble was not released every electrical pulsation, and therefore the gas volume accumulates over several pulsations, until it is released. The maximum bubble length at 80 ms is 3.5 mm, which, as discussed before, can be explained by the limitation due to the bubble generation at the T-junction. At higher amperages, I, and smaller values of tactive, and thus a higher volumetric flow of the gas, larger gas bubbles can be achieved.
  • Variation of the amperage, I.
Figure 14 illustrates the results for the variation of the amperage, I, in a range from 25 to 350 mA. From a value of 100 mA, stable bubble lengths are generated. Below 100 mA, the gas volume per pulsation is too small to produce a bubble with each electrical pulsation. A flattening profile of the bubble length with increasing amperage is noticeable. As from 250 mA, the bubble length no longer follows a linear trend. Probably, the selected amperage cannot be completely reached, due to a too-short tactive, which is caused by the current control unit used here. However, this effect can be minimized with other controllable power sources. By increasing tactive, this effect can also be minimized.
The electrolysis cell thus represents a suitable gas source for micro process engineering, which is characterized by a volumetric flow rate with very small fluctuations. In addition, the desired gas volume can be controlled effectively both by the amperage and the time supplying electricity (tactive). Thus, electrolysis is also suitable for the controlled injection of gas bubbles into an existing multiphase flow in capillaries.

3.4. Intermediate Gas Feeding in an Existing Two-Phase Segmented Slug Flow

In the following, the electrolysis cell (Cell 2) examined in Section 3.3 is used for an injection into an existing slug flow. First, gas bubbles are injected into an existing liquid–liquid slug flow, so that a regular three-phase flow is formed. To evaluate this procedure, the feeding performance (FP) is used, which describes the quotient between the successfully fed and stable gas bubbles and the liquid–liquid slug doublet passing within the same time, and thus the maximum possible number of bubbles to be injected. Two hundred possible feeds are used as a reference.
FP = amount   of   actual   fed   and   stable   gas   bubbles amount   of   maximal   possible   gas   feedings
Furthermore, gas is fed into an existing gas–liquid slug flow, with the aim of filling up the existing gas bubble. The objective is a coalescence of the injected gas with the existing gas bubble. To evaluate this, the coalescence performance (CP) is used, which describes the quotient between the number of injected and fully coalesced bubbles and the number of injections. For this purpose, 100 injections are used as the data basis.
CP = amount   of   coalated   gas   bubble amount   of   gas   feedings
Only the equations presented in Section 3.1 are used to determine the exact time of gas injection (Equation (3)) and to predict the amount of gas produced by using Faraday’s law (Equation (5)). A feedback control is not yet applied here.
  • Intermediate gas feeding in an existing liquid–liquid slug flow.
The intermediate gas feeding into the liquid–liquid flow is first tested with a phase ratio of 1:1, whereby the gas is always injected into the continuous slug. The total volumetric flow, Vtot, is varied with constant lengths of both liquid phases. Subsequently, at a constant volumetric flow, the lengths of the two liquid phases are varied. Finally, longer gas bubbles than the continuous phase are fed into the two-phase flow.
Gas bubbles are fed into a liquid–liquid slug flow with a length of the liquid disperse phase of 6.7 mm and length of the continuous phase of 5.8 mm. The total volume flow is varied in the range of 0.25 to 1 mL/min. In addition, the set-point length of the gas bubble to be introduced is set to 2 mm, using an active time, tactive, of 40 ms, together with a resulting amperage of 208 mA.
During the start-up, it is observed that the electrolysis cell requires a few electrical pulsations (<5) to generate the necessary pressure for bubble formation and to release it in the continuous phase. This effect is neglected when evaluating the feeding performance (FP). Table 1 shows the feeding successes at different volumetric flows.
For a range of 0.25 to 0.75 mL/min, the feeding performance is at least 97.5%. At 1 mL/min, however, the feeding performance is only 82.4%. This difference can be explained by two observed releasing mechanisms during gas injection (see Figure 15). At higher volumetric flows, the gas bubble is often detached by the liquid bubble, and thus the produced gas quantity of one pulsation is often divided into two bubbles. The existing liquid bubble is also separated, and the stability of the slug flow is disrupted.
In these experiments, gas was always injected into the middle of the continuous phase. In order to have a comparable feeding performance at higher volume flows, the gas can either be injected farther in front of the continuous phase, or the injection can be accelerated by lowering the tactive and increasing the amperage, I.
Figure 16 shows the resulting three-phase flow after a successful feeding at a total volume flow of 0.5 mL/min.
This observed effect is referred to as premature bubble detachment (PBD). Such bubble detachment occurs when the ejection time of the generated bubble is greater than the time for the bubble to be detached in the continuous phase. This detachment time is influenced, on the one hand, by the flow velocity and, on the other hand, by the length of the continuous phase. In contrast to 0.5 and 0.75 mL/min, at 1 mL/min, it is important into which part of the continuous phase the bubble is injected, due to PBD. The time delay, tdelay, could be varied so that the gas bubble is released in the front of the continuous phase. Another approach is to reduce tactive to lower the releasing time. Simultaneously, the amperage should be increased to ensure the same bubble lengths.
At 0.25 mL/min, it is also observed that the gas bubble is detached from the following water bubble. However, no PBD occurs. In this case, the pressure force exerted by the continuous phase is not high enough to release the bubble, due to its low velocity. Therefore, the gas bubble remains at the exit of the T-junction, until the next water bubble constricts and detaches it. The release time is thus shorter than the break-off time. Anyhow, this has no influence to the flow pattern or feeding performance.
A manual variation of tdelay can also be used to analyze the effect if the gas is regularly fed into the center of the liquid bubble. It was observed that a regular three-phase flow is nonetheless formed. The front part of the divided water bubble is faster than the gas bubble, due to a smaller wall film, and catches up with the preceding water bubble, so that both bubbles coalesce to one bubble as large as the previously non-divided bubble (see Figure 17).
From these observations, it can be concluded that, despite the imprecise selection of tdelay, the slug flow is disturbed only locally for a short period of time and that, subsequently, good hydrodynamics can still be achieved. However, this effect can only be observed for a small tactive.
The bubble and slug lengths of the existing liquid–liquid slug flow were also reduced, which also decreases the time for being able to inject gas in the continuous phase.
From Table 2, it can be concluded that intermediate gas feeding is applicable even to the smallest examined length of the continuous slug of 2.2 mm. However, the feeding performance is about 20% lower at these lengths. At these lengths, the effect of PBD is more significant, since the detachment time is shortened due to the reduced phase lengths.
This observation, together with the results at different volumetric flows, indicates that the residence time of the continuous phase at the location of the injection is limiting the feeding. This residence time depends on both the flow velocity and the length of the continuous phase.
Since the intermediate gas feeding is intended to counteract the low gas availability in the reactor, it is reasonable to introduce as much gas as possible. Therefore, large gas bubbles were fed into a liquid–liquid slug flow with small phase lengths. The liquid bubbles had a length of 2.9 mm, and the length of the continuous slug was 2.7 mm. Gas bubbles of 5 and 7 mm in length were fed into this flow.
From Table 3, it can be deduced that an injection of a gas bubble, which is 2.5 times longer than the continuous slug, generates a regular three-phase flow in approximately 90% of cases. In contrast, the shorter 5 mm long gas bubble shows only a 2.5% improvement. The short continuous slugs together with the large active electrolysis time, tactive, can explain the deviation of 10% from the maximum feeding performance. The resulting large amount of gas, which is fed into the capillary in a short time, causes a pulsation of the flow. Increasing the amperage, I, and shortening tactive intensifies this effect. The influence of the pulsation still needs to be investigated. In the case of long capillary lengths (several meters), however, the pulsation is allayed by the compression of the preceding gas bubbles. Pulsation makes it difficult to measure the velocity immediately after feeding, though, since it changes in time synchronously with the feeding frequency.
Figure 18 shows the resulting three-phase flow after the injection of 7 mm gas bubbles.
  • Intermediate gas feeding into an existing gas–liquid slug flow.
Refilling a gas bubble with new reactive gas can also be an attractive option, as, in this case, it is not necessary to await the complete reaction of the existing droplet. Refilling may also be necessary if parts of the gas bubble contain inert components, and therefore the entire gas bubble cannot disappear. Therefore, gas was injected into an existing gas–liquid slug flow, and it was observed whether the existing gas bubble and the injected gas would merge.
Two influencing factors were examined: the influence of the total volumetric flow of the incoming two-phase flow and the location of the feeding. In principle, several locations are possible for the injection; the options illustrated in Figure 19 were examined.
The main advantage of feeding at the position of the gas bubble is that the two gas phases are enforced to make contact and thus coalescence is more probable. A distinction is made between feeding at the front cap and the middle of the gas bubble. If injection into the continuous phase is sufficient to unite both bubbles, this option is the simplest, since this case requires less precision in the calculation of tdelay. In order to feed at the different locations, the calculated tdelay was adjusted accordingly.
Table 4 presents the coalescence performances for the three different alternatives, using two different total volumetric flows. The injection into the continuous phase shows no coalescence. The produced bubbles moved with the same velocity in the capillary as the original bubbles. It is therefore not sufficient to feed the gas into the continuous phase, if the gas bubble is to be refilled. Feeding directly into the gas phase has partly led to coalescence. At lower volumetric flows (0.5 mL/min), the coalescence performance is 60–70%. At higher total volume flows (1 mL/min), the coalescence success is less than 10%. Qualitatively, coalescence is favored when filling the gas bubbles at a lower volumetric flow rate. Conversely, this implies that the increased forces in the capillary resulting from a higher volumetric flow are less favorable for coalescence. Furthermore, feeding into the cap is identified as a slightly more suitable option. Since coalescence depends on many factors, such as the interfacial tension, the viscosity of the continuous phase and the geometry of the phase interfaces, the filling of the gas bubble must be evaluated separately for each system.

3.5. Feedback Control for the Fed Gas Droplet Length

In principle, it was already demonstrated that the implementation of theoretical equations to control the timing of the injection and the amount of gas released leads to sufficient results of intermediate gas feeding. Nevertheless, a feedback control can be applied, to further optimize the feeding.
With a detection of the slug flow according to the location of the injection, the target values tdelay and ΔLgas can be adjusted by a closed-loop control. Only the case of the newly injected gas bubbles in a liquid–liquid flow is examined.
Figure 20 shows several undesired cases that might occur during intermediate gas feeding. Cases (1) and (2) represent an incorrect injection time and thus a faulty tdealy. Cases (3) and (4) represent a deviation from the target value ΔLgas.
The liquid and gaseous bubbles form wall films of different thicknesses, due to different physical properties. Therefore, bubbles with a larger wall film are faster and catch up with the slower bubble of the other phase. Due to this effect, no adjustment of tdelay is required in Case (1). However, if the bubble detaches prematurely, tdelay can be lowered, to inject the gas bubble at the front of the continuous phase. In Case (2), the existing liquid bubble is destroyed by a delayed injection. As shown in Section 3.3, this does not necessarily have to be disadvantageous, as the divided liquid bubbles can unite to one single bubble. In this case, however, PBD is more likely than injection into the continuous phase. In this case, tdelay must be lowered, so that the gas is fed into the continuous phase.
Cases (3) and (4) describe either a too short or a too long injected gas bubble. The control of the setpoint ΔLgas can be performed by the two actuating variables tactive and I. Basically, reasonable initial values of both control variables should be carried out using the Faraday law suitable for ΔLgas. In particular, tactive is the limiting variable, since the time of feeding depends on the duration of the continuous slug passing. A good reference for tactive corresponds to about 30–80% of the residence time of the continuous phase at the location of the feeding. Based on tactive determined in this way, a starting value for amperage I can be calculated using the Faraday law (see Equation (5)). For active control, it is recommended to use the actuating variable of amperage I, since this can usually be set more precisely. However, if the flow is pulsating strongly due to large amperages, it is also advisable to increase tactive. To realize this, it is useful to define limits for the ratio between tactive and the amperage depending on the capillary pressure. However, tactive is limited by the residence time of the continuous phase.
To demonstrate bubble-length regulation, a P-controller was used to control amperage. Figure 21 depicts the time-dependent progression of the injected droplet length after feeding. After approximately 20 gas bubbles, a maximum error of 2% is reached.

4. Discussion

It was demonstrated that intermediate gas feeding into multiphase slug flows can be implemented successfully. Feeding with a solenoid valve proved to be too inaccurate, as the necessary requirements for feeding frequency and opening times can only be met with restrictions. The electrolysis cell, on the one hand, appeared to be suitable as a constant gas source for micro process engineering. On the other hand, by controlling the power source and thus the corresponding gas volume, the electrolysis cell could be used for intermediate gas feeding. The Faraday Law can be used to predict the released gas volume.
Feeding into an existing two-phase liquid–liquid flow could be carried out with up to 99% success. In comparison, the strategy of refilling existing gas bubbles is less successful, because the gas bubbles rarely coalesce. Based on these results, it is preferable to await a gas-consuming reaction until the gas bubble has reacted completely and then introduce a new gas bubble.
The use of a control system based on the presented equations is sufficient for many applications with the measured feeding performances. Nevertheless, individual actuating variables can be regulated by detecting the slug flow after the feeding. In some cases, this may be relevant for the length of the injected gas bubbles, since only a range of the length can be predicted.
For the application of the intermediate gas feeding via electrolysis, together with a reaction system, the electrolysis cell must be further developed. In the case of water electrolysis, the reaction gases, hydrogen and oxygen, can be separated by using a membrane [21]. Both gases are relevant for many gas–liquid reaction systems (i.e., hydrogenations, oxidations). In principle, other reaction gases, such as halogens and carbon monoxide, are also conceivable [22,23]. In addition, a continuous supply of the liquid reactant for electrolysis (in this case water) must be provided, so that continuous operation is possible. However, the free gas volume in the electrolysis cell should still be kept as small as possible, to prevent compression effects and thus slower reaction times of the intermediate gas feeding.

Author Contributions

N.v.V., conceptualization, methodology, investigation, writing—original draft preparation and visualization. D.H., methodology, investigation and writing—review and editing. J.P., methodology, investigation and writing—review and editing. D.W.A., supervision and writing—review and editing. All authors have read and agreed to the published version of the manuscript.

Funding

This research received no external funding.

Conflicts of Interest

The authors declare that there are no conflict of interest.

References

  1. Hessel, V.; Angeli, P.; Gavriilidis, A.; Löwe, H. Gas-Liquid and Gas-Liquid-Solid Microstructured Reactors: Contacting Principles and Applications. Ind. Eng. Chem. Res. 2005, 44, 9750–9769. [Google Scholar] [CrossRef]
  2. Sobieszuk, P.; Aubin, J.; Pohorecki, R. Hydrodynamics and Mass Transfer in Gas-Liquid Flows in Microreactors. Chem. Eng. Technol. 2012, 35, 1346–1358. [Google Scholar] [CrossRef]
  3. Burns, J.R.; Ramshaw, C. The intensification of rapid reactions in multiphase systems using slug flow in capillaries. Lab Chip 2001, 1, 10–15. [Google Scholar] [CrossRef] [PubMed]
  4. Dummann, G.; Quittmann, U.; Gröschel, L.; Agar, D.W.; Wörz, O.; Morgenschweis, K. The capillary-microreactor: A new reactor concept for the intensification of heat and mass transfer in liquid–liquid reactions. Catal. Today 2003, 79, 433–439. [Google Scholar] [CrossRef]
  5. Kashid, M.N.; Gerlach, I.; Goetz, S.; Franzke, J.; Acker, J.F.; Platte, F.; Agar, A.D.W.; Turek, S. Internal Circulation within the Liquid Slugs of a Liquid−Liquid Slug-Flow Capillary Microreactor. Ind. Eng. Chem. Res. 2005, 44, 5003–5010. [Google Scholar] [CrossRef]
  6. Önal, Y. Reaktionstechnische Aspekte der Wässrigen Mehrphasenkatalyse; TU Darmstadt: Darmstadt, Germany, 2005. [Google Scholar]
  7. Kiwi-Minsker, L.; Renken, A. Microstructured reactors for catalytic reactions. Catal. Today 2005, 110, 2–14. [Google Scholar] [CrossRef] [Green Version]
  8. Nijhuis, T.X.A.; Kreutzer, M.; Romijn, A.; Kapteijn, F.; Moulijn, J. Monolithic catalysts as efficient three-phase reactors. Chem. Eng. Sci. 2001, 56, 823–829. [Google Scholar] [CrossRef]
  9. Kreutzer, M.T.; Du, P.; Heiszwolf, J.J.; Kapteijn, F.; Moulijn, J.A. Mass transfer characteristics of three-phase monolith reactors. Chem. Eng. Sci. 2001, 56, 6015–6023. [Google Scholar] [CrossRef]
  10. Ufer, A.; Mendorf, M.; Ghaini, A.; Agar, D.W. Liquid/Liquid Slug Flow Capillary Microreactor. Chem. Eng. Technol. 2011, 34, 353–360. [Google Scholar] [CrossRef]
  11. Guo, W.; Heeres, H.J.; Heeres, H.J. Continuous synthesis of 5-hydroxymethylfurfural from glucose using a combination of AlCl3 and HCl as catalyst in a biphasic slug flow capillary microreactor. Chem. Eng. J. 2020, 381, 122754. [Google Scholar] [CrossRef]
  12. Hellmann, D.; De Oliveira-Goncalves, Í.; Agar, D.W. Coaxial Flow Contactors as Alternative to Double T-Contactors for Triphasic Slug Flow Generation. Chem. Ing. Tech. 2020, 92, 532–539. [Google Scholar] [CrossRef] [Green Version]
  13. Arsenjuk, L.; Asshoff, M.; Kleinheider, J.; Agar, D.W. A device for continuous and flexible adjustment of liquid-liquid slug size in micro-channels. J. Flow Chem. 2020, 10, 409–422. [Google Scholar] [CrossRef]
  14. Klose, F. Operation modes of packed-bed membrane reactors in the catalytic oxidation of hydrocarbons. Appl. Catal. A Gen. 2004, 257, 193–199. [Google Scholar] [CrossRef]
  15. Önal, Y.; Lucas, M.; Claus, P. Application of a Capillary Microreactor for Selective Hydrogenation of α,β-Unsaturated Aldehydes in Aqueous Multiphase Catalysis. Chem. Eng. Technol. 2005, 28, 972–978. [Google Scholar] [CrossRef]
  16. Cussler, E.L. Permeability Properties of Plastics and Elastomers. J. Control Release 2003, 92, 399. [Google Scholar] [CrossRef]
  17. Von Vietinghoff, N.; Lungrin, W.; Schulzke, R.; Tilly, J.; Agar, D.W. Photoelectric Sensor for Fast and Low-Priced Determination of Bi- and Triphasic Segmented Slug Flow Parameters. Sensors 2020, 20, 6948. [Google Scholar] [CrossRef]
  18. Aussillous, P.; Quéré, D. Quick deposition of a fluid on the wall of a tube. Phys. Fluids 2000, 12, 2367. [Google Scholar] [CrossRef]
  19. Han, Y.; Shikazono, N. Measurement of the liquid film thickness in micro tube slug flow. Int. J. Heat Fluid Flow 2009, 30, 842–853. [Google Scholar] [CrossRef]
  20. Garstecki, P.; Fuerstman, M.J.; Stone, H.A.; Whitesides, G.M. Formation of droplets and bubbles in a microfluidic T-junction—Scaling and mechanism of break-up. Lab Chip 2006, 6, 437–446. [Google Scholar] [CrossRef]
  21. Grigoriev, S.; Porembsky, V.; Fateev, V. Pure hydrogen production by PEM electrolysis for hydrogen energy. Int. J. Hydrog. Energy 2006, 31, 171–175. [Google Scholar] [CrossRef]
  22. Dipu, A.L.; Ujisawa, Y.; Ryu, J.; Kato, Y. Electrolysis of carbon dioxide for carbon monoxide production in a tubular solid oxide electrolysis cell. Ann. Nucl. Energy 2015, 81, 257–262. [Google Scholar] [CrossRef]
  23. Pardal, T.; Messias, S.; Sousa, M.; Machado, A.S.R.; Rangel, C.M.; Nunes, D.; Pinto, J.V.; Martins, R.; Da Ponte, M.N. Syngas production by electrochemical CO2 reduction in an ionic liquid based-electrolyte. J. CO2 Util. 2017, 18, 62–72. [Google Scholar] [CrossRef]
Figure 1. Biphasic slug flow with a continuous slug and a dispersed bubble, which can be either gas or liquid. Internal circulations in each phase indicated.
Symmetry 12 02092 g001
Figure 2. Schematic illustration of an intermediate gas feeding into an existing liquid/liquid two-phase segmented slug flow. (1) Observation and characterization of segmented slug flow before injection, (2) gas injection, (3) control unit and (4) observation and characterization of segmented slug flow after injection.
Symmetry 12 02092 g002
Figure 3. Left: Schematic setup of the intermediate gas feeding with a solenoid valve and control communication between the transmissive sensor before the gas injection and solenoid valve. Right: Experimental setup of T-junction with included solenoid valve.
Symmetry 12 02092 g003
Figure 4. Schematic illustration and photographs of the electrolysis cells. Top: Cell 1 with a large free gas volume and the option of using a membrane that is able to separate oxygen and hydrogen. Bottom: Cell 2 with very small free gas volume. This cell does not use a membrane and therefore produces a mixture on hydrogen and oxygen, which is introduced in the capillary with an internal T-junction.
Symmetry 12 02092 g004
Figure 5. Schematic setup of the intermediate gas feeding via an electrolysis cell and control communication between the transmissive sensor before the gas injection and the electrolysis cell.
Symmetry 12 02092 g005
Figure 6. Illustration of the necessary steps to determine the operating parameters required for the control variables and the feeding after time delay (tdelay). (1) Starting measuring slug velocity, vslug, and unit cell length, Lunit. (2) Calculation of new distance to location of gas feeding. (3) Gas injection to unit cell.
Symmetry 12 02092 g006
Figure 7. Gas feeding into a single-phase (water) flow via a solenoid valve, under variation of the pressure difference. Feeding-frequency: 1 Hz.
Symmetry 12 02092 g007
Figure 8. Gas volumes produced by electrolysis as a function of time with different amperages. Left: Cell 1. Right: Cell 2.
Symmetry 12 02092 g008
Figure 9. Use of the electrolysis cells as gas source to generate a slug flow in a T-junction and comparison of the experimentally determined bubble lengths with theoretical values of the model of Garstecki and Fuerstmann [20].
Symmetry 12 02092 g009
Figure 10. Measured volumetric gas flows after switching off the power supply for different free gas volumes in electrolysis Cell 1, with an initial phase ratio of 1 and a total volumetric flow of 2 mL/min in the capillary.
Symmetry 12 02092 g010
Figure 11. Dependence of bubble length with varying volumetric flow of the continuous phase. For volumetric flows from 0.25 to 2 mL/min, at tactive = 40 ms, toff = 300 ms and I = 150 mA.
Symmetry 12 02092 g011
Figure 12. Comparison of the approximation methods with an actual bubble. Length of the actual bubble: 3.5 mm. Red: approximation with cylindrical volume and flat caps. Green: approximation of the bubble caps with perfect hemispheres.
Symmetry 12 02092 g012
Figure 13. Dependence of the bubble length with variation of the tactive. For a period of gas production from 10 to 120 ms; tactive = 40 ms; Vcont = 0.5 mL/min; I = 150 mA.
Symmetry 12 02092 g013
Figure 14. Dependence of the bubble length with varying amperages. For amperages from 25 to 350 mA; tactive = 40 ms; Vcont = 0.5 mL/min.
Symmetry 12 02092 g014
Figure 15. Two release mechanisms for the gas injection. Left: release in the continuous phase. Right: the fed gas bubble is attached at the T-junction outlet, until the dispersed liquid bubble entrains it.
Symmetry 12 02092 g015
Figure 16. Resulting three-phase flow after successful intermediate gas feeding. Vtot = 0.5 mL/min. Length of the liquid bubble: 3.1 mm. Length of the continuous slug: 3.5 mm. Length of the injected gas bubbles: 2 mm.
Symmetry 12 02092 g016
Figure 17. Schematic illustration of intermediate gas feeding into the water bubble with subsequent coalescence of the divided water bubbles.
Symmetry 12 02092 g017
Figure 18. Three-phase slug flow after intermediate gas feeding with long gas bubbles (7 mm). Length of liquid bubble: 2.9 mm. Length of continuous slug: 2.7 mm. Vtot = 0.5 mL/min.
Symmetry 12 02092 g018
Figure 19. Three possible locations for injecting gas bubbles with the aim of refilling them. Left: Injection in the middle of the continuous phase. Middle: Injection in the middle of the gas phase. Right: Injection in the front cap of the gas phase.
Symmetry 12 02092 g019
Figure 20. Four cases in which a control of the manipulated variables for intermediate gas feeding is beneficial. (1) The gas injection was performed too late. (2) The injection was performed too early. (3) The injected gas bubble is too small. (4) The injected gas bubble is too large.
Symmetry 12 02092 g020
Figure 21. Time course of the controlled gas-bubble length injected with a P-controller. The amperage was controlled, and one measuring point corresponds to one gas bubble. Proportional gain for P-controller: KP = 0.75, and tactive = 80 ms.
Symmetry 12 02092 g021
Table 1. Feeding performance of gas bubbles into an existing two-phase liquid–liquid slug flow at different total volumetric flows. Length of the liquid bubble = 6.7 mm, length of the continuous slug = 5.8 mm, length of the injected gas bubbles = 2 mm, tactive = 40 ms and I = 208 mA.
Volumetric Flow/mL/minAmount of Successful Feeding/-Amount of Resulting Stable Triphasic Flow/- Feeding Performance (FP/%)
0.2520019597.5
0.520019899
0.7520019798.5
120016482.4
Table 2. Injection of gas bubbles into an existing two-phase liquid–liquid slug flow at different total volume flows. Vtot = 0.5 mL/min, length of the injected gas bubble 2 mm; tactive = 40 ms; I = 208 mA.
Length of Water Bubble/mmLength of Continuous Slug/mmFeeding Performance (FP/%)
4.54.199
3.53.197
3.12.281
Table 3. Injection of gas bubbles into an existing two-phase liquid–liquid slug flow. Length of the liquid bubble: 2.9 mm. Length of the continuous slug: 2.7 mm. Vtot = 0.5 mL/min.
Length of Injected Gas Bubble/mmI/mAtactive/msFeeding Performance FP/%
52608090.5
73508088
Table 4. Coalescence performance of the intermediate gas feeding into the continuous phase, into the middle and into the front cap of the gas phase. For a gas-liquid slug flow with a gas phase length of 7.3 mm and a continuous phase length of 6 mm. Gas injections: 100. ΔLgas = 2 mm; tactive = 40 ms; and I = 208 mA.
Volumetric Flow Vtot/mL/minInjection in Continuous Slug CP/%Injection in the Middle of Gas Bubble CP/%Injection in the Front of Gas Bubble
0.506070
1098
Publisher’s Note: MDPI stays neutral with regard to jurisdictional claims in published maps and institutional affiliations.

