Article

A Superellipse with Deformation and Its Application in Describing the Cross-Sectional Shapes of a Square Bamboo

1
Bamboo Research Institute, College of Biology and the Environment, Nanjing Forestry University, Nanjing 210037, China
2
Plant Biology Section, School of Integrative Plant Science, Cornell University, Ithaca, NY 14853, USA
3
Department of Biosciences Engineering, University of Antwerp, B-2020 Antwerp, Belgium
*
Authors to whom correspondence should be addressed.
Symmetry 2020, 12(12), 2073; https://doi.org/10.3390/sym12122073
Submission received: 23 November 2020 / Revised: 7 December 2020 / Accepted: 9 December 2020 / Published: 14 December 2020
(This article belongs to the Section Life Sciences)

Abstract

:
Many cross-sectional shapes of plants have been found to approximate a superellipse rather than an ellipse. Square bamboos, belonging to the genus Chimonobambusa (Poaceae), are a group of plants with round-edged square-like culm cross sections. The initial application of superellipses to model these culm cross sections has focused on Chimonobambusa quadrangularis (Franceschi) Makino. However, there is a need for large scale empirical data to confirm this hypothesis. In this study, approximately 750 cross sections from 30 culms of C. utilis were scanned to obtain cross-sectional boundary coordinates. A superellipse exhibits a centrosymmetry, but in nature the cross sections of culms usually deviate from a standard circle, ellipse, or superellipse because of the influences of the environment and terrain, resulting in different bending and torsion forces during growth. Thus, more natural cross-sectional shapes appear to have the form of a deformed superellipse. The superellipse equation with a deformation parameter (SEDP) was used to fit boundary data. We find that the cross-sectional shapes (including outer and inner rings) of C. utilis can be well described by SEDP. The adjusted root-mean-square error of SEDP is smaller than that of the superellipse equation without a deformation parameter. A major finding is that the cross-sectional shapes can be divided into two types of superellipse curves: hyperellipses and hypoellipses, even for cross sections from the same culm. There are two proportional relationships between ring area and the product of ring length and width for both the outer and inner rings. The proportionality coefficients are significantly different, as a consequence of the two different superellipse types (i.e., hyperellipses and hypoellipses). The difference in the proportionality coefficients between hyperellipses and hypoellipses for outer rings is greater than that for inner rings. This work informs our understanding and quantifying of the longitudinal deformation of plant stems for future studies to assess the influences of the environment on stem development. This work is also informative for understanding the deviation of natural shapes from a strict rotational symmetry.

1. Introduction

The superellipse equation is a generalized form of the equation of an ellipse. It can generate the shapes of diamonds, ellipses, rectangles, and their transition shapes. The first systematic study of these curves was done by Gabriel Lamé to describe crystal shapes [1]. The superellipse is defined analytically by the formula
| x / α | n + | y / β | n = 1 ,
where x and y are the Cartesian coordinates; α and β are semidiameters of the superellipse; and n is an arbitrary positive number. For n = 1, the superellipse equation produces a diamond (or an inscribed square when α = β). For n = 2, the equation gives an ellipse (or a circle when α = β). For n < 2, the shapes are called hypoellipses, and, when n > 2, hyperellipses result [2,3] (see Figure 1 for details).
A wide variety of naturally occurring shapes can be approximated by the superellipse equation [2], including tree rings [4]. However, the original botanical application of the superellipse equation was to model the culm cross sections of the “square culm” bamboo Chimonobambusa quadrangularis (Franceschi) Makino [5]. Bamboos (Bambusoideae: Poaceae) are a group of important plants in subtropical and tropical forests, which are significant ecologically and economically [6]. Like most grasses, their culms are cylindrical in cross sections, except for square bamboos of the genus Chimonobambusa. Although C. quadrangularis is the best-known square bamboo, there are many other species of Chimonobambusa with square culm cross sections. In the monograph on Chimonobambusa [7], 33 species were described, divided into three sections. Half of the species (17) are included in the Section Oreocalamus, and most of these have bamboo culms with square cross sections at the base or from the base up to central parts of the culms. The Flora of China (Volume 22, Poaceae) lists 34 species in China based on the study of Wen [7], with some new species and one renaming (C. linearifolia is now designated as C. angustifolia) [8]. Species of Chimonobambusa Sect. Oreocalamus are found between 1000 and 2000 m of altitude with average rainfall of 1000 to 1400 mm and average temperatures of 8–16 °C with extreme low temperatures of −14 °C. The name chimono derives from the Greek word for winter. Indeed, the shoots of these species develop in autumn, typically from September to December, in contrast to all other temperate bamboos with new shoots sprouting in spring to full height and with lignification throughout the season. Further, the elongation of square bamboos can arrest due to the cold and start again in spring to attain their full height. Hence, the square shape of culms may provide an effective resistance against bending, torsion, and buckling in the absence of lignification.
In this study, we use C. utilis (Keng) Keng, a medium to large bamboo with culms 5–10 m tall and 3–4 cm in diameter. This species has quadrangular cross sections in the lower and middle parts of culms, and terete cylindrical cross sections in the upper part of culms. This species is distributed over a wide area in Sichuan, Guizhou and Yunnan provinces in China at altitudes of 1400 to 2600 m [7]. Its bamboo shoots appear in September.
The cross sections of the culms of C. utilis manifest a large variation in shape and deviate from the classic superellipse (Figure 2). No relevant studies of its shape and variation have been carried out previously. It is important to examine whether the cross sections of culms conform to the superellipse equation, which would be helpful to describe the cross-sectional shapes of other square bamboos. In addition, some cross sections apparently exhibit a degree of deformation because of the influences of the environment and terrain. Thus, it is necessary to consider such deformation in simulating their shapes. In the present study, we introduced a deformation parameter w in Equation (1) and used the images of ca. 750 cross sections of C. utilis to test whether this equation can fit the square bamboo culm data well.

2. Materials and Methods

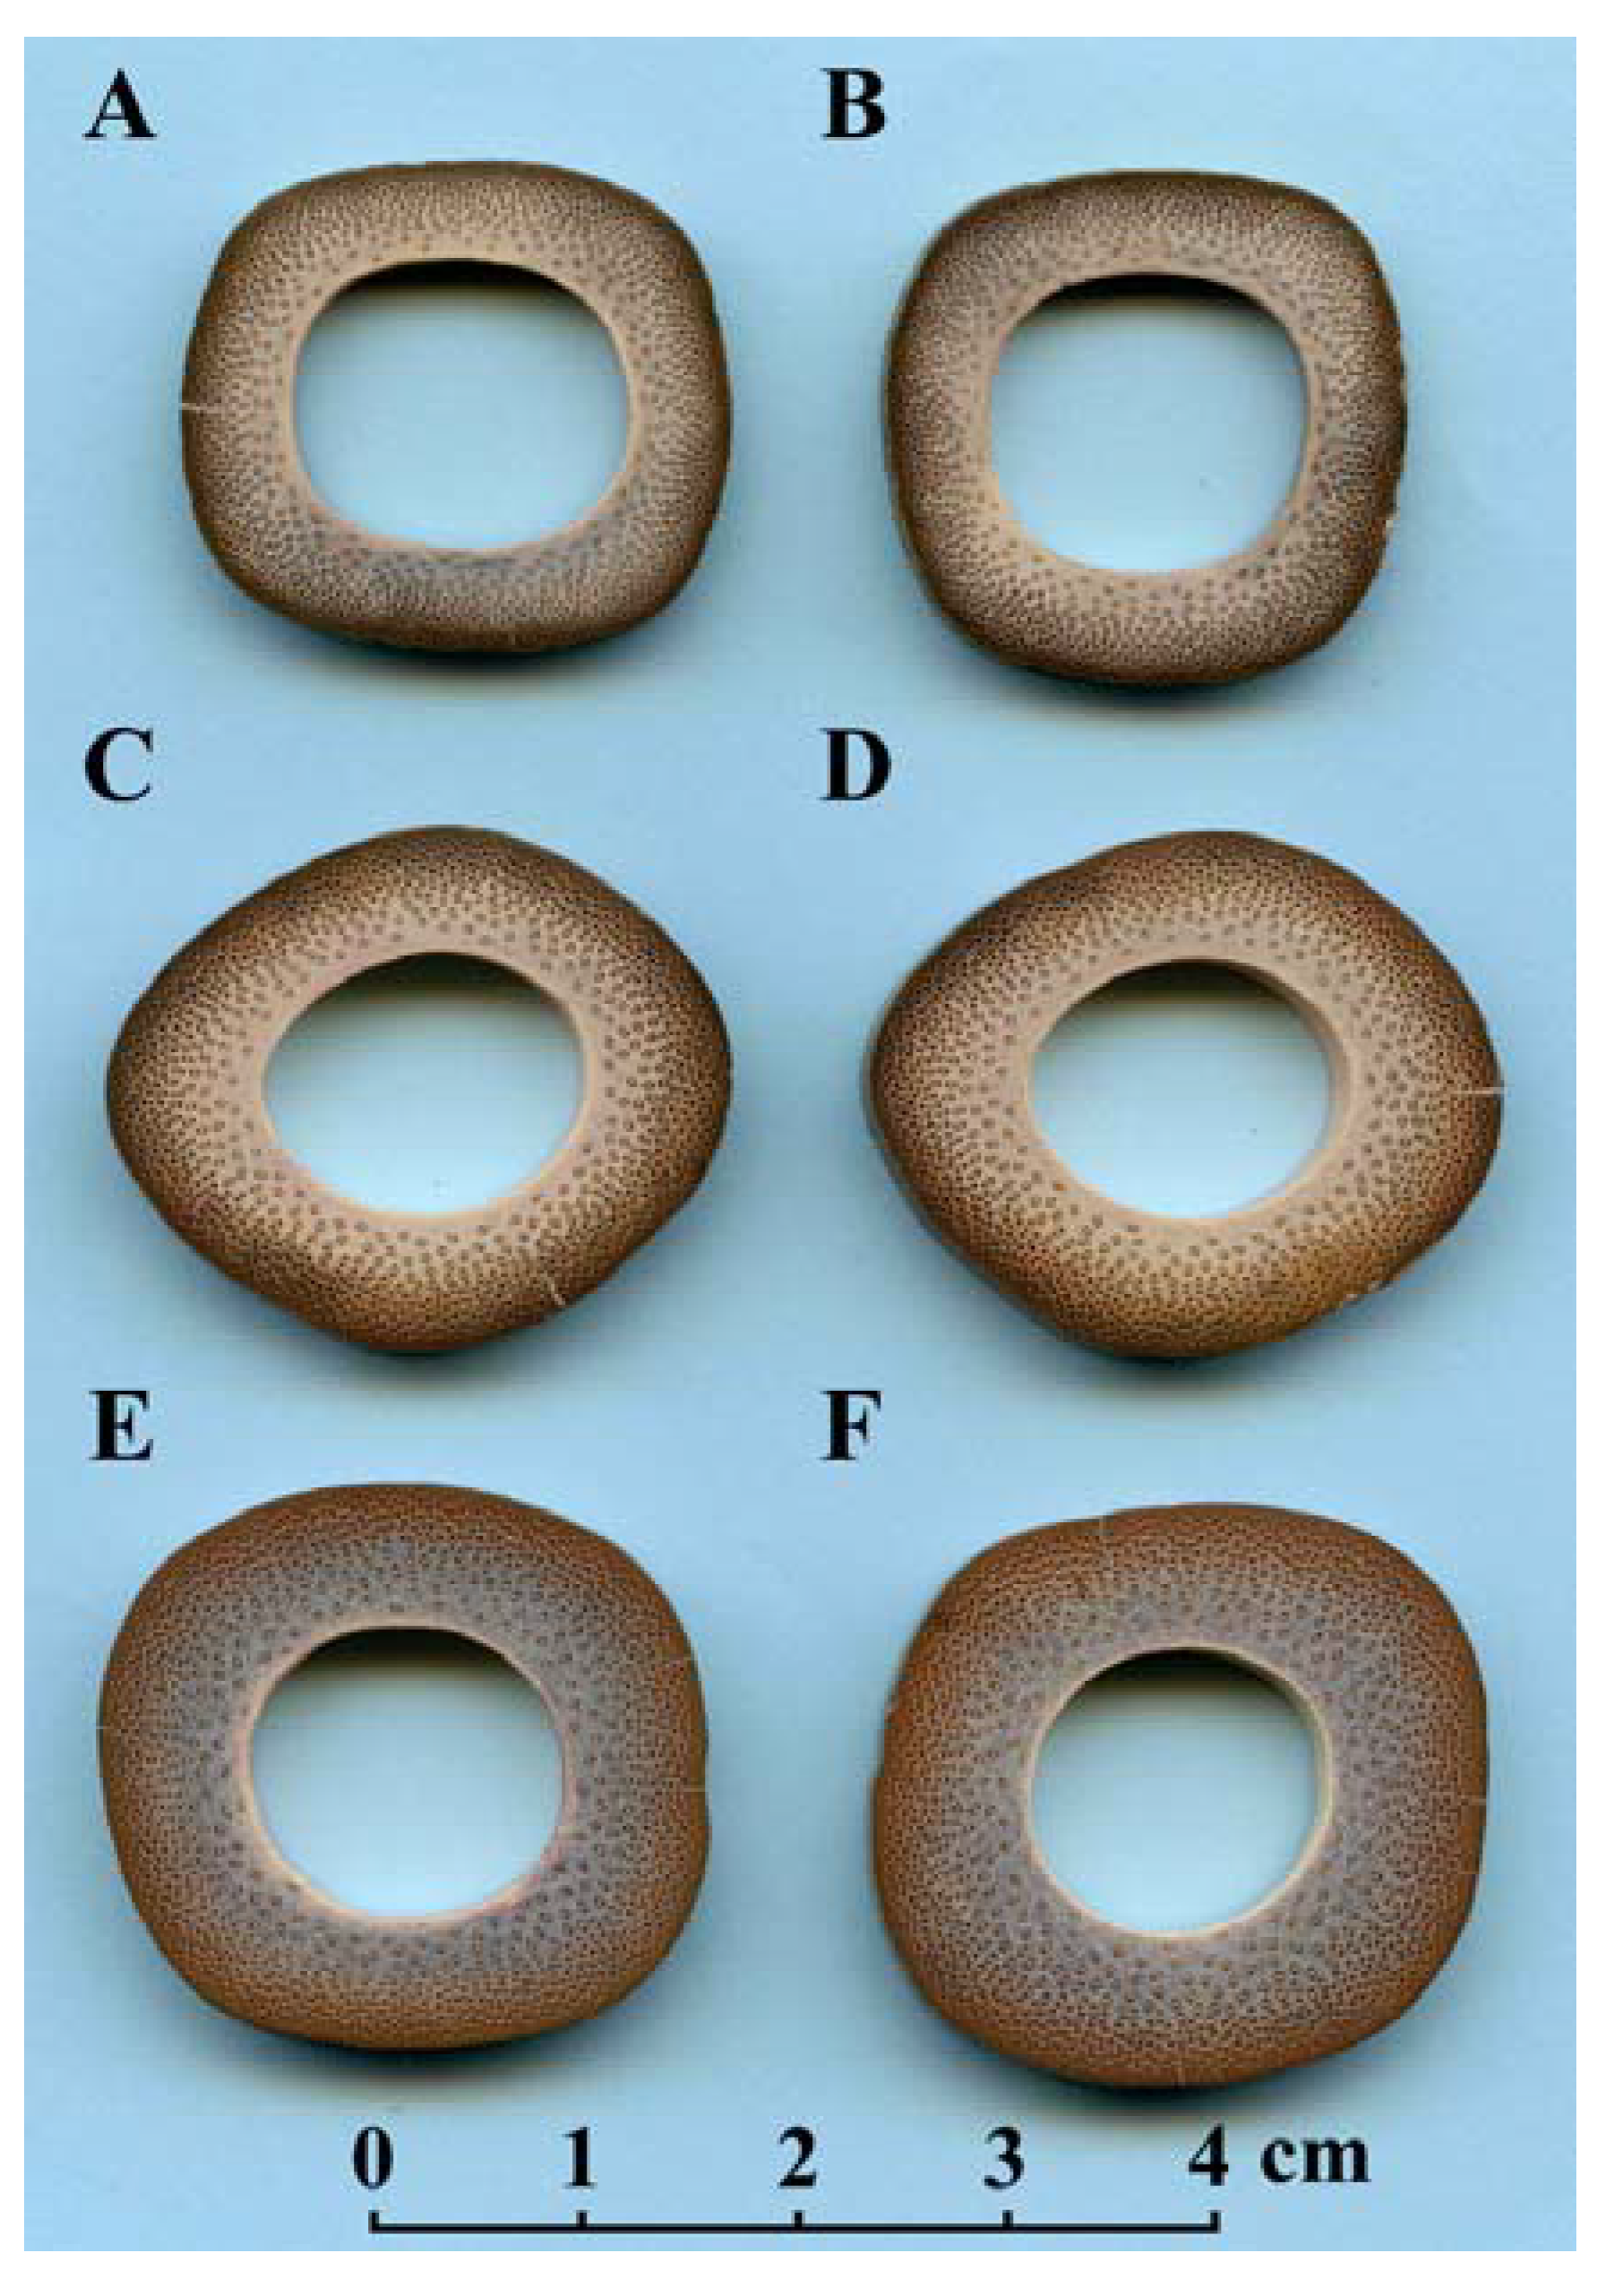
2.1. Cross-Section Sampling and Preparation

Thirty bamboo culms of C. utilis from the first to the 25th aboveground internode were sampled from a pure and artificial stand of C. utilis in Tongzi County, Guizhou Province of China (106.75 °E, 28.30 °N; 1612 m above sea level) on 20th September 2020. One cross section was removed from the middle of each internode. A Jingsida angle grinder (type: 100#—1; load peak: 1600 W; Wuyizuohang Industry & Trade Co., Ltd, Jinhua City, Zhejiang Province, China) with a 100 grit grinding wheel was used to coarsely smooth both surfaces of each cross section. Subsequent grinding with 400 grit, 2500 grit, and 5000 grit sandpaper (280 × 230 mm) in sequence was used to polish the surfaces of each section. The mean thickness of the sections was 0.92 cm (±0.17 cm standard error).

2.2. Image Processing and Boundary Data Acquisition

All cross sections were scanned at 2000 dpi using an Epson scanner (V550, Epson Indonesia, Batam, Indonesia). The outer and inner rings of the cross sections were saved as black-white bitmap images separately using Photoshop (CS2, Adobe, San Jose, CA, USA). There were, in total, 1436 rings (=30 stalks × 25 cross sections/stalk × 2 rings/cross section − 64 rings damaged during cutting). The boundary coordinate data of the rings were extracted using the Matlab procedure developed by Shi et al. [9].

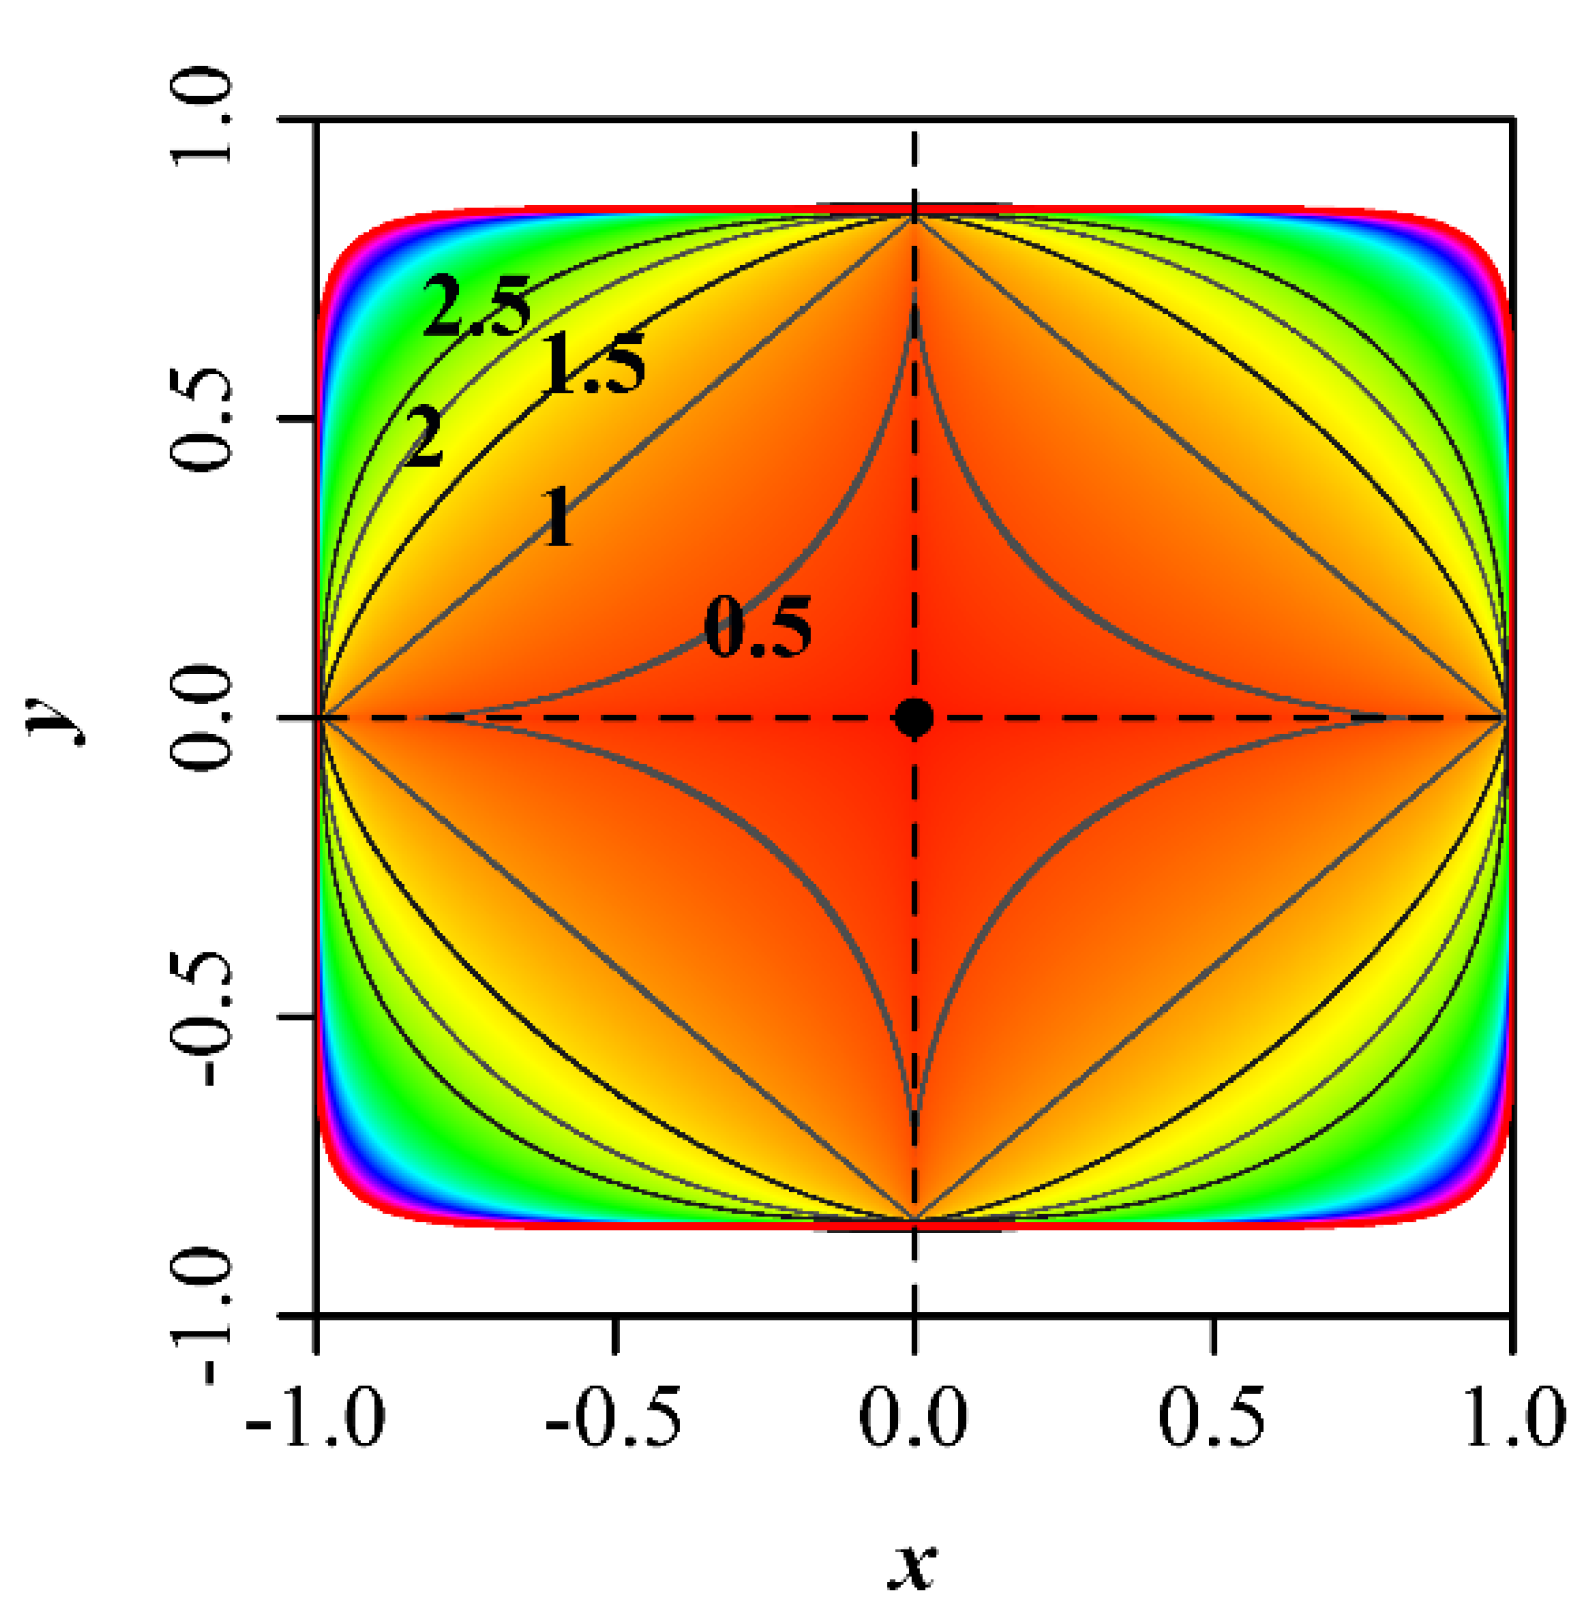
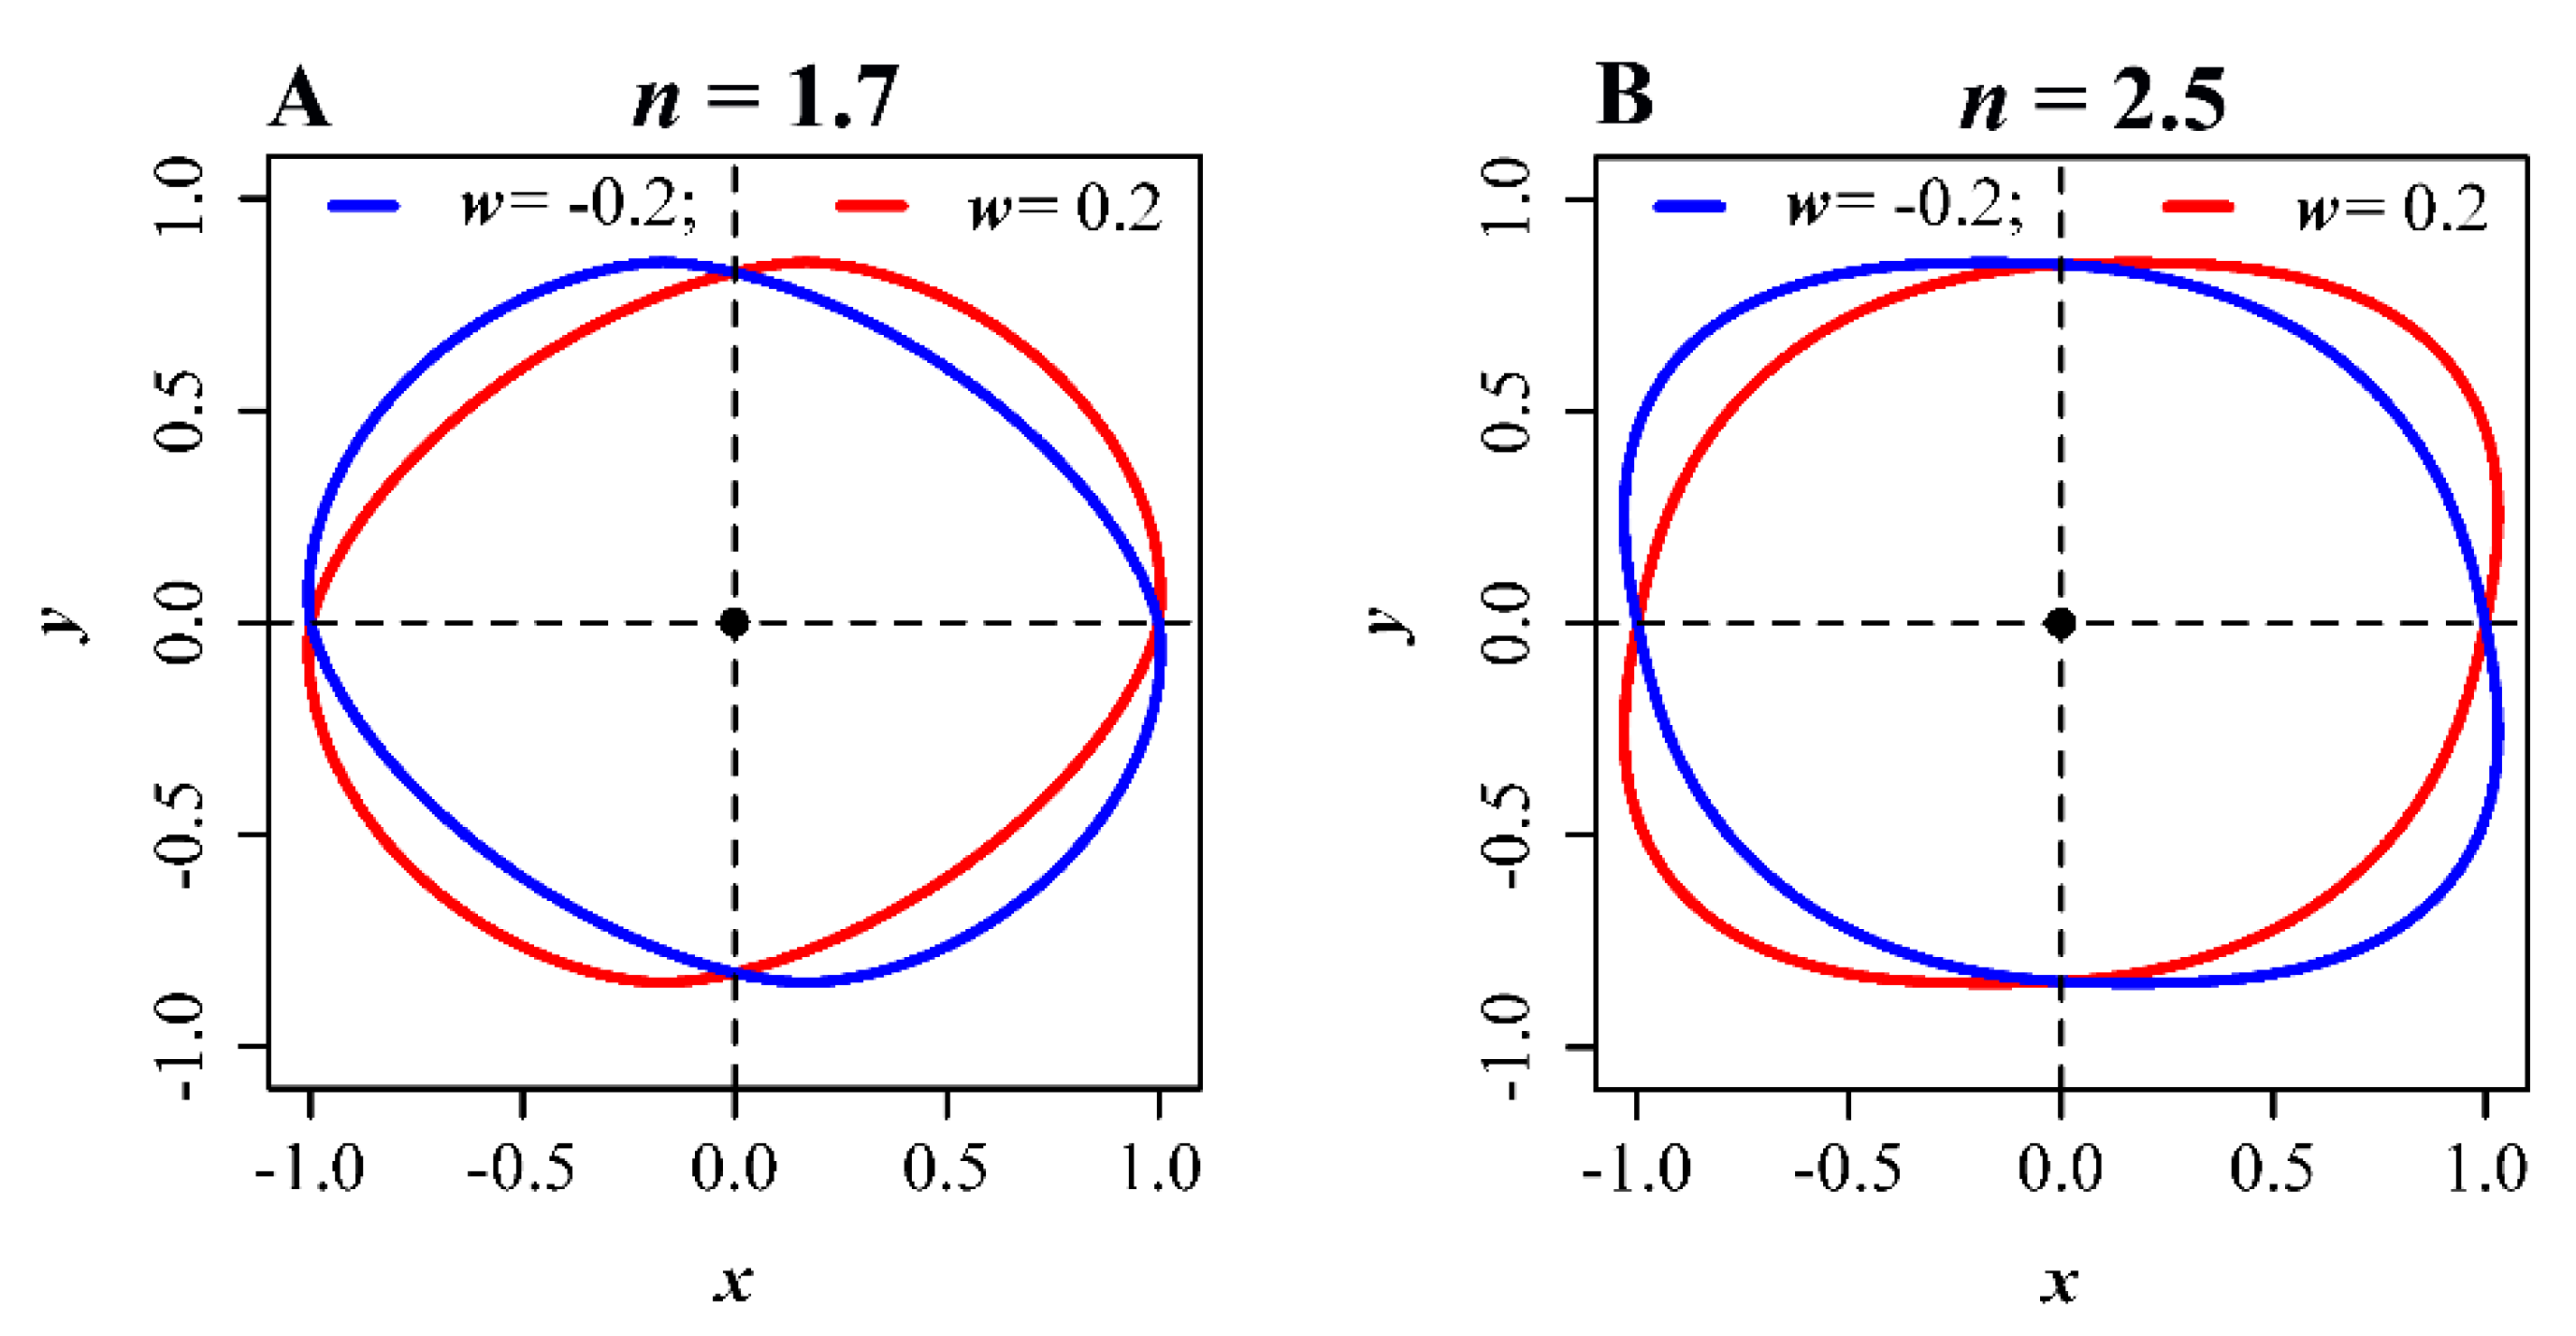
2.3. Fitting the Superellipse Equation and the Introduction of a Deformation Parameter

In the polar coordinate system, Equation (1) can be rewritten as:
r = α ( | cos φ | n + | sin φ / k | n ) 1 / n ,
where r represents the polar radius (where x = r cos φ and y = r sin φ ); φ is the polar angle; k = β/α. In order to fit the data, the translation of the pole of the coordination system and the change in the angle between the straight line where semidiameter α lies and the x-axis need to be considered because scanned images of cross sections generally do not fully overlap with a standard superellipse as shown in Figure 1. Thus, the additional parameters x0, y0 and θ need to be fitted, where (x0, y0) is the translational pole and θ is the angle between the straight line where semidiameter α lies and the x-axis. For a standard superellipse, the pole’s coordinates are (0, 0), and θ = 0.
In order to consider a “deformed” superellipse, we introduced a matrix M:
M = ( 1 w 0 1 ) ,
where w denotes the deformation parameter. Let N represent the matrix that preserves the x- and y-coordinates of a superellipse curve generated by Equation (2):
N = ( x 1 x 2 x 3 x q y 1 y 2 y 3 y q ) ,
where q is the number of data points forming a superellipse curve in (0, 2π). Accordingly, a deformed superellipse can be obtained by multiplying M by N:
G = MN,
where matrix G saves the x- and y-coordinates of the deformed superellipse curve. In the polar coordinate system, the deformed superellipse is:
r = α sin φ ( | cos φ | n + | sin φ k | n ) 1 / n sin [ arctan ( sin φ cos φ + w sin φ ) ] ,
where r’ represents the polar radius of the deformed superellipse. Note that φ designates the polar angle of the undeformed superellipse which provides a link between the deformed and undeformed superellipses. Equation (7) is a formal mathematical description of a deformed superellipse in the polar coordinate system of (r’, φ’), where φ’ represents the polar angle of the deformed superellipse.
r = α ( | cos φ w sin φ | n + | sin φ / k | n ) 1 / n .
Appendix A provides the proof of Equations (6) and (7). Figure 3 illustrates four deformation cases. In fitting empirical data, k was not confined a priori to be smaller than 1, i.e., the semidiameter α can be greater or smaller than the semidiameter β. We referred to α as the major semiaxis when k < 1, and β as the major semiaxis when k > 1. By observing the estimate of k, we can deduce the deformation of the major semiaxis (k < 1) or in a minor semiaxis (k > 1).
Assuming that the observed polar radii from a scanned image are r i , where i ranges from 1 to q, and predicted polar radii are r ^ i , we minimized the residual sum of squares (RSS) between the observed and predicted polar radii to estimate the parameters of the model using the Nelder—Mead optimization algorithm [10]. The R script used to perform parametric estimations is provided in the online Text S1 as Supplementary Materials. The script can operate in R (version ≥ 3.6.1) [11].

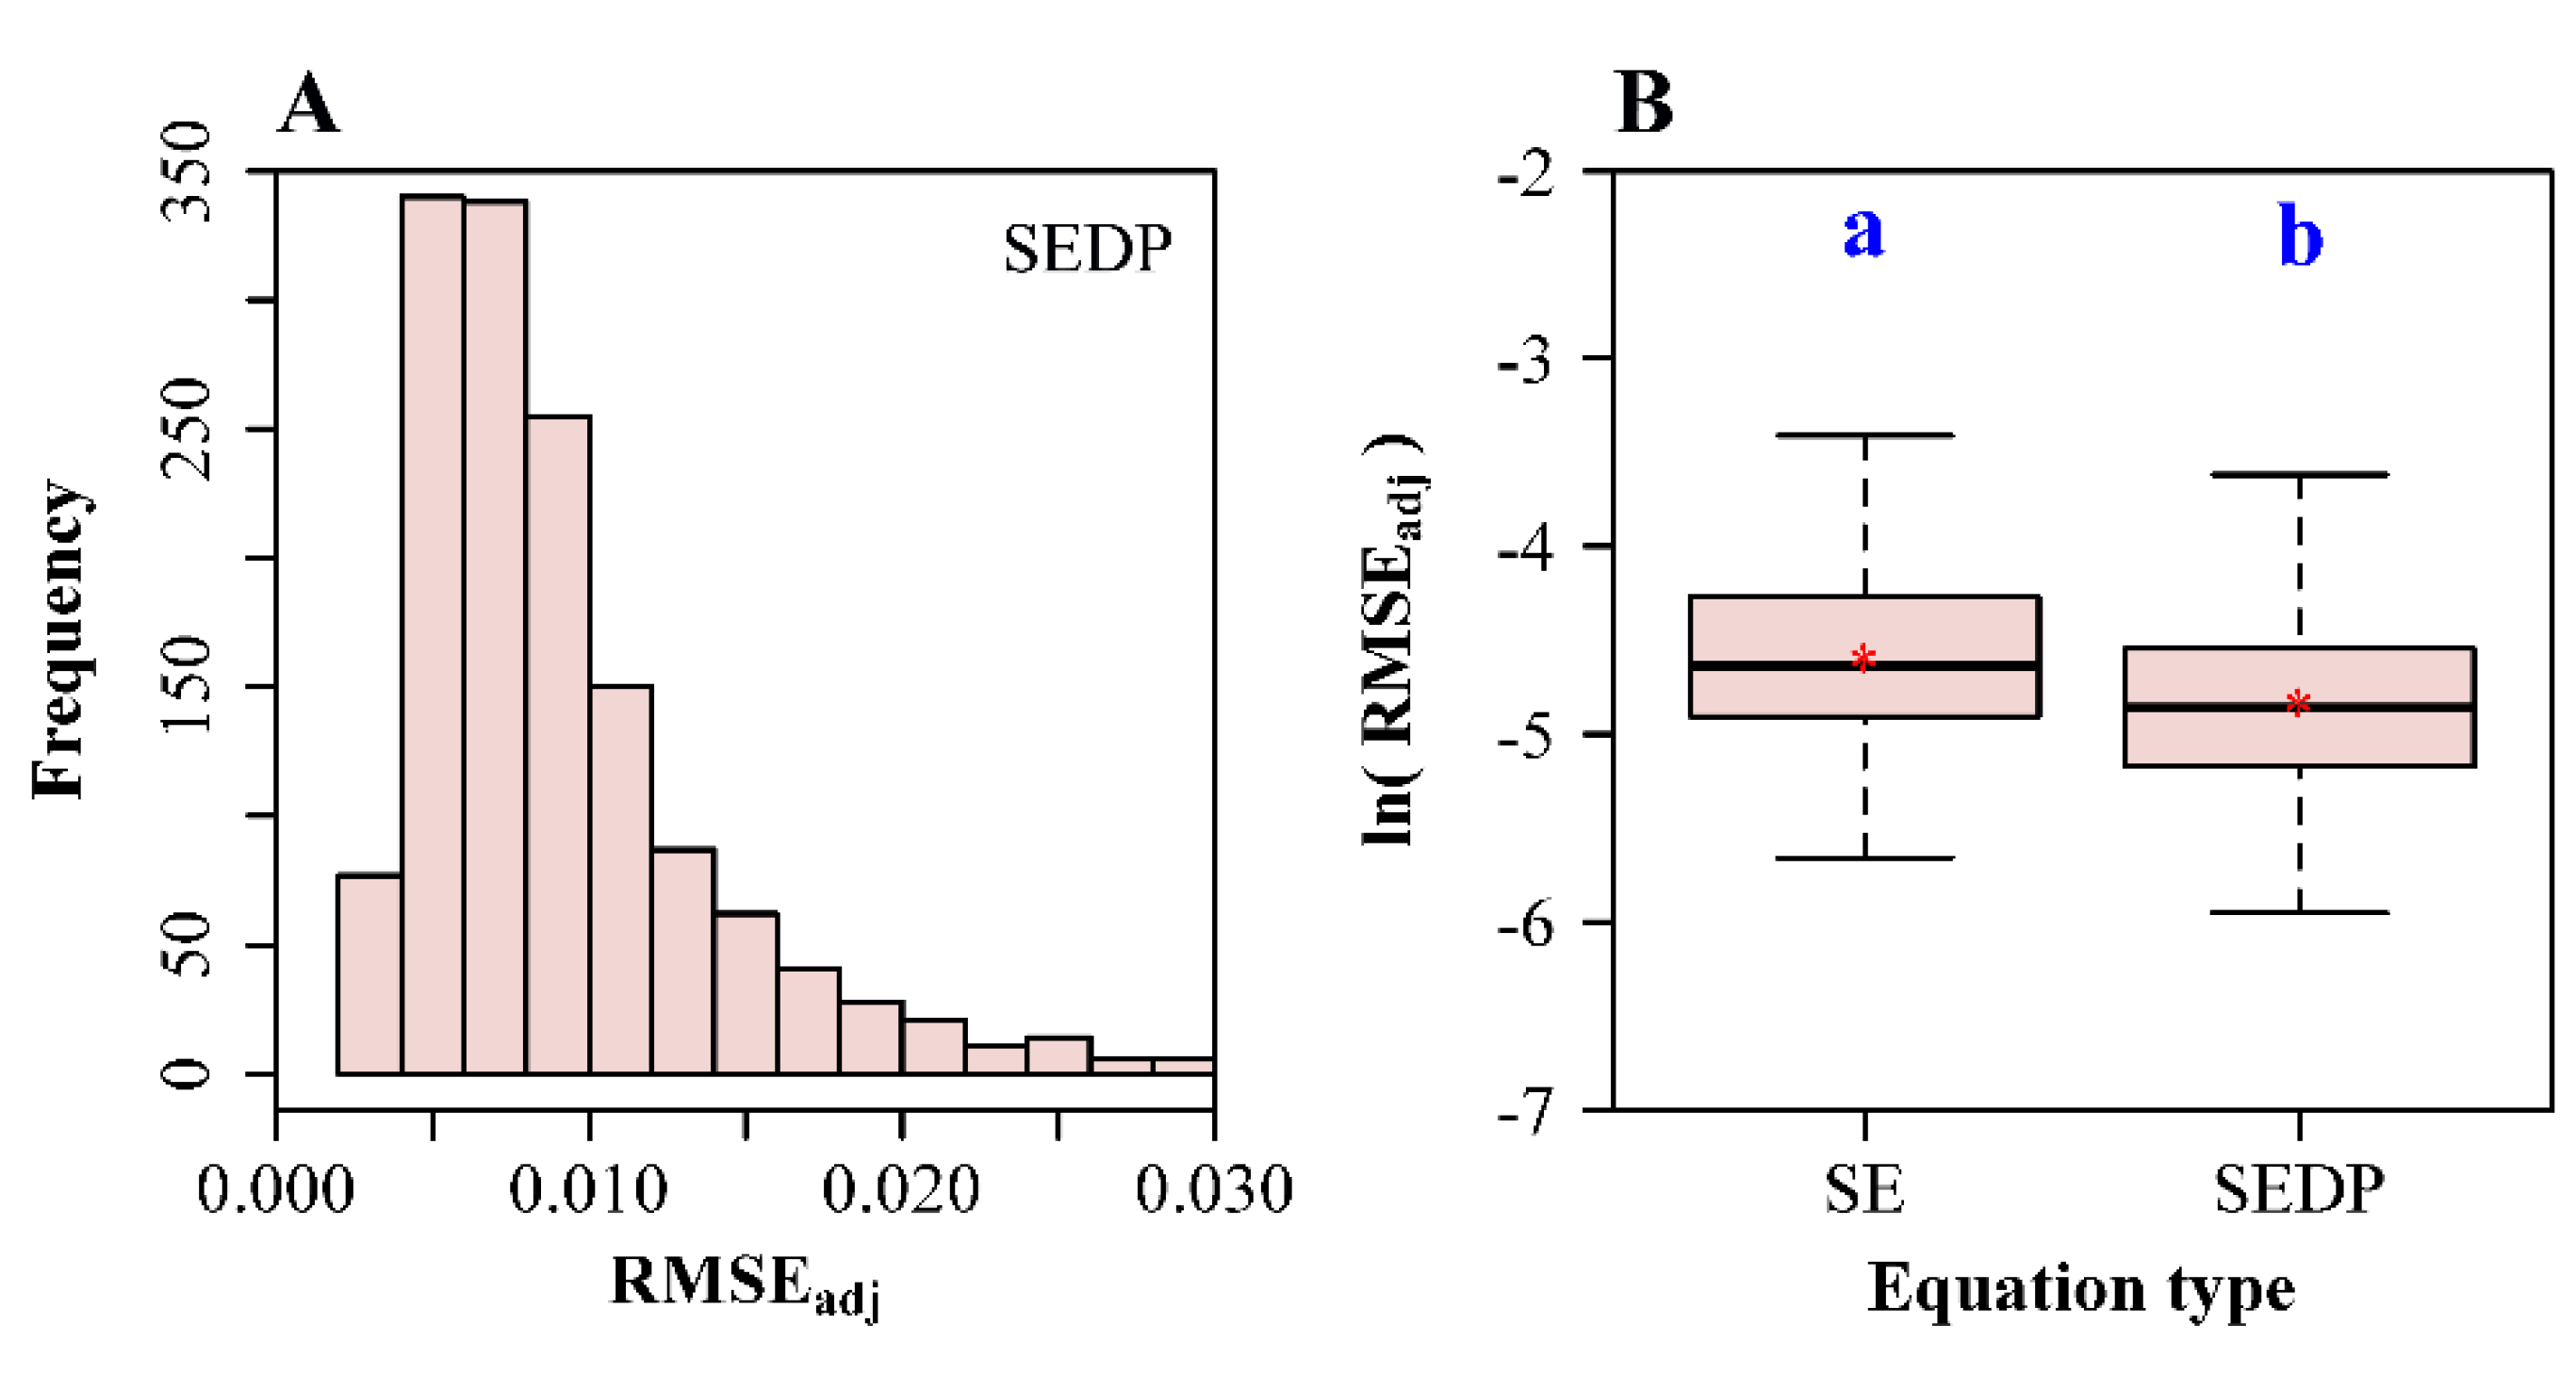
2.4. Analysis of the Fitted Results
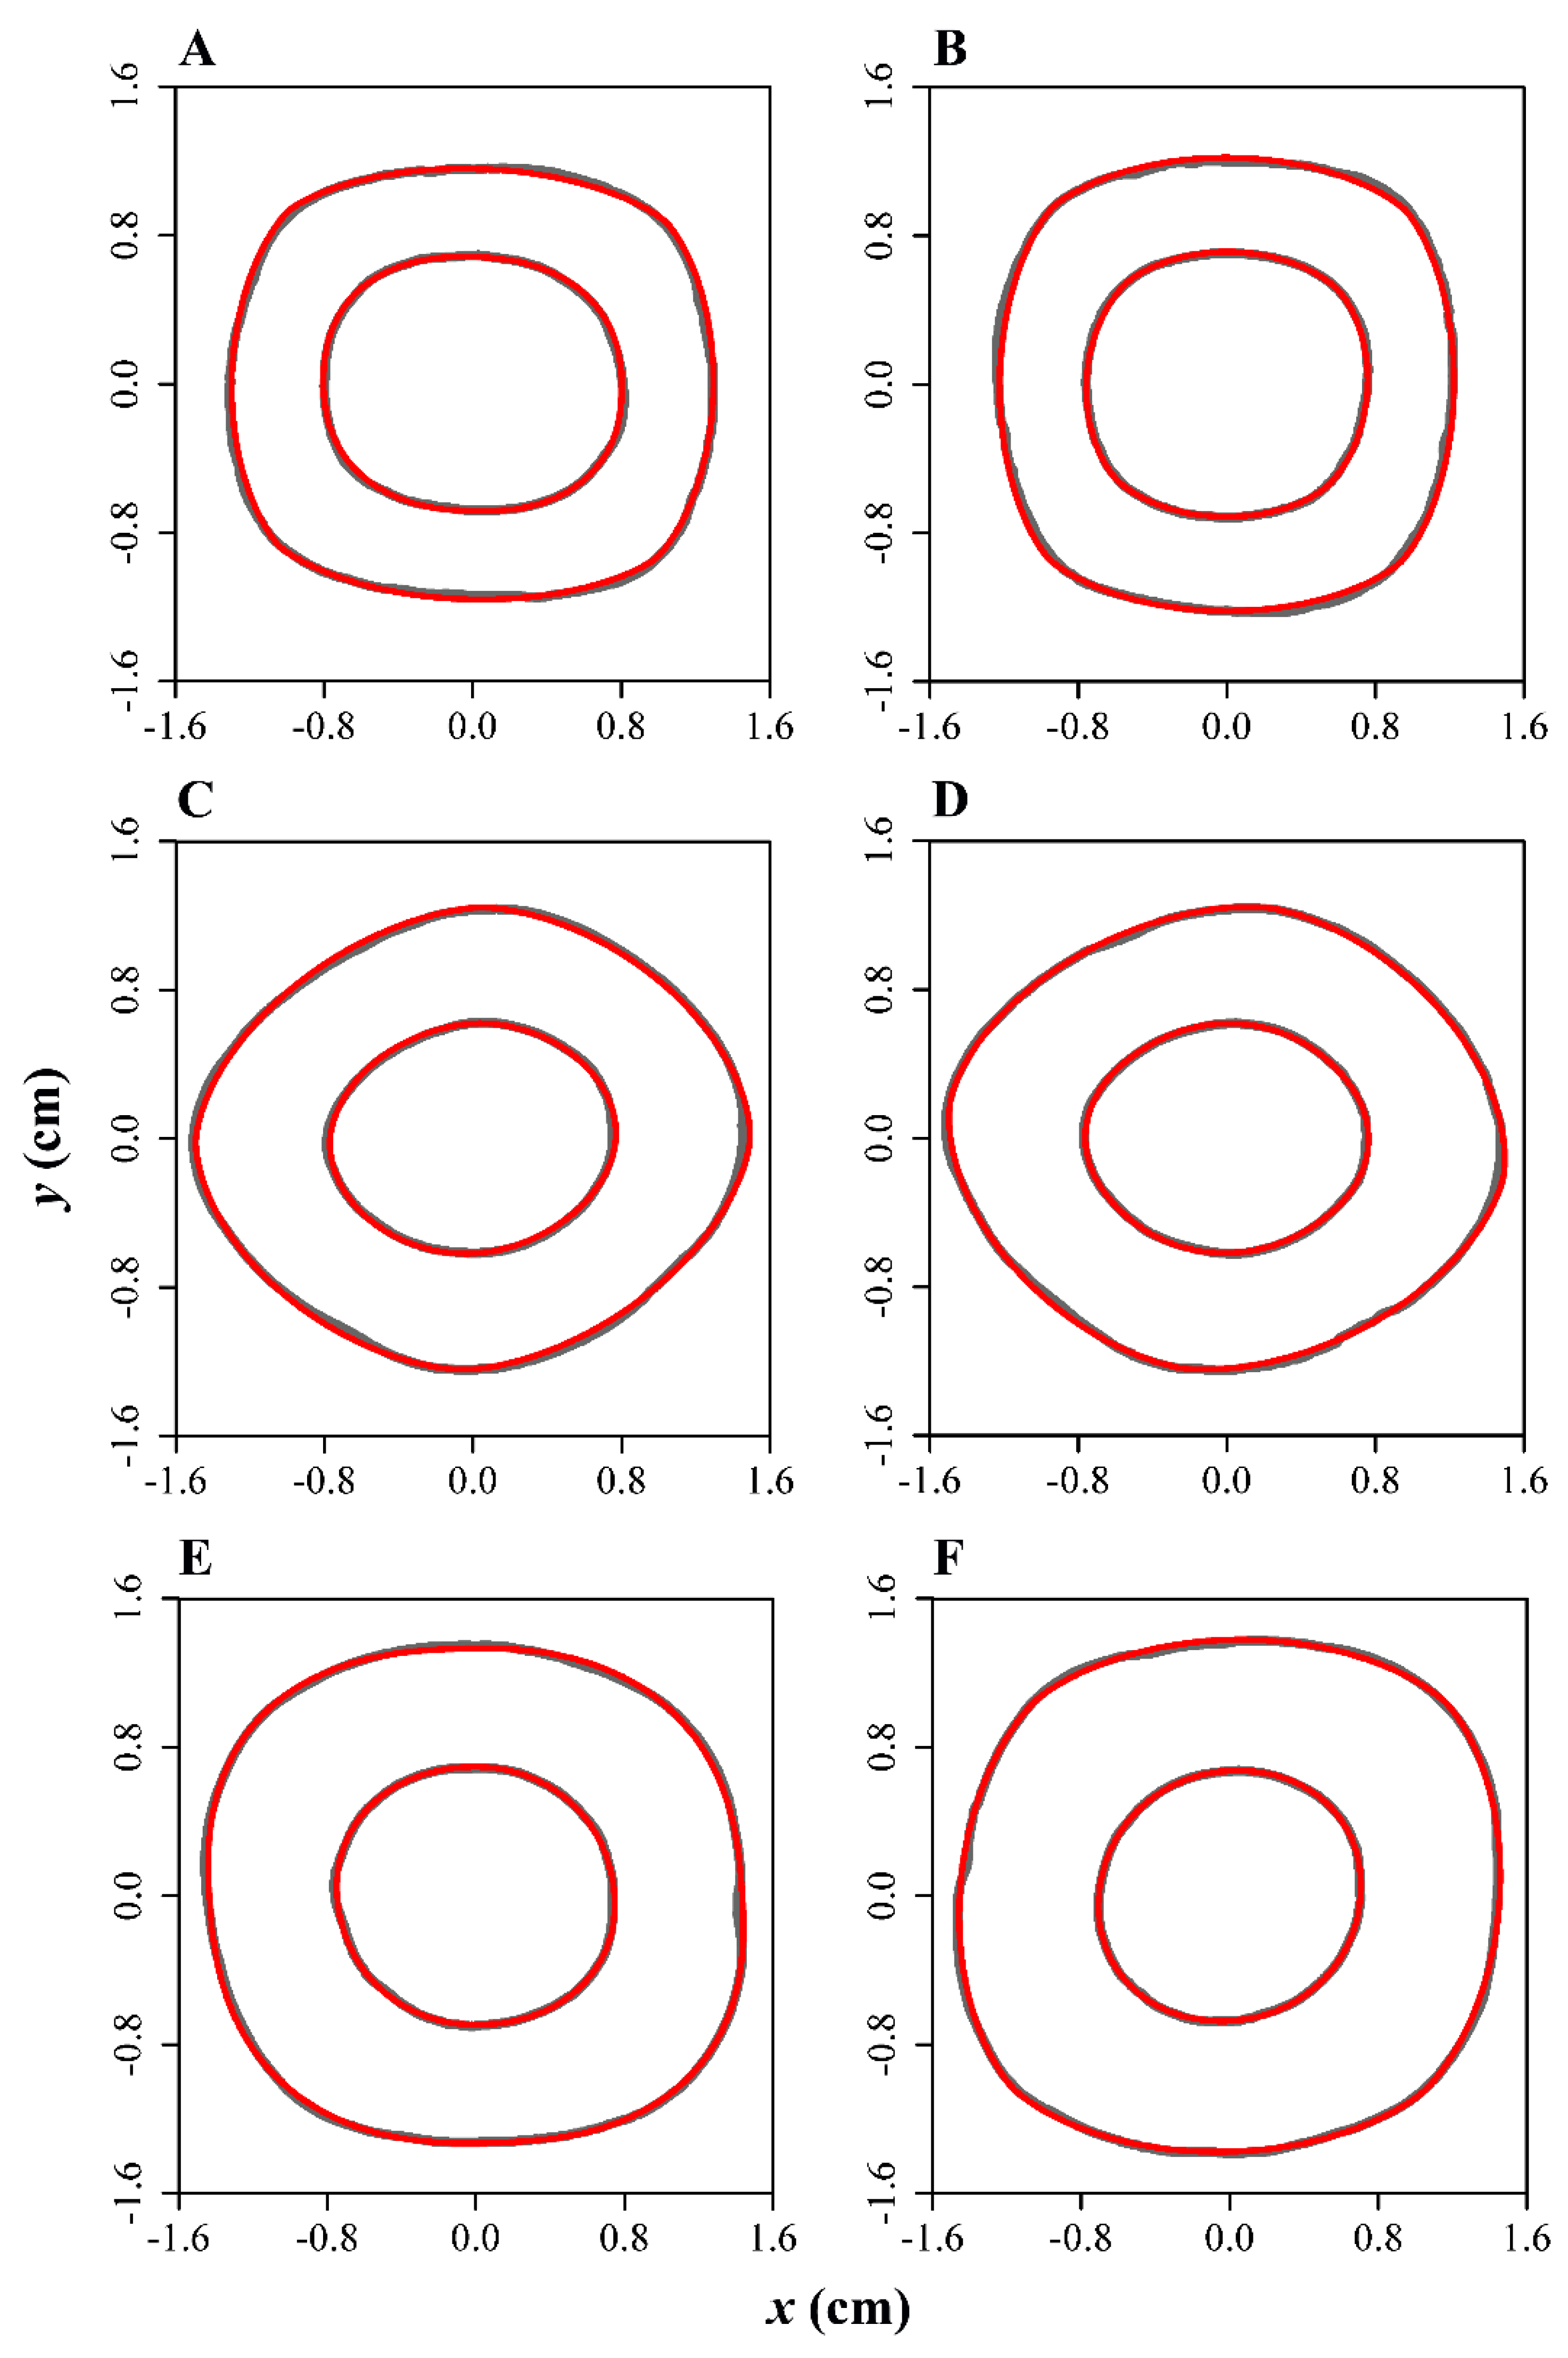
To compare the fit between the superellipse equation with a deformation parameter w (SEDP) and Equation (1) without a deformation parameter (SE), we calculated adjusted root-mean-square errors (RMSEadj) [12,13]:
RMSE adj = RSS / q A / π ,
where A represents the observed ring area. We found that the adjusted RMSEs for two equations (SEDP and SE) both exhibited a right-skewed distribution to a degree. For a right-skewed distribution, a log-transformation was found to reduce the skewness and normalize the data [14]. Thus, we used the Tukey’s honestly significant difference (HSD) test [15] to test whether there was a significant difference between the logarithm of the adjusted RMSE for SEDP and that for SE.
The extent of the deviation from a standard superellipse also determines the need to introduce the deformation parameter w to SE. If the deformation is comparatively minor, the parameter can be neglected. However, if the w value is large, it is necessary to use this parameter. The deformation parameter w correlates with the values of n and k, but the direction of deformation does not change the absolute value of w (Figure 3). Thus, we could identify four superellipse types (S1: n ≥ 2 and k ≥ 1; S2: n ≥ 2 and k < 1; S3: n < 2 and k ≥ 1; S4: n < 2 and k < 1) for the outer and inner rings, respectively. There were a total of eight groups (i.e., four superellipse types and two ring types). However, the absolute values of w in the different groups all exhibited extremely right-skewed distributions that log-transformation could not approximate as symmetrical bell-shaped distributions. Consequently, we used the following method to normalize the |w| values:
w norm = exp ( log c | w | ) ,
where wnorm is the normalized |w| and c is a base that can render all or most groups of the wnorm values to pass the test of normality. To find this base, we set c to range between 1.1 to 200 in 0.1 increments to calculate the p values of the Shapiro—Wilk test of normality [16]. We selected the c value such that all or most groups of the wnorm values passed the test of normality. The Tukey’s HSD test was then used to test whether there were significant differences in the normalized |w| values among the eight groups of the combinations of n and k for the outer and inner rings.
The presence of two types of superellipses (i.e., hypoellipses and hyperellipses) in the outer or the inner rings indicated a bimodal distribution of the estimated n values for the outer or the inner rings. We used a proportional function to reflect the relationship between the scanned ring area (A) and the product of the scanned length (L ≈ 2α) and width (W ≈ 2β). This protocol has been shown to be valid in describing the relationship of leaf surface area and the product of leaf length and width for many broad-leaved plant species [17,18]. If the n values exhibit a bimodal distribution, we assumed that it may result in two different proportionality coefficients considering that the area formula of a superellipse is intimately associated with n and αβ [19]:
A = Γ ( 1 + 1 / n ) 4 1 1 / n π α β Γ ( 0.5 + 1 / n ) ,
where Γ is the gamma function. It is apparent that A is approximately proportional to LW (≈ 4αβ) with a proportionality coefficient, 4 1 / n π Γ ( 1 + 1 / n ) / Γ ( 0.5 + 1 / n ) , if n is a constant. If n exhibited a bimodal distribution, the data were divided into two groups based on the fitted values of n (i.e., n ≥ 2 and n < 2). We used the arithmetic mean n for n ≥ 2 and that for n < 2 to approximately calculate the foregoing proportionality coefficients. Let us plot the observations of ln(A) against those of ln(LW). For a bimodal distribution of n, there will be two parallel straight lines with the same slope 1 but with two different intercepts. The estimate of the intercept based on the mean estimate of n is then as follows:
a ^ = exp [ 4 1 / n ¯ π Γ ( 1 + 1 / n ¯ ) / Γ ( 0.5 + 1 / n ¯ ) ] ,
where a ^ is the estimate of the intercept, and n ¯ is the mean estimate of n. If the estimated intercept from Equation (11) is equal or approximate to the estimated intercept based on the linear regression, it can further demonstrate the validity of the superellipse equation in describing the cross-sectional shapes of C. utilis.

3. Results

The superellipse equation with the deformation parameter (SEDP) adequately described the shapes of all 1436 C. utilis culm cross sections. The adjusted root-mean-square errors (RMSEadj) ranged from 0.0026 to 0.0299 with a median of 0.0078 (Figure 4A; Table S1). All RMSE values were less than 5% of the effective radius (= A / π ). A comparison of the normalized data showed that SEDP had a smaller normalized RMSEadj value than the superellipse equation without the deformation parameter (SE) for each cross section (Figure 4B). On average, the reduction in RMSEadj using SEDP achieved 18.8% of the RMSEadj of SE, indicating that the introduction of the deformation parameter w significantly improved the goodness of fit. Figure 5 shows the fitted results for the six cross-sectional examples in Figure 2 for the outer and inner rings. The fitted results for other cross sections are provided in Table S1.
Of the eight groups of the normalized |w| values (four superellipse types for both the outer and inner rings), there were seven groups that passed the test of normality. The exception was the first group (i.e., the group of n ≥ 2 and k ≥ 1 in the outer rings). There were no significant differences in the normalized deformation parameters among the S2, S3 and S4 groups for either the outer or the inner rings. The results showed that the deformations in hyperellipses exhibited a significant difference between the major axis and the minor axis, whereas the deformations in hypoellipses did not (Figure 6).
A bimodal distribution of n values was found for both outer and inner rings (Figure 7A,B). The distance between the two peaks in the bimodal distribution of outer rings was greater than that of inner rings. There was a significant difference in n between the two types of rings (Figure 7C). The bimodal distribution reflects a separation in the proportional relationship between the ring area and the product of ring length and width, as shown in Figure 7D,E. The intercepts (=exp[proportionality coefficients]) emerging from Equation (11) were found to be approximate to the estimated intercepts using linear regressions (Table 1). This further confirmed the validity of the superellipse equation in describing the cross-sectional shapes of C. utilis.

4. Discussion

When referring to square bamboos in 1885, Thiselton Dyer [20] wrote “The cylindrical form of the stems of grasses is so universal a feature in the family that the reports of the existence in China and Japan of a bamboo with manifestly four-angled stems has generally been considered as a myth, or, at any rate, as founded on some diseases or abnormal condition of a species having stems, when properly developed, circular in section. Of the existence of such a bamboo there cannot, however, now be any kind of doubt”. One century later, these shapes are now shown to be described by a single, highly versatile equation, the deformed superellipse, which is obtained by using a simplified linear transformation matrix M = ( 1 w 0 1 ) to multiply the Cartesian coordinates of the superellipse. It is noteworthy that if the more general matrix is used, M ˜ = ( w 1 w 2 w 3 w 4 ) , the deformed superellipse curve from M ˜ N becomes significantly more flexible. However, the addition of more parameters unnecessarily increases the complexity of the deformed superellipse and generally fails to obtain a global optimization for parametric estimation. The introduction of a single additional parameter w to SE results in a reduction of the mean by 18.8% in the adjusted RMSE of SE. All RMSE values of the 1436 culm cross sections examined in this study were smaller than 5% of the effective radius (= A / π ). This indicates that M is more than sufficient to describe the deviation of actual cross sections of C. utilis from a standard superellipse. To add additional parameters appears to be unnecessary and can decrease the close-to-linear performance of nonlinear regression [14]. However, for other objects, whether it is necessary to add additional deformation parameters requires further study.
The present study can be extended to consider more complex models. Gielis [2] proposed a superformula that can combine SE as a special case:
r = [ | 1 α cos ( m 4 φ ) | n 2 + | 1 β sin ( m 4 φ ) | n 3 ] 1 / n 1 ,
where n1, n2, n3 are constants to be fitted, and m should be a positive integer that controls the number of angles of the supercurve (which was generated by the superformula). This was used to study the mechanical properties of petioles of Philodendron melinonii Brongn. ex Regel and Rheum rhabarbarum L. [21,22], and the current study provides a simpler model for the study of square bamboos. Equation (12) can be rewritten as:
r = h [ | cos ( m 4 φ ) | n 2 + 1 k | sin ( m 4 φ ) | n 3 ] g ,
where h = α n 2 / n 1 , k = β n 3 / α n 2 and g = 1 / n 1 . This rewriting can be helpful in fitting actual data by decreasing the parameter—effects curvature of the nonlinear regression to render the parametric estimation more robust [14,23]. Let us define an elemental radius re as:
r e = | cos ( m 4 φ ) | n 2 + 1 k | sin ( m 4 φ ) | n 3 .
Equation (13) can be regarded as a power—law relationship between r and re, which can be described as a linear relationship on a log-log plot. Equation (13) has been demonstrated to be valid in describing many natural shapes including the leaves of many plants [3,9,24,25,26], and the seeds of Ginkgo biloba L. [23]. However, it was found to be invalid in describing several shapes of starfish. Thus, Shi et al. [13] put forward another superformula based on Equation (13) by changing the linear relationship between r and re on a log-log plot to a hyperbolic relationship on a log-log plot, i.e.,
r = exp [ γ 0 + 1 γ 1 + γ 2 ln ( r e ) ] ,
where γ0, γ1 and γ2 are constants to be fitted. Equation (15) was found to fit the shapes of eight actual starfish specimens well [13]. In actual data fit, Equations (13) and (15) appear to be more valid for the symmetrical shapes including bilateral symmetry and centrosymmetry than those asymmetrical shapes. For instance, some leaves tend to exhibit a degree of bilateral asymmetry because of the influence of environments and the aboveground architecture of plants [27,28,29]. The deviation from a standard symmetrical shape largely limits the applicability of a supercurve to describe natural shapes. The deviation in nature is usually not anisotropic, and it tends to be a linear transformation from a standard symmetrical shape (e.g., the leaf shape of Sapium sebiferum (L.) Roxb.), which has been earlier noted by Thompson [30]. However, such a linear transformation in natural shapes has been little studied after Thompson. The present study demonstrated that the deformation in cross-sectional shapes of C. utilis stalks could be quantified by introducing a parameter w as a linear transformation from a standard centrosymmetrical superellipse.

5. Conclusions

Using cross sections through the culms of C. utilis, we demonstrate that the superellipse equation with a deformation parameter (SEDP) is empirically valid in describing the shapes of the outer and inner rings of culm cross sections. The SEDP has a smaller adjusted root-mean-square error (RMSE) than the superellipse equation without a deformation parameter (SE) for each of the inner and outer 1436 rings from ca. 750 cross sections, indicating that SEDP provides more flexibility in fitting the data compared to SE. The adjusted RMSEs using the SEDP for the 1436 rings range between 0.0026 and 0.0299 with a median of 0.0078, which are all smaller than 0.03. Thus, all RMSEs do not exceed 3% of the effective radius (that is equal to the square root of the quotient of the ring area and π). In comparison with the adjusted RMSE using SE, the introduction of the deformation parameter results in the reduction of the adjusted RMSE by 18.8% on average. This confirmed the necessity of introducing the deformation parameter to SE and showed the reasonability of the linear transformation hypothesis for explaining the deformation in cross-sectional shapes. For outer and inner rings, there were two types of superellipses: hyperellipses (n > 2) and hypoellipses (n < 2), which were reflected by a bimodal distribution of the estimated n values. However, the distance between two peaks in the bimodal distribution of n for outer rings was greater than that for inner rings. The bimodal distribution of n was also reflected by two separate proportional relationships between ring area and the product of ring length and width. On a log-log plot, there were two groups of separate data that could be fitted by two straight lines with the same slope 1 but different intercepts. The bimodal distribution of n showed that the cross-sectional shapes of C. utilis culms tended to change towards two types of superellipses with n = 2.47 and 1.68 for outer rings. We used the two values to calculate the theoretical proportionality coefficients based on the superellipse area formula, and found that the two values were approximate to the estimated slopes using linear regressions. The current study provided the evidence of the existence of natural superellipses, and confirmed that the deviation from a centrosymmetry in some natural shapes could be accounted for by the linear transformation of the boundary coordinates of superellipses.

Supplementary Materials

The following are available online at https://www.mdpi.com/2073-8994/12/12/2073/s1, Text S1. R script for estimating the parameters of the superellipse equation with a deformation parameter, Table S1. Fitted results using the superellipse equation with a deformation parameter to the cross-sectional shapes of Chimonobambusa utilis.

Author Contributions

W.H., K.J.N., J.G. and P.S. designed this study; W.H. and P.S. supervised the work of sample collection and image processing; Y.L., Y.D. and L.C. carried out the work of bamboo culm cutting and grinding; P.S. analyzed the data and wrote the initial draft; W.H., K.J.N. and J.G. further commented on and revised the initial draft. All authors have read and agreed to the published version of the manuscript.

Funding

This research received no external funding.

Acknowledgments

We thank Yulong Ding, Meiling Fan, Xiaofang Jin, Guangxiang Li, Feng Que, Fusheng Wang, Wenjing Yao and Chunxia Zhang for their valuable help during the collection of samples. We also thank Lei Chen for his good suggestions in making figures. We are deeply thankful to three anonymous reviewers for their invaluable comments on the initial version of this manuscript.

Conflicts of Interest

The authors declare no conflict of interest.

Appendix A. Proof of the Superellipse Equation with the Deformation Parameter w

Let x and y represent the coordinates of an arbitrary point on a standard superellipse curve. Then the coordinates of this point on the deformed superellipse curve can be expressed as:
M · ( x y ) = ( 1 w 0 1 ) · ( x y ) = ( x + w y y ) .
In the polar coordinate system, x = r cos φ and y = r sin φ , where r represents the polar radius at φ (see Equation (2)). Let x’ and y’ represent the new coordinates of the point on the deformed superellipse curve. We have:
{ x = x + w y = r cos φ + w r sin φ y = y = r sin φ .
Let φ’ represent the polar angle of the new coordinates of the point, and there is:
φ = arctan ( y x ) .
Let r’ represent the polar radius of the deformed superellipse. Because y = r sin φ , we have:
r = y sin φ = y sin [ arctan ( y x ) ] = y sin [ arctan ( y x + w y ) ] = r sin φ sin [ arctan ( r sin φ r cos φ + w r sin φ ) ] = r sin φ sin [ arctan ( sin φ cos φ + w sin φ ) ]
According to Equation (2), r = α ( | cos φ | n + | sin φ / k | n ) 1 / n , we can derive the superellipse equation with the deformation parameter w in the polar coordinate system:
r = α sin φ ( | cos φ | n + | sin φ k | n ) 1 / n sin [ arctan ( sin φ cos φ + w sin φ ) ] .
If we replace r in Equation (A4) with Equation (1) instead of Equation (2), we have:
r = sin φ ( | cos φ α | n + | sin φ β | n ) 1 / n sin [ arctan ( sin φ cos φ + w sin φ ) ] .
In the polar coordinate system of (r’, φ’), we see that:
tan φ = y x = y x + w y y = tan φ x 1 w tan φ .
After replacing y in Equation (A7) with y = y = r sin φ , we have:
r sin φ = tan φ x 1 w tan φ x = r ( cos φ w sin φ ) .
Replacing x and y in Equation (1) with Equation (A8) and y = y = r sin φ , yields the formula:
r = ( | cos φ w sin φ α | n + | sin φ β | n ) 1 / n .
Because k = β / α , Equation (A9) can be rewritten as:
r = α ( | cos φ w sin φ | n + | sin φ / k | n ) 1 / n .

References

  1. Lamé, G. Examen des différentes méthodes employées pour résoudre les problèmes de géométrie; V. Courcier: Paris, France, 1818. [Google Scholar]
  2. Gielis, J. Inventing the Circle: The Geometry of Nature; Geniaal Press: Antwerpen, Belgium, 2003. [Google Scholar]
  3. Gielis, J. The Geometrical Beauty of Plants; Atlantis Press: Paris, France, 2017. [Google Scholar]
  4. Shi, P.; Huang, J.; Hui, C.; Grissino-Mayer, H.D.; Tardif, J.; Zhai, L.; Wang, F.; Li, B. Capturing spiral radial growth of conifers using the superellipse to model tree-ring geometric shape. Front. Plant Sci. 2015, 6, 856. [Google Scholar] [CrossRef] [PubMed] [Green Version]
  5. Gielis, J. Supervormen in bamboo. Newsletter of the Belgian Bamboo Society 1997, 14, 20–26. [Google Scholar]
  6. Liese, W.; Köhl, M. Bamboo: The Plant and its Uses; Springer: Heidelberg, Germany, 2015. [Google Scholar]
  7. Wen, T. The taxonomy and cultivation of Chimonobambusa Makino. J. Amer. Bamboo Soc. 1994, 11, 1–80. [Google Scholar]
  8. Chen, S.; Li, D.; Zhu, G.; Wu, L.; Lu, S.; Liu, L.; Wang, Z.; Sun, B.; Zhu, Z.; Xia, N.; et al. The Flora of China (Volume 22—Poaceae); Science Press: Beijing, China; Missouri Botanical Garden Press: St Louis, MO, USA, 2006. [Google Scholar]
  9. Shi, P.; Ratkowsky, D.A.; Li, Y.; Zhang, L.; Lin, S.; Gielis, J. General leaf-area geometric formula exists for plants—Evidence from the simplified Gielis equation. Forests 2018, 9, 714. [Google Scholar] [CrossRef] [Green Version]
  10. Nelder, J.A.; Mead, R. A simplex method for function minimization. Comput. J. 1965, 7, 308–313. [Google Scholar] [CrossRef]
  11. R Core Team. R: A Language and Environment for Statistical Computing; R Foundation for Statistical Computing: Vienna, Austria, 2019; Available online: https://www.R-project.org/ (accessed on 1 January 2020).
  12. Wei, H.; Li, X.; Huang, H. Leaf shape simulation of castor bean and its application in nondestructive leaf area estimation. Int. J. Agric. Biol. Eng. 2019, 12, 135–140. [Google Scholar]
  13. Shi, P.; Ratkowsky, D.A.; Gielis, J. The generalized Gielis geometric equation and its application. Symmetry 2020, 12, 645. [Google Scholar] [CrossRef] [Green Version]
  14. Ratkowsky, D.A. Handbook of Nonlinear Regression Models; Marcel Dekker: New York, NY, USA, 1990. [Google Scholar]
  15. Hsu, J.C. Multiple Comparisons: Theory and Methods; Chapman and Hall/CRC: New York, NY, USA, 1996. [Google Scholar]
  16. Royston, J.P. An extension of Shapiro and Wilk’s W test for normality to large samples. J. R. Stat. Soc. Ser. C Appl. Stat. 1982, 31, 115–124. [Google Scholar] [CrossRef]
  17. Shi, P.; Liu, M.; Ratkowsky, D.A.; Gielis, J.; Su, J.; Yu, X.; Wang, P.; Zhang, L.; Lin, Z.; Schrader, J. Leaf area-length allometry and its implications in leaf-shape evolution. Trees Struct. Funct. 2019, 33, 1073–1085. [Google Scholar] [CrossRef]
  18. Yu, X.; Shi, P.; Schrader, J.; Niklas, K.J. Nondestructive estimation of leaf area for 15 species of vines with different leaf shapes. Am. J. Bot. 2020, 107, 1481–1490. [Google Scholar] [CrossRef] [PubMed]
  19. Weisstein, E. Superellipse. MathWorld. 2003. Available online: https://mathworld.wolfram.com/Superellipse.html (accessed on 1 November 2020).
  20. Thiselton Dyer, W.T. The Square Bamboo. Nature 1885, 32, 391–392. [Google Scholar] [CrossRef] [Green Version]
  21. Faisal, T.R.; Abad, E.M.K.; Hristozov, N.; Pasini, D. The impact of tissue morphology, cross-section and turgor pressure on the mechanical properties of the leaf petiole in plants. J. Bionic Eng. 2010, 7, S11–S23. [Google Scholar] [CrossRef]
  22. Faisal, T.R.; Hristozov, N.; Western, T.L.; Rey, A.; Pasini, D. The twist-to-bend compliance of the Rheum rhabarbarum petiole: Integrated computations and experiments. Comput. Method. Biomec. 2017, 20, 343–354. [Google Scholar] [CrossRef] [PubMed] [Green Version]
  23. Tian, F.; Wang, Y.J.; Sandhu, H.S.; Gielis, J.; Shi, P.J. Comparison of seed morphology of two ginkgo cultivars. J. Forest Res. 2020, 31, 751–758. [Google Scholar] [CrossRef]
  24. Shi, P.; Xu, Q.; Sandhu, H.S.; Gielis, J.; Ding, Y.; Li, H.; Dong, X. Comparison of dwarf bamboos (Indocalamus sp.) leaf parameters to determine relationship between spatial density of plants and total leaf area per plant. Ecol. Evol. 2015, 5, 4578–4589. [Google Scholar] [CrossRef] [PubMed]
  25. Lin, S.; Zhang, L.; Reddy, G.V.P.; Hui, C.; Gielis, J.; Ding, Y.; Shi, P. A geometrical model for testing bilateral symmetry of bamboo leaf with a simplified Gielis equation. Ecol. Evol. 2016, 6, 6798–6806. [Google Scholar] [CrossRef] [PubMed]
  26. Shi, P.; Liu, M.; Yu, X.; Gielis, J.; Ratkowsky, D.A. Proportional relationship between leaf area and the product of leaf length and width of four types of special leaf shapes. Forests 2019, 10, 178. [Google Scholar] [CrossRef] [Green Version]
  27. Wang, P.; Ratkowsky, D.A.; Xiao, X.; Yu, X.; Su, J.; Zhang, L.; Shi, P. Taylor’s power law for leaf bilateral symmetry. Forests 2018, 9, 500. [Google Scholar] [CrossRef] [Green Version]
  28. Guo, X.; Reddy, G.V.P.; He, J.; Li, J.; Shi, P. Mean-variance relationships of leaf bilateral asymmetry for 35 species of plants and their implications. Glob. Ecol. Conser. 2020, 23, e01152. [Google Scholar] [CrossRef]
  29. Shi, P.; Niinemets, U.; Hui, C.; Niklas, K.J.; Yu, X.; Holscher, D. Leaf bilateral symmetry and the scaling of the perimeter vs. the surface area in 15 vine species. Forests 2020, 11, 246. [Google Scholar] [CrossRef] [Green Version]
  30. Thompson, D.W. On Growth and Form; Cambridge University Press: London, UK, 1917. [Google Scholar]
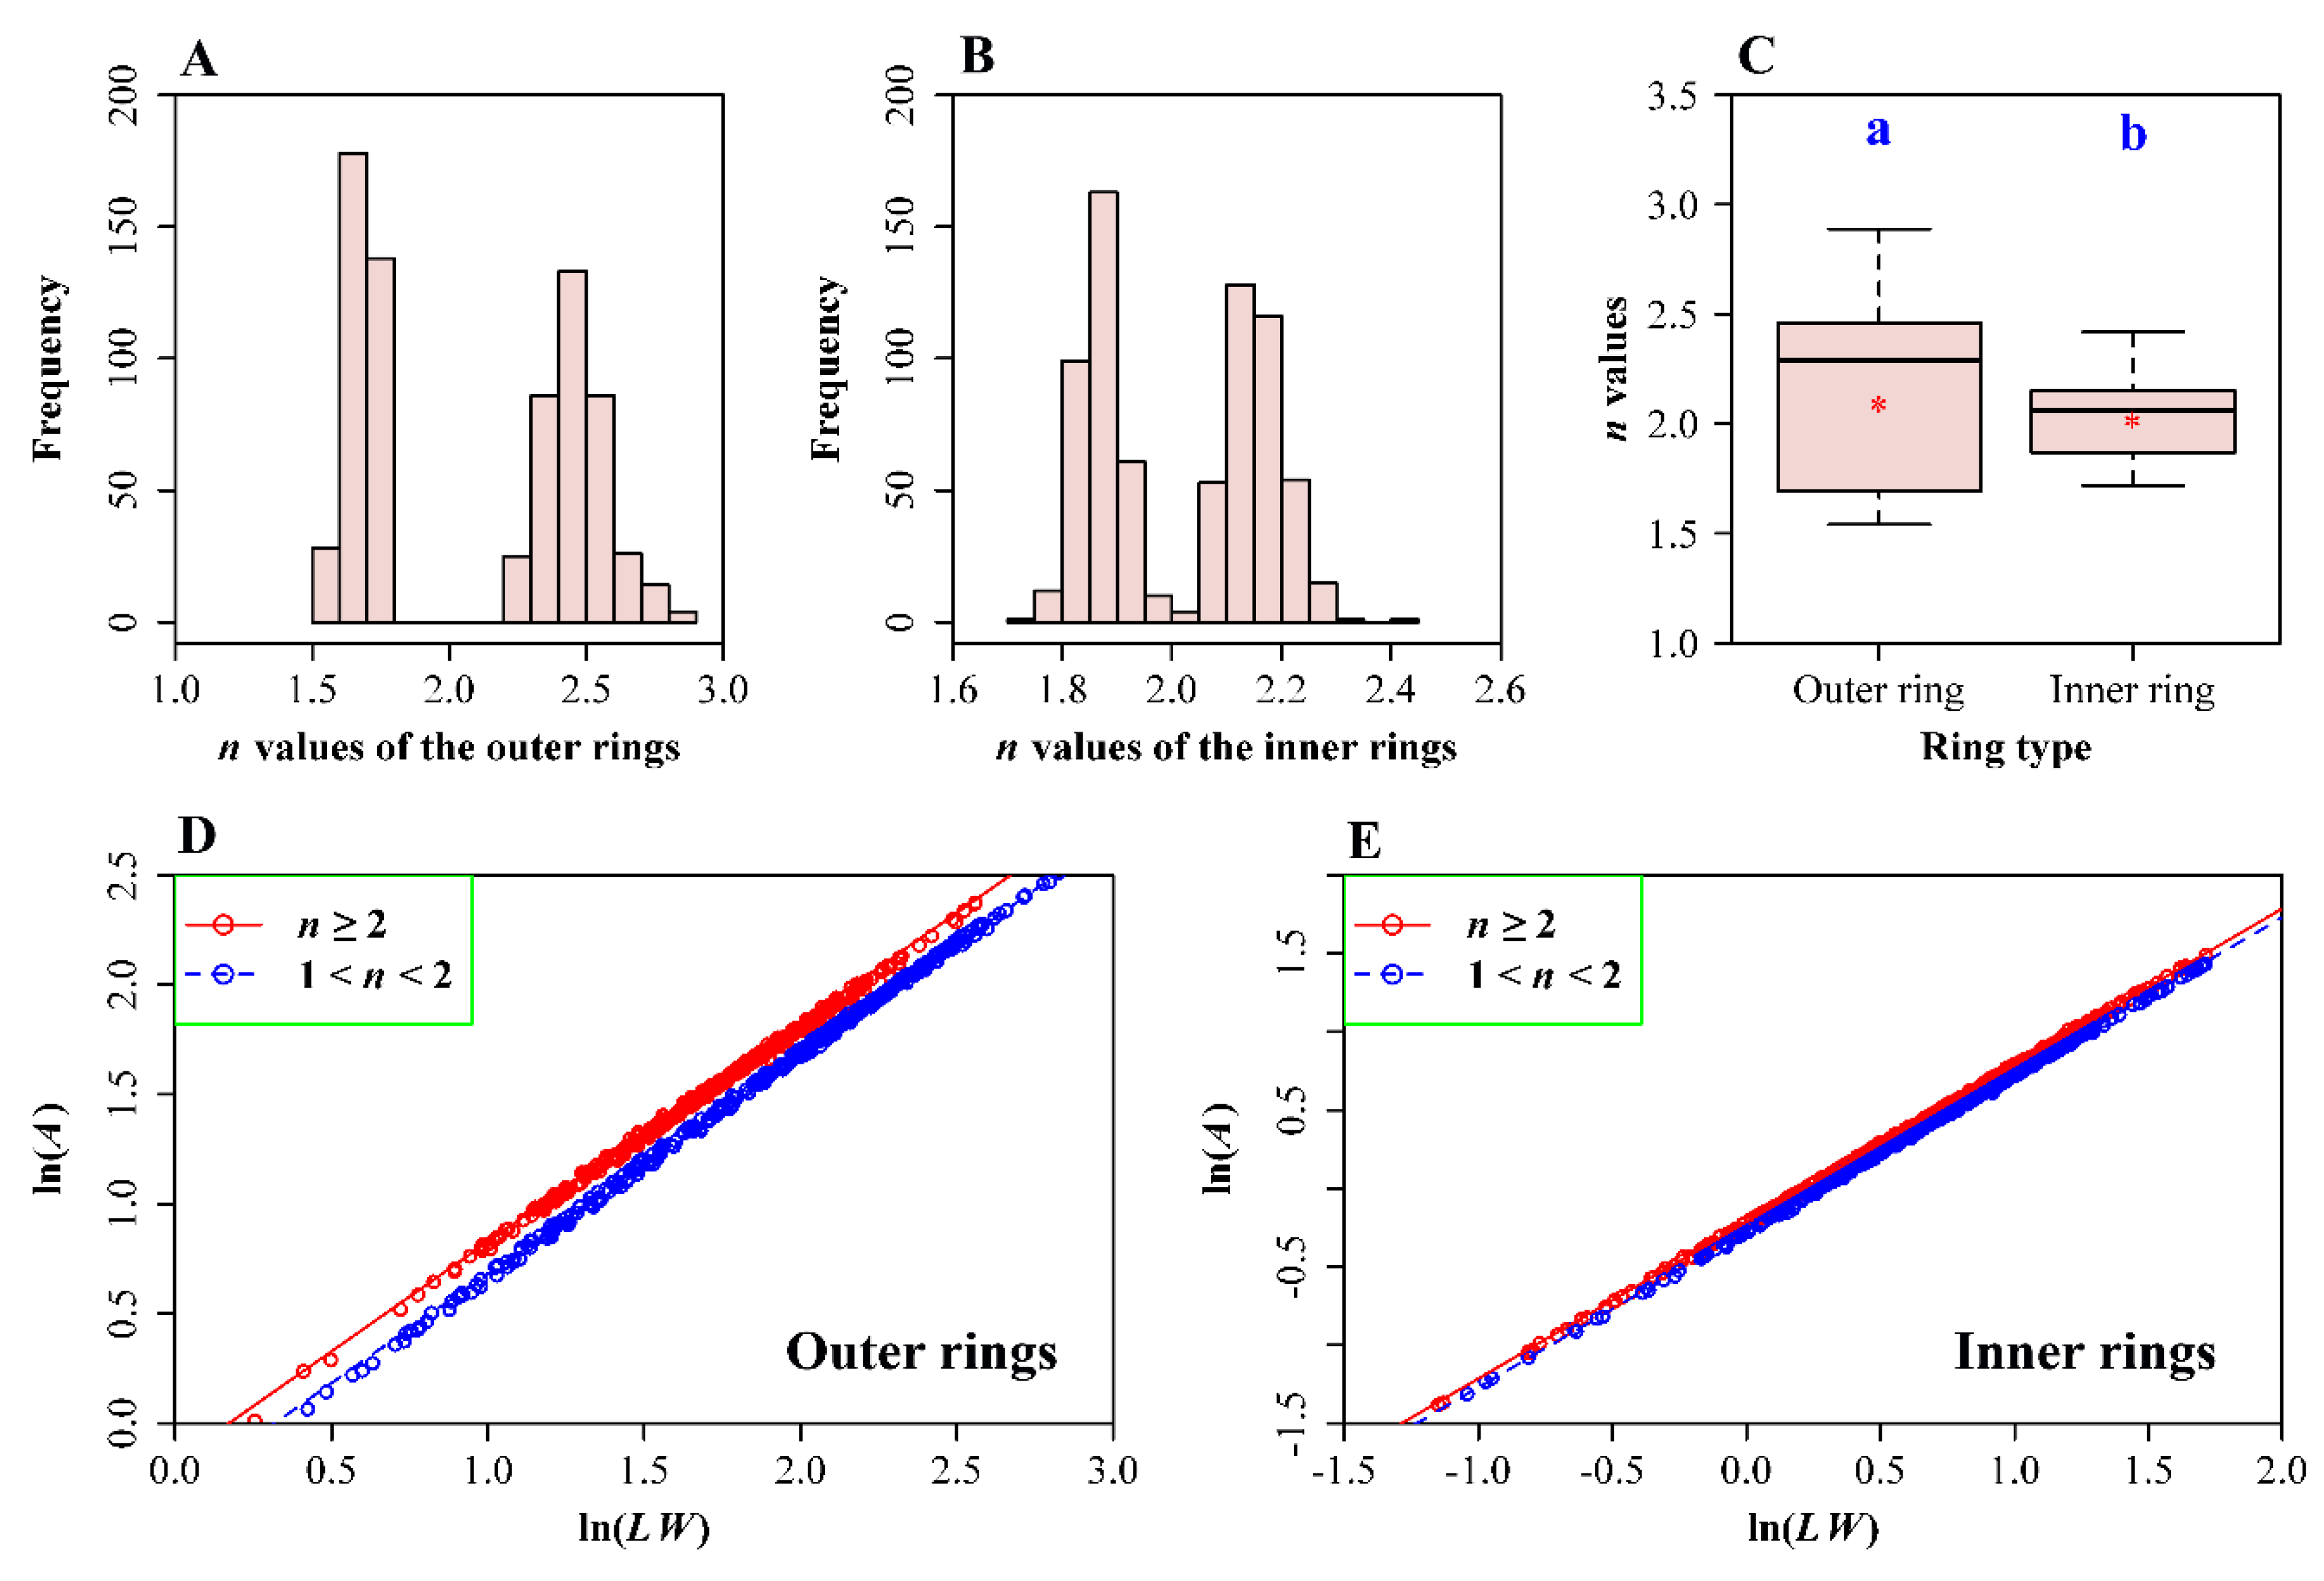
Figure 1. Simulated superellipses. α = 1, β = 0.85, and n ranges from 0.01 to 10 in 0.01 increments. Five simulated superellipses with n = 0.5, 1, 1.5, 2 and 2.5 are shown with isolines.
Symmetry 12 02073 g001
Figure 2. Six examples of the culm cross sections of C. utilis (Keng) Keng. The samples (AF) were sampled from the same site (Tongzi County, Guizhou Province, P.R. China) in September of 2020. The aboveground heights of sections (AF) were 26.50, 40.85, 30.85, 20.00, 36.60 and 24.45 cm, respectively.
Symmetry 12 02073 g002
Figure 3. Four examples of the deformation in superellipses. (A) n = 1.7; α = 1; k = 0.85; w = −0.2 and 0.2; (B) n = 2.5; α = 1; k = 0.85; w = −0.2 and 0.2. Panel (A) exhibits two deformed hypoellipses, and panel (B) exhibits two deformed hyperellipses. The sign of w does not affect the degree of deformation; it merely designates the direction of deformation.
Symmetry 12 02073 g003
Figure 4. (A) The frequency distribution of the adjusted root-mean-square errors using the superellipse equation with a deformation parameter (SEDP) and (B) a comparison in the log-transformed RMSEadj between the superellipse equation without a deformation parameter (SE) and with a deformation parameter (SEDP). In panel B, a and b were used to show the significance of the difference in the mean log-transformed RMSEadj between the two equations based on the Tukey’s HSD test. Group SE has a larger mean log-transformed RMSEadj than group SEDP.
Symmetry 12 02073 g004
Figure 5. Fitted curves for the six actual cross-sectional examples of C. utilis using the superellipse equation with a deformation parameter. The gray curves are the actual outer and inner rings; the red curves are fitted curves. The panels (AF) correspond to the actual scanned images in Figure 2.
Symmetry 12 02073 g005
Figure 6. Boxplot for the normalized deformation parameters for the four superellipse types (S1: n ≥ 2 and k ≥ 1; S2: n ≥ 2 and k < 1; S3: n < 2 and k ≥ 1; S4: n < 2 and k < 1) for outer and inner rings. The dark solids in the box represent the median of data; the red snowflakes represent means. The letters of a, b, c and d in the upper whiskers denote the significance of the difference in the mean normalized deformation parameters between any two groups. The same letter indicates an insignificant difference between the two groups. Here, a represents the group with the largest mean normalized deformation parameter, and d represents the group with the smallest mean normalized deformation parameter.
Symmetry 12 02073 g006
Figure 7. Bimodal distribution of the n values and their influence on the proportional relationship between the ring area and the product of the ring length and width. (A,B) The frequencies of the n values in outer and inner rings, and (C) their comparison using a boxplot. There was a significant difference in the mean n value between the outer and inner rings, the mean n of the group marked by a is significantly larger than that marked by b. (D) For the outer rings, the data apparently exhibited two separate linear trends according to the n values, and (E) the similar separation in the data occurred for the inner rings. However, the extent of the data separation for outer rings is larger than that for inner rings (D vs. E). The red small open circles are observations; the straight lines were not fitted by linear regressions, and they were derived from the superellipse area formula (i.e., Equation (11)). The slopes of the four straight lines in (D,E) are both equal to 1.
Symmetry 12 02073 g007
Table 1. Comparison between the theoretical intercept based on the superellipse area formula and the estimated intercept based on the linear regression.
Ring TypeData RangeTheoretical Intercept 1Estimated InterceptLCIUCIRMSE
Outern ≥ 20.84210.82460.82350.82570.0134
Outern < 20.72820.72910.72790.73030.0158
Innern ≥ 20.80710.79940.79860.80010.0092
Innern < 20.76370.76000.75930.76070.0087
1 The theoretical intercept represents the value derived from the superellipse area formula (Equation (11)); the estimated intercept represents the value based on the linear regression; LCI and UCI represent the lower and upper bounds of the 95% confidence intervals of the estimated intercept; and RMSE represents the root-mean-square error of the linear regression.
Publisher’s Note: MDPI stays neutral with regard to jurisdictional claims in published maps and institutional affiliations.

