Article

Analysis of Instability Mode and Limit Support Pressure of Shallow Tunnel Face in Sands

1
College of Civil and Transportation Engineering, Shenzhen University, Shenzhen 518060, China
2
Underground Polis Academy, Shenzhen University, Shenzhen 518060, China
3
China Jingye Engineering Co., Ltd., Beijing 100088, China
*
Author to whom correspondence should be addressed.
Symmetry 2020, 12(12), 2067; https://doi.org/10.3390/sym12122067
Submission received: 24 November 2020 / Revised: 8 December 2020 / Accepted: 10 December 2020 / Published: 12 December 2020

Abstract

:
The stability analysis of the tunnel face is not only essential for guaranteeing the safe construction of urban shallow tunnels, but also directly affecting the influence degree of tunnel construction on nearby structures. The primary concerns in the stability analysis of the tunnel face are the instability mode of surrounding rocks and the limit support pressure on the tunnel face. In this paper, face stability of shallow tunnels in sands was conducted using a symmetrical model test. The ground surface settlement, support pressure on the tunnel face and progressive instability modes of sands at tunnel face are measured by using an LVDT (Linear Variable Differential Transformer) displacement sensor, high-precision pressure sensor and high-definition digital camera, respectively. The test results indicate that the shear failure band appears in sands in front of the tunnel face and develops from the tunnel invert to the tunnel crown. The upper sands undergo stress redistribution, and the pressure arch appears with initial form of “ellipsoid”, then of the “pyramid”. Moreover, the support pressure on the tunnel face experiences four stages, namely, rapid decline stage, the minimum stage, slowly raises stage and stable stage during tunnel excavation. The research results of this paper will provide theoretical support for the reasonable value of the support pressure on the tunnel face in practical engineering.

1. Introduction

Environment protection are attracting increasing attention with the ground traffic is becoming more and more busy, underground excavation has become the preferred method of tunnel construction instead of the cut-and-cover method. According to support condition at tunnel face, the tunnel construction method in urban areas is divided into two types, namely, the closed face tunneling method (shield method) and open face tunneling methods (shallow tunneling method). The shield tunneling machine is a kind of special mechanical equipment for excavation and support when constructing a subway tunnel and other underground works in water-bearing strata and soft surrounding rock. Compared with the cut-and-cover method, it has advantages of less disturbance to ground traffic, less noise, less destruction of the urban environment, etc. The tunnel face stability is not only a necessary condition to ensure the safety of shallow tunnel construction, but also directly affects the impact of tunnel construction on nearby structures. The instability mode of surrounding rocks and the limit support pressure on the tunnel face are the main contents of stability analysis of the tunnel face [1,2].
The model test is an important method in the research field of geotechnical mechanics. The model test includes centrifuge model test and conventional model test. Chambon and Corté [3] developed the earliest centrifuge model test to study the stability of the tunnel face and obtain the failure mode of sands in front of the tunnel face. Histake et al. [4] and Atkinson and Potts [5] conducted similar centrifuge model tests under plane strain condition, and their experimental results showed that when the buried depth ratio is greater than 0.5, the minimum supporting pressure was almost constant and no longer affected by the buried depth ratio. Mair [6] studied the different mechanisms of face instability of tunnels constructed in sands and clays by using a centrifugal model test. Bezuijen and Messemaeckers-van de Graaf [7] carried out three centrifuge tests in sands and clays and established a three-dimensional shape map of the damaged zone by virtue pf X line fault photography. To obtain the failure mode of the tunnel face, Takano et al. [8] adopted the X ray CT scanning technique during the centrifugal model test. Idigner et al. [9] studied the face stability of shallow tunnel in dry sands by using centrifuge test and found that the soil arching effect was observed when the buried depth was small. Sterip et al. [10] conducted a model test on the stability of the tunnel face of horseshoe tunnel with a section size of 1.32 × 1.145 m and obtained the relationship between the support pressure on the tunnel face and the ground surface settlement in the sand stratum and pointed out that the limit support pressure was about 15–20% of the initial stress of the ground. Kirsch [11] carried out a series of model tests for dry sand with different density and adopted full-section and semi-section tunnel excavation models in the experimental test. Chen et al. [12] conducted centrifugal model tests to study the face failure of the earth pressure balance shield caused by steady seepage in saturated sandy silt. Their results indicated that the limit support pressure increases linearly with the increase in the water head difference between the ground and the chamber. Lü et al. [13] conducted nine sets of physical model tests to study the different instability rules of the tunnel face in dry sand stratum, saturated undrained stratum and seepage stratum, respectively.
In this paper, six model tests were conducted to investigate the face stability of shallow tunnels in sands by using a symmetrical model test. First, the development and evolution of shear failure band, the formation and morphological evolution of pressure arch, the failure range of instability and the progressive instability mode in the sands in front of the tunnel face are analyzed by using a high-definition digital camera. Then, we consider the laws of the development and evolution of the support pressure on the tunnel face based on the high-precision pressure sensor. Finally, the laws of development and evolution of the ground surface settlement are investigated and compared with the results of the support pressure on the tunnel face.

2. Physical Model Test
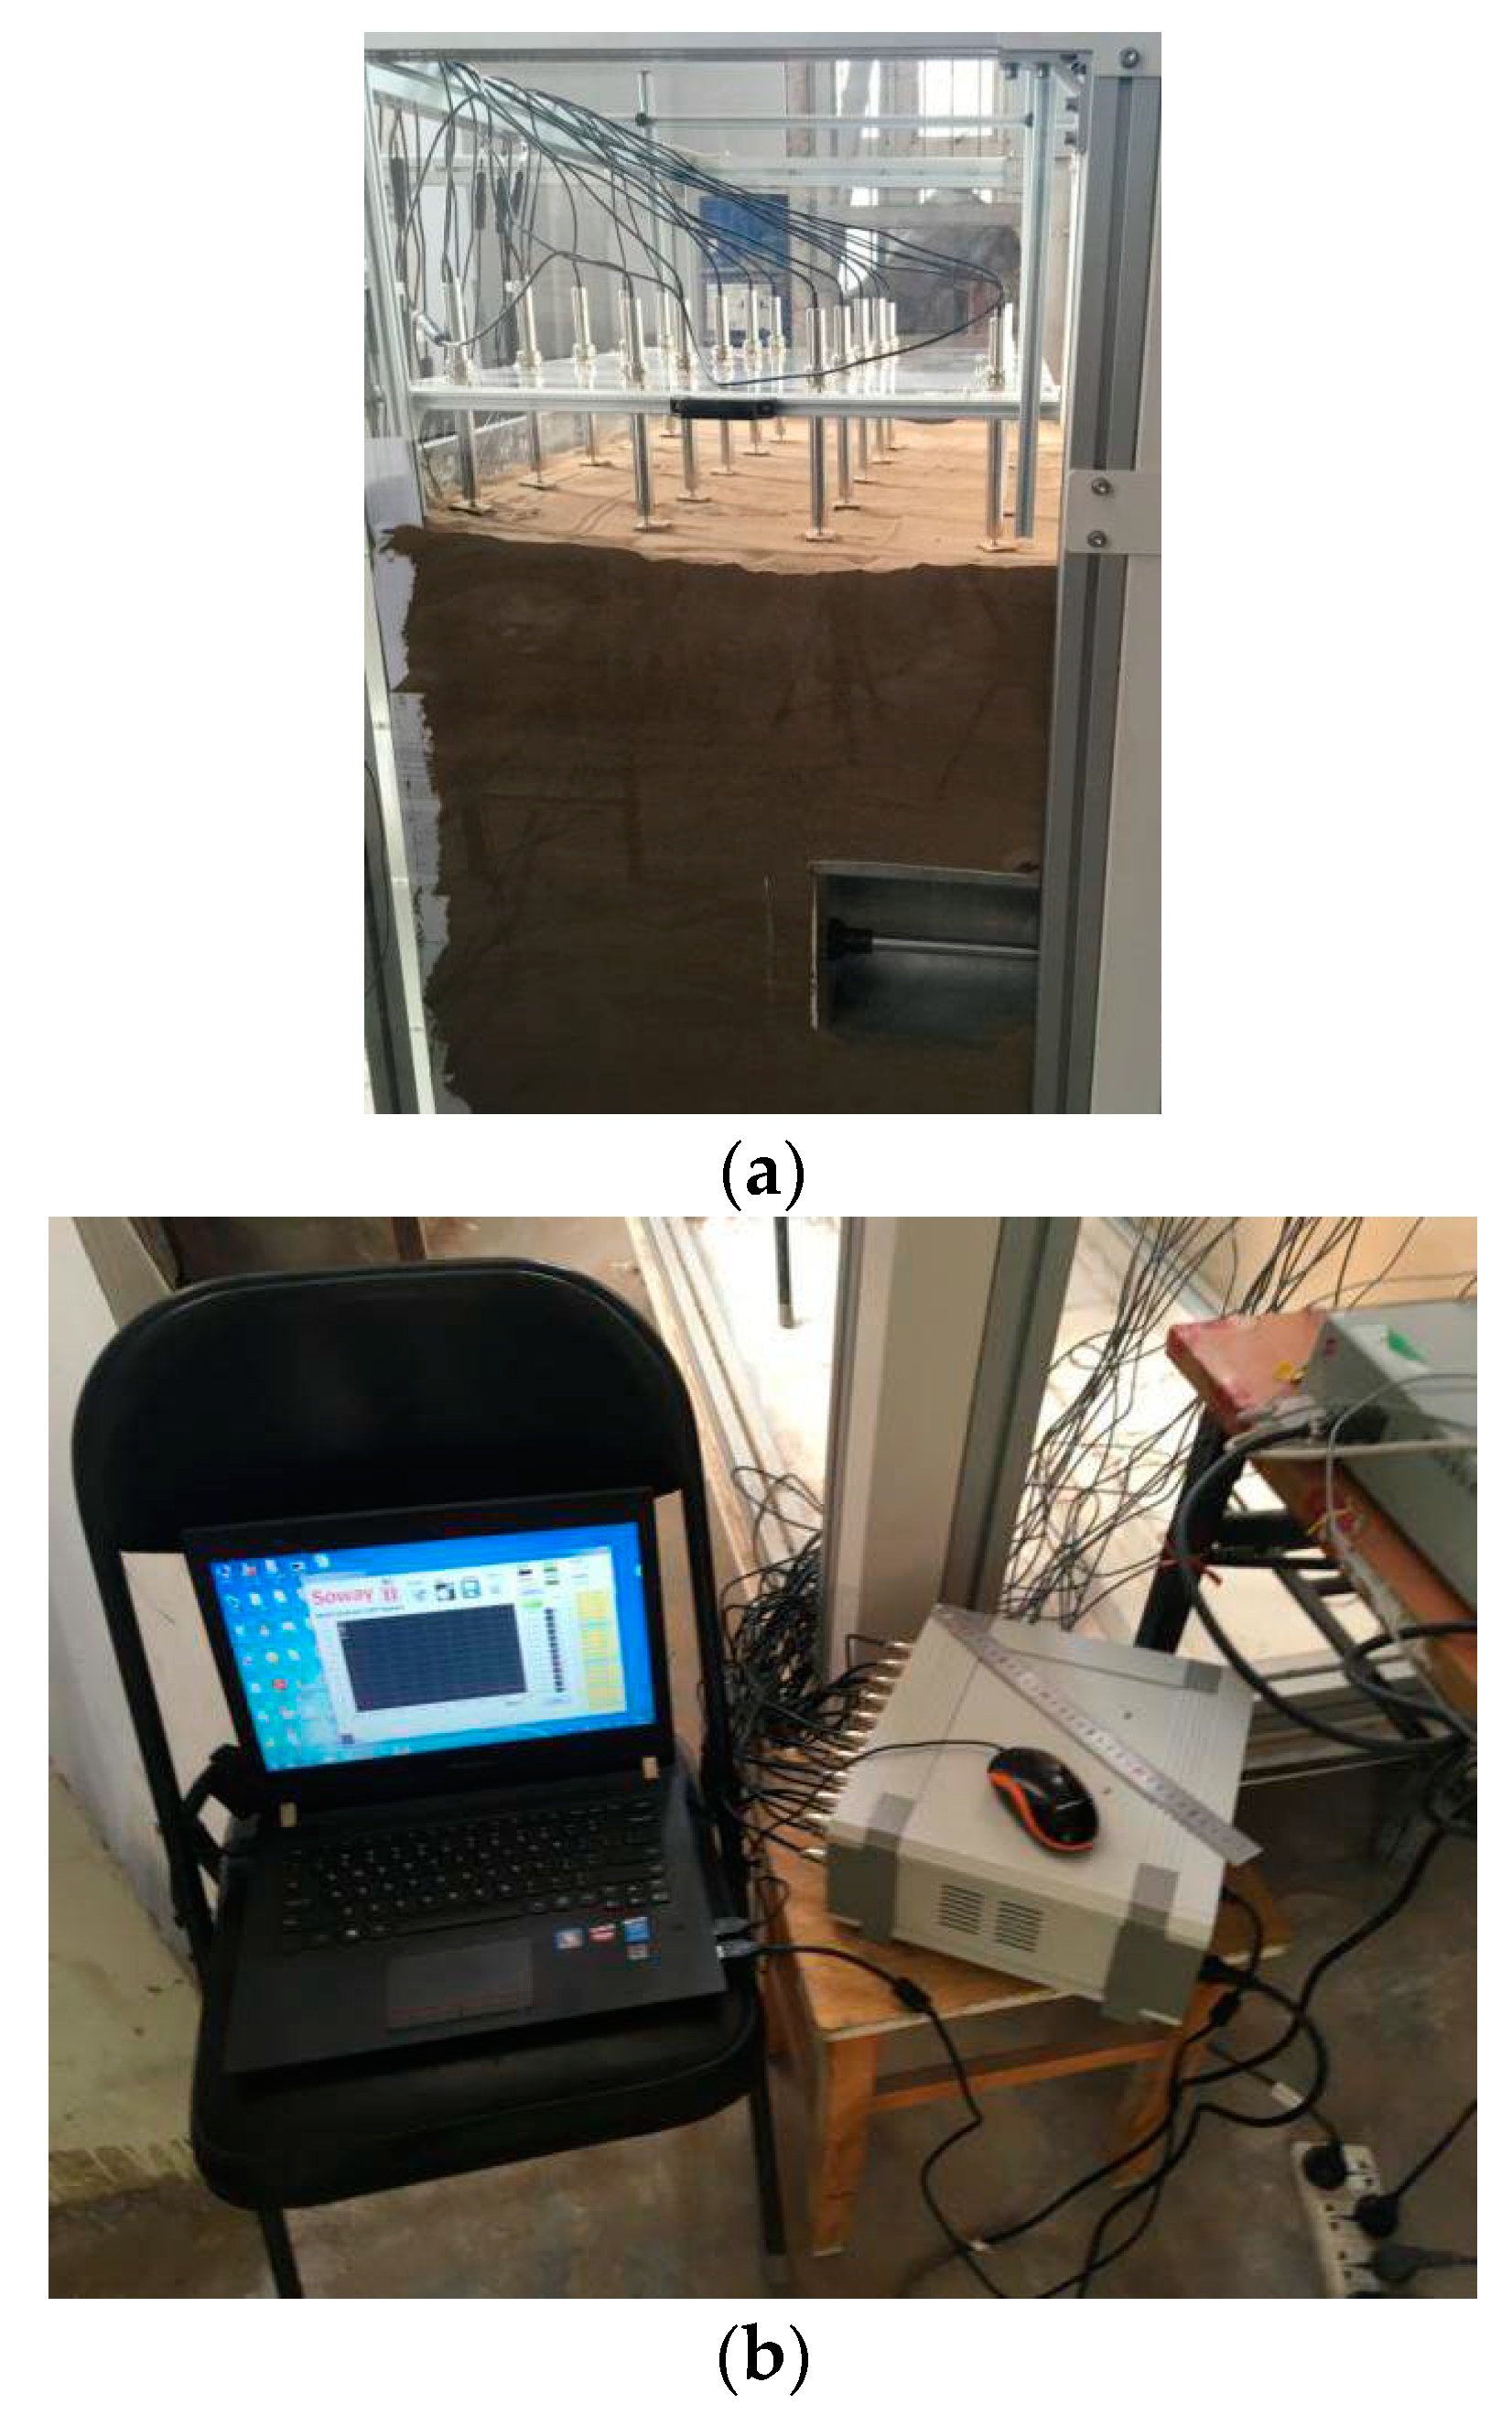
2.1. Test Setup

The symmetrical model test bench device for the stability of the excavated surface of shallow tunnel is composed of transparent Plexiglas plate and steel plate. The net space of the inner cavity is 1.6 × 1.5 × 1.5 m, as shown in Figure 1. The thickness of the transparent Plexiglas plate is 20 mm. A circular tunnel with a diameter of 20 cm is reserved on the steel plate. The excavation device is divided into two parts: full section and semi section, which are located in the middle and left side of the front steel plate, respectively.
The excavation and measuring devices of the model bench are divided into two parts, as shown in Figure 2. The part located in the cavity of the model frame includes a metal cylinder and piston simulating the tunnel lining (or segment). The cylinder is fixed on the inner wall of the front plate with screws, and the piston is welded to the circular shaft to provide supporting force. The external part of the model bench is a reaction frame consisting of a reaction frame, a pressure sensor, an angle gauge and a handle. The pressure sensor is located between the circular shaft welded behind the piston, and the threaded shaft is connected by the handle to measure the axial force of the entire circular shaft. The semi section tunnel excavation device located on the left side of the front plate is similar to the full section and is also divided into two parts. The interior of the model cavity becomes semi cylinder and semi-circular piston, and the rest part is the same as the simulation device of full section tunnel excavation. The displacement of the organic panel of the excavated surface can be removed by rotating the handle thread on the reaction frame. The displacement is controlled at 1 mm/lap, each circle is divided into 10 cases, and the tiny movement of 0.01 mm/times can be realized. The gap between the Plexiglas panel and the shield shell is smeared to seal to prevent sand from infiltrating into the shield shell. After a calibration test, the friction force of the support device and the shield steel cylinder accounts for about 5% of the axial force measured by the axial force meter.
The panel can be moved back and forth with 200 mm, which meets the requirement of model test analysis for failure and evacuation. The diameter of the simulated tunnel is 20 cm: 40 cm from the bottom of the model and 65 cm from the Plexiglas plates on both sides. The distance is more than twice the diameter of the tunnel model, which can greatly reduce the influence of boundary effect on the results during the test.
The whole progressive failure process of the sands on the tunnel face of the model platform was photographed by high-definition digital camera, and the velocity field change and instability mode of the square sand soil before the tunnel excavation were analyzed and recorded, as shown in Figure 3.
Twenty LVDT displacement sensors are arranged evenly along the surface of the whole experimental model to record the surface subsidence (Figure 4a). The LVDT displacement sensors for measuring surface subsidence are connected to the computer, and the real-time monitoring of surface displacement is carried out by using the analysis software provided by Soway company, and the data are saved for post-processing analysis (Figure 4b,c).

2.2. Test Materials

The two-ton experimental materials used for this test are Beijing standard river sand. After drying, the water content is controlled at about 0.5%. The grade of sand is uniform, specific gravity is 2.65, and d50 is 0.38 mm. Maximum dry density is 1.75 g/cm3, and minimum dry density is 1.48 g/cm3. Maximum pore ratio is 0.70, and minimum pore ratio is 0.40. Vibration compaction method is used in the test, which indicates that the height of each fill is 10 cm, and then compacted to the expected compactness. Density of sand under this compactness is 1.65 g/cm3. By direct shear test, the internal friction angle of sand is 37.5°.

2.3. Test Procedures

Shield tunnel excavation mainly includes face excavation, lining ring support and shield tail synchronous grouting. Since the research emphasis of this section is on the law of the tunnel face support pressure on the deformation and instability of sands, some measures should be taken to eliminate the influence of other important factors in construction. The concrete implementation method adopts one-time excavation to a certain distance, which excludes the cumulative deformation of surrounding rock caused by multi-step excavation. Three different buried depth conditions (C/D = 0.5, 1.0, 2.0) are designed. The purpose of the semi-section device test is to observe the failure range, morphology and progressive failure characteristics of sand in front of the tunnel face under three different buried depth conditions (C/D = 0.5, 1.0, 2.0) and the direct phenomena such as the generation and development direction of shear slip zone. The purpose of the full-section device experiment is to measure the characteristics of the support pressure on the tunnel face during the instability failure; to determine the initial value, the limit value and the residual value of the support pressure; and to record the settlement changes in each part of the surface. The specific test procedure adopts the control method of retracting the Plexiglas panel to a predetermined displacement through a rotating handle connected with a rebar pipe.
According to the above methods, six groups of model tests were carried out, which includes three groups of full-section test and three groups of semi-section test under different buried depth conditions (C/D = 0.5, 1.0, 2.0). The semi-section tests are shown in Figure 5.

3. Experimental Results and Analyses

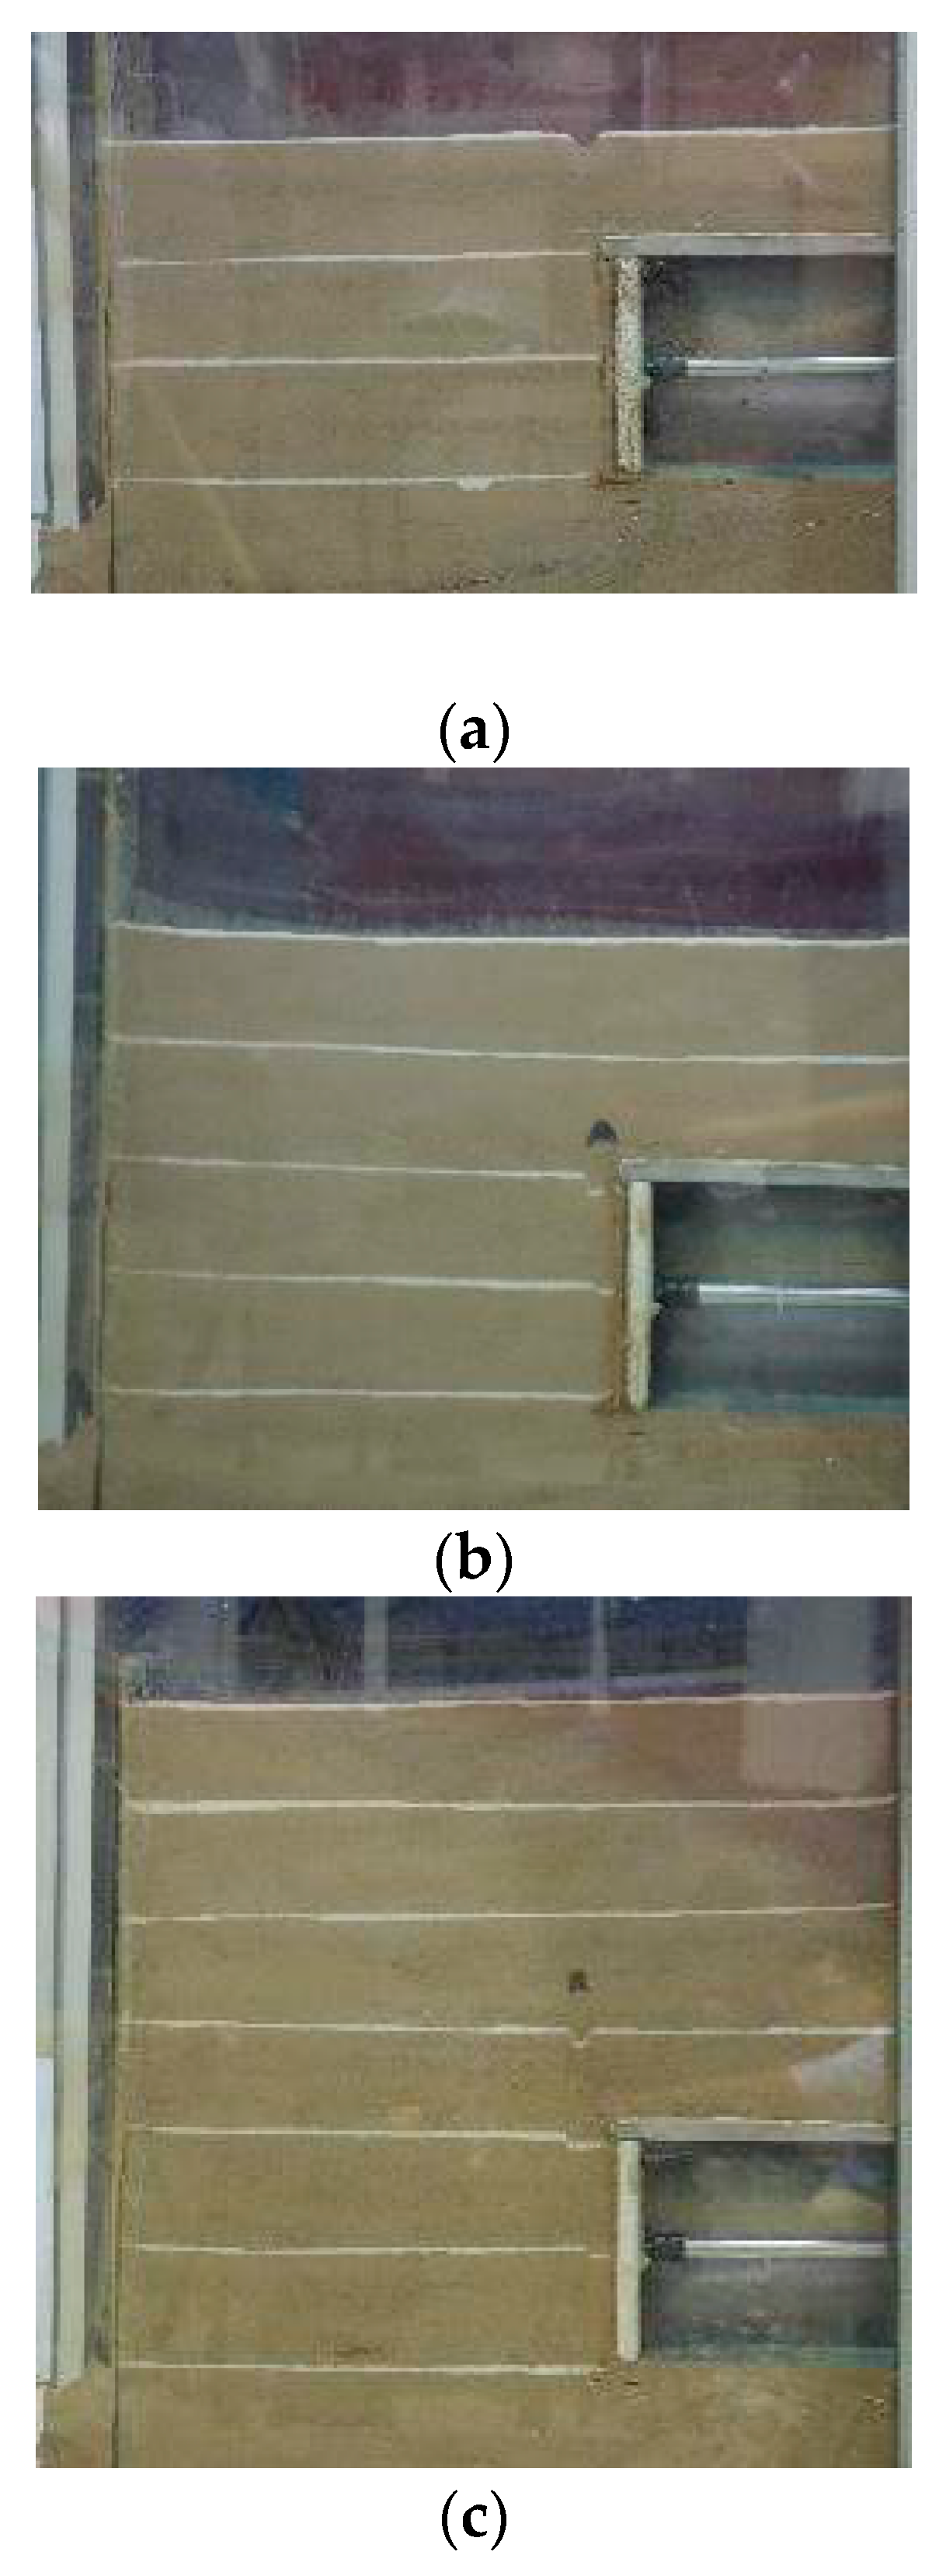
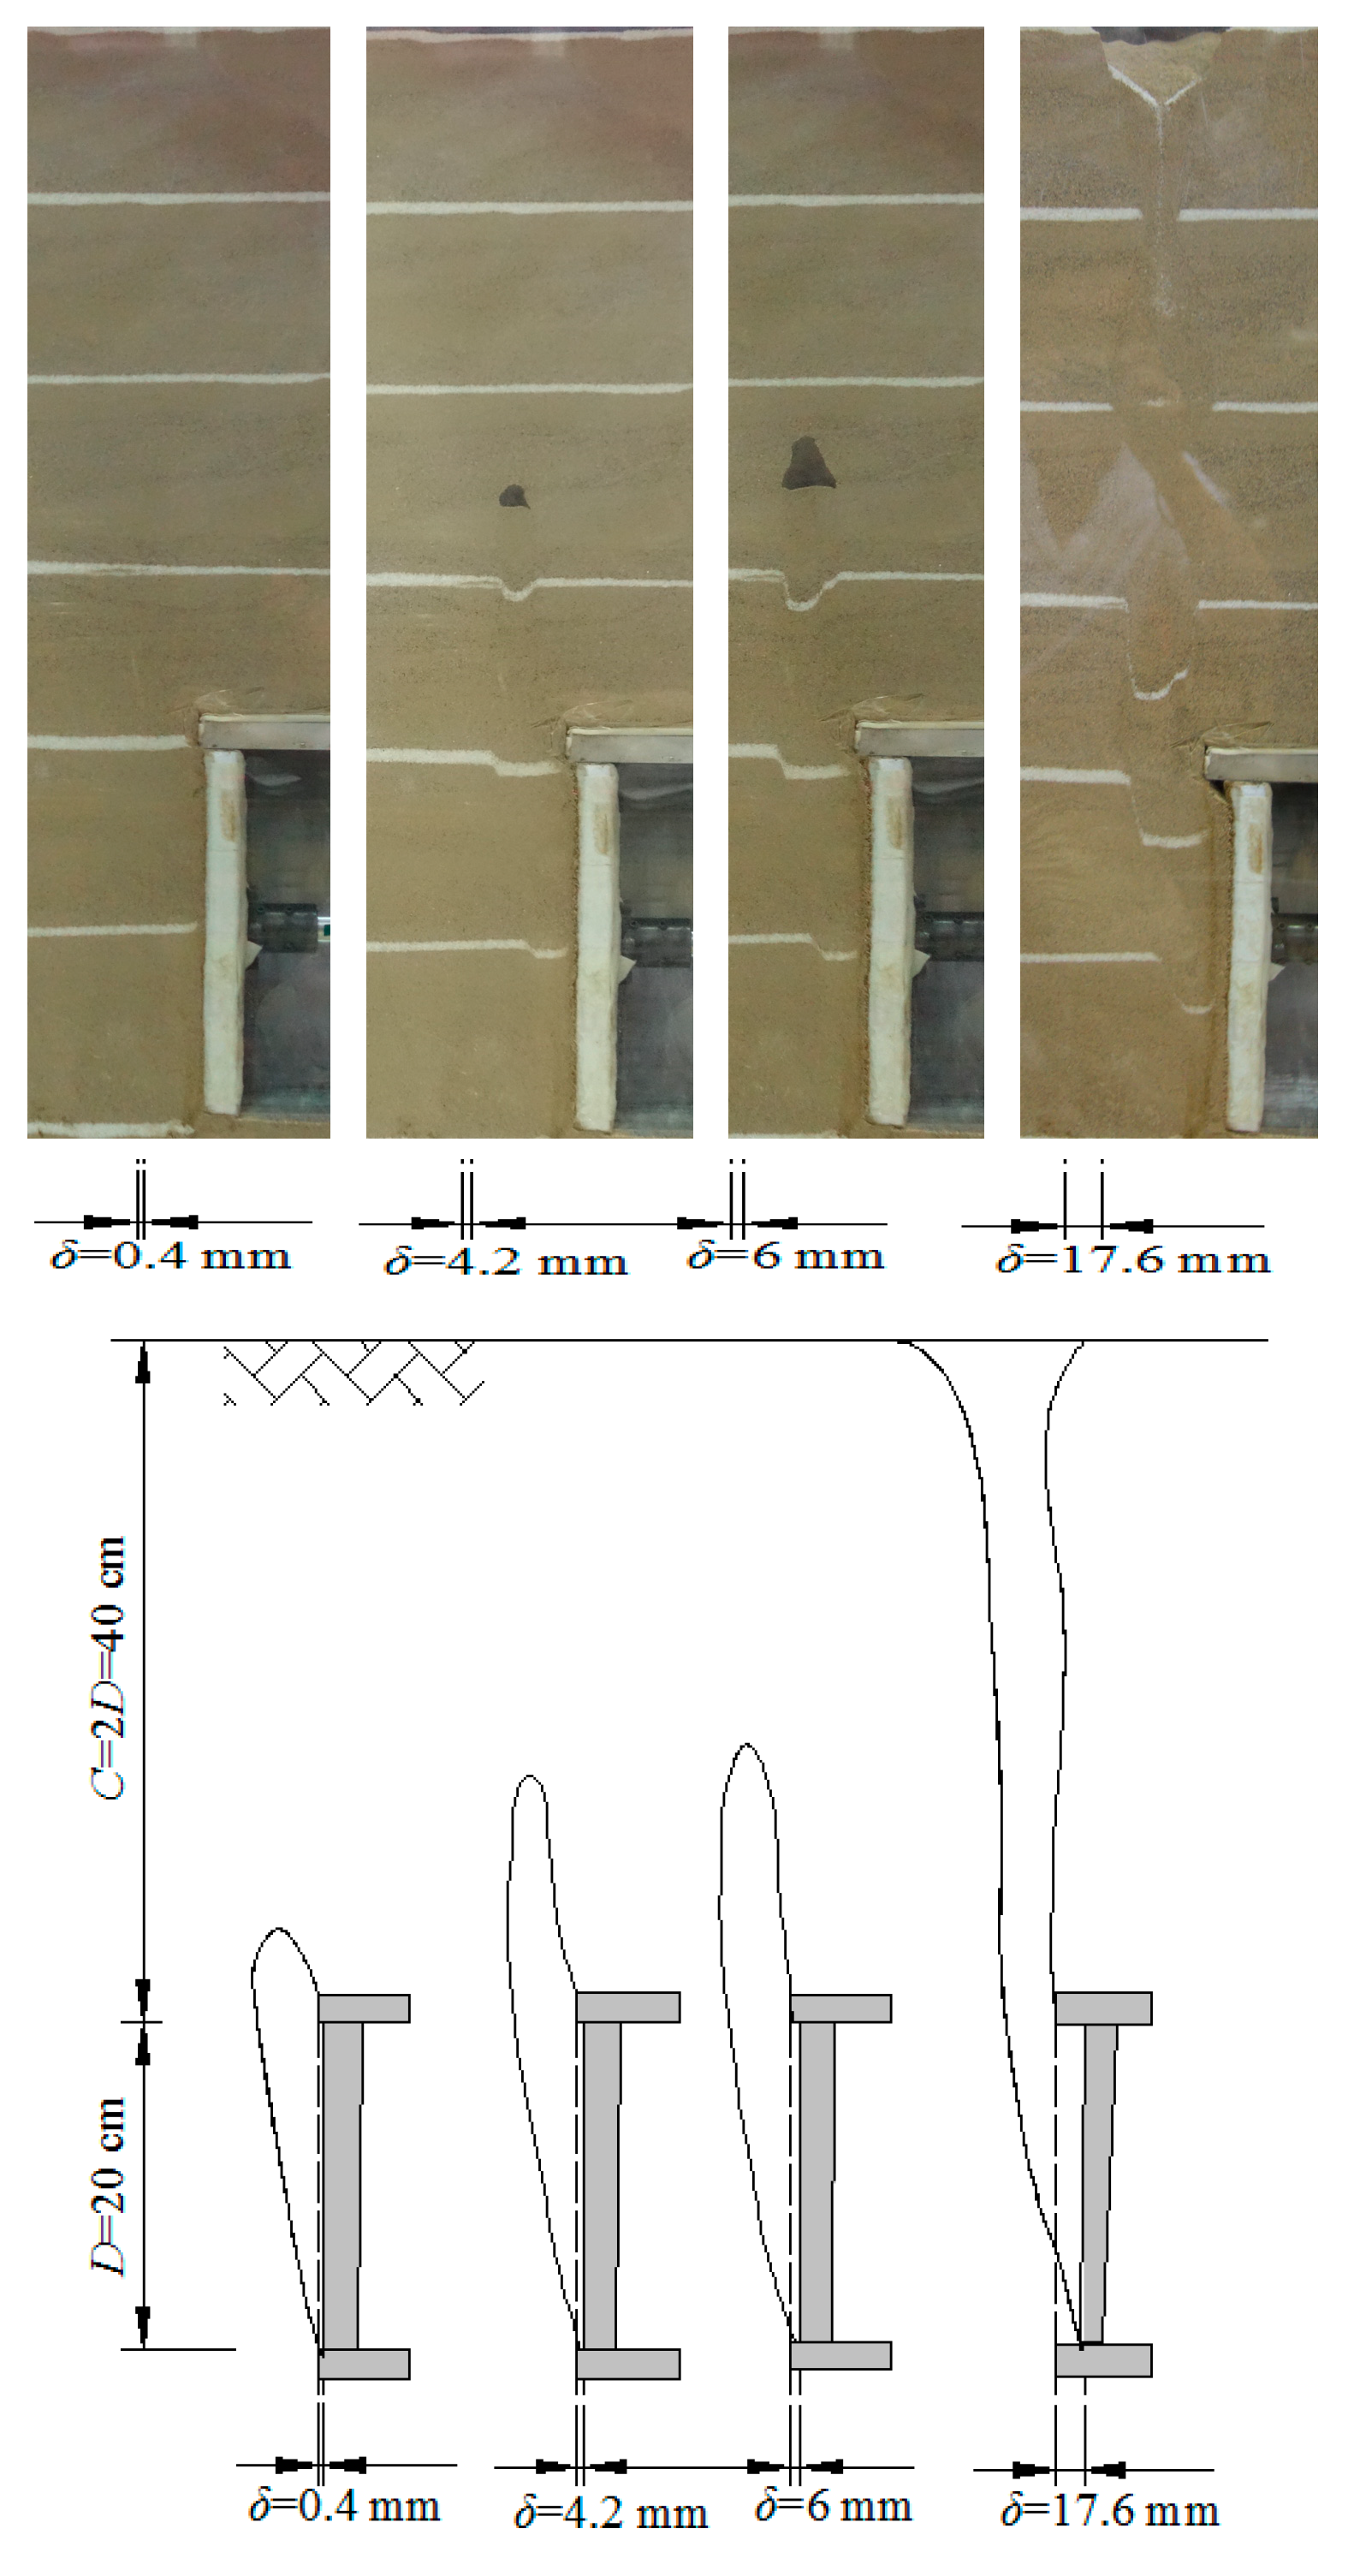
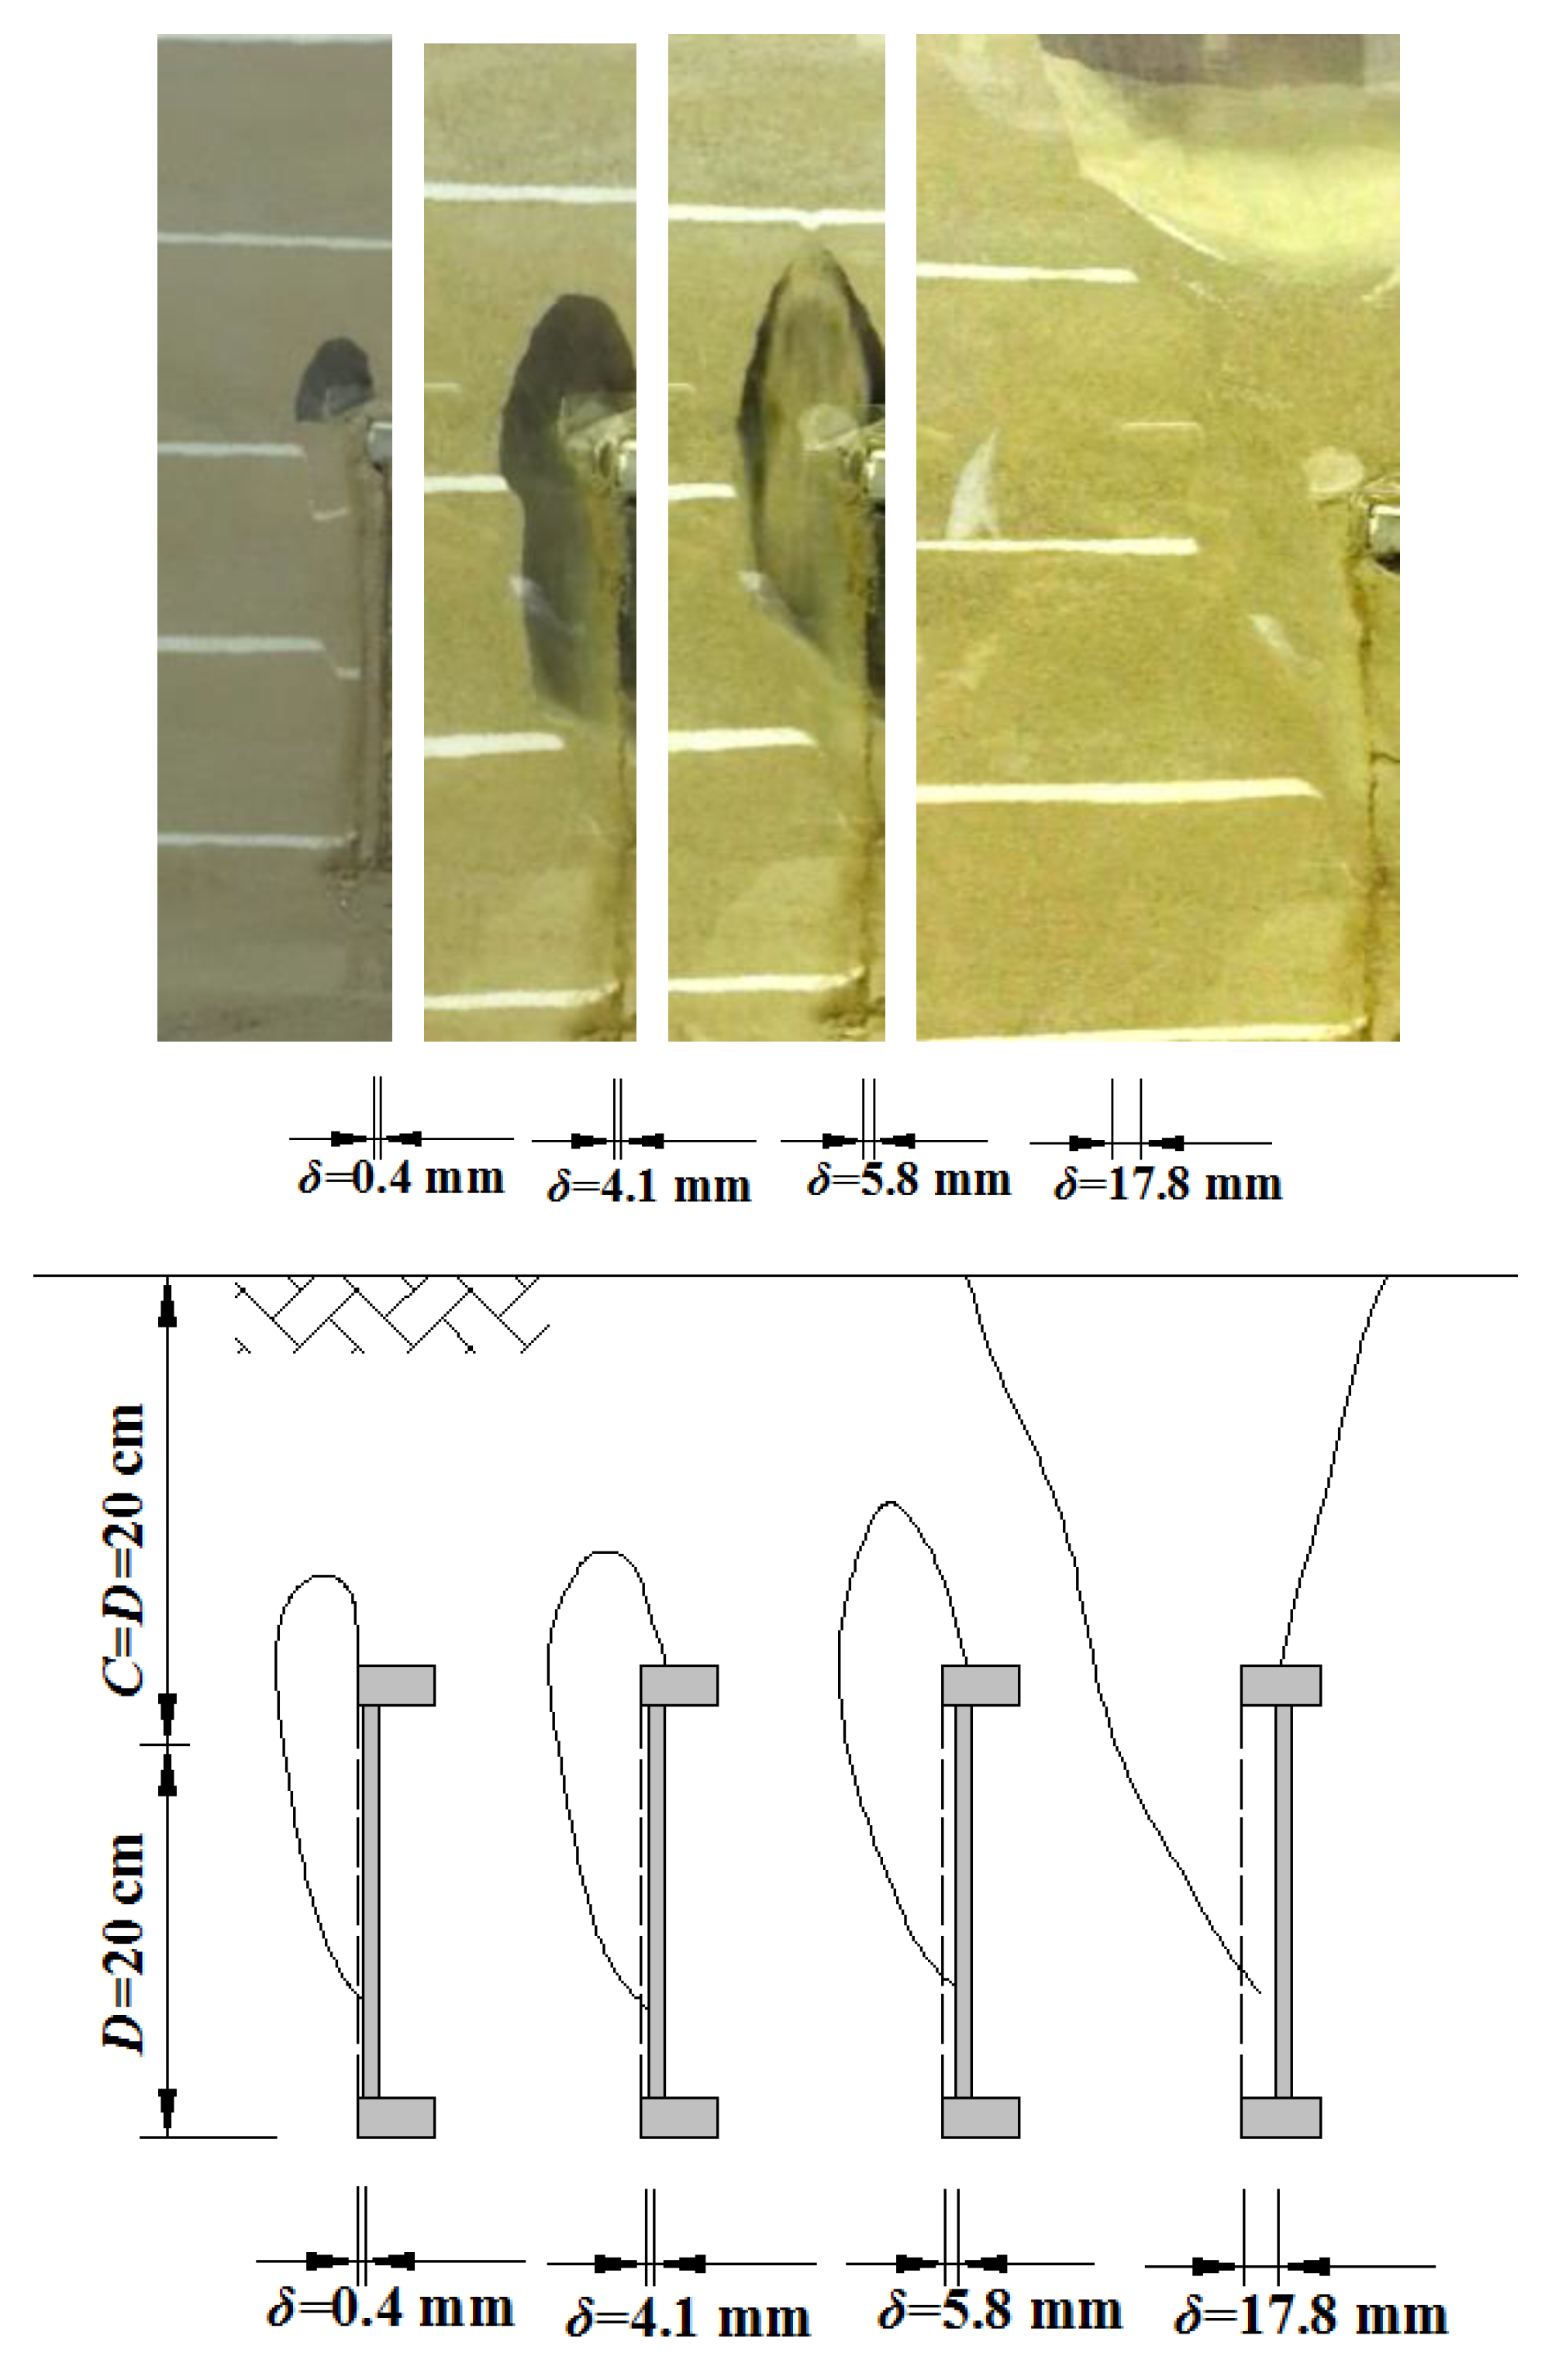
3.1. Progressive Instability Mode

Based on the analysis of three different buried depth conditions (C/D = 0.5, 1.0, 2.0), the development and evolution of shear failure band, the formation and morphological evolution of pressure arch, the failure range of instability and the progressive instability mode in the sands in front of the tunnel face are analyzed. The shallower the tunnel is buried, the more quickly the tunnel face is unstable. Therefore, first of all, the characteristics of each stage are extracted and distinguished from the condition (C/D = 2.0).
Under the condition of buried depth (C/D = 2.0), the semi-section progressive instability failure test of the tunnel face is shown in Figure 6. With the withdrawal of Plexiglas support panel on the tunnel face, the shear failure band appears first in the sand in front of the tunnel face and gradually develops from the bottom of the tunnel. The shape curve of the whole shear failure band is a logarithmic spiral curve. As the experiment continues, the shear failure band in front of the tunnel face continues to develop upward to slightly exceed the top of the tunnel. When the shear failure band of the sand develops, the support pressure of the upper sand soil is reduced, and the stress redistribution of the upper sand soil is also produced accordingly. At the metal cylinder of the simulated tunnel lining and outside the shear slip zone, the stress of the sand increases, forming a stable arch foot, and then forming a pressure arch. The shape of the pressure arch is initially presented as “ellipsoid” and then developed into a “triangular cone”. Finally, continue to develop upward through the surface and in the surface of the basin collapse pit. The basin collapse pit on the surface continues to expand until the evacuation limit test of the Plexiglas support panel is terminated.
Under the condition of buried depth (C/D = 1.0), the semi-section progressive instability failure test of the tunnel face is shown in Figure 7. Experimental phenomena are basically similar to those under buried depth (C/D = 2.0). With the withdrawal of Plexiglas support panel on the tunnel face, shear failure band is also first appeared in the sand in front of the tunnel face. The pressure arch also appears at the top, and the shape of the pressure arch initially appears as “ellipsoid”, then develops into a “triangle cone”, and finally continues to develop upward to the surface. The difference is that the triangular pressure arch in the test process is short, but the triangular state is obvious. The basin collapse pit on the surface is also larger than the test result under the condition of buried depth (C/D = 2.0).
The semi-section progressive instability failure test of the tunnel face under buried depth (C/D = 0.5) is similar to that under buried depth (C/D = 1.0 or 2.0), but the whole test process is short, and the complete and continuous phenomenon cannot be observed. As the Plexiglas support panel of the tunnel face retreats, the sand in front of the tunnel face first appears shear failure band, which develops rapidly from the bottom of the tunnel to the surface, and the surface of the basin collapse pit appears and continues to expand. Under the condition of buried depth (C/D = 0.5), it is difficult to capture the obvious form of pressure arch.

3.1.1. Shear Failure Band

By connecting the staggered bands of the layered buried white sand, it can be observed that there are obvious shear failure bands under different buried depths. It is found that the shape curve of the shear failure band is close to logarithmic helix, therefore it is fitted according to logarithmic helix. The fitting equation is set as
r ( θ ) = a e b θ ,
The logarithmic spiral equation is polar coordinate, and the origin is located at the edge of the tunnel face, as shown in Figure 8. Among them, the a and b are two undetermined coefficients. The fitting results are shown in Table 1.

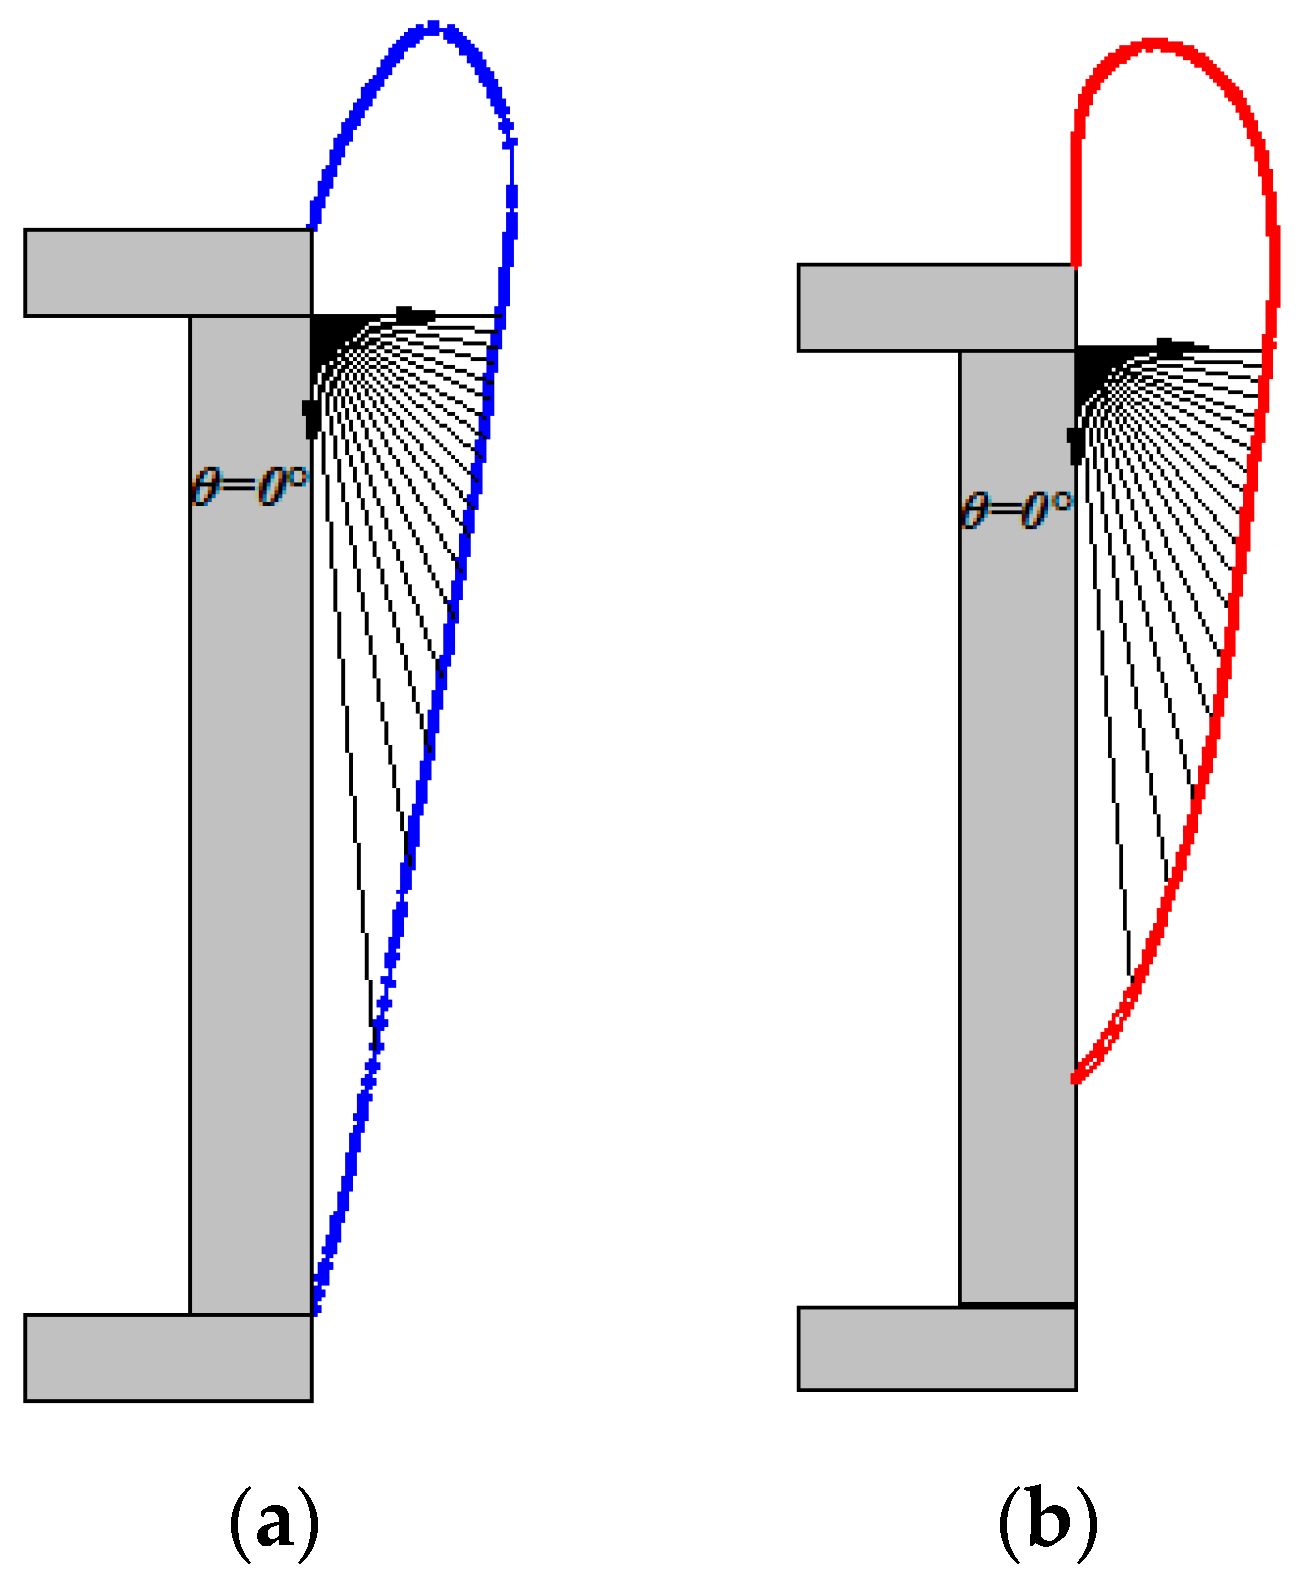
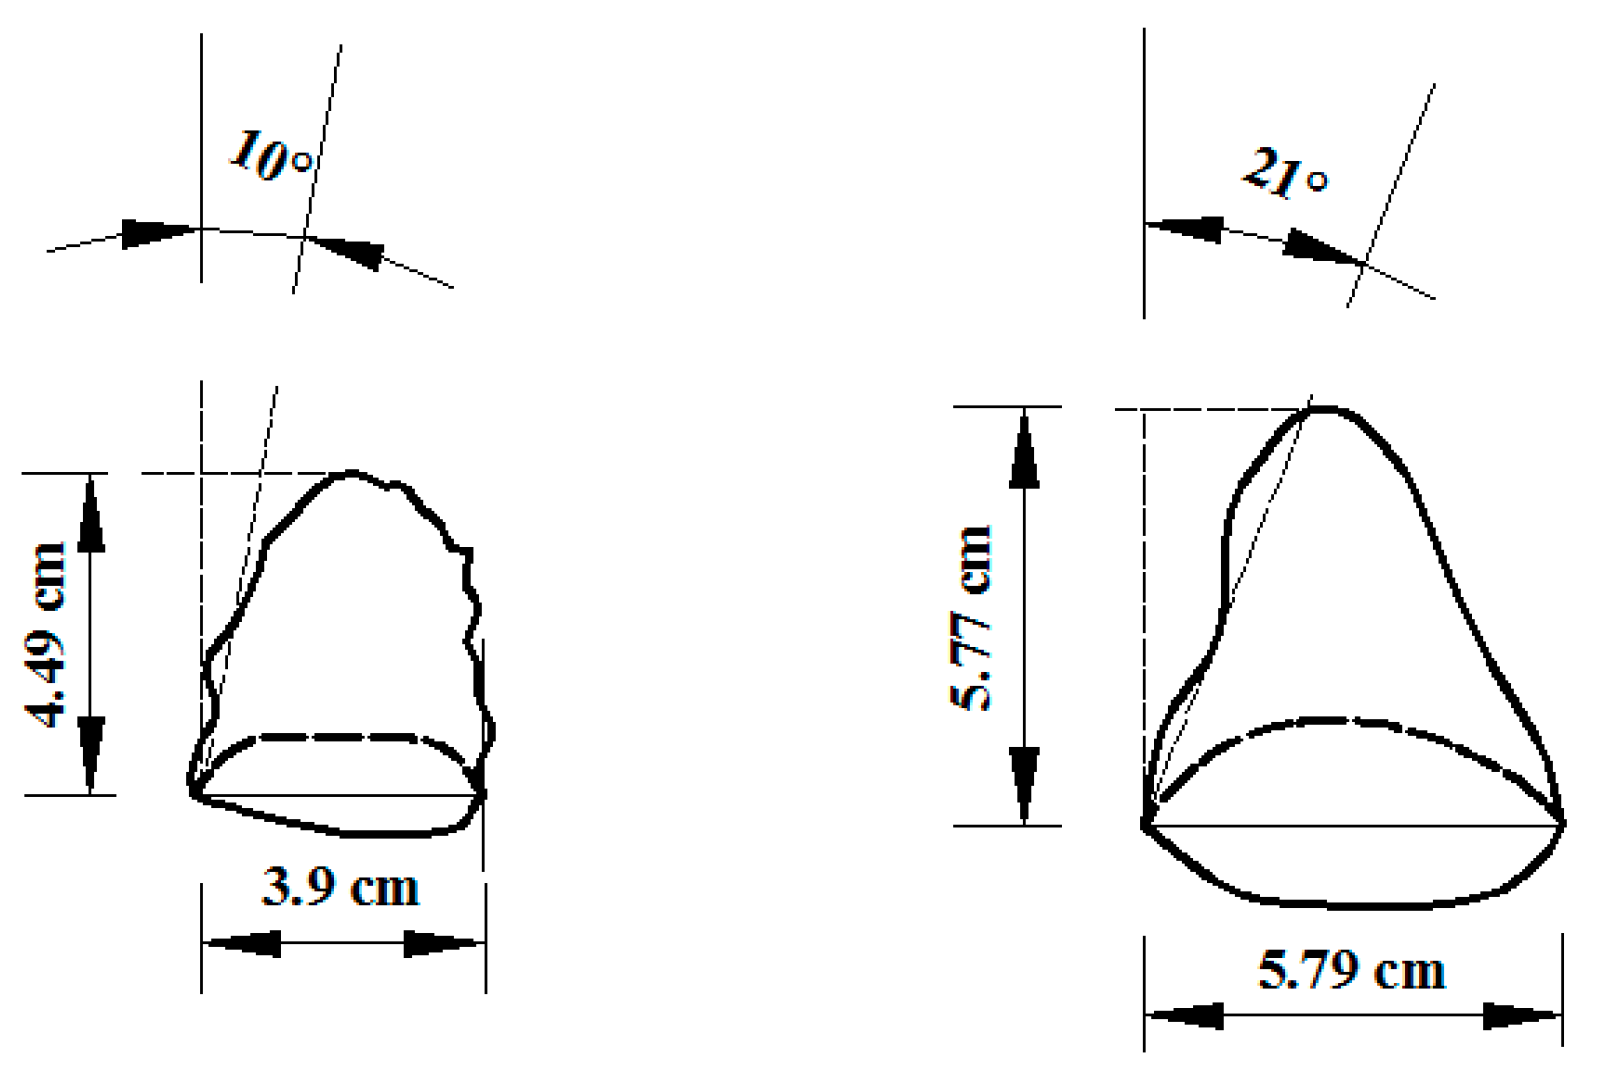
3.1.2. Pressure Arch

With the tunnel excavation, the stress of surrounding rock is redistributed, the stress of surrounding rock in the loose area is released, and then collapse occurs. If the surrounding rock deformation is not controlled, the surrounding rock deformation will lead to further release and adjustment of surrounding rock stress, loosening and softening until collapse again, and collapse until the final stable pressure arch belt is formed. The shape of the pressure arch is initially presented as “ellipsoid” and then developed into a “triangular cone”. Finally, it continues to develop upward through the surface and on the surface of the basin collapse pit. Analysis of failure pressure arch shape of the tunnel face under buried depth (C/D = 1.0 and 2.0) is shown in Figure 9 and Figure 10.

3.2. The Laws of the Development and Evolution of the Support Pressure on the Tunnel Face

Figure 11 show the curve relationship between the measured and normalized tunnel face support pressure and the displacement of the Plexiglas panel. Under the condition of different buried depth ratio, the support pressure of excavated surface is similar to that of the Plexiglas panel. When the Plexiglas panel is not retreated, the supporting pressure of the excavated surface is the initial earth pressure of the formation. With the withdrawal of the Plexiglas support panel, the change process of the support pressure of the excavated surface can be divided into four stages:
(1)
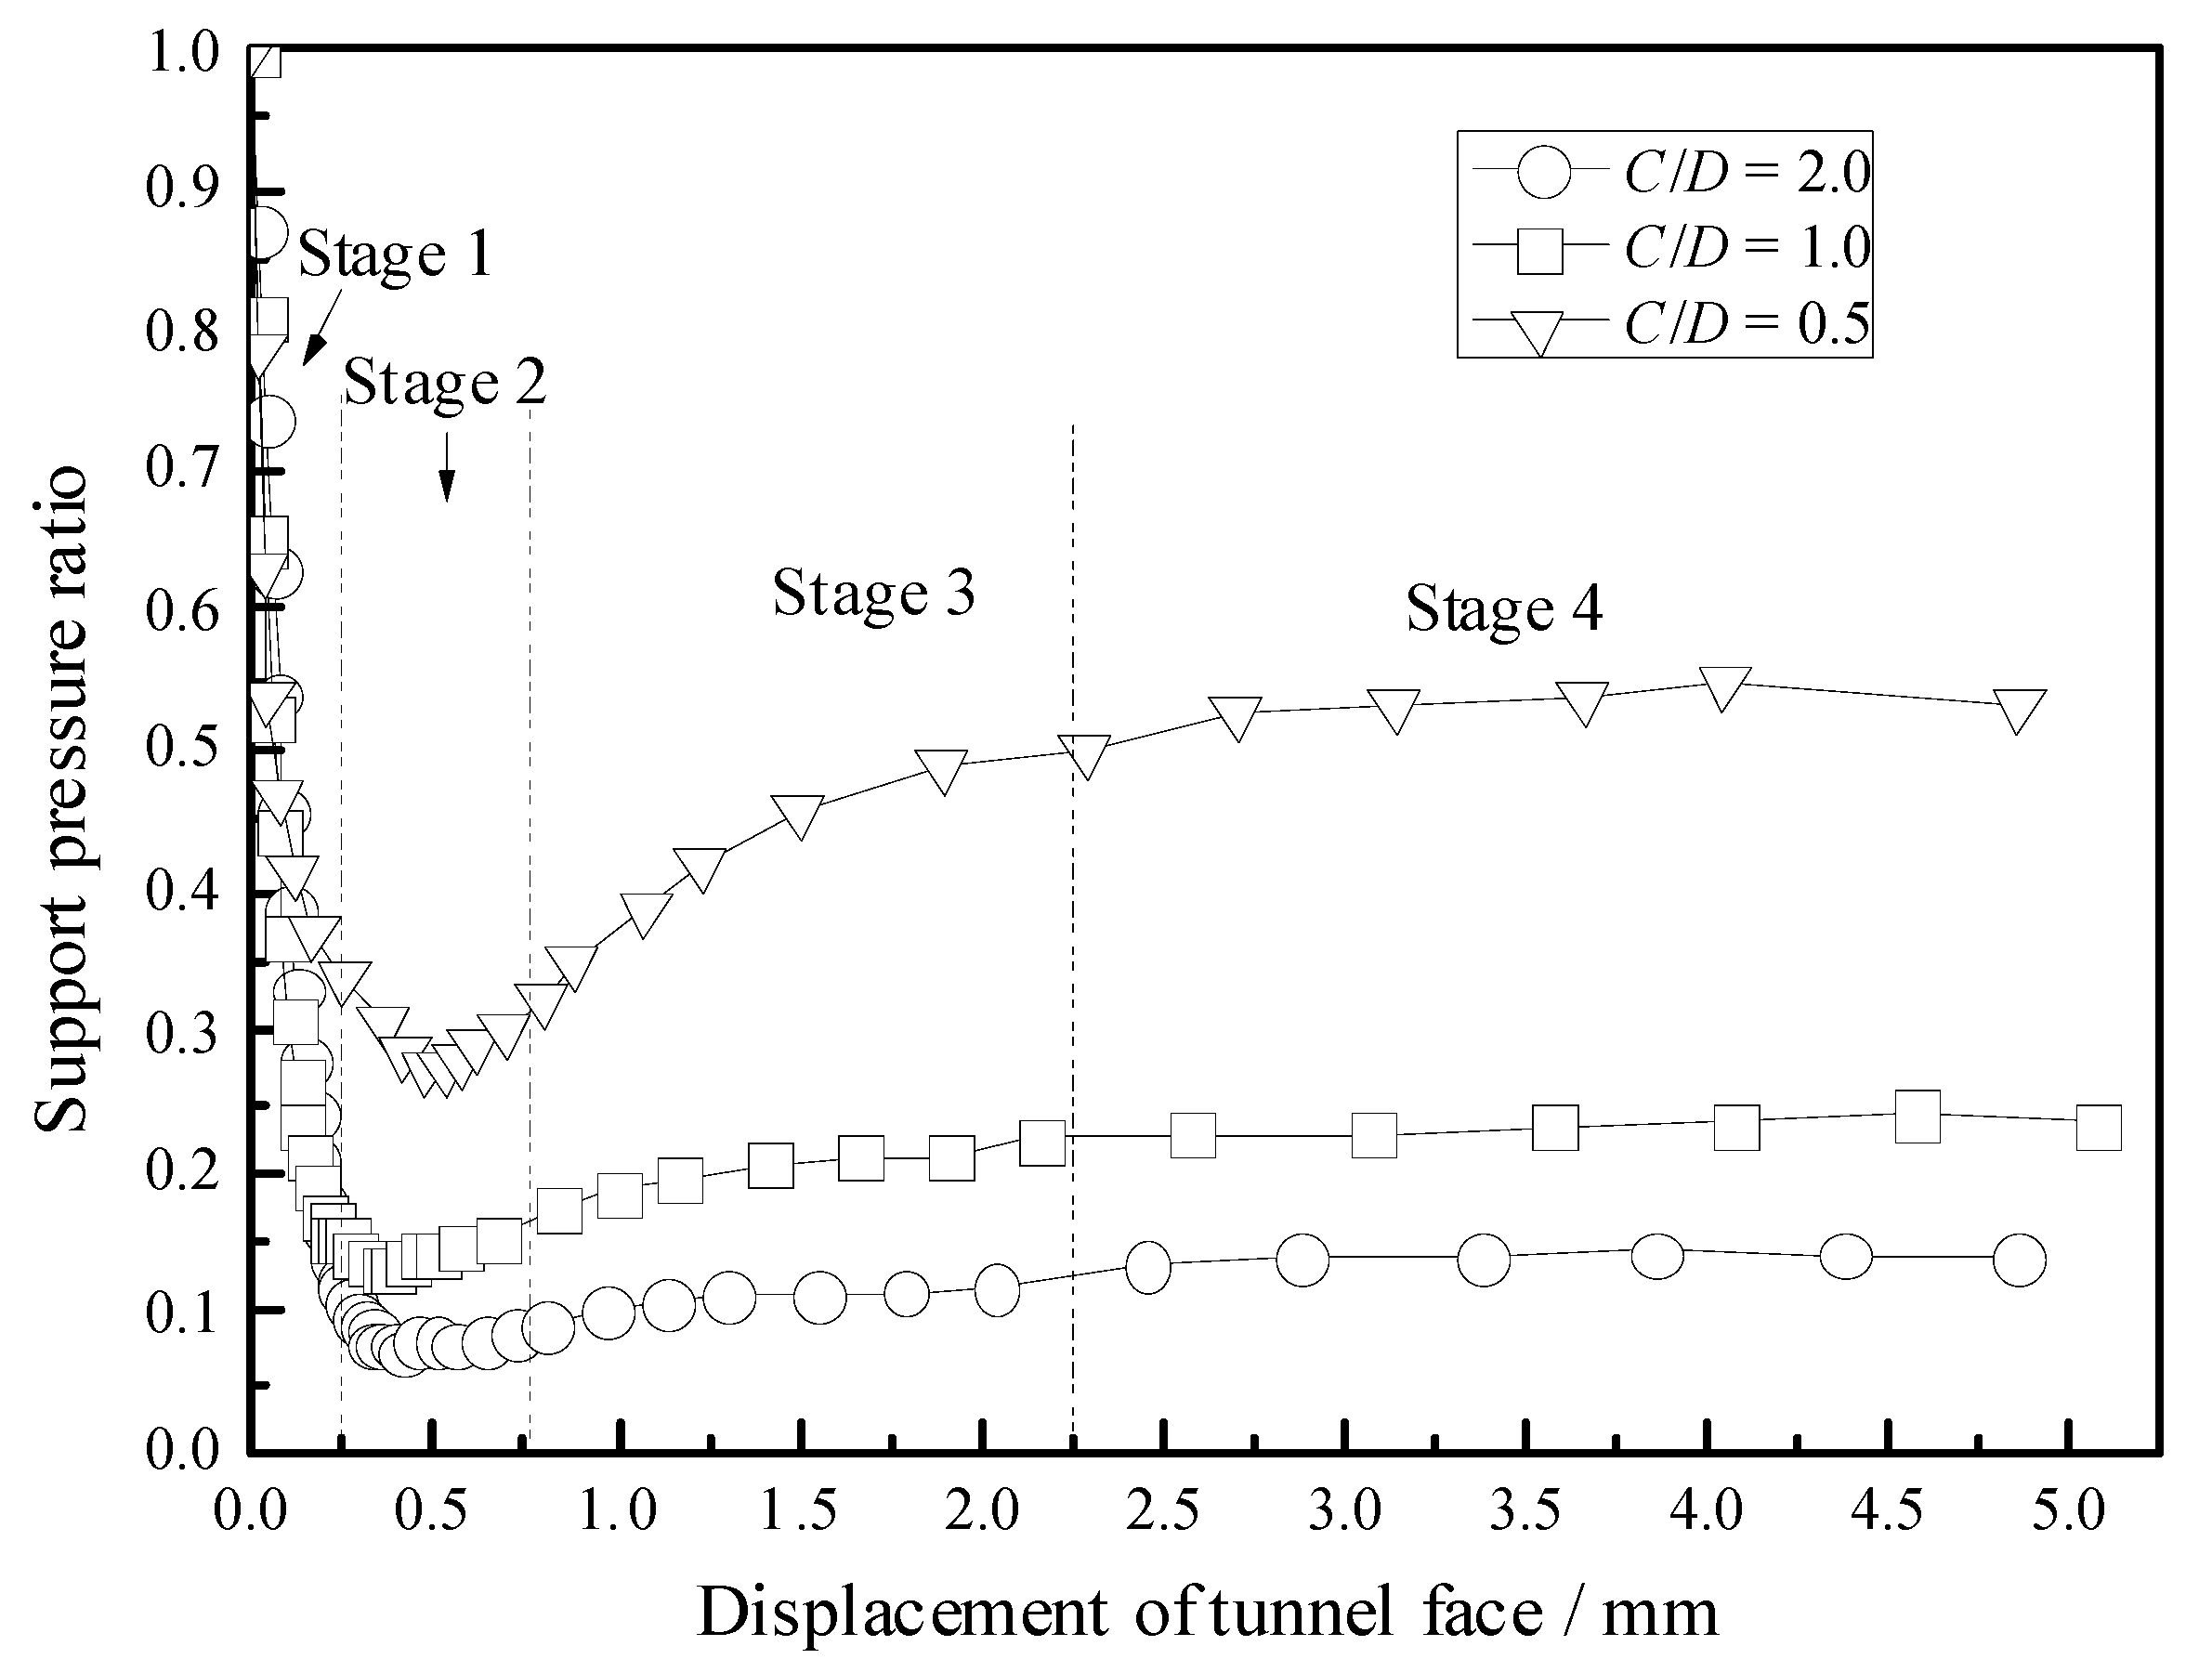
The first stage (rapid decline stage). When the Plexiglas support panel is retreated slightly, the support pressure of the excavated surface will decrease rapidly, and the curve of the support pressure and the displacement of the excavated surface are close to linear. At this stage, shear slip zone occurs.
(2)
The second stage (minimum stage). As the Plexiglas support panel continues to retreat, the downward trend of the support pressure on the excavated surface gradually slows down, the ellipsoid arch is formed and developed, and the support pressure gradually reaches the minimum value, which is called the limit value P. The ellipsoid arch plays a full role, and load proportion of the overlying soil is the largest.
(3)
The third stage (slow rising stage). As the Plexiglas support panel continues to withdraw, an ellipsoid arch forms, and support pressure slowly rises, then forming a temporary stable triangular arch.
(4)
The fourth stage (horizontal stability stage). The loose zone continues to develop to the surface and eventually forms the penetrating surface.

3.3. The Laws of Development and Evolution of the Ground Surface Settlement

Figure 12 shows the relationship between the settlement at the center of the surface settlement trough and the displacement of the Plexiglas panel of the tunnel face under different buried depth ratios. Before the Plexiglas panel is retreated, the settlement value at the center of the surface settlement trough is zero.
When the Plexiglas support panel withdraws a small displacement, the soil is loose, the shear strength plays a role gradually, and the shear failure zone appears. However, the deformation and failure of the strata are not transmitted to the surface. It corresponds to the rapid decline stage of the unstable failure stage of the tunnel face. With the continued retreat of Plexiglas support panel, ellipsoid arch and triangular arch occur, and the deformation and failure of the strata are still not transmitted to the surface. Then, the loose zone continues to develop to the surface and eventually forms the penetrating surface. The morphology of ground surface sink is shown in Figure 13.
It can be seen from the comparative analysis of each stage of support pressure on the tunnel face and ground surface settlement that the ground surface settlement is lagging behind the instability failure of the tunnel face. Therefore, under the influence of buried depth, the monitoring of ground surface settlement in shield construction has lag in judging the stability of the ground surface. Therefore, it is necessary to monitor and control the earth chamber pressure of the tunnel face at the same time to ensure the stability of the shield tunnel face.

4. Conclusions

The laboratory model test is carried out using the self-developed model test platform for studying the stability of the tunnel face during excavation. The standard river sand in Beijing area is used as the surrounding soil. An LVDT displacement sensor, high-precision pressure sensor and high-definition digital camera are used to monitor the evolution and development of surface displacement and subsidence. The development and evolution law of support pressure of the tunnel face and the progressive instability failure mode of sand in front of tunnel are summarized. The main conclusions are as follows:
(1)
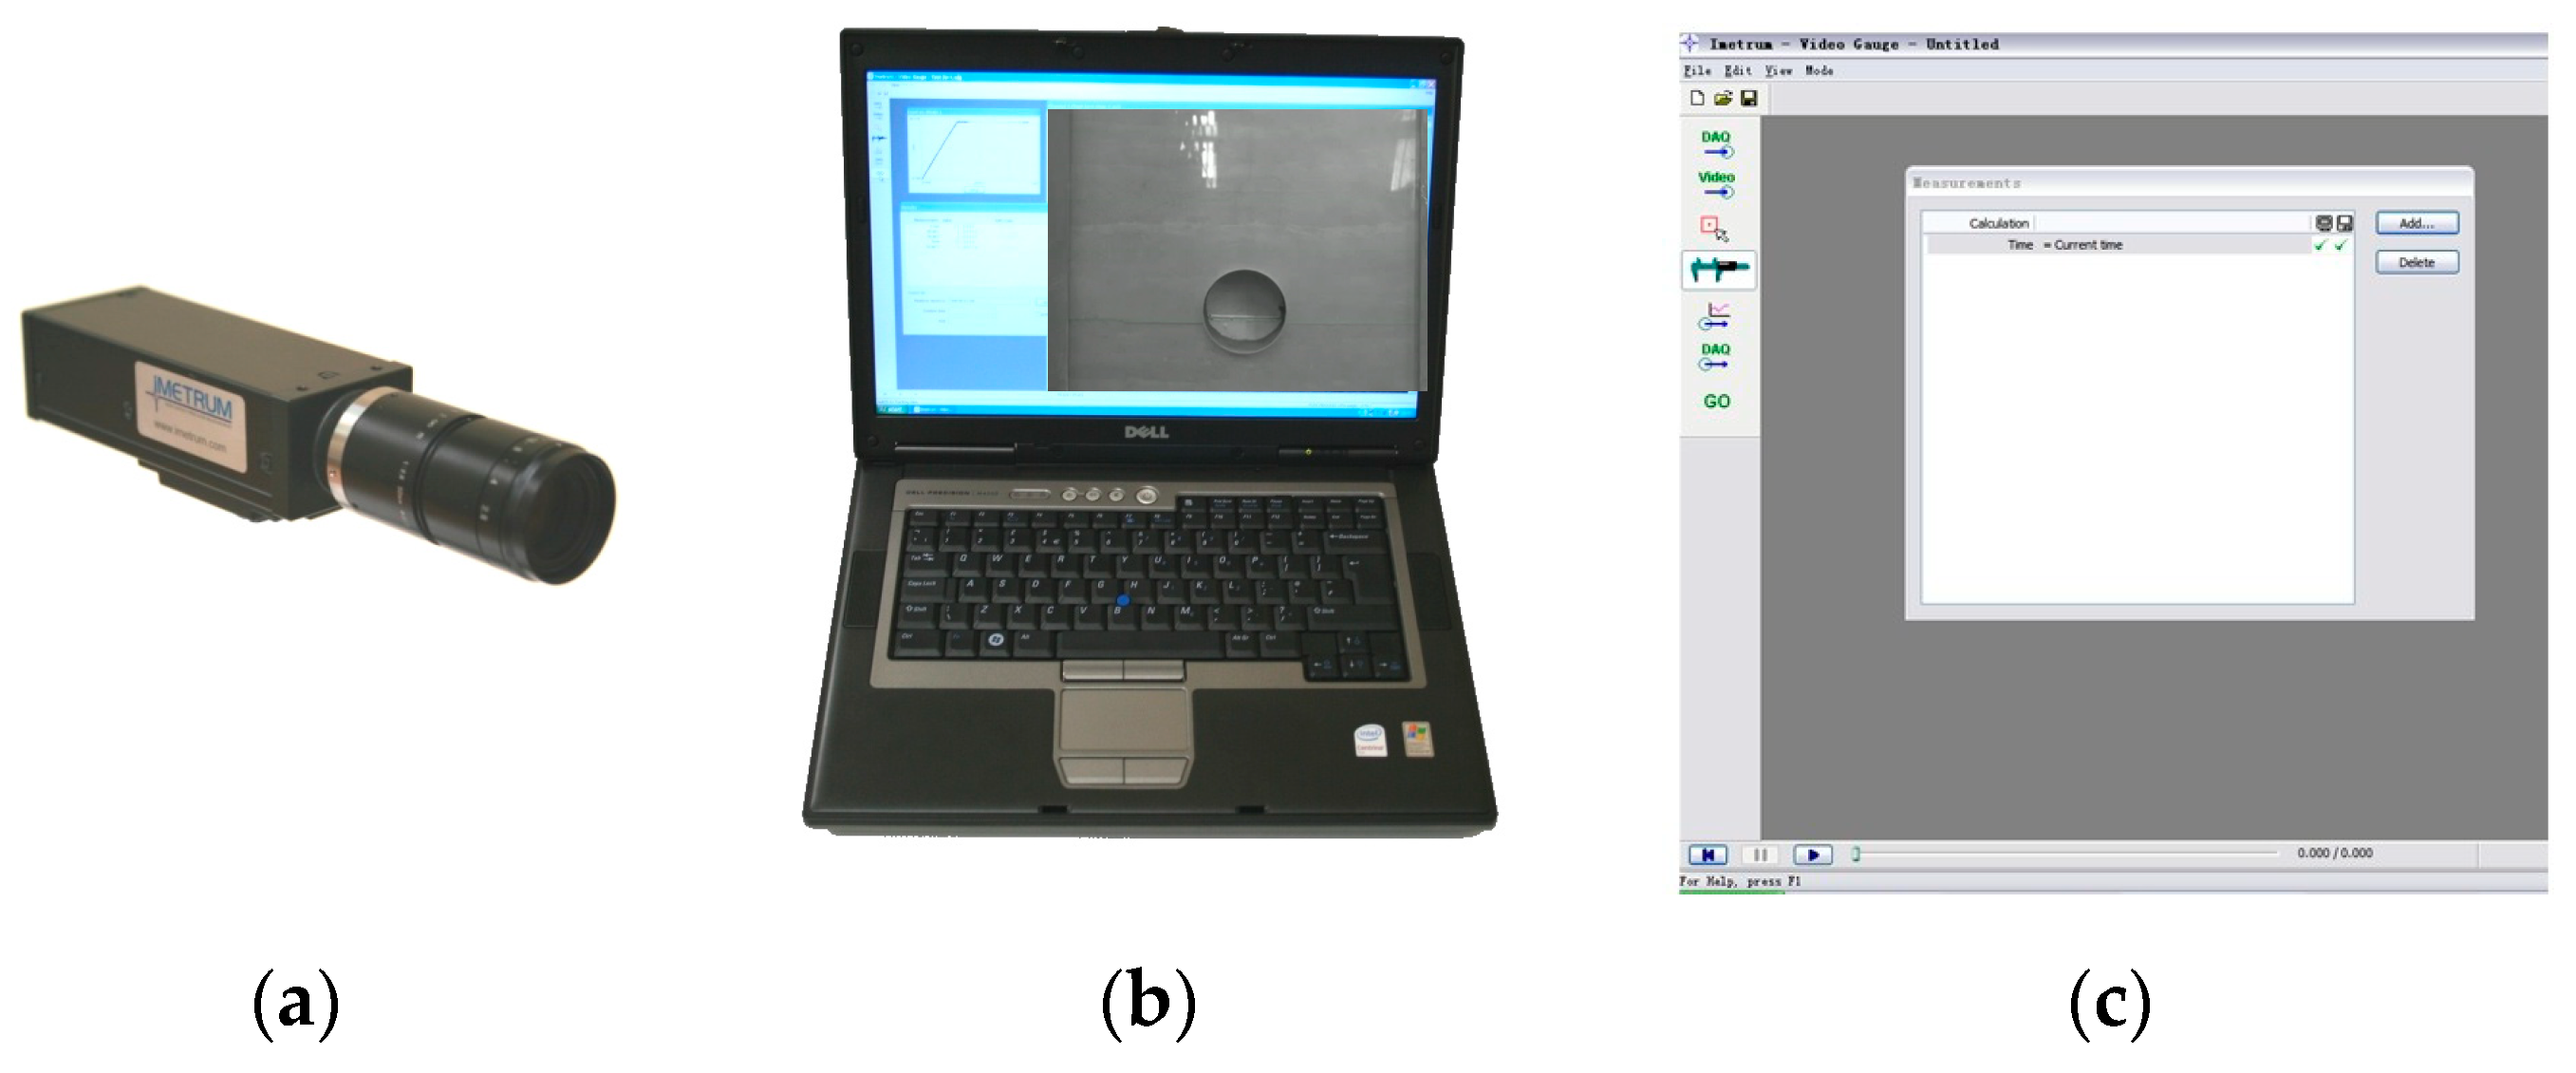
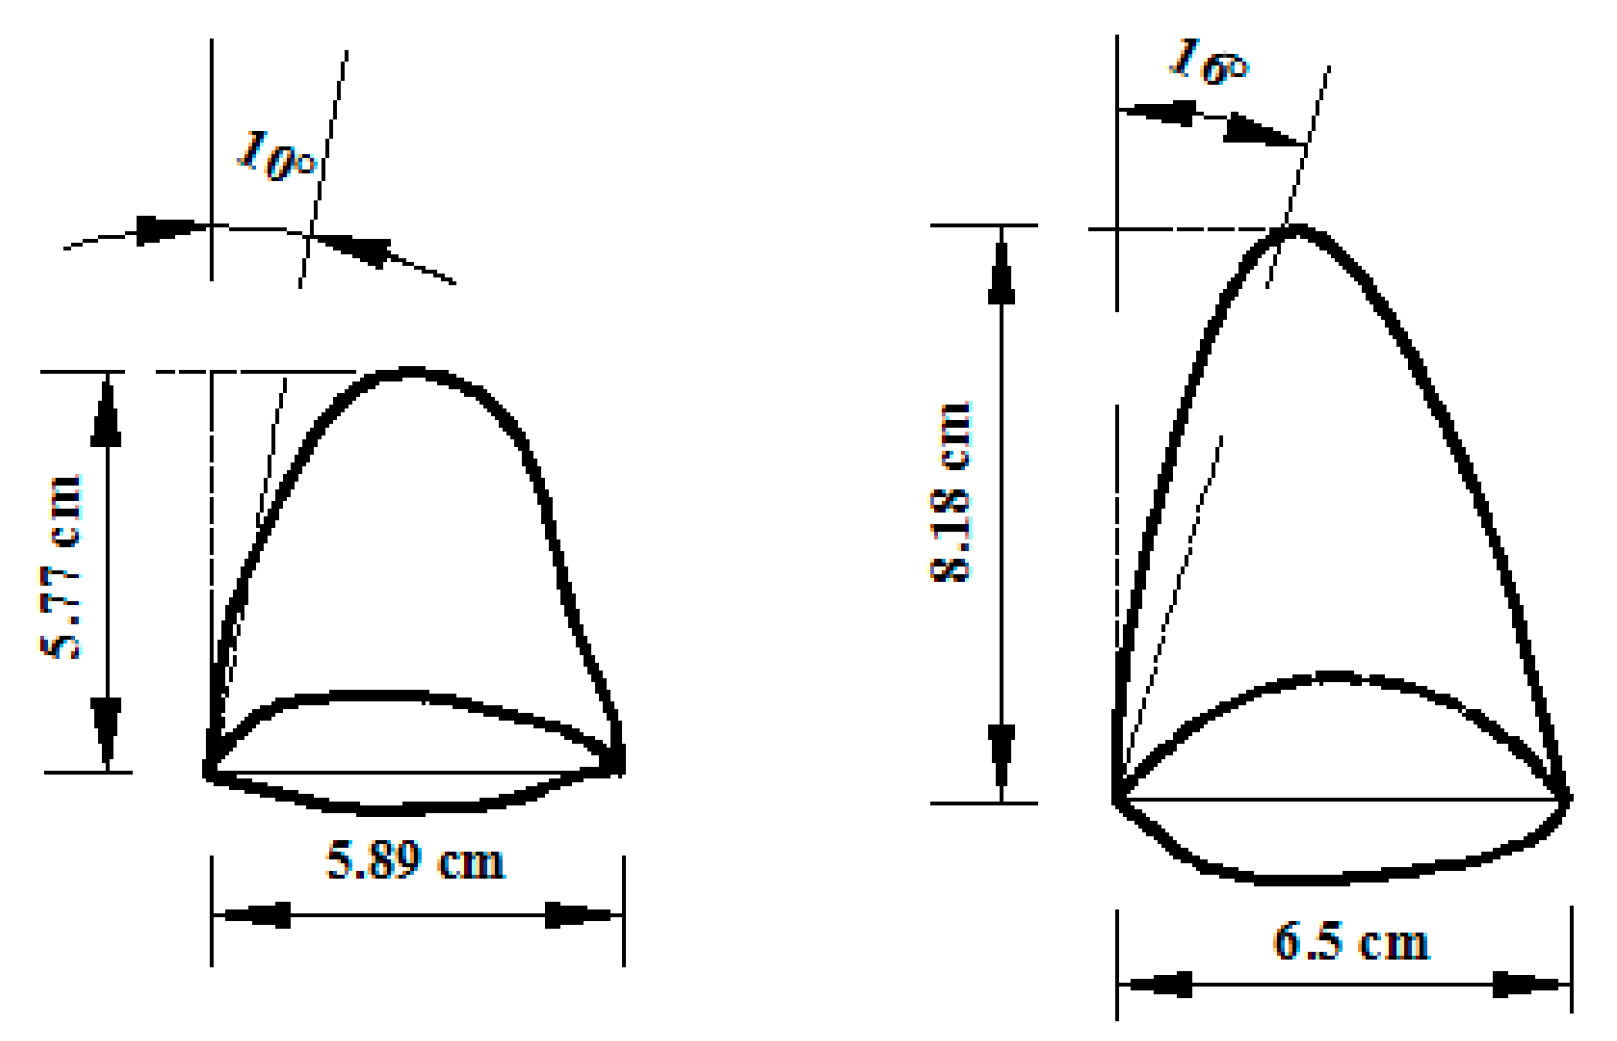
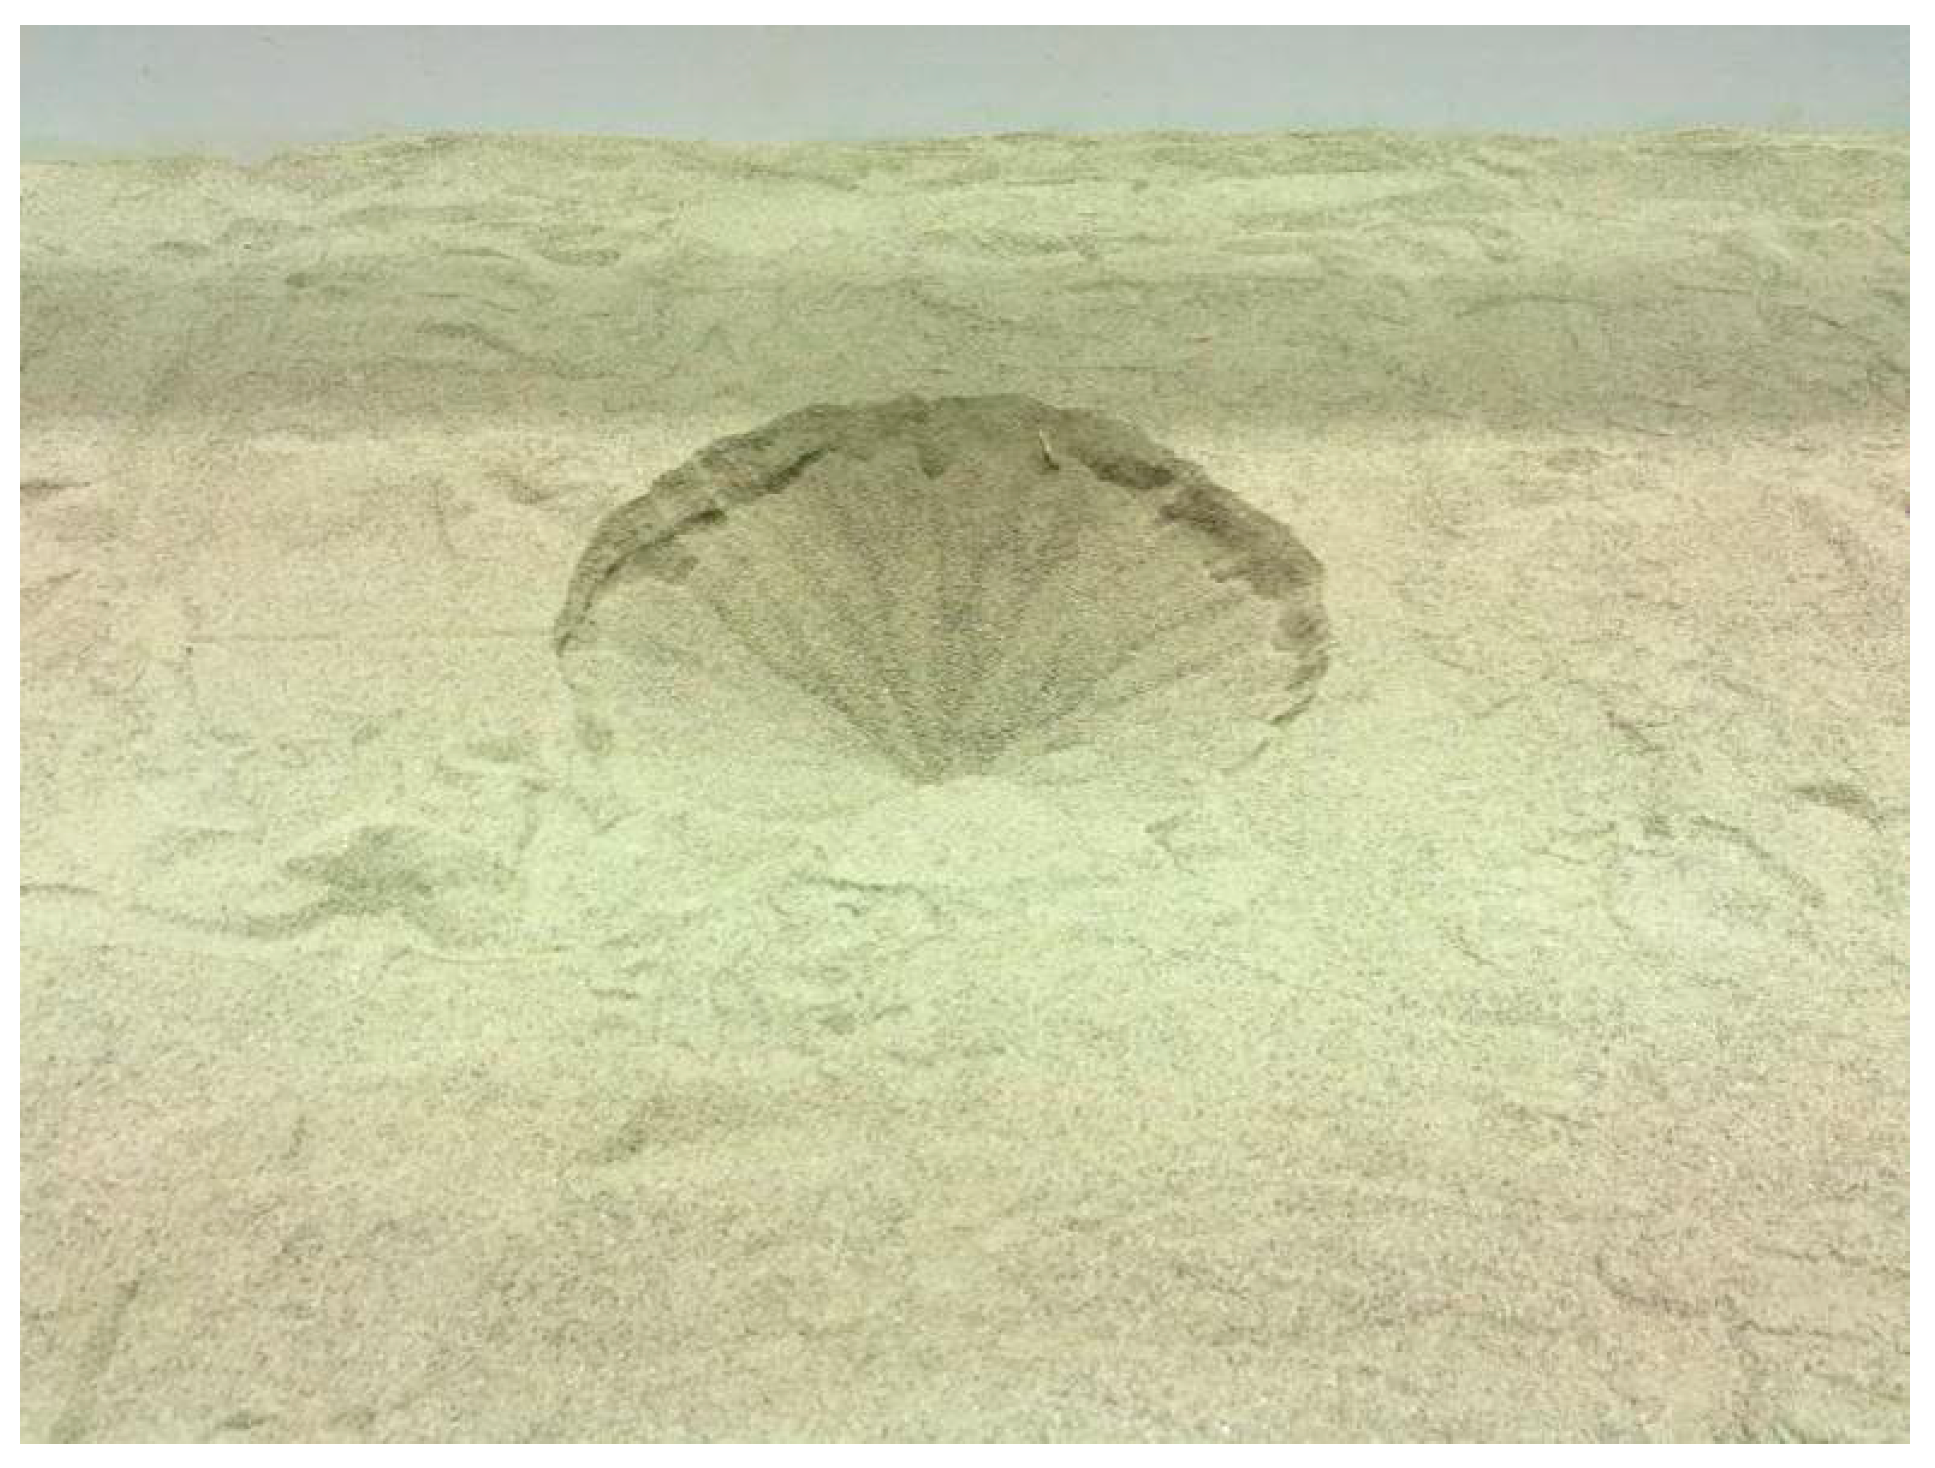
The development and evolution of shear failure band, the formation and morphological evolution of pressure arch, the failure range of instability and the progressive instability mode in the sands in front of the tunnel face are observed by using the high-definition digital camera. The results indicate that the shear failure band appears in sands in front of the tunnel face and develops from the tunnel invert to tunnel crown. The upper sands undergo stress redistribution, and the pressure arch appears in the initial form of “ellipsoid”, then of the “pyramid”.
(2)
The evolution laws of the support pressure on the tunnel face are summarized based on the measurements of the high-precision pressure sensor in the model test. The test results indicate that the support pressure on the tunnel face experiences four stages with moving the organic glass support panel away from the tunnel face, namely, rapid decline stage, the minimum stage, slowly increasing stage and stable stage.
(3)
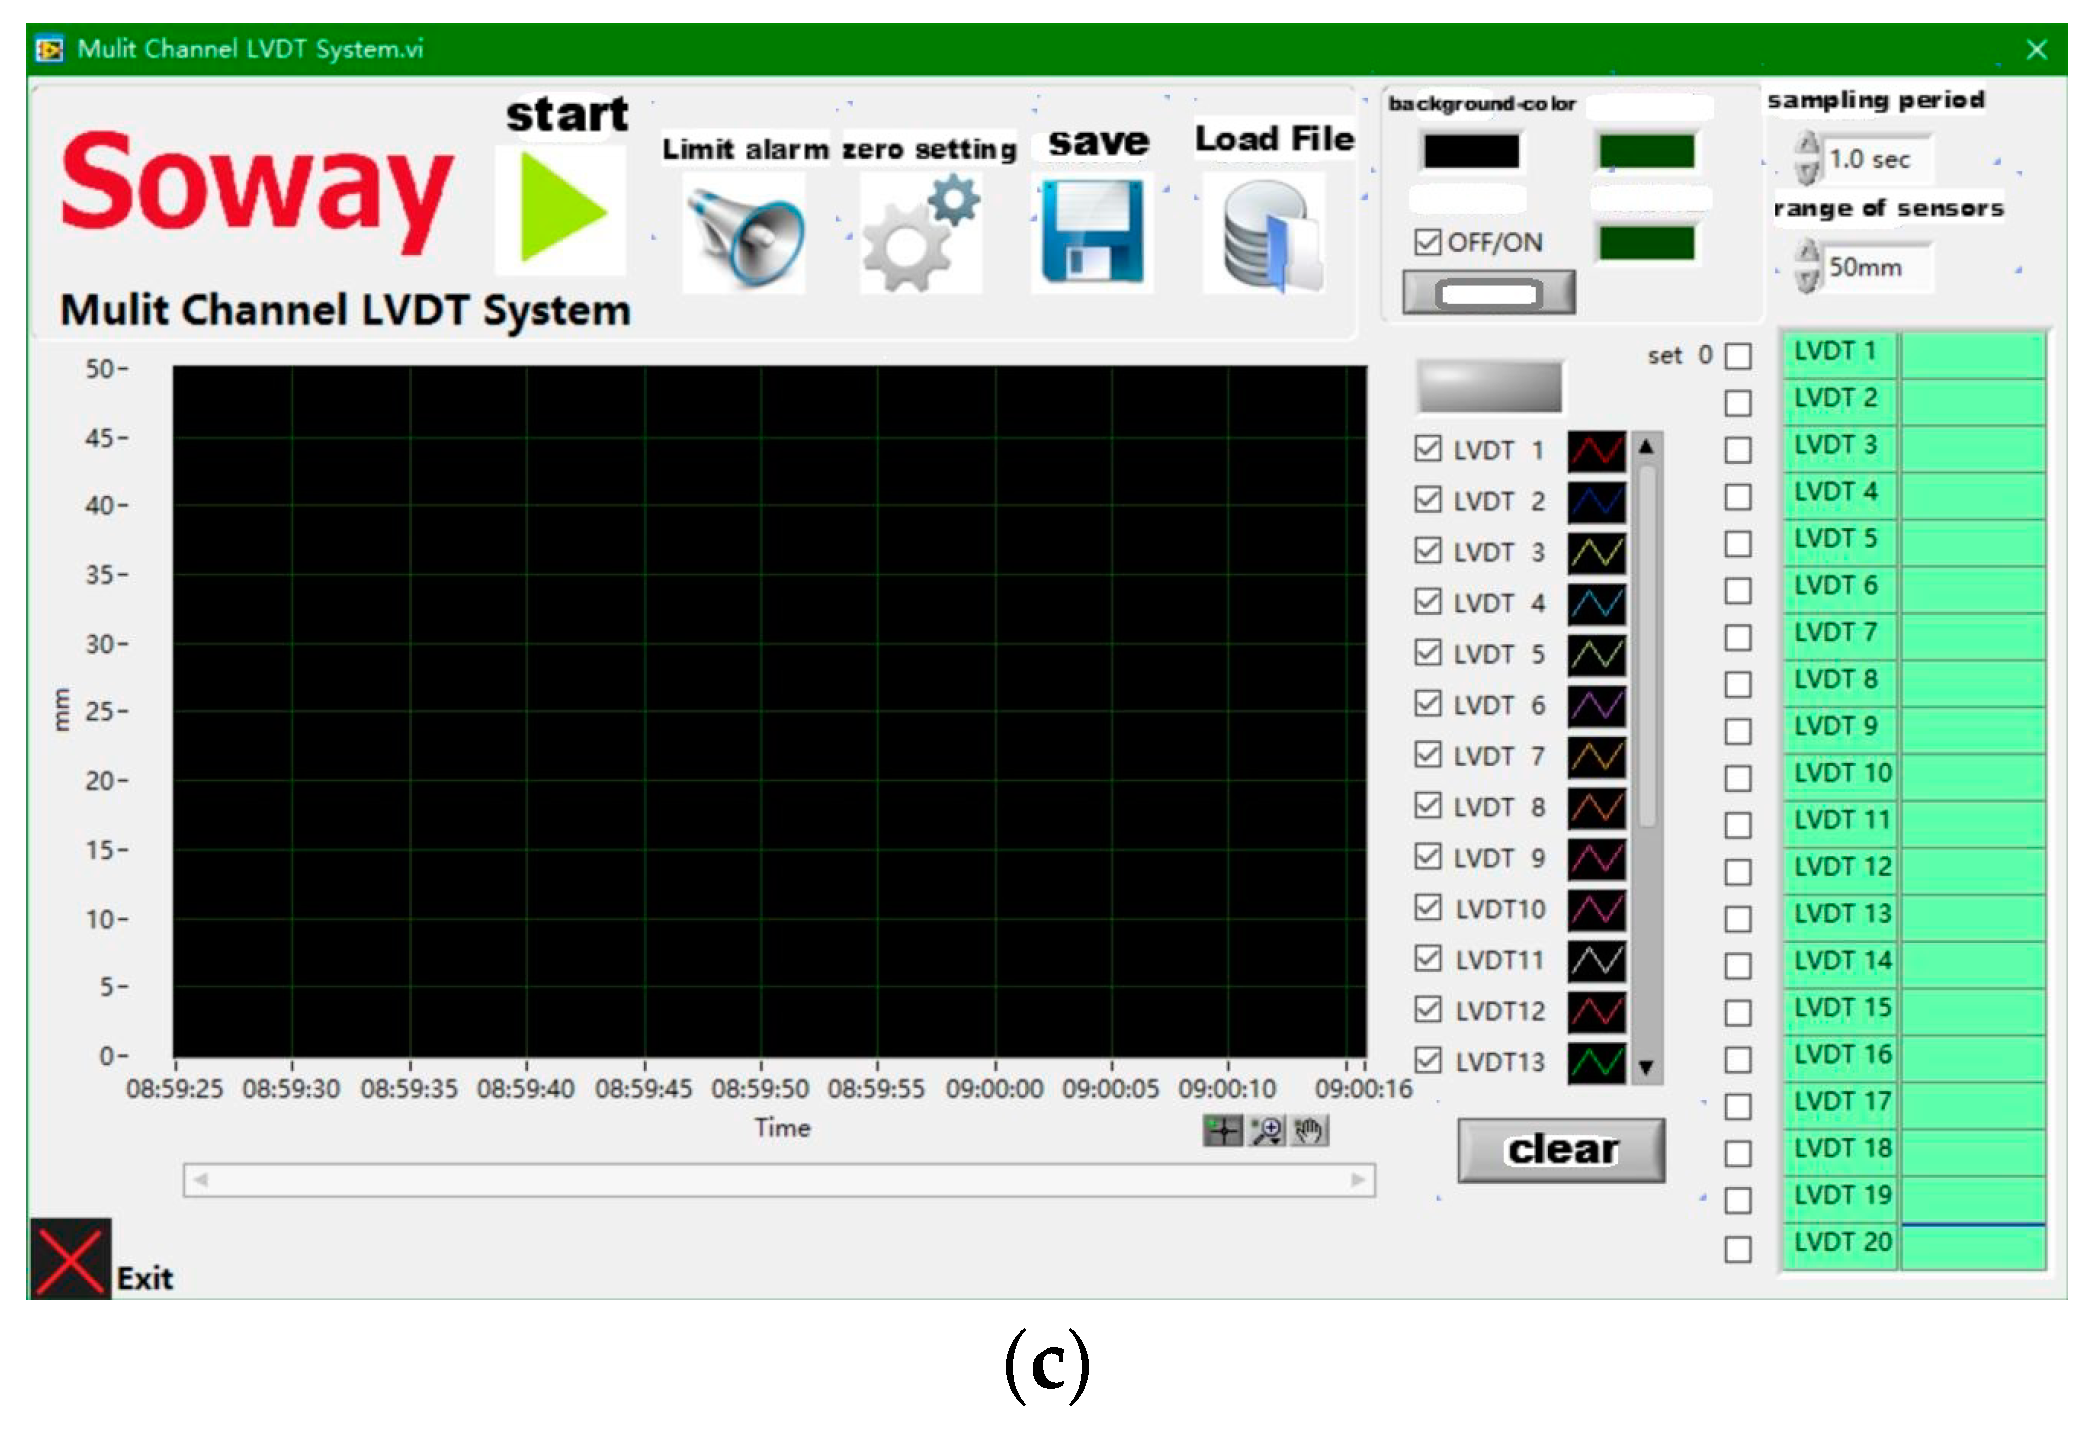
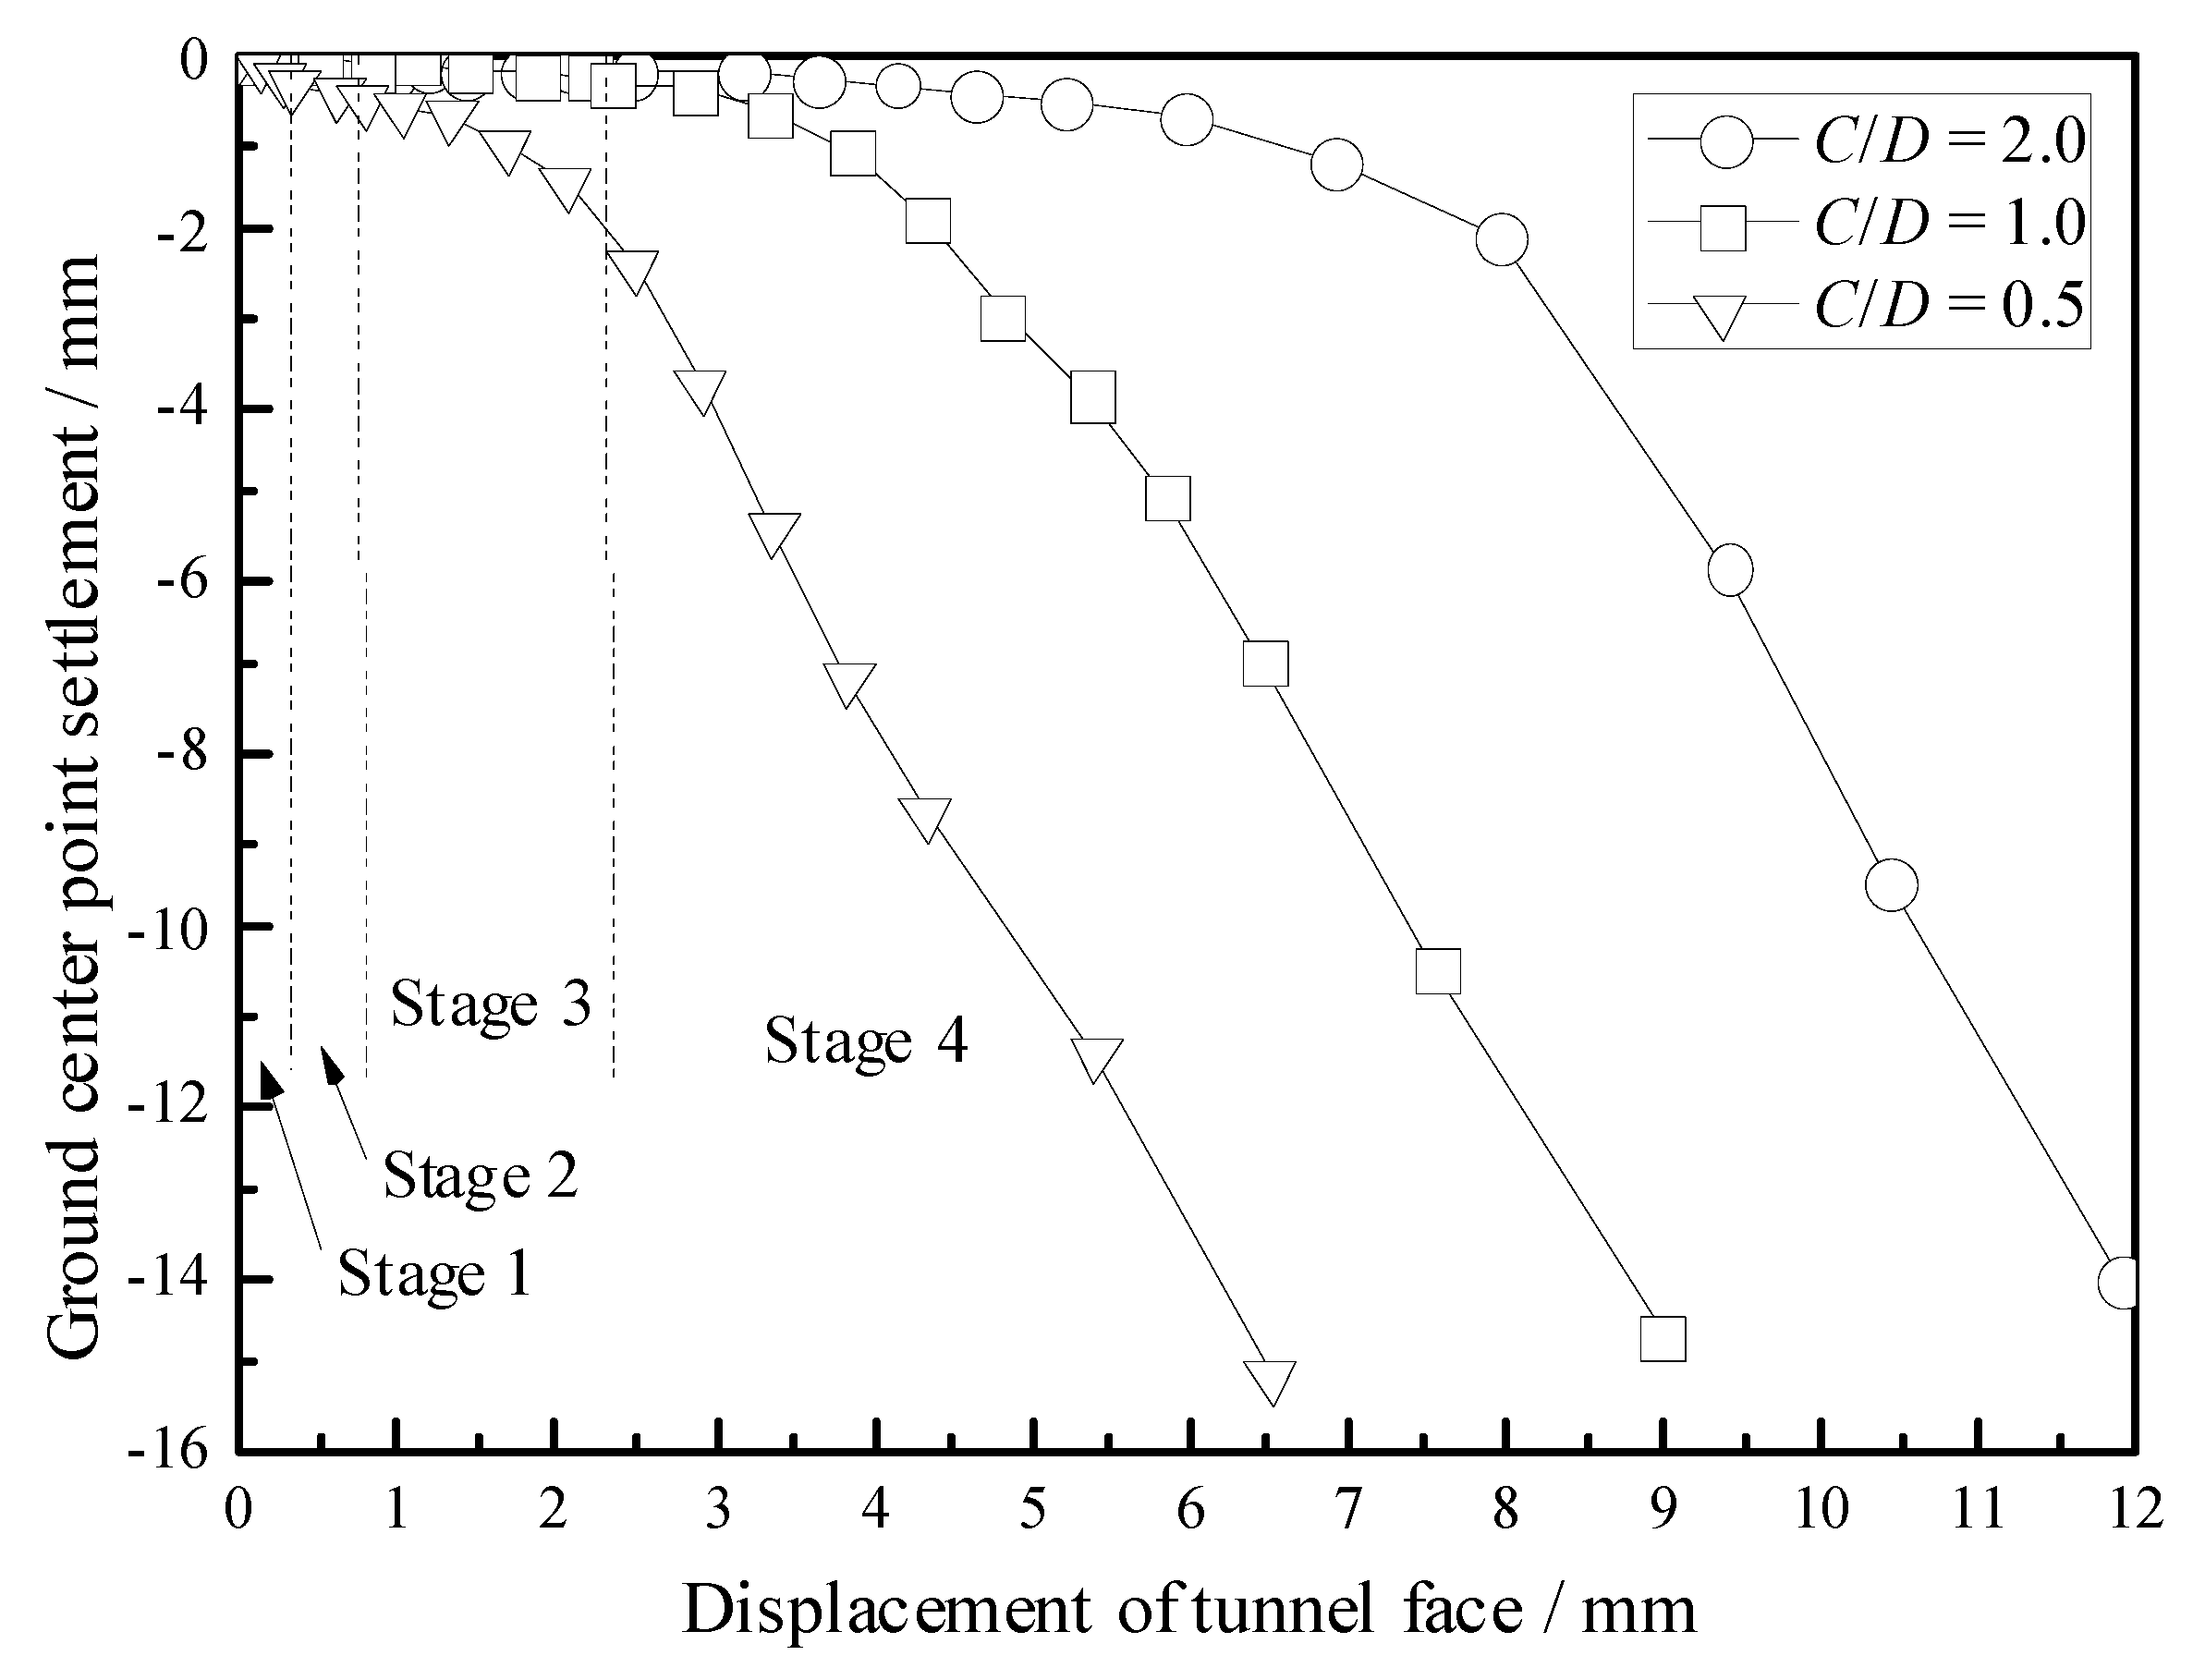
The evolution laws of the ground surface settlement are also summarized based on the measurements of the LVDT displacement sensor in the model test. Moreover, compared with the evolution laws of the support pressure on the tunnel face, the results render that the ground surface settlement is lagging behind the instability failure of the tunnel face.

Author Contributions

Conceptualization, K.H. and X.W.; methodology, K.H., X.W., B.H., X.L., C.C.; validation, K.H.; writing—original draft preparation, K.H. and X.W.; writing—review and editing, K.H. and X.W.; funding acquisition, K.H. All authors have read and agreed to the published version of the manuscript.

Funding

This research was funded by the National Natural Science Foundation of China (No. 51908371).

Acknowledgments

The authors are deeply thankful to the reviewers and editor for their valuable suggestions to improve the quality of the paper.

Conflicts of Interest

The authors declare no conflict of interest.

References

  1. Wang, L.; Han, K.; Xie, T.; Luo, J. Calculation of limit support pressure for EPB shield tunnel face in water-rich sand. Symmetry 2019, 11, 1102. [Google Scholar] [CrossRef] [Green Version]
  2. Mi, B.; Xiang, Y. Analysis of the limit support pressure of a shallow shield tunnel in sandy soil considering the influence of seepage. Symmetry 2020, 12, 1023. [Google Scholar] [CrossRef]
  3. Chambon, P.; Corté, J.F. Shallow tunnels in cohesionless soil: Stability of tunnel face. J. Geotech. Eng. 1994, 120, 1148–1165. [Google Scholar] [CrossRef]
  4. Hisatake, M.; Eto, T.; Murakami, T. Stability and failure mechanisms of a tunnel face with a shallow depth. In Proceedings of the 8th ISRM Congress, Tokyo, Japan, 25–29 September 1995; pp. 587–591. [Google Scholar]
  5. Atkinson, J.H.; Potts, D.M. Stability of a shallow circular tunnel in cohesionless soil. Geotechnique 1977, 27, 203–215. [Google Scholar] [CrossRef]
  6. Mair, R.J. Centrifuge Modelling of Tunnel Construction in Soft Clay. Ph.D. Thesis, Cambridge University, Cambridge, UK, l979. [Google Scholar]
  7. Bezuijen, A.; Messemaeckers-van de Graaf, C.A. Stabiliteit van het Graaffront bij Vloeistofondersteuning; Technical Report 22; Boren Tunnels en Leidingen: Delft, The Netherlands, 1997. [Google Scholar]
  8. Takano, D.; Otani, J.; Nagatani, H.; Mukunoki, T. Application of x-ray CT on boundary value problems in geotechnical engineering: Research on tunnel face failure. In Proceedings of the Geocongress 2006, American Society of Civil Engineers (ASCE), Atlanta, GA, USA, 26 February 26–1 March 2006; pp. 1–6. [Google Scholar]
  9. Idinger, G.; Aklik, P.; Wu, W.; Borja, R.I. Centrifuge model test on the face stability of shallow tunnel. Acta Geotech. 2011, 6, 105–117. [Google Scholar] [CrossRef] [Green Version]
  10. Sterpi, D.; Cividini, A.; Sakurai, S.; Nishitake, S. Laboratory model tests and numerical analysis of shallow tunnels. In Proceedings of the ISRM International Symposium-EUROCK 1996, Torino, Italy, 2–5 September 1996; pp. 689–696. [Google Scholar]
  11. Kirsch, A. Experimental investigation of the face stability of shallow tunnels in sand. Acta Geotech. 2010, 5, 43–62. [Google Scholar] [CrossRef] [Green Version]
  12. Chen, R.P.; Yin, X.S.; Tang, L.J.; Chen, Y.M. Centrifugal model tests on face failure of earth pressure balance shield induced by steady state seepage in saturated sandy silt ground. Tunn. Undergr. Space Technol. 2018, 81, 315–325. [Google Scholar] [CrossRef]
  13. Lü, X.; Zhou, Y.; Huang, M.; Zeng, S. Experimental study of the face stability of shield tunnel in sands under seepage condition. Tunn. Undergr. Space Technol. 2018, 74, 195–205. [Google Scholar] [CrossRef]
Figure 1. Physical diagram of symmetrical model test bench device.
Symmetry 12 02067 g001
Figure 2. The excavation and measuring devices of the model bench. (a) Reaction frame; (b) lining (or segment) and piston.
Symmetry 12 02067 g002
Figure 3. HD digital camera. (a) High-pixel camera; (b) real-time monitoring computer; (c) strain analysis system based on video post-processing.
Symmetry 12 02067 g003
Figure 4. LVDT Distribution Schematic and Analysis Software. (a) LVDT displacement sensor layout; (b) real-time displacement monitoring system; (c) analysis software for LVDT displacement.
Symmetry 12 02067 g004aSymmetry 12 02067 g004b
Figure 5. Semi-section failure test of different buried depth conditions. (a) C/D = 0.5; (b) C/D = 1.0; (c) C/D = 2.0.
Symmetry 12 02067 g005
Figure 6. Experimental phenomena of semi-section progressive instability failure of the tunnel face under C/D = 2.0.
Symmetry 12 02067 g006
Figure 7. Experimental phenomena of semi-section progressive instability failure of the tunnel face under buried depth C/D = 1.0.
Symmetry 12 02067 g007
Figure 8. Position and coordinate system of shear failure band in front of the tunnel face. (a) C/D = 2.0; (b) C/D = 1.0.
Symmetry 12 02067 g008
Figure 9. Analysis of pressure arch of the sand in front of the tunnel face under C/D = 2.0.
Symmetry 12 02067 g009
Figure 10. Analysis of pressure arch shape of the sand in front of the tunnel face under C/D = 1.0.
Symmetry 12 02067 g010
Figure 11. Normalized tunnel face support pressure–displacement curve.
Symmetry 12 02067 g011
Figure 12. Relation curve of surface settlement and backward displacement of the Plexiglas panel.
Symmetry 12 02067 g012
Figure 13. The morphology of ground surface sink.
Symmetry 12 02067 g013
Table 1. Fitting results of a and b.
Buried DepthParameters a Fitting ValuesParameters b Fitting ValuesR2
C/D = 2.011.70−0.93120.8186
C/D = 1.011.54−0.84360.8752
Publisher’s Note: MDPI stays neutral with regard to jurisdictional claims in published maps and institutional affiliations.

