Article

Research of Post Injection Strategy of an EGR Diesel Engine to Improve Combustion and Particulate Emissions Performance: Application on the Transient Operation

1
State Key Laboratory of Automotive Simulation and Control, Jilin University, Changchun 130025, China
2
School of Mechanical and Aerospace Engineering, Jilin University, Changchun 130025, China
3
Changchun Vocational Institute of Technology, Changchun 130022, China
*
Author to whom correspondence should be addressed.
Symmetry 2020, 12(12), 2002; https://doi.org/10.3390/sym12122002
Submission received: 24 November 2020 / Revised: 3 December 2020 / Accepted: 3 December 2020 / Published: 4 December 2020
(This article belongs to the Section Computer)

Abstract

:
Mobile source emissions have already accounted for a large proportion of environmental pollution, which seriously affect the symmetric characteristics of atmosphere, and automobile emissions have extremely serious deterioration of emissions under transient operation, especially particulate emissions. These factors exacerbate the asymmetry of the environment. So, the paper reports an experiment about the improvement of post injection strategy on combustion, regulated emissions (HC, CO, and NOx), and particle number emissions especially the emissions of different size particles in the transient process of an EGR diesel engine, meanwhile, the effects of post injection on the combustion of mixture are further analyzed by numerical simulation method. The test speed was 1600 r/min, and the torque increased from 5% of the maximum torque to 100%. The results indicated that the shorter the instantaneous loading time, the more severe the deterioration of particulate emissions, HC and CO emissions, but loading time has little effect on NOx emissions. The particles with the size range of 50–100 nm, 23–50 nm, and >100 nm are greatly affected by the loading process and post injection. In comparison, it has little effect on ultrafine particles with particle size of 15–23 nm and <15 nm. With the amount of post injection increased, the in-cylinder disturbance increased, and the oxygen-rich area in cylinder increased, the particle number concentration first decreased and then slightly increased. When the amount of post injection fuel is 2 mg and the main-post injection interval is 2000 us, the effects of suppressing particulate emissions are the best, for the 50–100 nm and >100 nm particles, the peak number concentration can be reduced by 25% and 50%, respectively. Due to the turbo charging lag, the peak of NOx emissions during the unloading process were slightly larger than the loading process.

1. Introduction

With the rapid development of the automotive industry, the energy consumption, symmetric characteristics and harmful emissions issues have become the focus of the world’s attention [1]. Vehicle driving usually run under transient operating conditions of diesel engines, and with the mandatory requirements of emissions regulations for engine transient test cycles, the combustion and emissions problems of diesel engine transient process have become the research hotspot and focus of internal combustion engine scholars [2,3,4,5].
In steady-state conditions, a diesel engine’s air–fuel equivalent ratio, fuel injection pressure, exhaust temperature, thermal state in cylinder, coolant temperature, and exhaust pressure are all operated within the ideal calibration value range, and the engine performance can be better guaranteed. However, in a transient operating condition, since the oil supply of the engine and gas parameters are changing at any time, the parameters such as the air–fuel equivalent ratio and thermal state in the cylinder do not reached a steady state, so the combustion and emissions performances are quite different compared to steady-state operating conditions [6,7]. The main reason for this “difference” is that in the transient process, the response speed of the parameters such as fuel supply, air supply, and thermal atmosphere in the cylinder are inconsistent, which leads to the imbalance of the combustion boundary conditions of the transient operating conditions, resulting in the deterioration of combustion and emissions performance [8,9,10].
To solve the problem of diesel engine performance deterioration during transient process, the literatures [11,12,13,14] found that it can increase the response speed of intake air supply in transient process and improve the transient performance by reasonably matching the supercharger, two-stage supercharging, variable-geometry turbocharger and electric supercharging air supplement system. Shutty, Heuwetter, and Nam [15,16,17] discussed the advantages of combining the different pressure EGR mode with injection strategies on improving fuel economy and reducing pollutant emissions under transient conditions. Zhang et al. [18] showed that the effects of the EGR strategy on engine transient performance to reduce the emissions. However, due to the difficulty of controlling the intake air, the high cost of modification, and the immature control technology, the optimization effects of the above technology on the transient performance of the engine were limited.
It is well accepted that agglomerated soot and adsorbents in the size range of 5 nm to 100 nm are the majority of particles that constitute the emission mass. The smaller the particle size, the greater the toxicity. Ultra-fine particles with a size less than 100 nm are extremely harmful to human health [19,20,21]. Moreover, in the transient loading process, the deterioration of soot and particulate emissions was the most serious. For this reason, many scholars have made contributions to how to reduce soot and particulate emissions during the transient process. Wihersaari, H. [22] tested and compared particulate emissions under transient conditions from a diesel car, he indicated that during acceleration and steady conditions, the majority of particles with a particle size larger than 50 nm. These results were completely opposite to the result obtained when the engine is running in a steady state. Many researchers used oxygenated fuels to reduce the particulate emissions of diesel engines during the transient processes. Ali Zare et al. [23] used oxygenated fuels to research that the engine performance during transient and steady-state operation: The results indicated that during transient modes of the custom test, using oxygenated fuels resulted in better power performance. Sun et al. [24,25] studied the effects of biodiesel on different particulate size of diesel engine under transient conditions. For transient condition, biodiesel can effectively suppress particulate emissions but the number of particles in nuclear mode increased. Similar researches were also found in the literatures [26,27,28,29,30,31]. However, in the transient process, there are few studies on particles of different particle size.
The related experiments and numerical simulation studies [32,33,34,35,36] showed that the post injection strategy under steady-state operating conditions of diesel engines can effectively promote the mixing of fuel and intake air in the cylinder at the later stage of combustion, increase the oxidation rate of soot in the later stage of combustion, and achieve simultaneous improvement of particulate and NOx emissions. Nevertheless, at present, there are few studies on post injection strategy to reduce particulate emissions under transient conditions, especially under conditions of the larger EGR rate. Therefore, based on the above reasons, in order to solve the problem of deterioration of in-cylinder combustion and sudden increase in particulate emissions when the diesel engine transiently changes to high load conditions. In this research, the effects of loading time and post injection on an exhaust gas recirculation diluted engine combustion and emissions are investigated through experiments under transient conditions, especially the emission of particles of different particle sizes. This work is helpful for better understanding the problems of diesel engine combustion and emission deterioration during transient processes, and provides an effective method for reducing particles of different particle sizes.

2. Experimental Setup and Methods

2.1. Experimental Apparatus

In this study, a four-cylinder diesel engine with turbocharger was employed and the detailed engine specifications are shown in the Table 1. The engine is aimed at China’s non-road fourth-stage emission regulations, and the after-treatment technology route adopted is EGR+DPF. Figure 1 presents the structure of the control and measurement system. A Nan-Feng 160 eddy current dynamometer which made in China was used to control the diesel speed and loads. The combustion pressure in the first cylinder was measured by a KISTLER quartz crystal pressure sensor (6052CU20) with sensitivity of 21.23 pc/bar, and a KISTLER 5015 charge amplifier was employed to process and amplify pressure signal. The engine crankshaft angle is obtained by a KISTLER 2614CK Crank Angle encoder with 1° resolution. The ONO SOKKI DS-9110 combustion analyzer calculates combustion parameters by cylinder pressure and crankshaft angle, such as in-cylinder pressure, heat release rate. The engine injection parameters were controlled by INCA, the parameters such as injection pressure and EGR rate were run according to the calibrated map in the INCA system. The test bench used a transient throttle voltage controller to precisely adjust the throttle voltage signal to control the change of fuel supply during the transient loading process.
The engine gaseous emissions, such as carbon monoxide (CO), hydrocarbon (HC), and oxides of nitrogen (NOX), these emissions were measured by the HORIBA MEXA 7100. The sampling frequency of the device was set to 10 Hz. Among them, CO emissions were measured by non-dispersive infrared analysis method, NOx emissions were measured by electrochemical method, the HC emissions were measured by non-dispersive infrared absorption. Particulate size distribution and number concentration were analyzed by Combustion DMS500 Fast Particulate Analyzer which made in England. The DMS 500 provided a measurement range of 4.87 to 1000 nm with 38 measure stages for particle size. Before the sample gas measured, in order to avoid condensation of volatile compounds, a heated sample line at a constant temperature of 150 °C was used. There are two dilution stages for holding a good signal to noise, the exhaust was diluted by air, and the first dilution ratio:Aair/exhaust = 5:1, the second dilution ratio: Air/exhaust = 15:1. The data were recorded at a sampling frequency rate of 10 Hz. Table 2 shows the main technical parameters of the measurement devices.
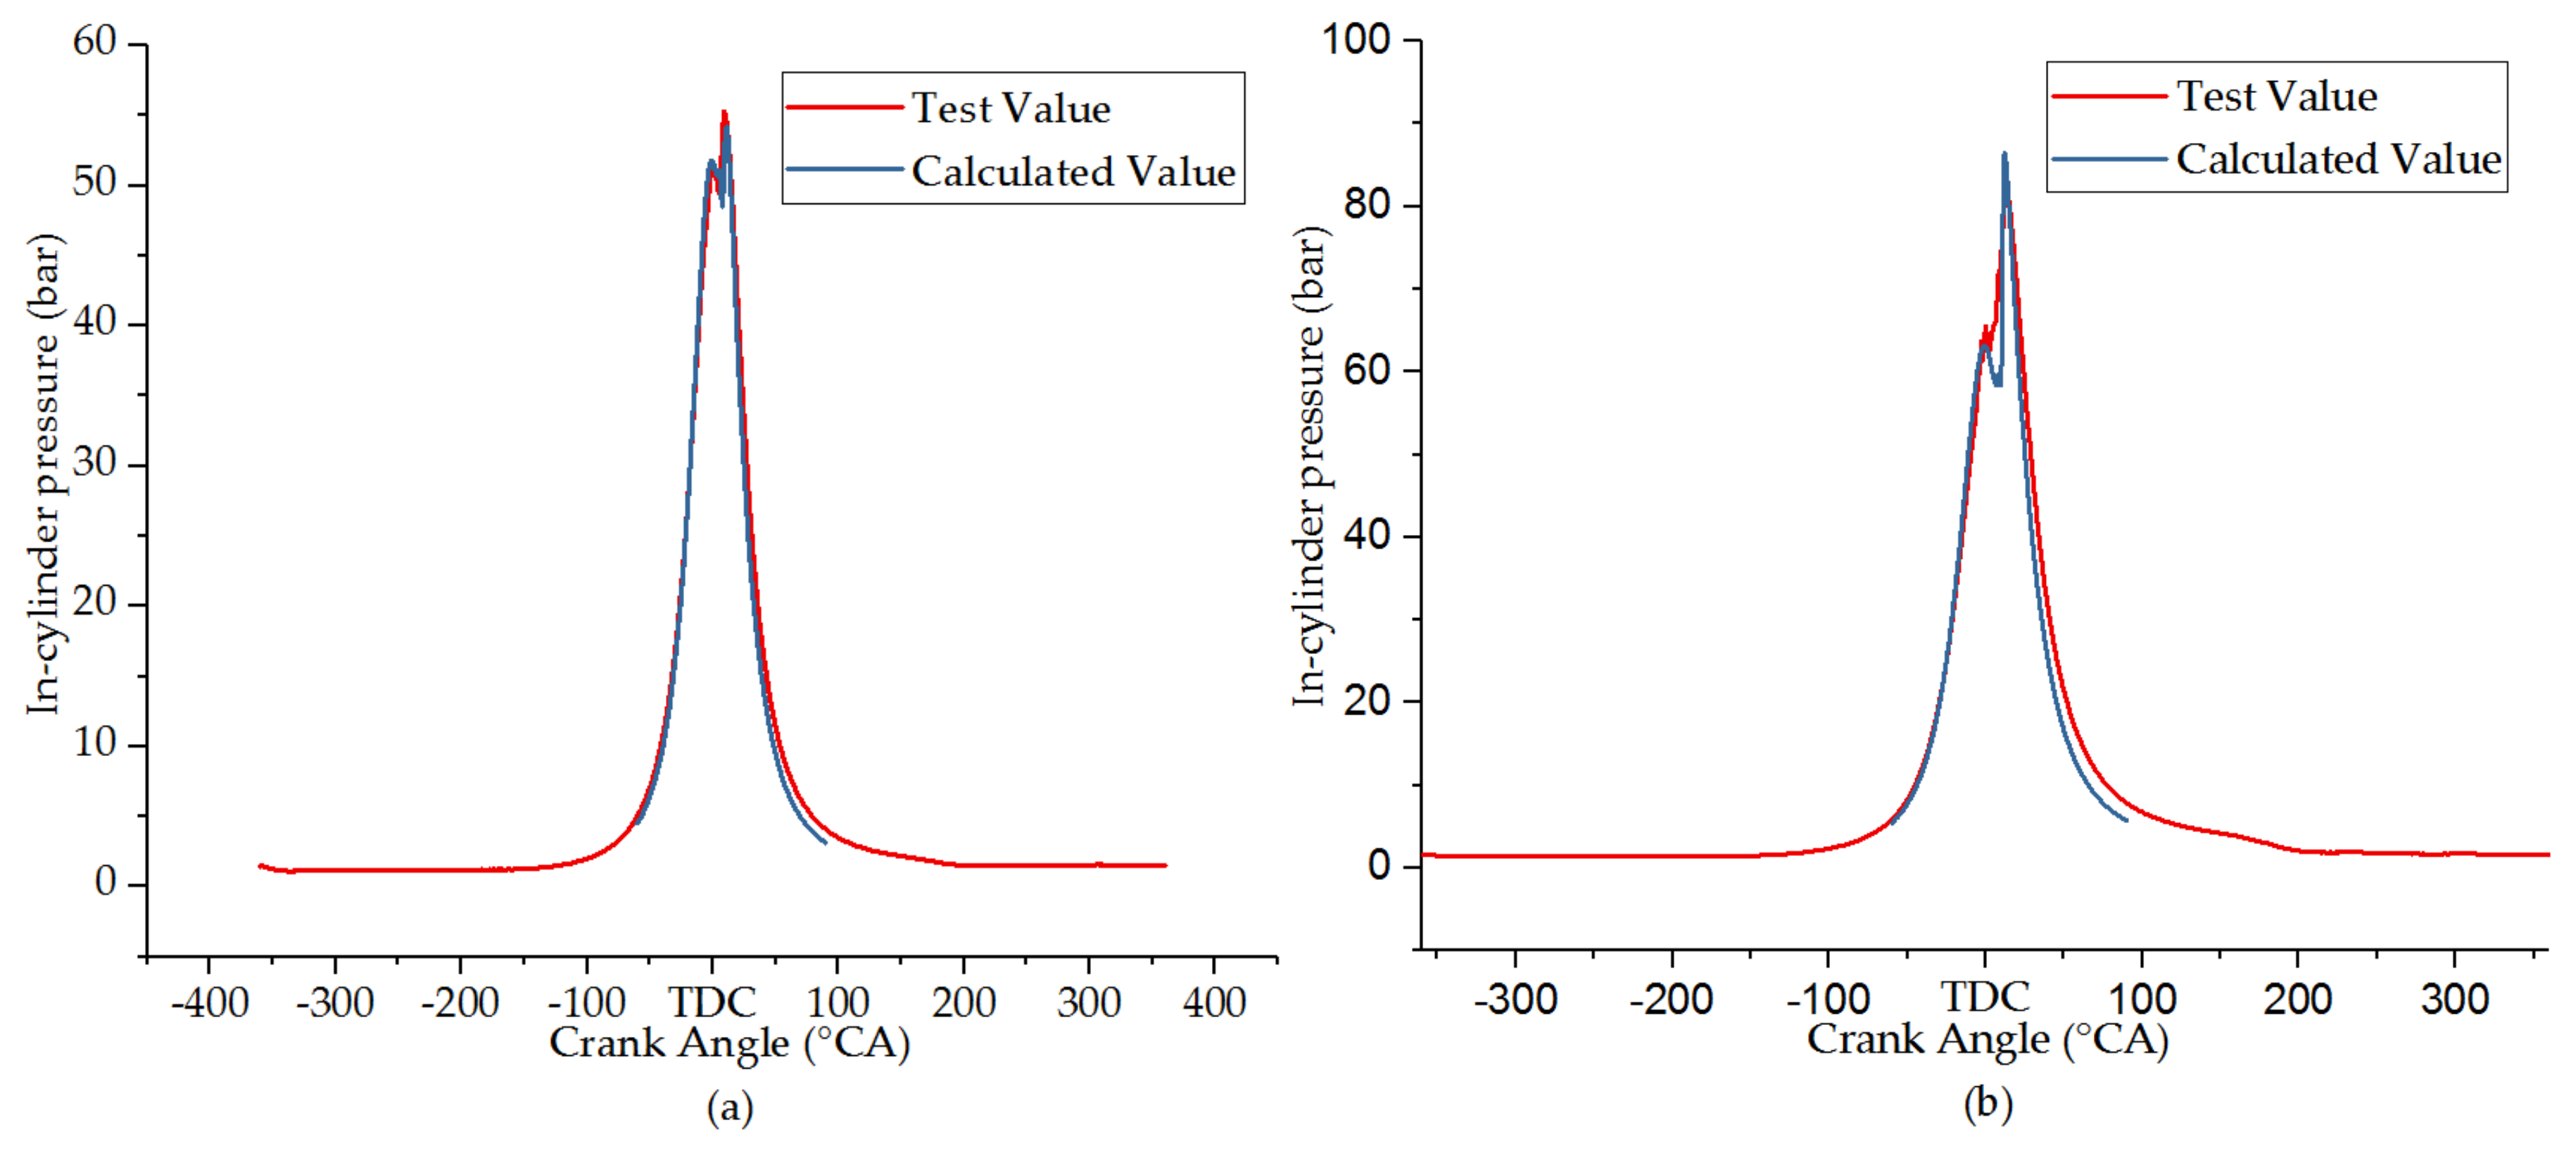
The numerical simulation software we used was CONVERGE, and the calculation grid is shown in Figure 2, the tetrahedral cells were used in the paper, and the advantage of tetrahedral cells is easy to generation even in case of very complex geometry [37]. The simulation calculation adopts the standard k-ε turbulence model, Huh spray model, Reitz/Diwakar droplet breaking model, Bai collision model, shell ignition model and laminar/turbulent time-scale combustion model, the PISO algorithm is used for solution, and the cylinder wall is simplified to adiabatic boundary treatment. We selected two operating conditions: The first was 1600 r/min, 25% load; the second was 1600 r/min, 50% load. We verify the cylinder pressure measured value obtained from the test with the calculated value of the model, the results were shown in Figure 3, and the results showed that the model we established can accurately predict the combustion of the engine.

2.2. Methods

In the experiments, the engine speeds were remained at 1600 r/min, which is the maximum torque point speed. The temperature of the intake air after cooling was set at 40 ± 1 °C. The temperature of the constant temperature cooling water tank is kept at 80 ± 2 °C. At the beginning of the test, keeping the engine speed at 1600 r/min and the engine running smoothly at 5% of the maximum torque for 5 s, then the throttle voltage increased linearly and the torque increased from 5% to 100% within 3 s, 5 s, and 7 s respectively. After running for 30 s, 28 s, and 26 s at 100% torque, subsequently, the load is reduced to 5% torque, the unloading time is the same as loading time. Figure 4 demonstrates the operating steps of the transient test, which includes the following four steps: Low torque stable operation stage, loading stage, high torque stable operation stage, and unloading stage. Each group of trials were measured three times and the average value is calculated.
Under these conditions, the effects of loading time and post injection on combustion, regulated emissions (HC, CO, and NOx) and PN emissions were investigated experimentally. The purpose of this paper is in the transient process, the post injection method is used to improve the problem of the deterioration of emissions, especially particulate emissions of different sizes.
In this paper, the in-cylinder combustion pressure was measured continuously for 800 cycles in each case, to ensure that the entire transient process was covered, and the heat release rate, in-cylinder temperature, ignition delay and CA50 were calculated. CA50, the crank angle corresponding to the 50% cumulative heat release.

3. Results and Discussions

3.1. Effects of Loading and Unloading Duration on Emissions

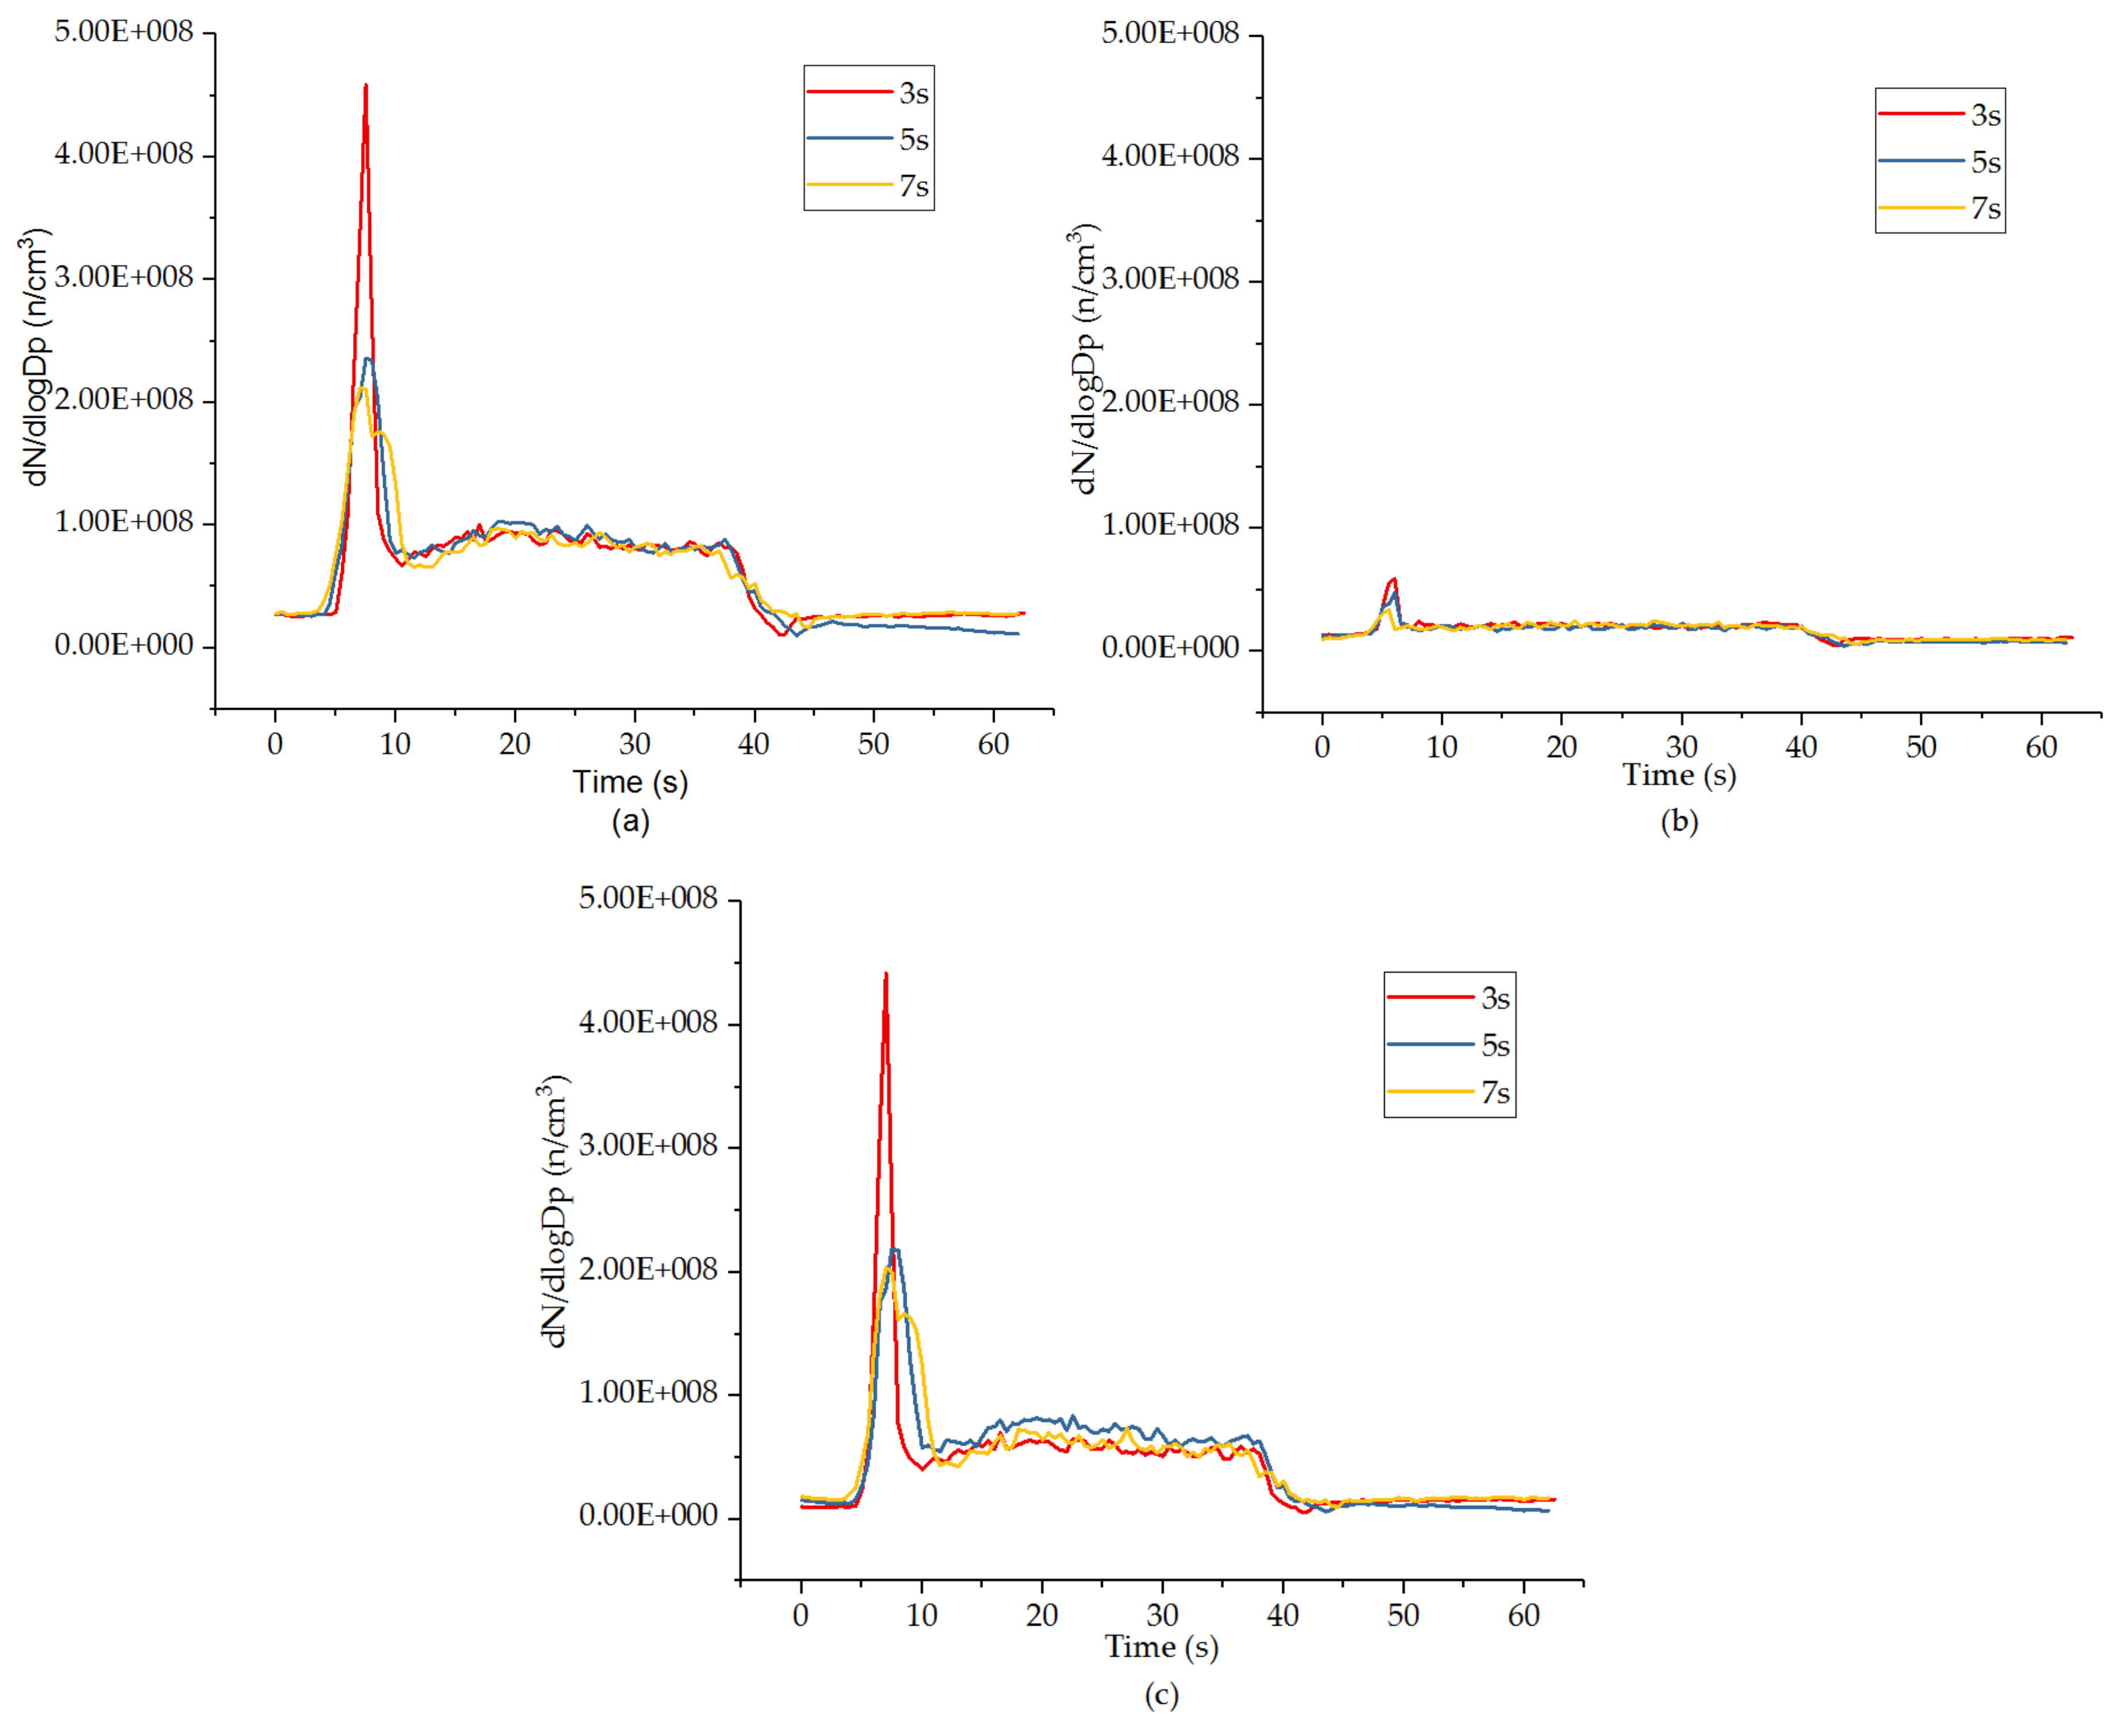
Figure 5 shows the variation of particles with different particle size under different loading and unloading duration conditions. As we can see, whether it is the total number concentration, the concentration of particles in the nucleation mode (5–35 nm) or accumulation mode (35–100 nm), there is a sharp increase trend during the loading process, meanwhile, the particles mostly exist in the form of accumulation mode. Especially when the loading time is 3 s, the concentration of particulate matter increased drastically, in terms of total number concentration, compared with the steady-state operation after loading, the peak value of the particle number concentration during loading increased by nearly five times. Similarly, for the particles in the nucleation mode and accumulation mode, when the loading time is 3 s, the maximum peak number concentration of the particulate matter increased by two times and six times, respectively. Comparatively, when the loading time is 5 s and 7 s, compared with the stable operation after loading, the increase of maximum peak in particle number concentration is relatively small. At the same time, we can also find that different unloading duration have little effect on particulate emissions. The reasons for the above phenomenon are as follows. Firstly, in the transient process, as the torque increased, the air–fuel equivalent ratio gradually decreased with the loading time decreased. This is due to the turbo charging lag caused serious intake delay, and the intake air volume during the transient process is more lagging than fuel injection, coupled with the phenomenon of EGR rate overshoot, these factors make the air–fuel ratio in the cylinder dropped drastically compared to the steady-state operating conditions under the same torque. It is clearly that the shorter the loading time, the more serious the intake air lag. Secondly, as the loading time decreased, CA10 and CA50 gradually increased, and the deterioration of combustion in the cylinder is more serious. The increase in expansion loss will reduce the engine’s thermal power conversion capacity, which will increase the fuel consumption and the particulate emissions increased.
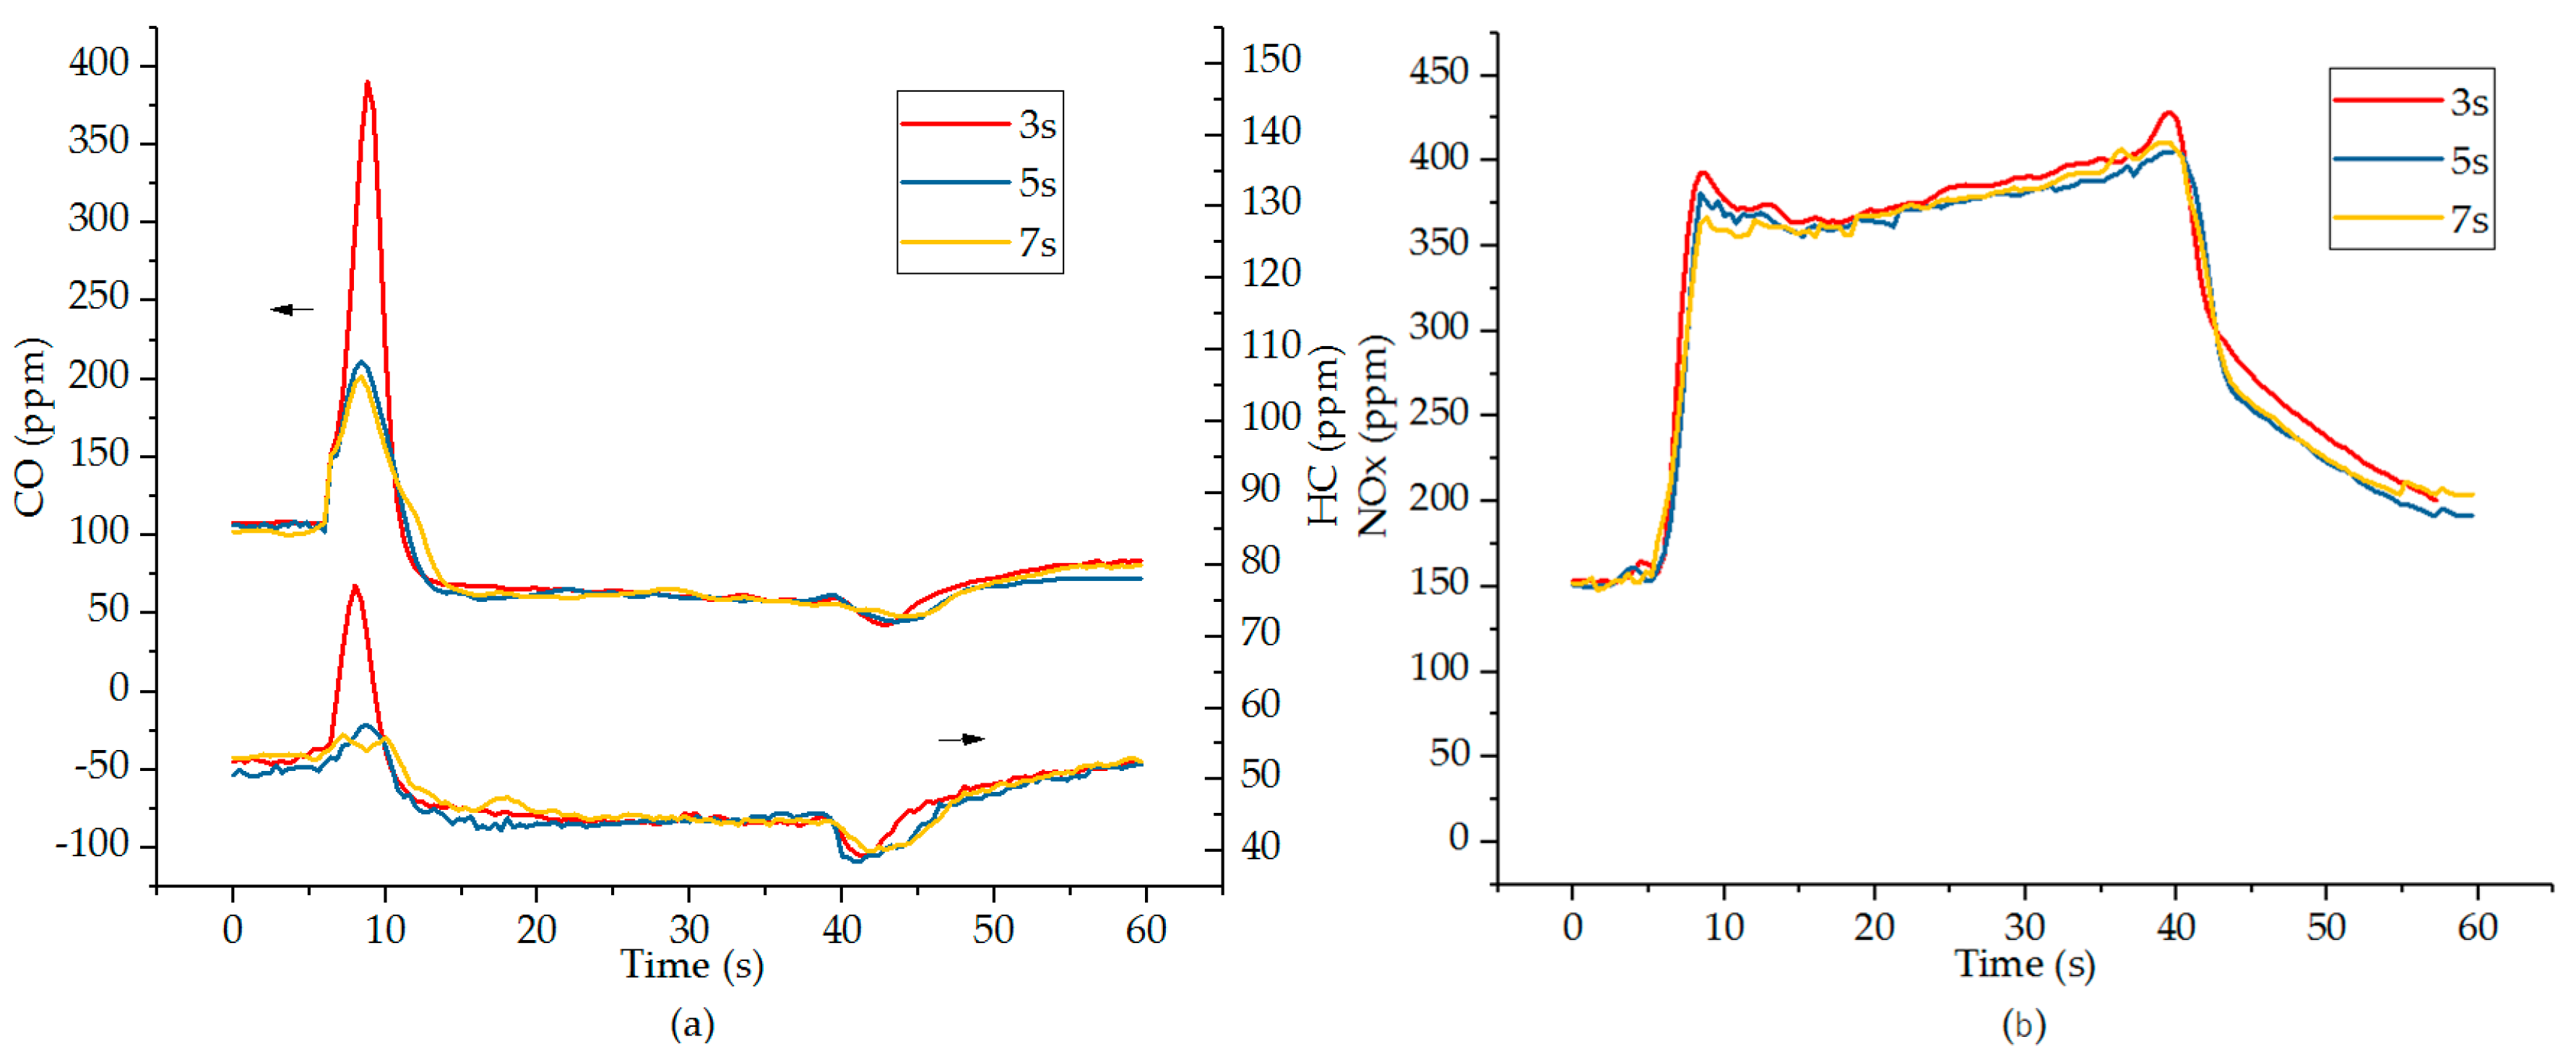
Figure 6 shows the effect of loading and unloading duration on CO, HC, and NOx emissions. The figure indicated that CO and HC emissions show the same trend as particulate emissions. When the loading time is 3 s, the peak of CO and HC emissions changed the most. While the loading duration of 5 s and 7 s have a relatively slightly effect on the peak of CO and HC emissions, and there is not much difference between them. Simultaneously, we can also see that the CO and HC emissions when the operation is stable after loading are less than the emission values before loading. This is mainly due to the higher combustion temperature after transient loading process, which increased the oxidation capacity of CO and HC emissions. Regarding NOx emissions, the same is also that the largest increase in NOx emissions when the loading time is 3 s, but in general there is not much difference about different loading time in NOx emissions.

3.2. Effects of Post Injection on Combustion and Emissions

It can be seen from Section 3.1 that when the loading time is 3 s, the emission deterioration is the most serious. For this reason, we try to explore the effect of post injection on combustion and emissions through experiment when the loading duration is 3 s.
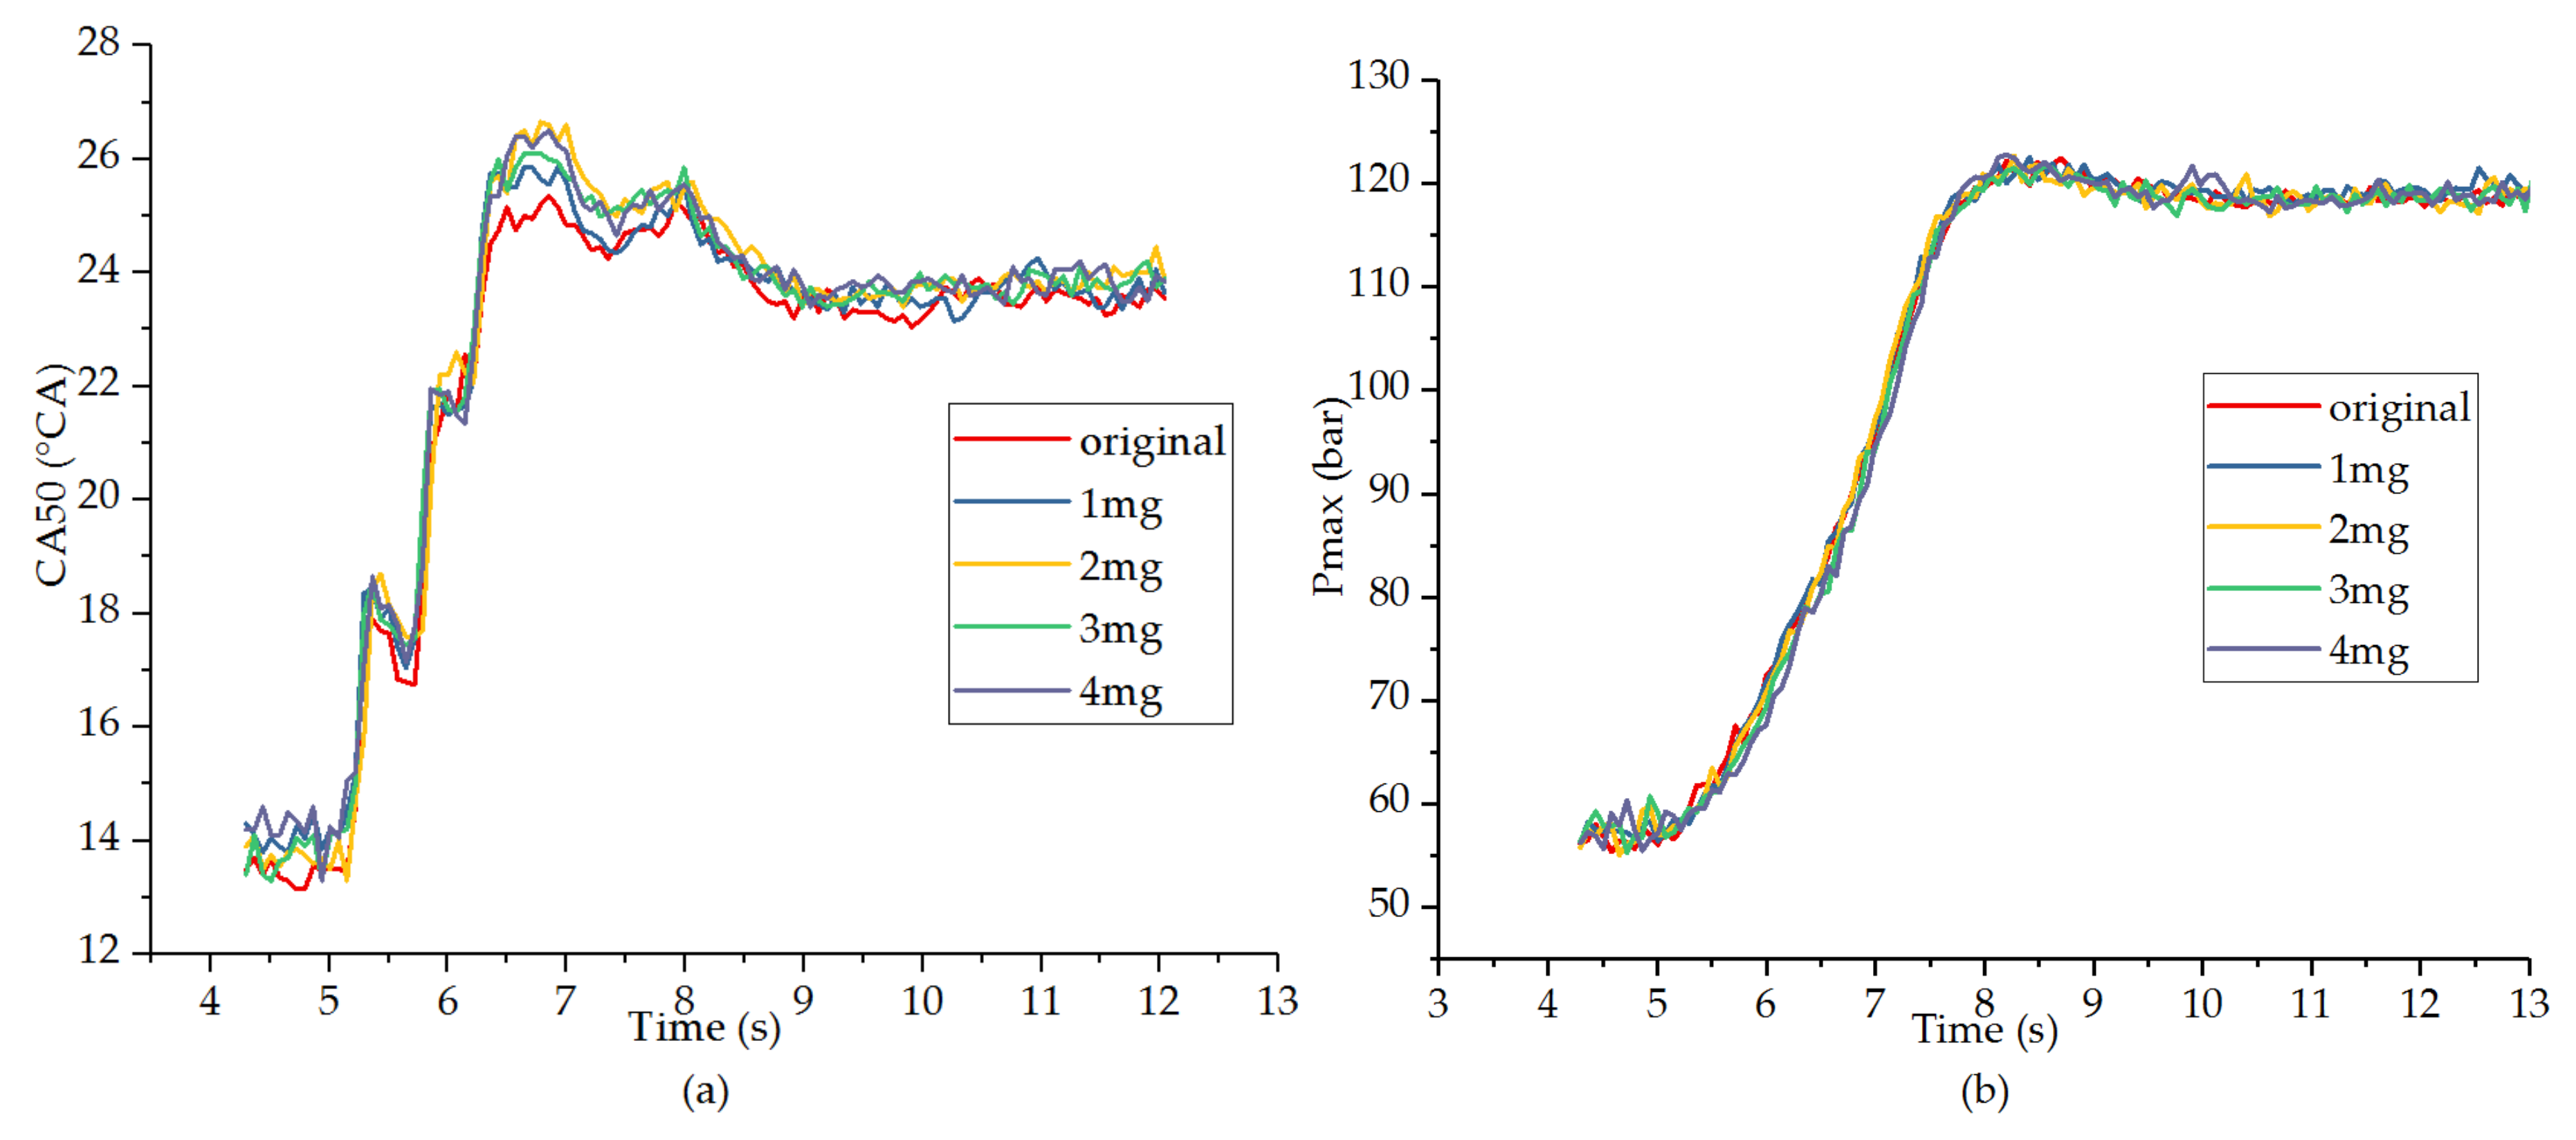
Figure 7 shows the effect of different amounts of post injection fuel on CA50 and maximum cylinder pressure while the main-post injection interval is 2000 us during the transient loading process. The results indicated that for different amounts of post injection fuel, there is a slight variation in CA50, slightly lag compared with the original. And during the loading process, the combustion center (CA50) increased sharply, and gradually decreased after the peak of the combustion phase, finally, stabilized with the stability of the operating conditions. The change in maximum pressure showed a similar trend with CA50. There may be several reasons for this phenomenon. Firstly, turbo charging lag makes the intake of the transient process much lower than the steady state process, resulting in the combustion phase delayed. Secondly, since the main injection quantity are constant, the increased post injection quantity will cause the CA50 increased. Thirdly, the post injection timing occurs in the expansion stroke, and the interval between the main and post injection timing is 2000 us, which is about 19.2°CA, this makes slightly impact on maximum pressure.
Figure 8 shows the variation in particulate matter number size distribution with different amount of post injection. Obviously, at the beginning, the differences in the number concentration of particles of different particle sizes distribution are slightly. As the beginning of the loading process, the particles with the size range of 50–100 nm, 23–50 nm, and >100 nm show more considerably changes with the load, and with the increase of the load, their number concentration increased drastically, after reaching the peak, then decreased rapidly and eventually stabilized. This is because the turbine charging lag makes the intake air in the transient process much lower than steady state process, resulting in the lack of oxygen in the cylinder, it exacerbates the insufficiency of combustion, causing the particles increased sharply. In comparison, the change in load has little effect on ultrafine particles with particle size of 15–23 nm and <15 nm.
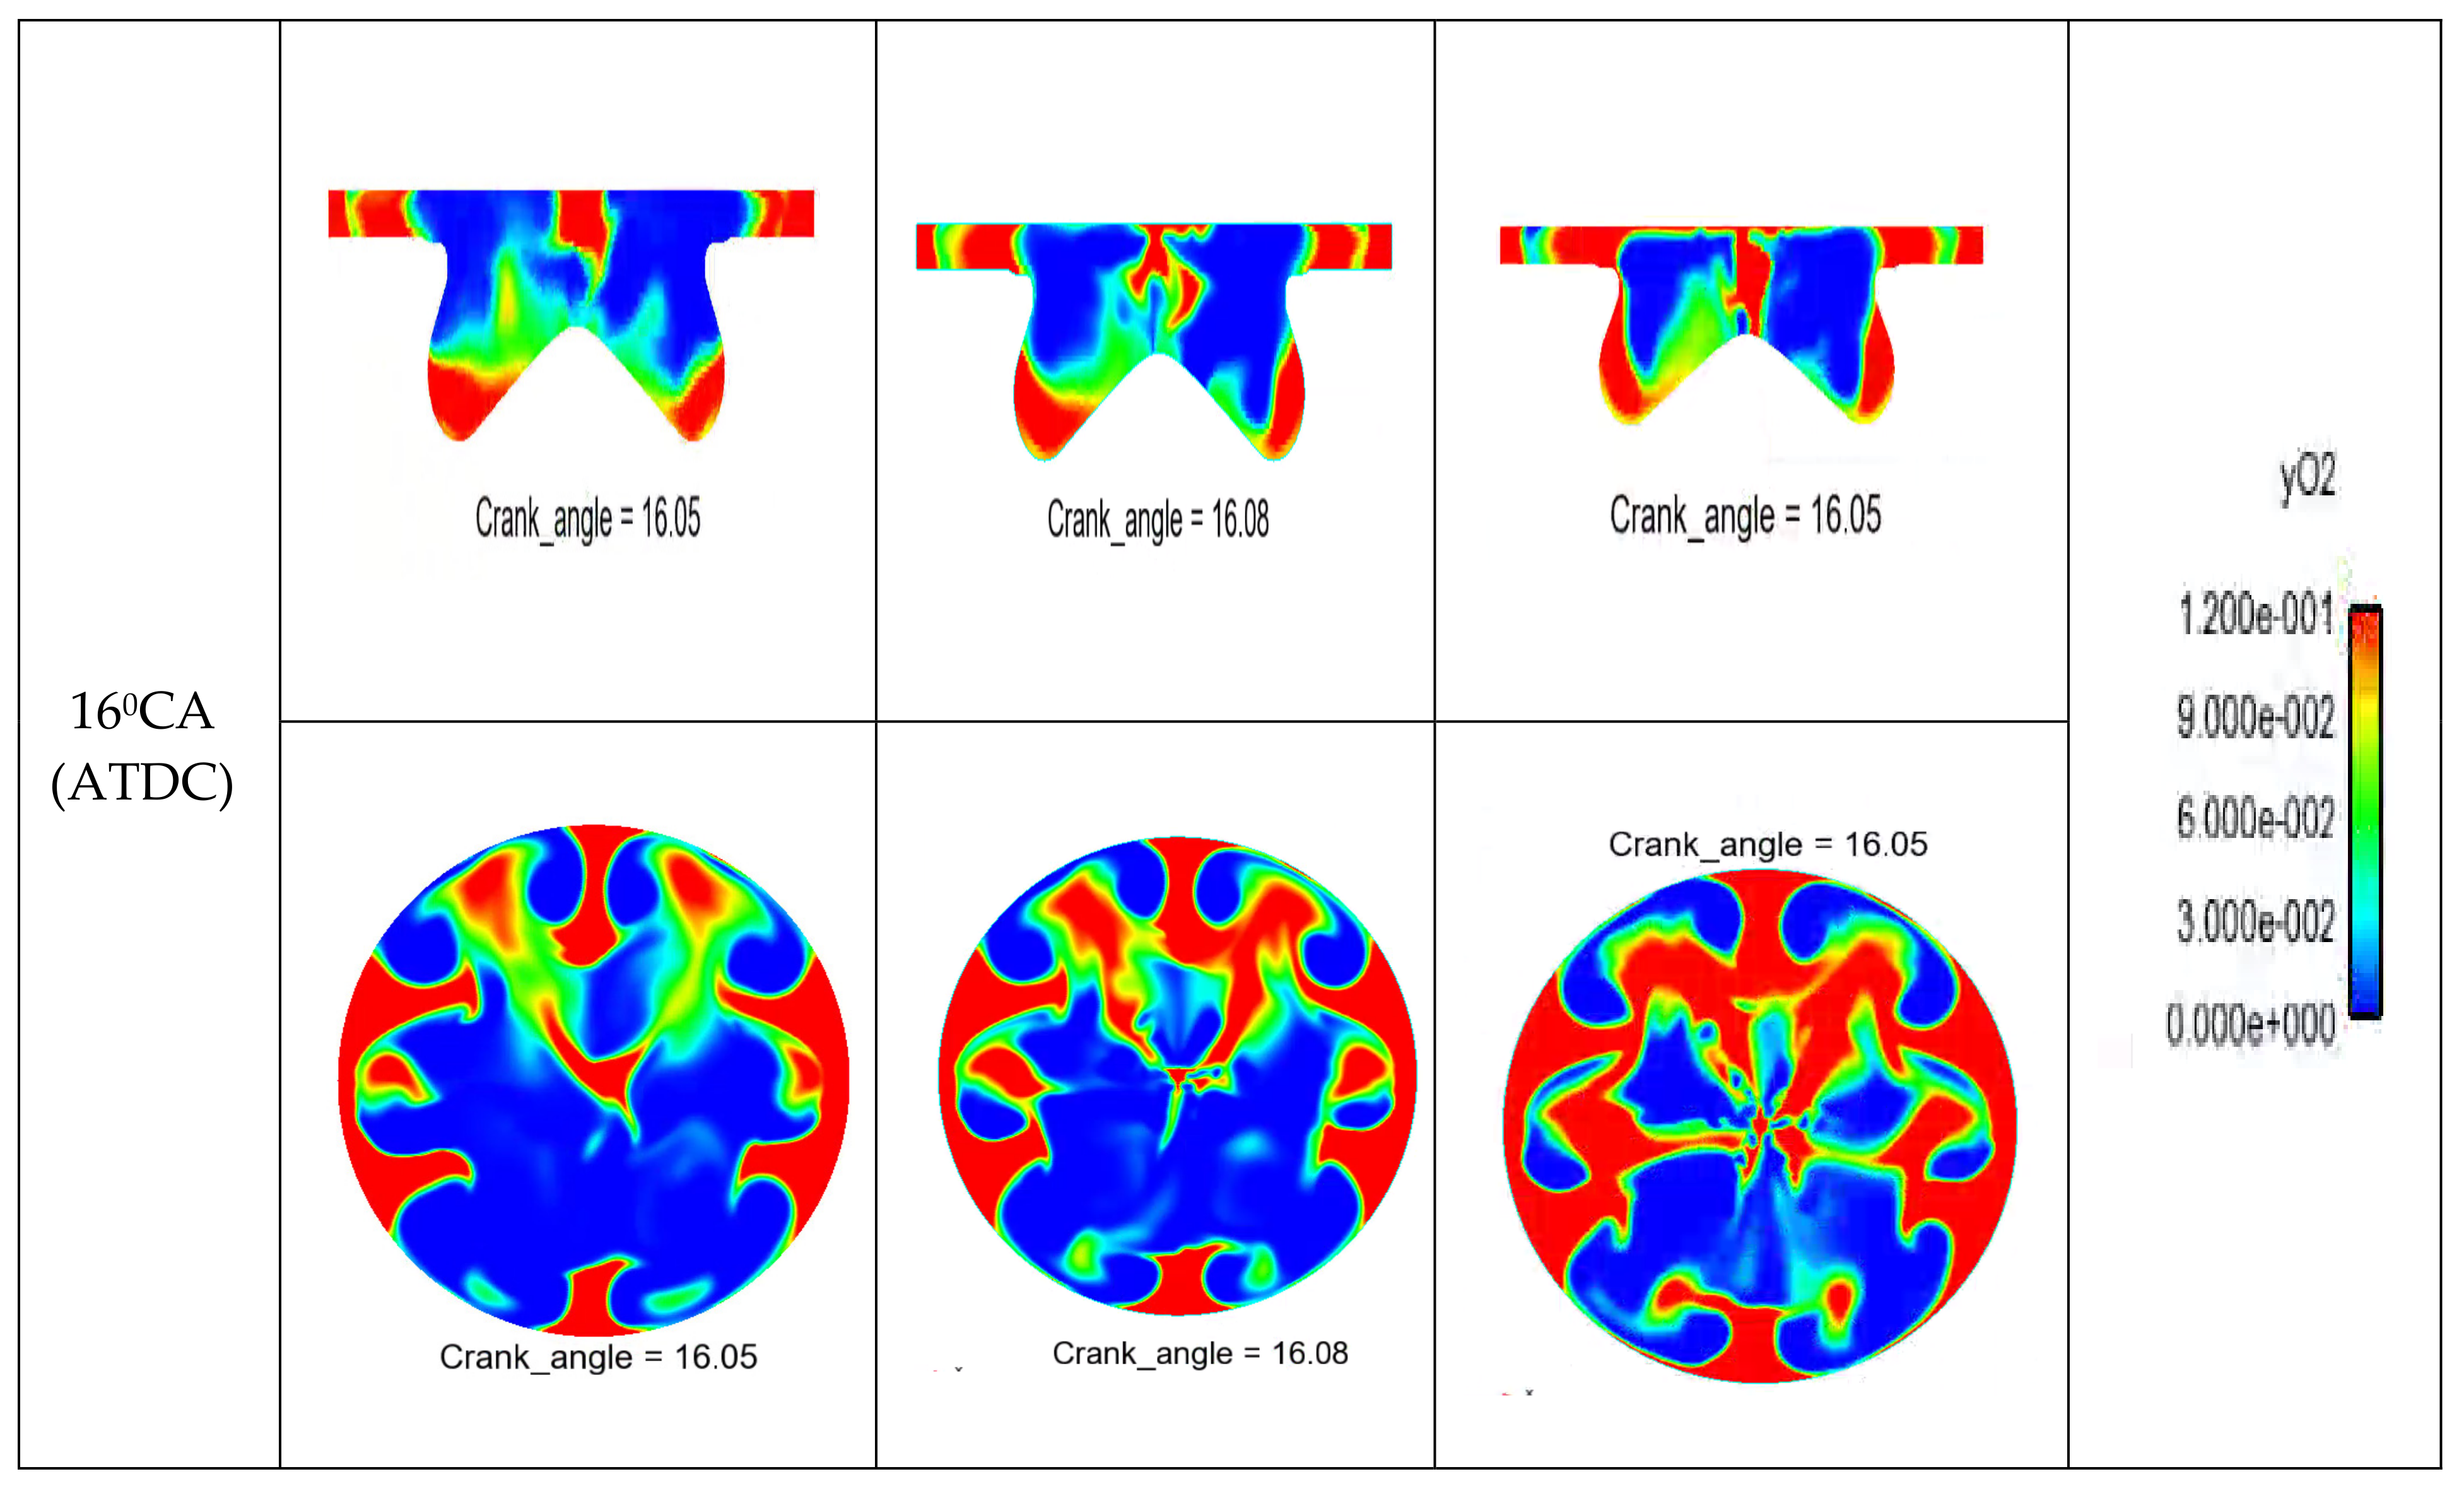
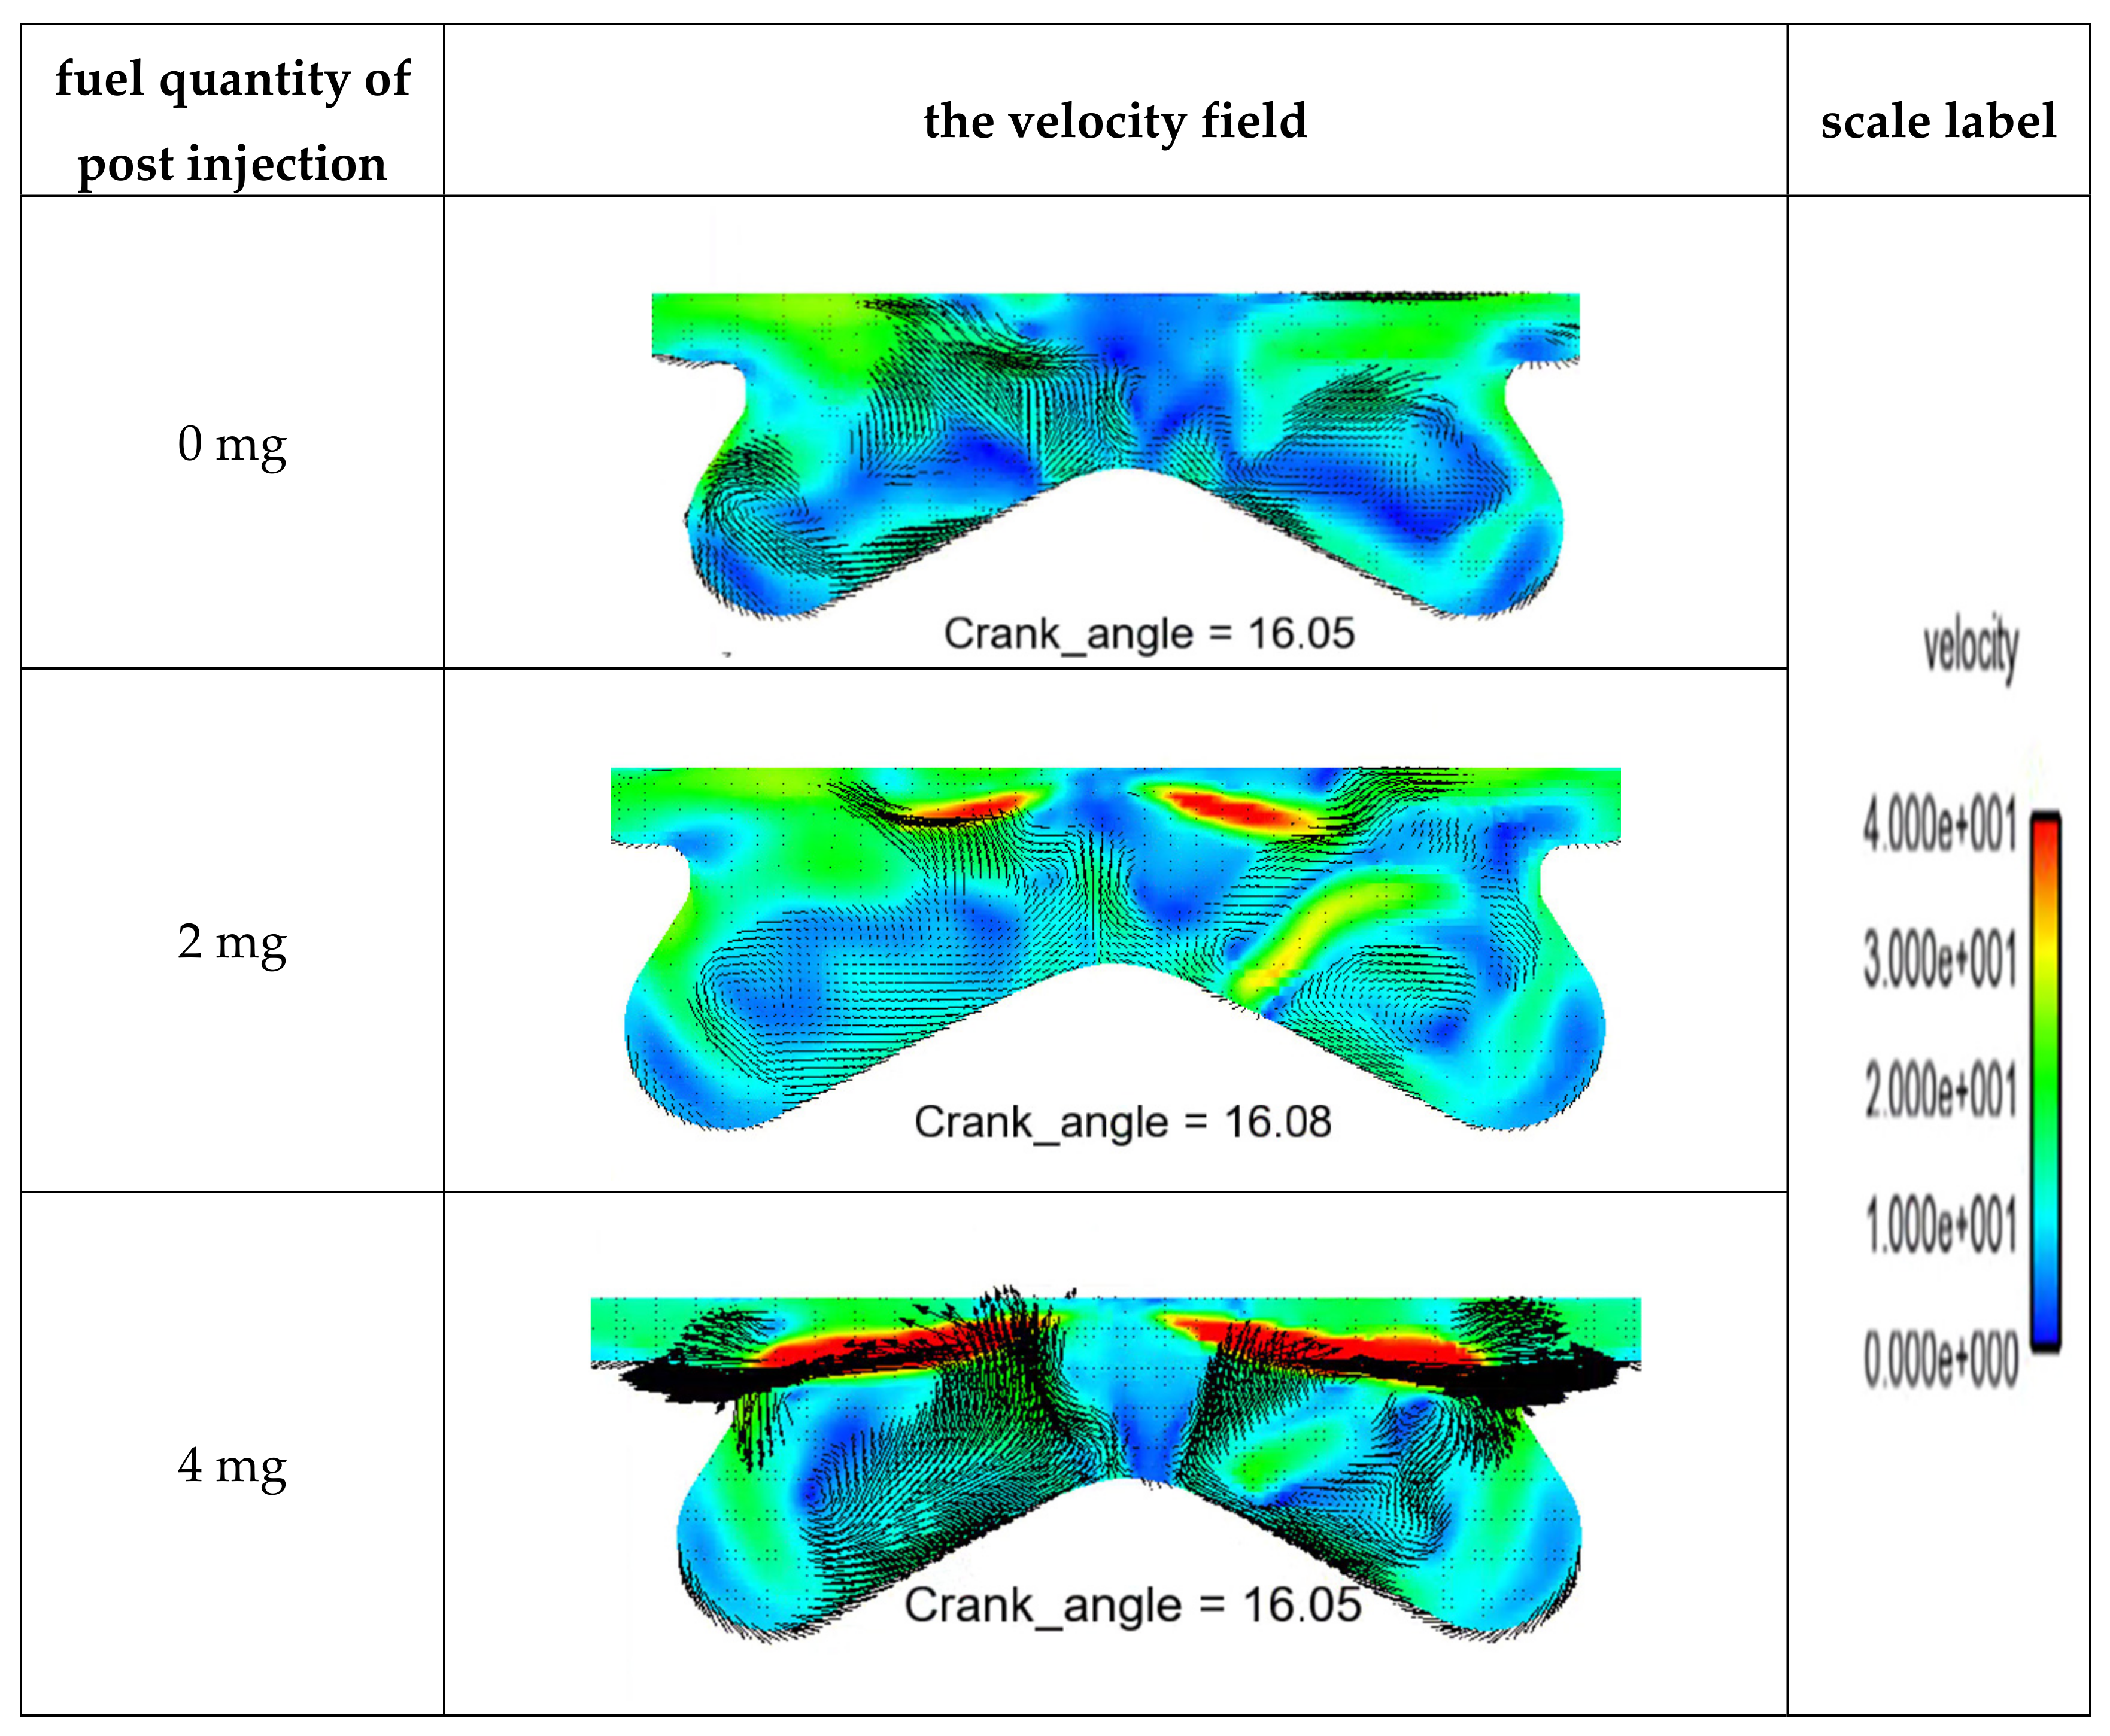
Figure 9 is a diagram of the oxygen concentration field movement law in the cylinder, the engine operating condition is 1600 rpm, 25% loading rate, post injection quantity are 0 mg, 2 mg, and 4 mg respectively, and the main-post injection interval is 20°CA. Figure 10 is the velocity field distribution diagram in the cylinder when the crank angle is 16°CA ATDC. The following features can be seen from these two pictures. Due to the total fuel injection volume remains the same, when the post injection starts (12°CA ATDC), the oxygen concentration around the injector in the cylinder without post injection is less than that with post injection. When the post injection ends (16°CA ATDC), the oxygen-enriched zone near the center of the cylinder will diffuse to the surroundings driven by the post injection. The more the amount of post injection fuel, the higher the velocity of the flow field in the cylinder, which helps to promote the flow of the mixture. So we can consider that the post injection promotes the flow rate of the mixture in the cylinder, it is injected into the oxygen-rich area in the cylinder, which facilitates the transportation of oxygen to the oxygen-poor area, promotes the evaporation and atomization of the fuel after injection, and improves the thermal atmosphere in the cylinder. Similar conclusions have also been found in the literatures [38,39,40].
It is worth noting that during the loading process, compared with the original injection, the maximum number concentration of particles that the particle size were 50–100 nm and >100 nm, which first decreased and then increased slightly when the quantity of post injection fuel increased. When the post injection volume was 2 mg, the peak value of the number concentration was the lowest. After that, as the amount of post injection increased, the concentration of particulates changed slightly. However, the quantity of post injection fuel made a little difference to other size range particles. On the one hand, the post injection enhanced the airflow movement in the cylinder, which reduced the area of oxygen deficiency in the cylinder and made the combustion more full. At the same time, the addition of post injection increased the oxygen driving energy, so more oxygen oxidized the particles formed later [41]. On the other hand, combustion of the post injection fuel increased the temperature in the later stage of combustion in the cylinder. The higher combustion temperature can accelerate the oxidation of particles [42]. These two aspects make the post injection to reduce the emissions of particles during transient loading; however, as the amount of post injection increased, the particles showed an upward trend. This is because the amount of post injection increased too much: This will make the total amount of fuel increased during transient loading, resulting in an increase in the particles produced by combustion. Furthermore, the larger amount of post injection will make the combustion duration longer, and post injection fuel will form more mixed steam in the high-temperature anoxic area near the wall surface, resulting in an increase in particulates.
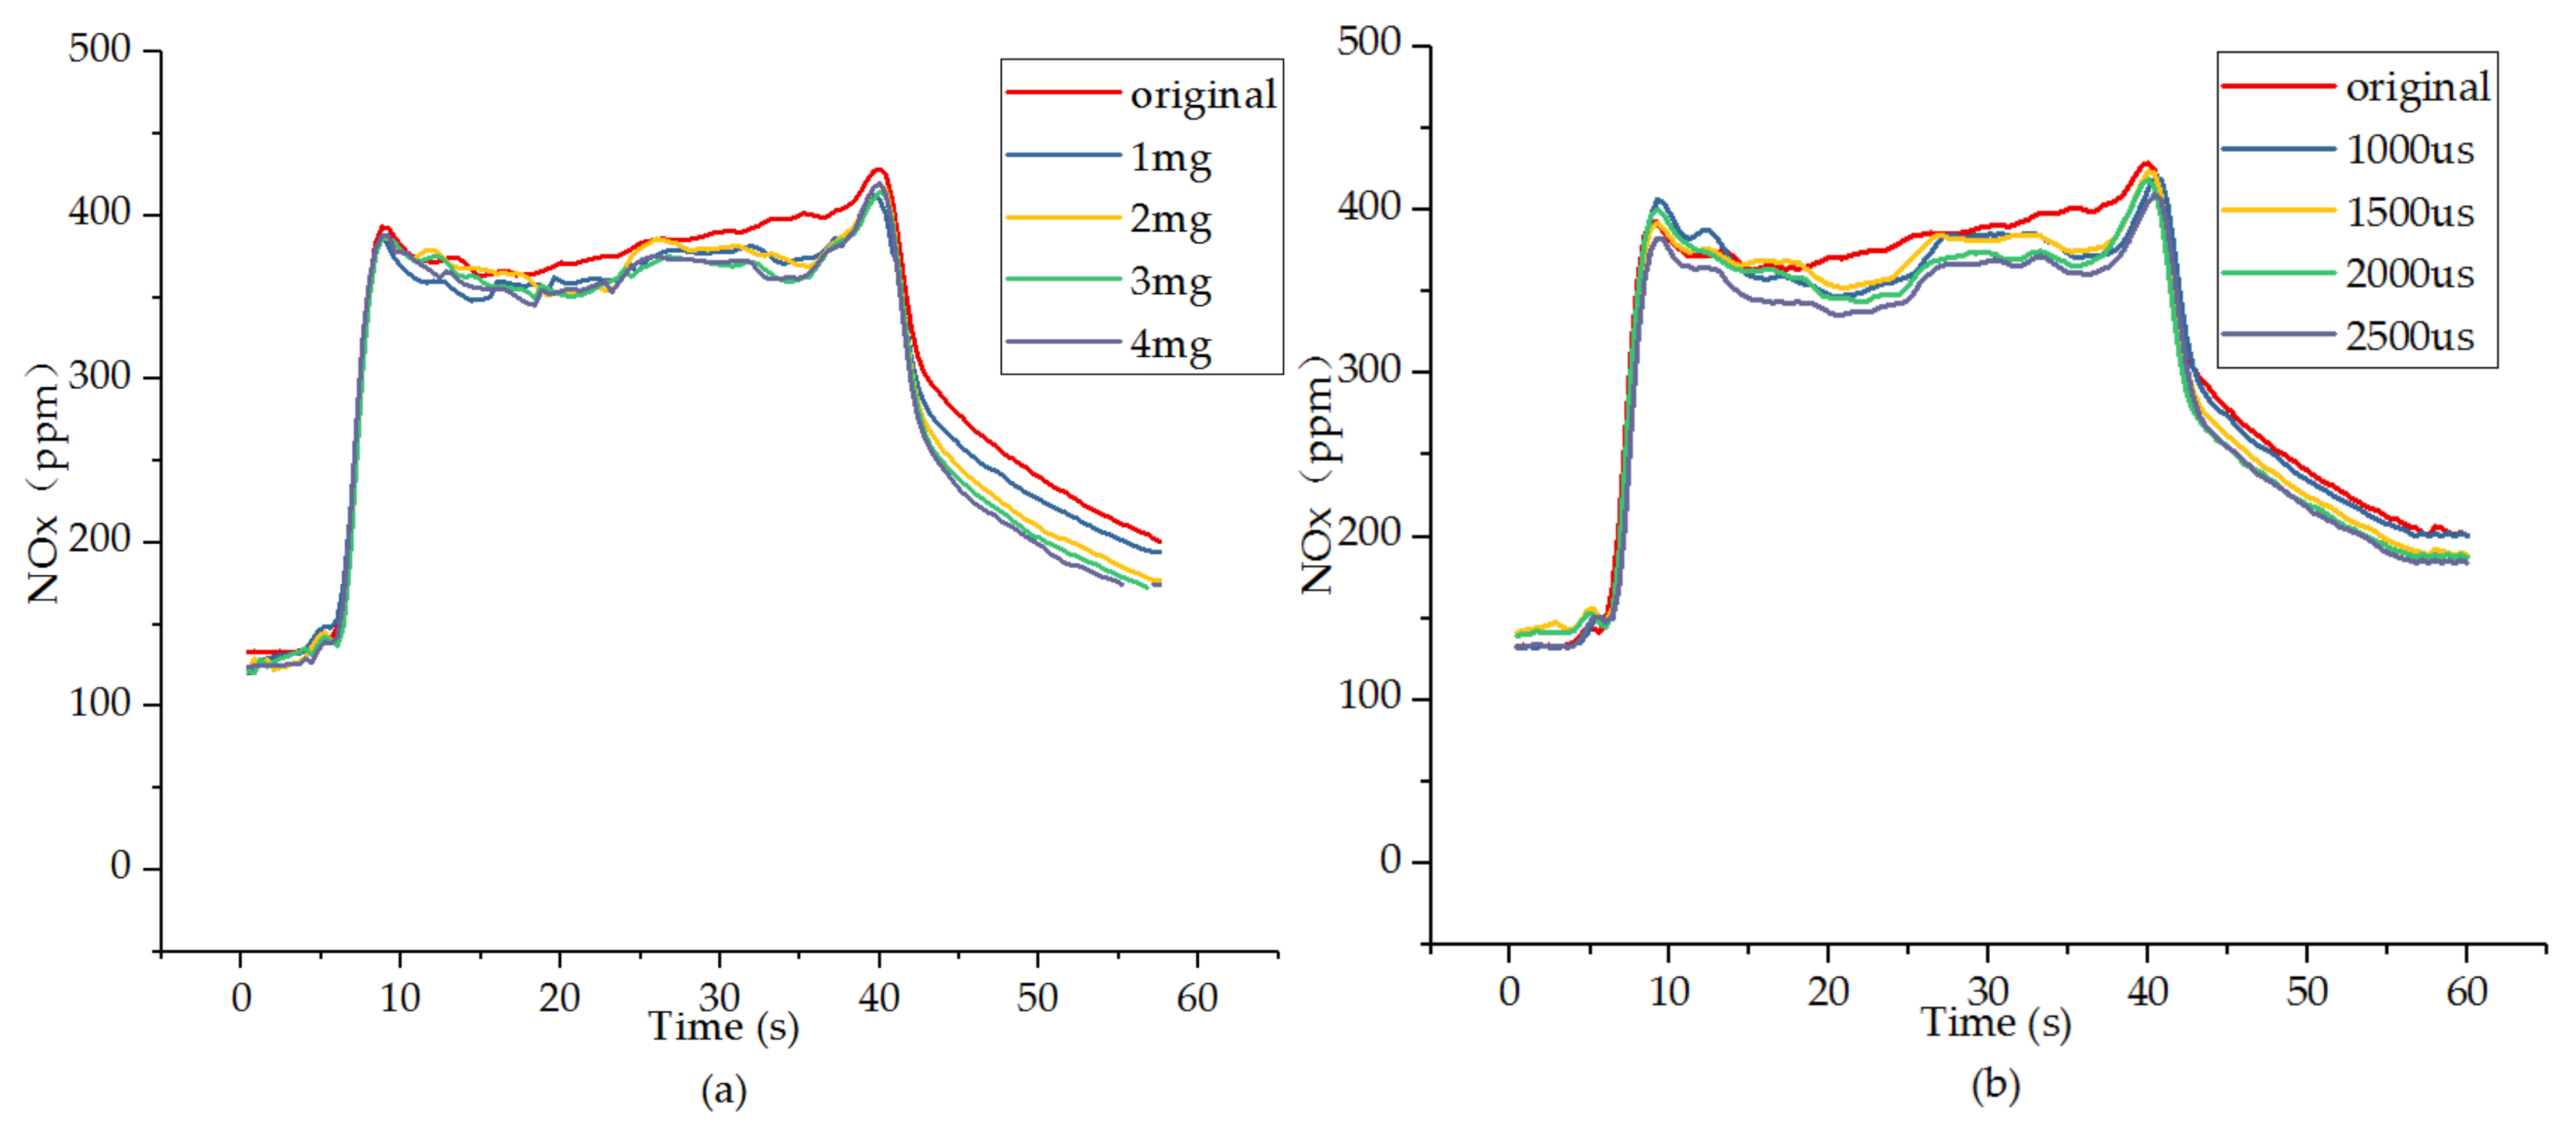
Figure 11a shows the variation in NOx emissions for different amount of post injection fuel during the transient process. It shows that during the loading process, the NOx emissions all increased sharply, and after reaching the peak, the NOx emissions decreased slightly and stabilized. In the subsequent transient unloading process, the NOx emissions increased again reach the peak value and then decreased. Generally, the amount of post injection has little effect on NOx emissions. There may be two reasons for it. On the one hand, due to the large EGR rate of the original engine, that makes the NOx emissions at a relatively low level, causing a slightly effect on NOx emissions by post injection. On the other hand, turbo charging lag reduces the oxygen content in cylinder, which cannot meet the oxygen-rich conditions for NOx emissions.
Figure 11b shows the variation in NOx emissions for different main-post injection time interval during the transient process. The results are similar to that the different post injection quantities on NOx emissions, it shows that different main-post injection time interval have little effect on NOx emissions. Thus it can been seen that during the loading process, under the condition of the high EGR ratio, post injection has slightly effect on the high temperature and oxygen-rich formation conditions of NOx emissions.

3.3. Effects of Main-Post Injection Time Interval on Combustion and Emissions

The effects of main-post injection time interval on CA50 and maximum cylinder pressure are shown in Figure 12. The amount of post injection fuel is 2 mg, the main-post injection interval are 1000 us, 1500 us, 2000 us, and 2500 us respectively, and the corresponding crank angle at 1600 r/min are 9.6°CA, 14.4°CA, 19.2°CA, and 24°CA. It shows that for the different main-post injection interval, CA50 is slightly lagging, and as the main-post injection interval increased, the angle of combustion center also increased. Meanwhile, the maximum burst pressure changed slightly with different injection interval. This is mainly because the map of main cycle injection fuel volume is the same during the loading process. The addition of post injection and the increase of main-post injection interval make CA50 delayed slightly.
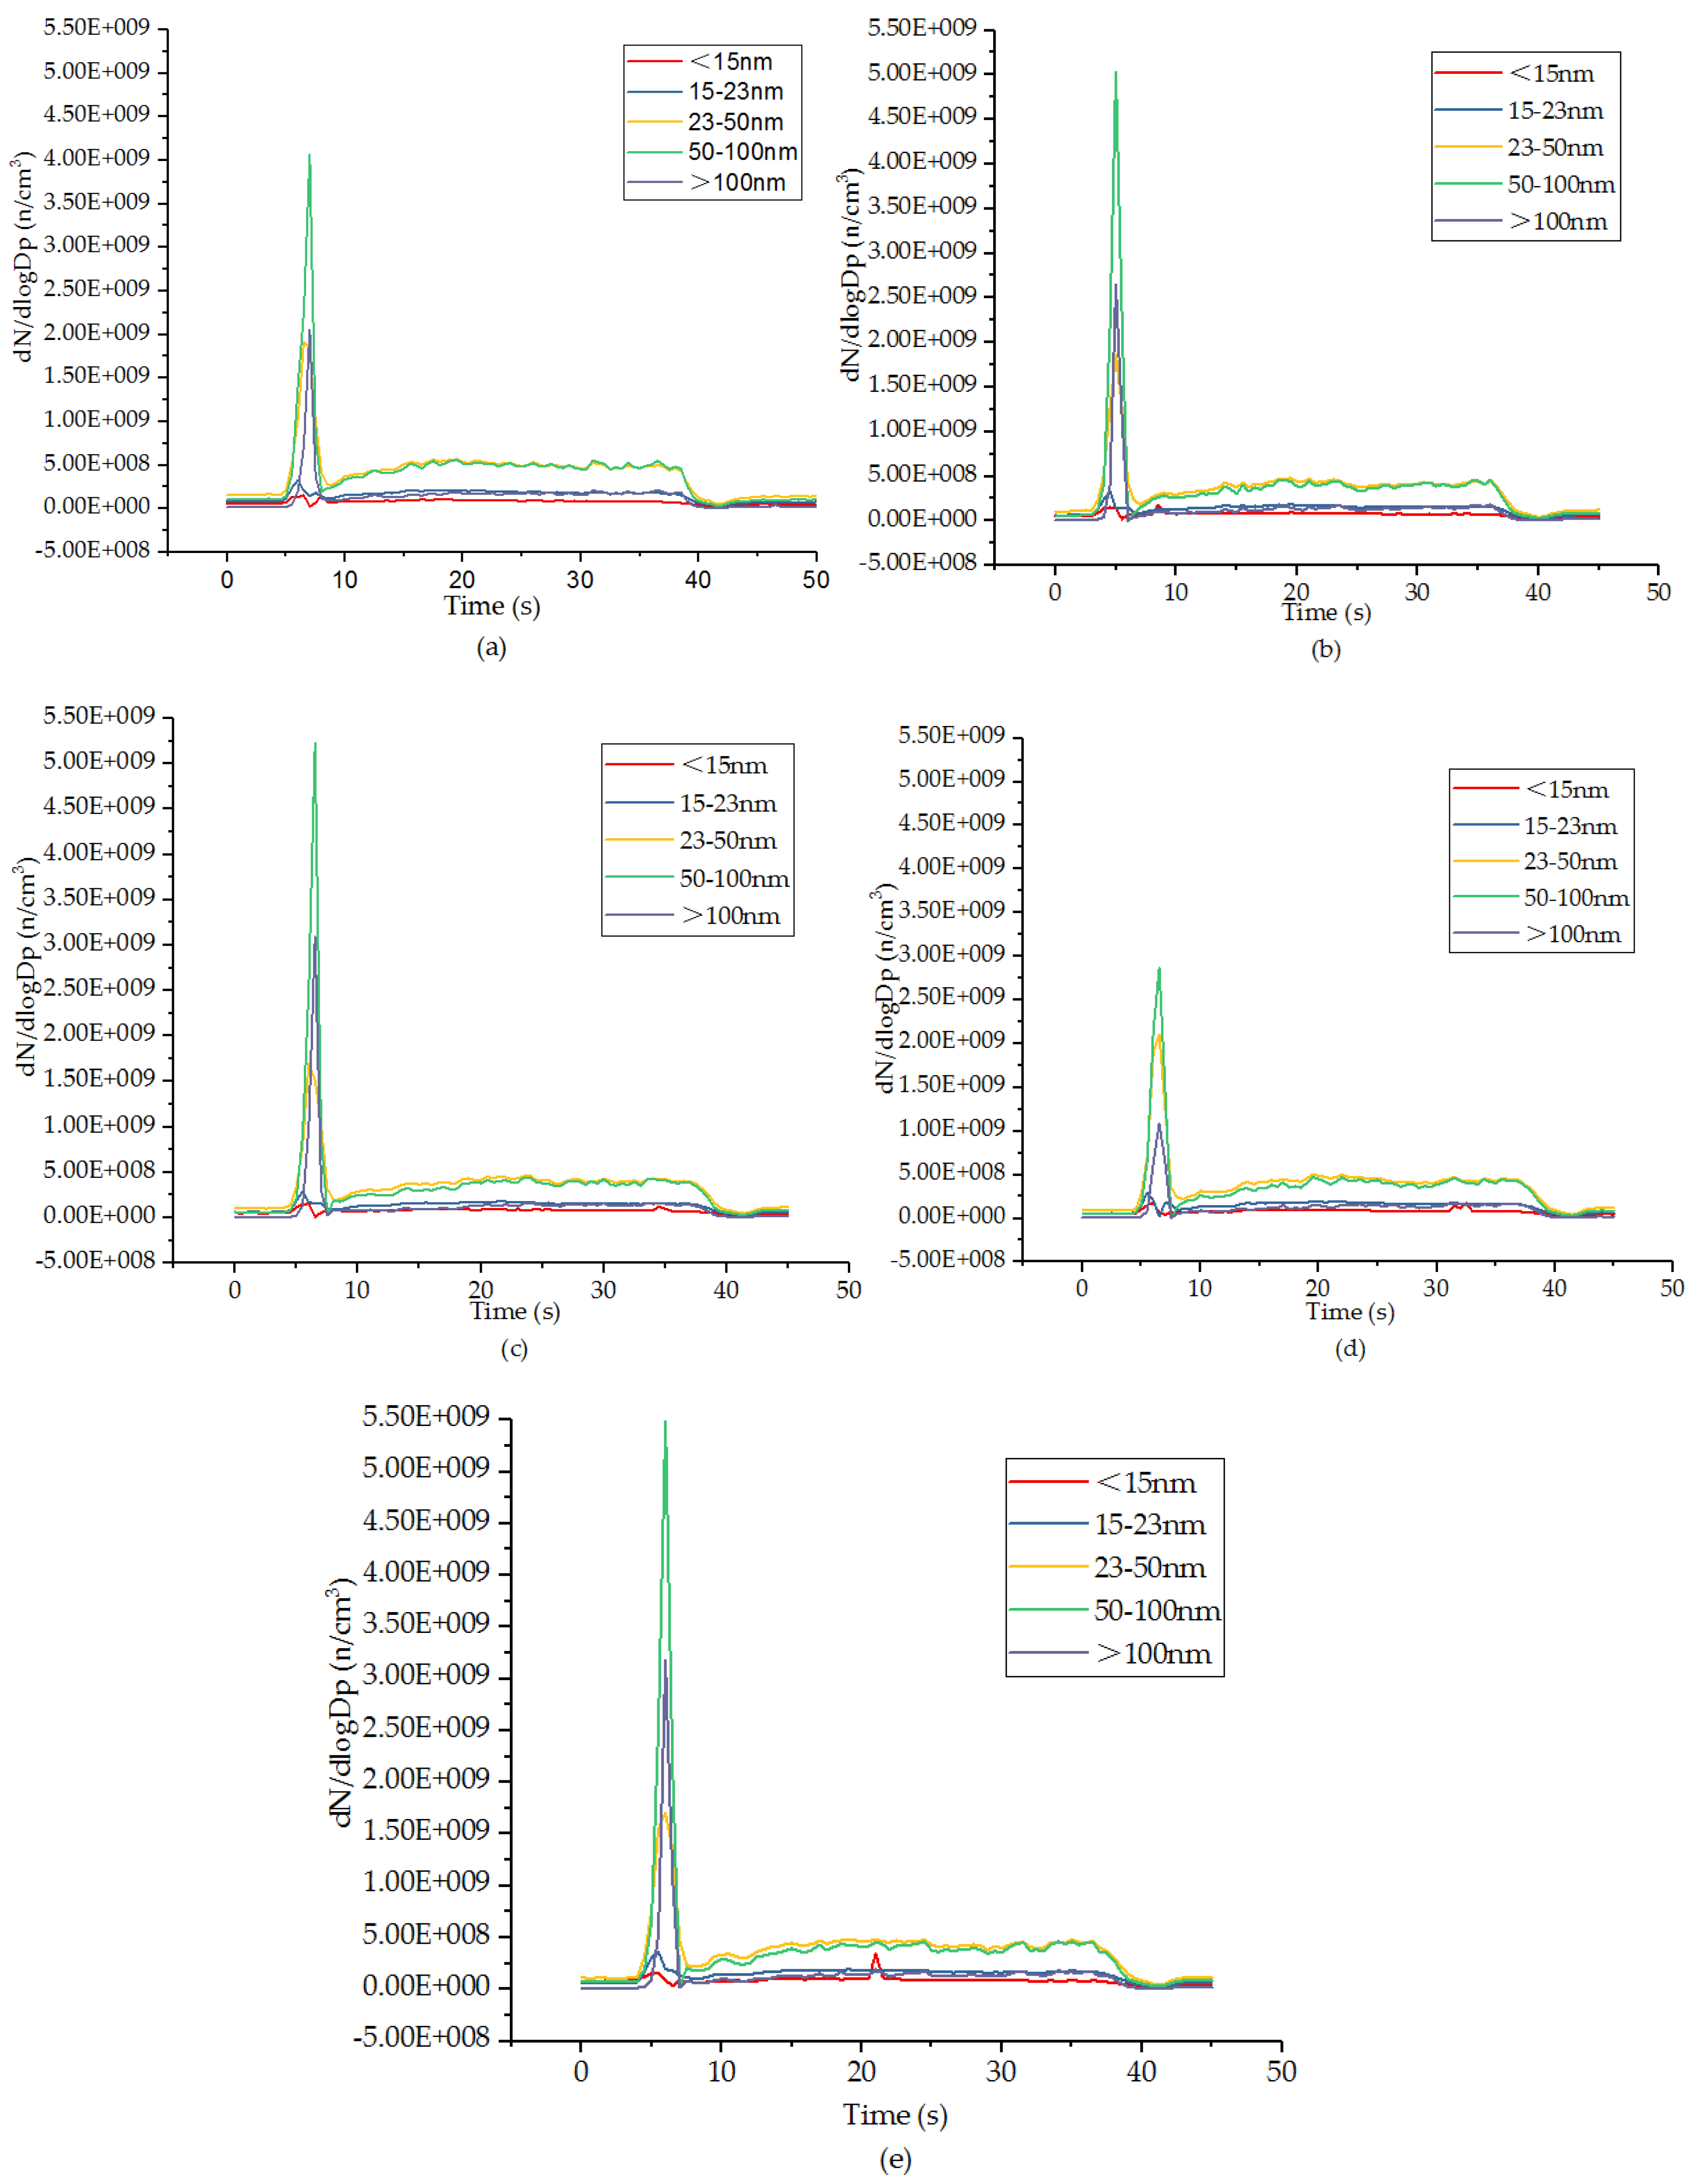
Figure 13 shows the variation in particulate matter number size distribution with different main-post injection time interval. The results indicate that with the continuous increase of the main-post injection time interval, the maximum number concentration of particles with the particle size of 50–100 nm and >100 nm firstly increased and then decreased, when the main-post injection time interval is 2000 us, about 19.2°CA, the peak number concentration is the lowest. Besides, although the particles with the size of 23–50 mm have a peak concentration during the loading process, it can be seen from Figure 5 and Figure 8, the post injection has little effect on the number concentration of the particle in this size range. In the meantime, loading and injection time interval still have no effect on particles with the size range of 15–23 nm and <15 nm. This is because when the interval of fuel injection timing is small, the main and post injection interval will be closer, the mixing time of the fuel injected by the post injection is too short, and it cannot be fully burned, resulting in the increase of larger size particles. However, when the main-post injection interval is too large, at this time, the internal volume of the cylinder is large, the equivalent compression ratio is relatively small, and the combustion efficiency is reduced. Simultaneously, the effects of the post injection on the airflow disturbance are reduced, the combustion of the post injection fuel is delayed, and the effect of particles being oxidized becomes worse, resulting in the increase in particles.

4. Conclusions

The work firstly has done some researches about the effects of loading and unloading timing (3 s, 5 s, and 7 s) on the particulate emissions and regulated emissions (HC, CO, and NOx emissions) deterioration of a diesel engine. Secondly, the effects of post injection on the combustion and emissions (especially particulate emissions) of diesel engine during transient loading process are also explored by experiments. Meanwhile, the effects of post injection on particles of different sizes are studied. Finally, the effects of post injection on combustion are further analyzed through numerical simulation. The main conclusions are summarized as follows:
(1)
During instantaneous loading process, the emissions are aggravated. By contrast, when the loading time is 3 s, the deterioration of particulate emissions, HC and CO emissions are the most serious, with the largest peak. The particles with the sizes range of 50–100 nm, 23–50 nm, and >100 nm show more considerably changes with the loading process. In comparison, the change in load has little effect on ultrafine particles with particle size of 15–23 nm and <15 nm.
(2)
Under the transient loading conditions, the post injection strengthens the disturbance of the flow field in the cylinder and promotes the mixing of fuel and particles with air, the post injection makes contribution to improve combustion efficiency and promote oxidation of particulate matter.
(3)
The addition of post injection will affect the number concentration of particles that size range of 50–100 nm and >100 nm, but the post injection has little effect on NOx emissions. When the amount of post injection fuel is 2 mg and the main-post injection interval is 2000 us, for the transient operating conditions of the test, the effect of suppressing particulate emissions is the best.
(4)
During the transient unloading process, due to the turbo charging lag, which causing more oxygen in cylinder, NOx emissions first slightly increased to a peak and then decreased.

Author Contributions

Data curation, writing—original draft preparation, S.F. and W.H.; Conceptualization, methodology, validation, investigation, resources, W.H. and Y.Y.; writing—review and editing, supervision, project administration, funding acquisition, Y.Y.; validation, investigation, T.Y. All authors have read and agreed to the published version of the manuscript.

Funding

This work is a key research and development plan supported by National Key R&D Program of China, Science and Technology Development Project of Jilin Province. This work is supported by National Key R&D Program of China (Grant No. 2017YFC0602000), Science and Technology Development Project of Jilin Province (Grant No. 20190303061SF) and Graduate Innovation Fund of Jilin University (Grant No.101832020CX129).

Conflicts of Interest

The authors declare no conflict of interest.

References

  1. Kanari, S.; Kii, M.; Suehiro, S. CO2 reduction and cast analysis for installed future technology of automobile. J. JSAE 2010, 64, 84–90. [Google Scholar]
  2. Rakopoulos, C.D.; Dimaratos, A.M.; Giakoumis, E.G.; Rakopoulos, D.C. Evaluation of the effect of engine, load and turbocharger parameters on transient emissions of diesel engine. Energy Convers. Manag. 2009, 50, 2381–2393. [Google Scholar] [CrossRef]
  3. Nilsson, T.; Froberg, A.; Aslund, J. Optimal operation of a turbocharged diesel engine during transients. SAE Int. J. Engines 2012, 5, 571–578. [Google Scholar] [CrossRef]
  4. Nikzadfar, K.; Shamekhi, A.H. An extended mean value model (EMVM) for control-oriented modeling of diesel engines transient performance and emissions. Fuel 2015, 154, 275–292. [Google Scholar] [CrossRef]
  5. Finesso, R.; Spessa, E. Real-time predictive modeling of combustion and NOx formation in diesel engines under transient conditions. SAE Tech. Pap. 2012. [Google Scholar] [CrossRef]
  6. Giakoumis, E.G.; Rakopoulos, C.D.; Dimaratos, A.M.; Rakopoulos, D.C. Exhaust emissions of diesel engines operating under transient conditions with biodiesel fuel blends. Prog. Energy Combust. 2012, 38, 691–715. [Google Scholar] [CrossRef]
  7. Giakoumis, E.G.; Dimaratos, A.M.; Rakopoulos, C.D. Experimental study of combustion noise radiation during transient turbocharged diesel engine operation. Energy 2011, 36, 4983–4995. [Google Scholar] [CrossRef]
  8. Resch, T.; Klarin, B. Analysis of engine dynamics under transient run-up conditions 2004-01-1454. SAE Tech. Pap. 2004. [Google Scholar] [CrossRef]
  9. Hyungsuk, K.; Patrick, V.F. Experimental investigation of transient emissions (HC and NOx) in a high-speed direct injection (HSDI) diesel engine 2005-01-3883. SAE Tech. Pap. 2005. [Google Scholar] [CrossRef]
  10. Giakoumis, E.G.; Alafouzos, A.I. Study of diesel engine performance and emissions during a Transient Cycle applying an engine mapping-based methodology. Appl. Energy. 2010, 87, 1358–1365. [Google Scholar] [CrossRef]
  11. Tufail, K.; Winstanley, T.; Karagiorgis, S.; Hardalupas, Y.; Taylor, A.M.K.P. Characterization of diesel engine pumping loss and control methodology for transient specific fuel consumption 2009-01-2748. SAE Tech. Pap. 2009. [Google Scholar] [CrossRef]
  12. Serrano, J.R.; Arnau, F.J.; Dolz, V.; Tiseira, A.; Lejeune, M.; Auffret, N. Analysis of the capabilities of a two-stage turbocharging system to fulfil the US2007 anti-pollution directive for heavy duty diesel engines. Int. J. Automot. Technol. 2008, 9, 277–288. [Google Scholar] [CrossRef]
  13. Tavcar, G.; Bizjan, F.; Katrasnik, T. Methods for improving transient response of diesel engines—Influences of different electrically assisted turbocharging topologies. Proc. Inst. Mech. Eng. Part. D J. Automob. Eng. 2011, 225, 1167–1185. [Google Scholar] [CrossRef]
  14. Giakoumis, E.G.; Tziolas, V. Modeling a Variable-Geometry Turbocharged Diesel Engine under Steady-State and Transient Conditions. J. Energy Eng. 2018, 144, 04018017. [Google Scholar] [CrossRef]
  15. Shutty, J. Control Strategy Optimization for Hybrid EGR Engines 2009-01-1451. SAE Tech. Pap. 2009. [Google Scholar] [CrossRef]
  16. Heuwetter, D.; Glewen, W.; Meyer, C.; Foster, D.E.; Andrie, M.; Krieger, R. Effects of Low Pressure EGR on Transient Air System Performance and Emissions for Low Temperature Diesel Combustion 2011-24-0062. SAE Tech. Pap. 2011. [Google Scholar] [CrossRef]
  17. Nam, K.; Yu, J.; Cho, S. Improvement of Fuel Economy and Transient Control in a Passenger Diesel Engine Using LP (Low Pressure)-EGR 2011-01-0400. SAE Techn. Pap. 2011. [Google Scholar] [CrossRef]
  18. Zhang, F.; Wang, Z.; Tian, J.; Li, L.; Yu, K.; He, K. Effect of EGR and Fuel Injection Strategies on the Heavy-Duty Diesel Engine Emission Performance under Transient Operation. Energies 2020, 13, 566. [Google Scholar] [CrossRef] [Green Version]
  19. Tan, P.Q.; Ruan, S.S.; Hu, Z.Y.; Lou, D.M.; Li, H. Particle number emissions from a light-duty diesel engine with biodiesel fuels under transient-state operating conditions. Appl. Energy 2014, 113, 22–31. [Google Scholar] [CrossRef]
  20. Katoshevski, D.; Ruzal, M.; Shakked, T.; Sher, E. Particle grouping, a new method for reducing emission of submicron particles from diesel engines. Fuel 2012, 89, 2411–2416. [Google Scholar] [CrossRef]
  21. Ushakov, S.; Valland, H.; Nielsen, J.B.; Hennie, E. Particle size distributions from heavy-duty diesel engine operated on low-sulfur marine fuel. Fuel Process. Technol. 2013, 106, 350–358. [Google Scholar] [CrossRef]
  22. Wihersaari, H.; Pirjola, L.; Karjalainen, P.; Saukko, E.; Kuuluvainen, H.; Kulmala, K.; Keskinen, J.; Rönkkö, T. Particulate emissions of a modern diesel passenger car under laboratory and real-world transient driving conditions. Environ. Pollut. 2020, 265, 114948. [Google Scholar] [CrossRef] [PubMed]
  23. Zare, A.; Bodisco, T.A.; Nabi, M.N.; Hossain, F.M.; Ristovski, Z.D.; Brown, R.J. Engine Performance during Transient and Steady-State Operation with Oxygenated Fuels. Energy Fuels 2017, 31, 7510–7522. [Google Scholar] [CrossRef]
  24. Sun, W.; Wang, Q.; Guo, L.; Cheng, P.; Li, D.; Yan, Y. Inflence of biodiesel/diesel blends on particle size distribution of CI engine under steady/transient conditions. Fuel 2019, 245, 336–344. [Google Scholar] [CrossRef]
  25. Zhang, H.; Guo, L.; Yan, Y.; Sun, W.; Li, J.; Wang, Q.; Sun, Y. Experimental investigation on the combustion and emissions characteristics of an N-butanol/CTL dual fuel engine. Fuel 2020, 274, 117696. [Google Scholar] [CrossRef]
  26. Feng, S.; Hong, W.; Li, X.; Xie, F.; Su, Y. The influence of DISI engine control parameters and M15 fuel on regulated and particulate emissions under light-load. Fuel 2020, 276, 118024. [Google Scholar] [CrossRef]
  27. Jian, W.; Storey, J.; Domingo, N.; Huff, S.; Thomas, J.; West, B. Studies of Diesel Engine Particle Emissions During Transient Operations Using an Engine Exhaust Particle Sizer. Aerosol Sci. Technol. 2006, 40, 1002–1015. [Google Scholar] [CrossRef]
  28. Giakoumis, E.G.; Rakopoulos, C.D.; Rakopoulos, D.C. Assessment of NOx Emissions during Transient Diesel Engine Operation with Biodiesel Blends. J. Energy Eng. 2014, 140, A4014004. [Google Scholar] [CrossRef]
  29. Khan, H.; Soudagar, M.; Kumar, R.H.; Safaei, M.R.; Farooq, M.; Khidmatgar, A.; Banapurmath, N.R.; Farade., R.A.; Abbas, M.M.; Afzal, A.; et al. Effect of Nano-Graphene Oxide and n-Butanol Fuel Additives Blended with Diesel—Nigella sativa Biodiesel Fuel Emulsion on Diesel Engine Characteristics. Symmetry 2020, 12, 961. [Google Scholar] [CrossRef]
  30. Yoon, S.H.; Lee, C.S. Effect of biofuels combustion on the nanoparticle and emission characteristics of a common-rail DI diesel engine. Fuel 2011, 90, 3071–3077. [Google Scholar] [CrossRef]
  31. Chen, P.; Ibrahim, U.; Wang, J. Experimental investigation of diesel and biodiesel post injections during active diesel particulate filter regenerations. Fuel 2014, 130, 286–295. [Google Scholar] [CrossRef]
  32. Čedík, J.; Pexa, M.; Holúbek, M.; Aleš, Z.; Pražan, R.; Kuchar, P. Effect of Diesel Fuel-Coconut Oil-Butanol Blends on Operational Parameters of Diesel Engine. Energies 2020, 13, 3796. [Google Scholar] [CrossRef]
  33. Zheng, Z.; Yue, L.; Liu, H. Effect of two-stage injection on combustion and emissions under high EGR rate on a diesel engine by fueling blends of diesel/gasoline, diesel/n-butanol, diesel/gasoline/n-butanol and pure diesel. Energy Convers. Manag. 2015, 90, 1–11. [Google Scholar] [CrossRef]
  34. O’Connor, J.; Musculus, M. Post Injections for Soot Reduction in Diesel Engines: A Review of Current Understanding. SAE Int. J. Engines 2013, 6, 400–421. [Google Scholar] [CrossRef] [Green Version]
  35. Wu, Y.; Wang, P.; Farhan, S.M.; Yi, J.; Lei, L. Effect of post injection on combustion and exhaust emissions in DI diesel engine. Fuel 2019, 258, 116131. [Google Scholar] [CrossRef]
  36. Guan, W.; Pedrozo, V.B.; Zhao, H.; Ban, Z.; Lin, T. Miller cycle combined with exhaust gas recirculation and post–fuel injection for emissions and exhaust gas temperature control of a heavy-duty diesel engine. Int. J. Engine Res. 2019, 21, 1381–1397. [Google Scholar] [CrossRef] [Green Version]
  37. Sosnowski, M.; Krzywanski, J.; Grabowska, K.; Gnatowska, R. Polyhedral meshing in numerical analysis of conjugate heat transfer. Eur. Phys. J. Conf. 2018, 180, 02096. [Google Scholar] [CrossRef]
  38. Makri, K.; Lockett, R.; Jeshani, M. Dynamics of Post-Injection Fuel Flow in Mini-Sac Diesel Injectors Part 1: Admission of External Gases and Implications for Deposit Formation. Int. J. Engine Res. 2019. [Google Scholar] [CrossRef] [Green Version]
  39. Zhuang, J.; Qiao, X.; Bai, J.; Hu, Z. Effect of injection-strategy on combustion, performance and emission characteristics in a DI-diesel engine fueled with diesel from direct coal liquefaction. Fuel 2014, 121, 141–148. [Google Scholar] [CrossRef]
  40. Farhan, M.; Pan, W.; Yan, W.; Jing, Y.; Lili, L. Impact of post-injection strategies on combustion and unregulated emissions during different loads in an HSDI diesel engine. Fuel 2020, 267, 117256. [Google Scholar] [CrossRef]
  41. Liu, Z.; Yuan, X.; Tian, J.; Han, Y.; Li, R.; Gao, G. Investigation of Sectional-Stage Loading Strategies on a Two-Stage Turbocharged Heavy-Duty Diesel Engine under Transient Operation with EGR. Energies 2018, 11, 69. [Google Scholar] [CrossRef] [Green Version]
  42. Tree, D.R.; Svensson, K.I. Soot processes in compression ignition engines. Prog. Energy Combust. 2007, 33, 272–309. [Google Scholar] [CrossRef]
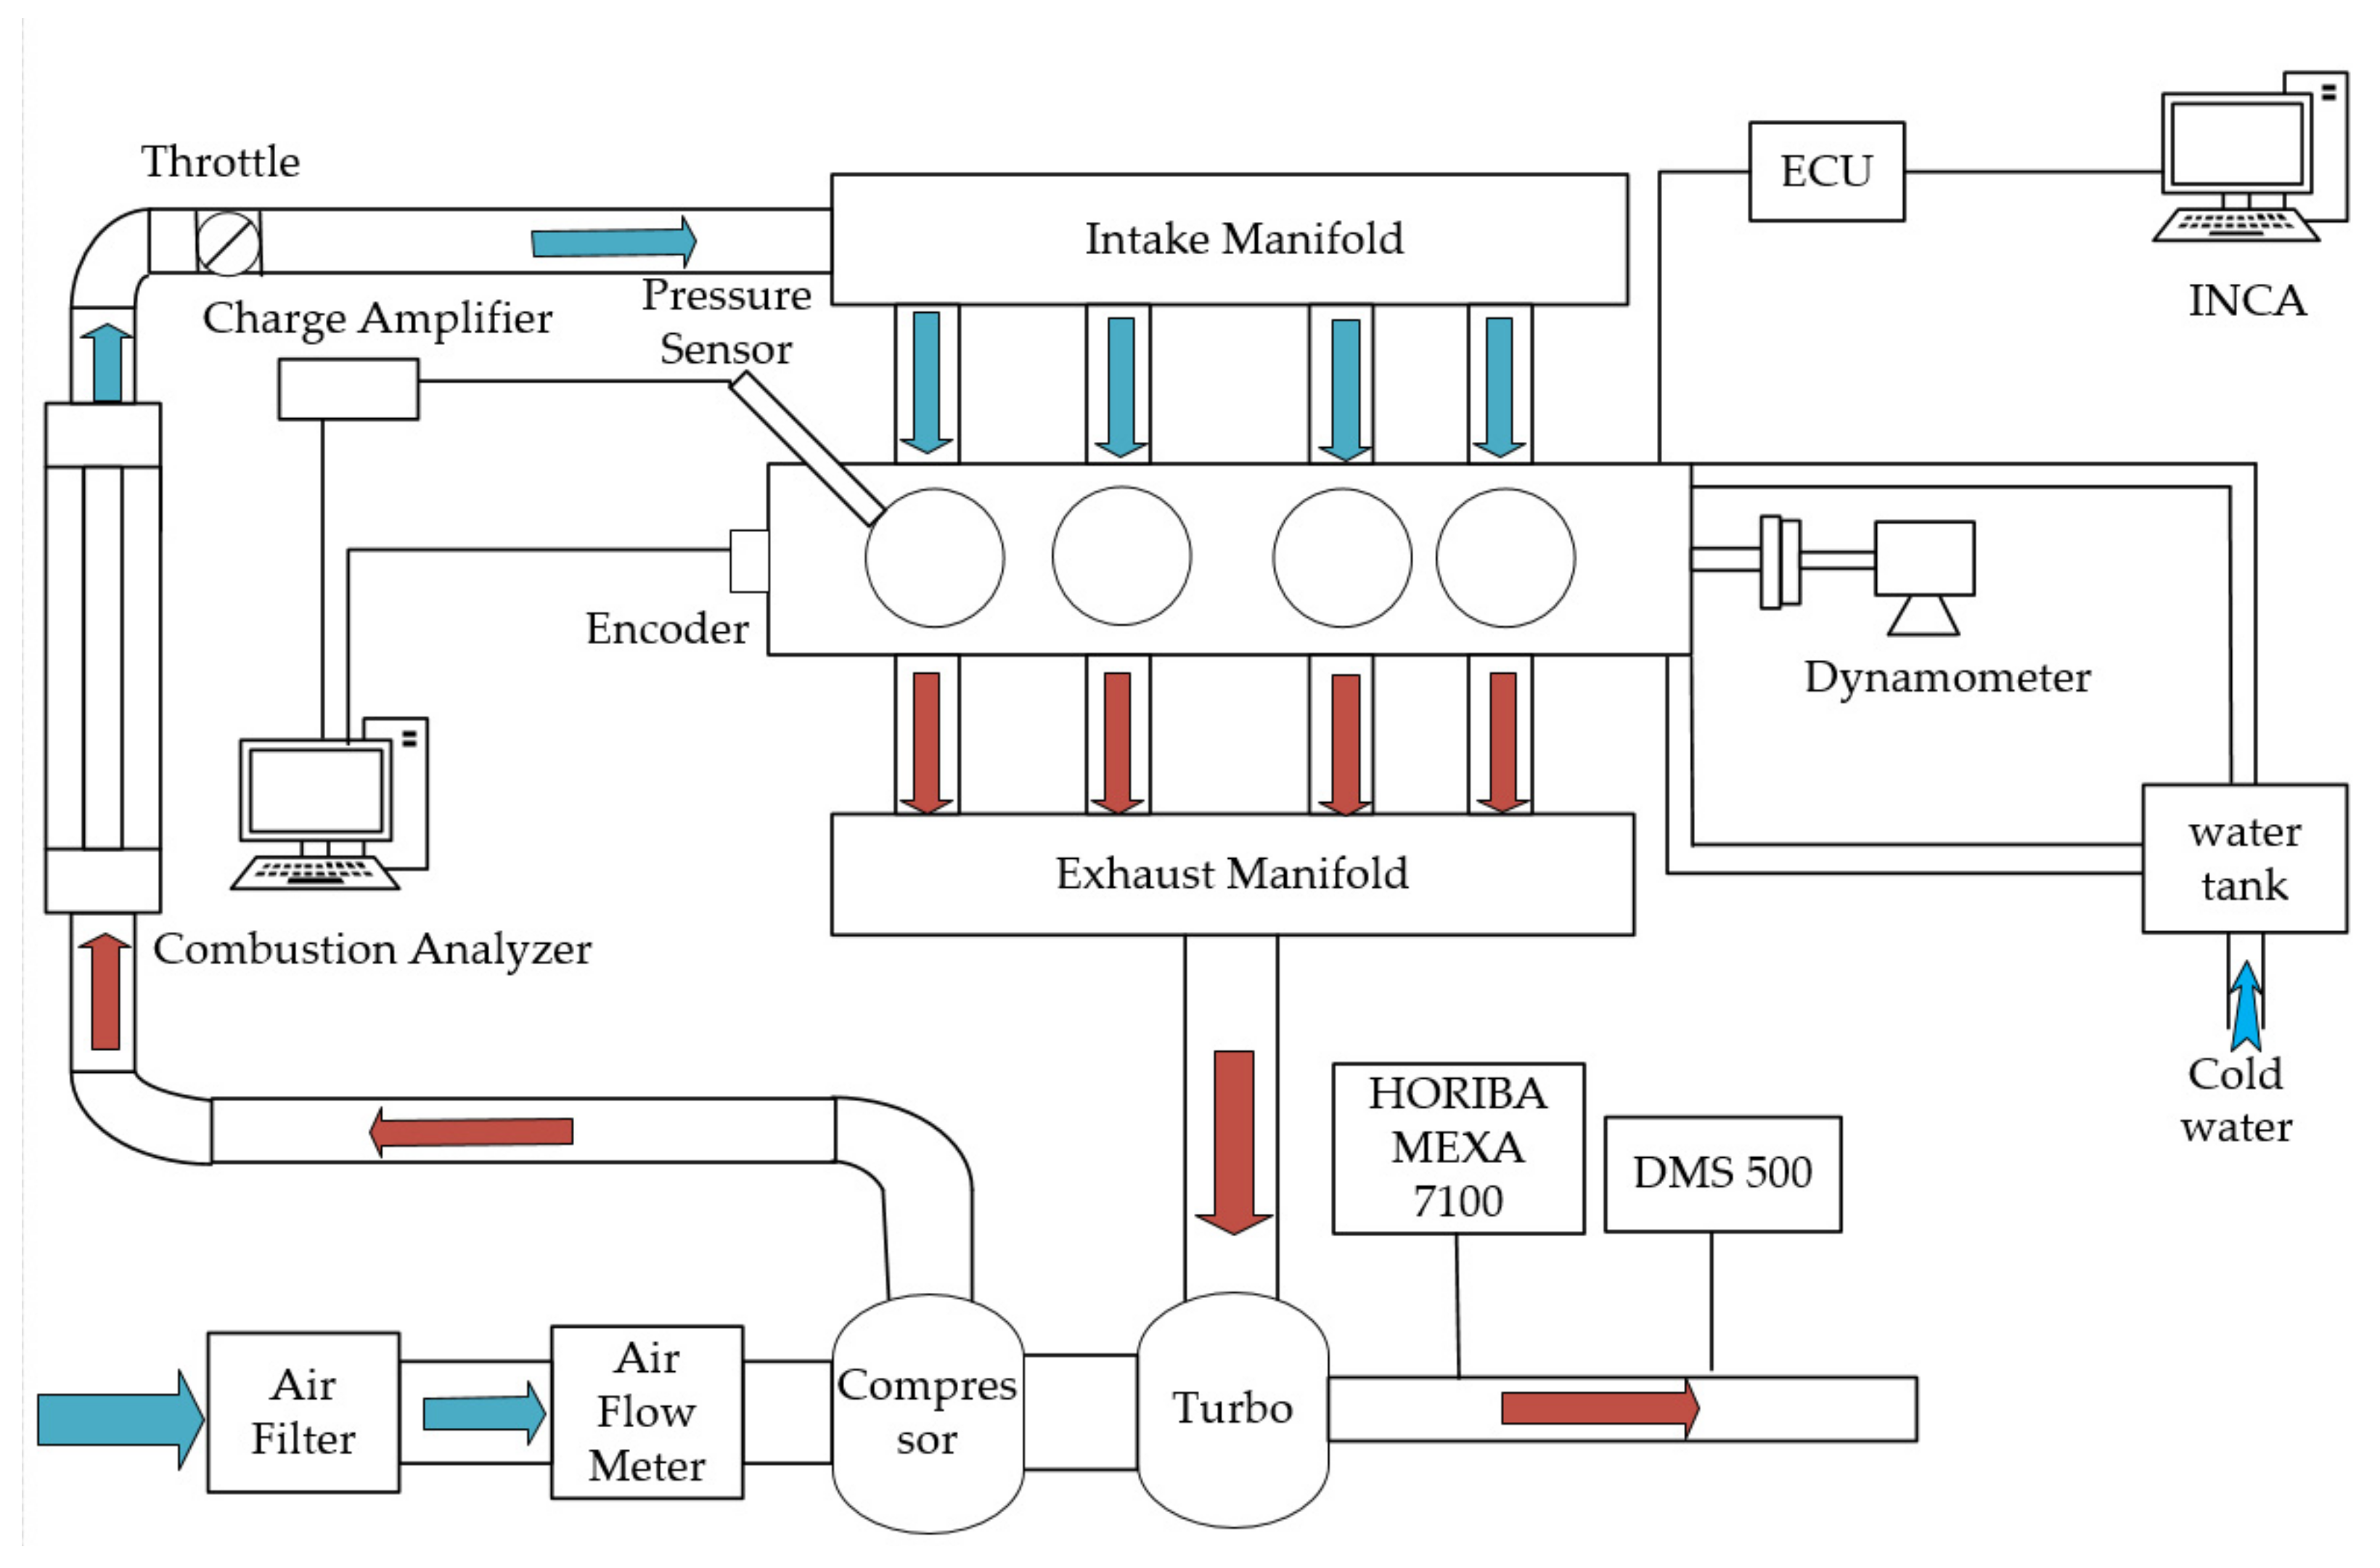
Figure 1. Schematic diagram of the experimental apparatus.
Symmetry 12 02002 g001
Figure 2. Computational grid model.
Symmetry 12 02002 g002
Figure 3. The model verification of cylinder pressure under different operating conditions: (a) 1600 r/min, 25% load; (b) 1600 r/min, 50% load.
Symmetry 12 02002 g003
Figure 4. Schematic diagram of the engine transient process.
Symmetry 12 02002 g004
Figure 5. Effects of loading and unloading duration on emissions under different particle size distribution conditions: (a) Total; (b) nucleation mode; (c) accumulation mode.
Symmetry 12 02002 g005
Figure 6. Effects of loading and unloading duration on emissions under different particle size distribution conditions: (a) CO and HC emissions; (b) NOx emissions.
Symmetry 12 02002 g006
Figure 7. Effects of different amount of post injection on CA50 and Pmax vs. Time: (a) CA50; (b) Pmax.
Symmetry 12 02002 g007
Figure 8. Effects of different amount of post injection on particulate matter number size distribution vs. Time: (a) Original; (b) 1 mg; (c) 2 mg; (d) 3 mg; and (e) 4 mg.
Symmetry 12 02002 g008
Figure 9. O2 concentration field in the cylinder from the beginning to the end of the post injection.
Symmetry 12 02002 g009aSymmetry 12 02002 g009b
Figure 10. The velocity field distribution diagram in the cylinder when the crank angle is 16°CA ATDC.
Symmetry 12 02002 g010
Figure 11. Post injection quantity and main-post injection time interval on NOx emissions vs. Time: (a) Post injection quantity; (b) main-post injection time interval.
Symmetry 12 02002 g011
Figure 12. Effects of main-post injection time interval on CA50 and Pmax vs. Time: (a) CA50; (b) Pmax.
Symmetry 12 02002 g012
Figure 13. Effects of main-post injection time interval on particulate matter number size distribution vs. Time: (a) Original; (b) 1000 us; (c) 1500 us; (d) 2000 us; and (e) 2500 us.
Symmetry 12 02002 g013
Table 1. Detailed technical specifications of the test engine.
Engine ParametersSpecifications
Engine TypeHigh-pressure, common-rail, in line, 4-cylinder, 4-stroke
Displacement3.17 L
Bore × Stroke98 mm × 105 mm
Compression Ratio17:1
Maximum injection pressure160 MPa
Idling speed800 ± 30 rpm
Maximum Torque320 N·m (1600 rpm)
Maximum Power81 kW (2400 rpm)
Table 2. Specifications of the measurement devices.
EquipmentModelAccuracyCountry
DynamometerCW160Torque: ±2 N·m
Speed: ±1 rpm
China
Pressure sensorKISTLER 6052CU20±0.3%Switzerland
Charge amplifierKISTLER 5015±0.6%Switzerland
Crank angle encoderKISTLER 2614CK±0.5°Switzerland
Air flow meterSENSYCON±0.5%China
Fuel flow meterDF-2420±0.2%China
Exhaust gas analyzerHORIBA MEXA 7100THC: ±30 ppm
CO: ±0.01%
NO: ±20 ppm
Japan
Publisher’s Note: MDPI stays neutral with regard to jurisdictional claims in published maps and institutional affiliations.