
Skip to Content
SymmetrySymmetry
  • Article
  • Open Access

3 December 2020

Anthropometric Landmarks Extraction and Dimensions Measurement Based on ResNet

,
,
,
and
College of Computer Science and Technology, China University of Petroleum (East China), Qingdao 266580, China
*
Author to whom correspondence should be addressed.
This article belongs to the Special Issue Deep Learning-Based Biometric Technologies II

Abstract

Anthropometric dimensions can be acquired in 2D images by landmarks. Body shape variance causes low accuracy and bad robustness of landmarks extracted, and it is difficult to determine the position of axis division point when dimensions are calculated by the ellipse model. In this paper, landmarks are extracted from images by convolutional neural network instead of the gradient of body outline. A general multi-ellipse model is proposed, the anthropometric dimensions are obtained from the length of different elliptical segments and the position of axis division point is determined by thickness–width ratio of body parts. Finally, an evaluation is completed based on 87 subjects, in which it turns out that the average accuracy of our method for identifying landmarks is 96.6%, when the number of rotation angles is 2, the three main dimensional errors calculated by our model are smaller than existing method, and the errors of other dimensions are also within the margin of error for garment measuring.

1. Introduction

Anthropometry is an important part of ergonomics, which can be applied to garment customization, virtual fitting [1], somatotype [2,3,4] and other fields. Anthropometric dimension measurement [5] based on 2D images has attracted wide attention due to its high efficiency, portability, and cheapness. Most of the measurement methods rely on landmarks that are based on body silhouette and the accuracy of extracting landmarks affects the accuracy [6] of the dimensions. In recent years, experiments have shown that Convolutional Neural Network (CNN) has absolute advantages in pose estimate [7,8,9], image segmentation [10,11,12], but this technology has not been applied to the extraction of landmarks. Therefore, it is significant to integrate anthropometric dimension measurement with convolutional neural networks.
The anthropometric dimension measurement method based on 2D images is divided into three steps. First, the silhouette of the human body is extracted from 2D images. Then, the landmarks are extracted from silhouettes based on gradient. Finally, the anthropometric dimensions are calculated from the positional relationship between landmarks. For example, the double ellipse model [13] whose error is caused by the inaccuracy of silhouette extraction, the difference between human body shape and the fixed proportion of minor semi-axis division of ellipse.
This paper proposes a method of measuring anthropometric dimensions based on 2D images, which extracts landmarks from images through a convolutional neural network and builds a general multi-ellipse model in which body shape information is added to correct ellipse model for avoiding the error caused by the extraction of silhouette and double ellipse model. What is more important is that this method guarantees the high correlation between landmarks and body part, and the robustness of landmarks is extracted. Considering the human images of any resolution as the input of the network, we annotate 14 landmarks on the front and side images respectively and train these images separately by 101-layer ResNet [14], which outputs the heatmap of landmarks in images first and then outputs the precise coordinates of landmarks. In applications, a person is required to wear tights and stand with a fixed posture that allows slight posture changes, whose purpose is to reduce the deformation range of posture so that network can learn the spatial location of landmarks in the human body better. The body shape information of the human is retained, and the position of axis division point in the ellipse model is determined by the thickness–width ratio of body parts. First, real data are used to calculate the deformation range of thickness–width ratio of body parts and the position of axis division point, then establish a functional relationship between thickness–width ratio of body parts and the position of division point. By comparing 21 main dimensions measured with real data, it is confirmed that errors are within the margin of error for garment measuring (within 2 cm), and error calculated by the multi-ellipse model is smaller than the existing method.
Our contributions are as follows:
(1)
A new way to extract landmarks from 2D images is proposed, that is, extracting landmarks by a deep convolutional neural network.
(2)
A multi-ellipse model is proposed, and the position of the axis division point of the ellipse model is determined by the thickness–width ratio of the body parts, which reduces the error of anthropometric dimensions.
(3)
The method is evaluated on real samples and compared with other methods, which shows the accuracy of the multi-ellipse model when the number of images is 2.

3. Proposed Method

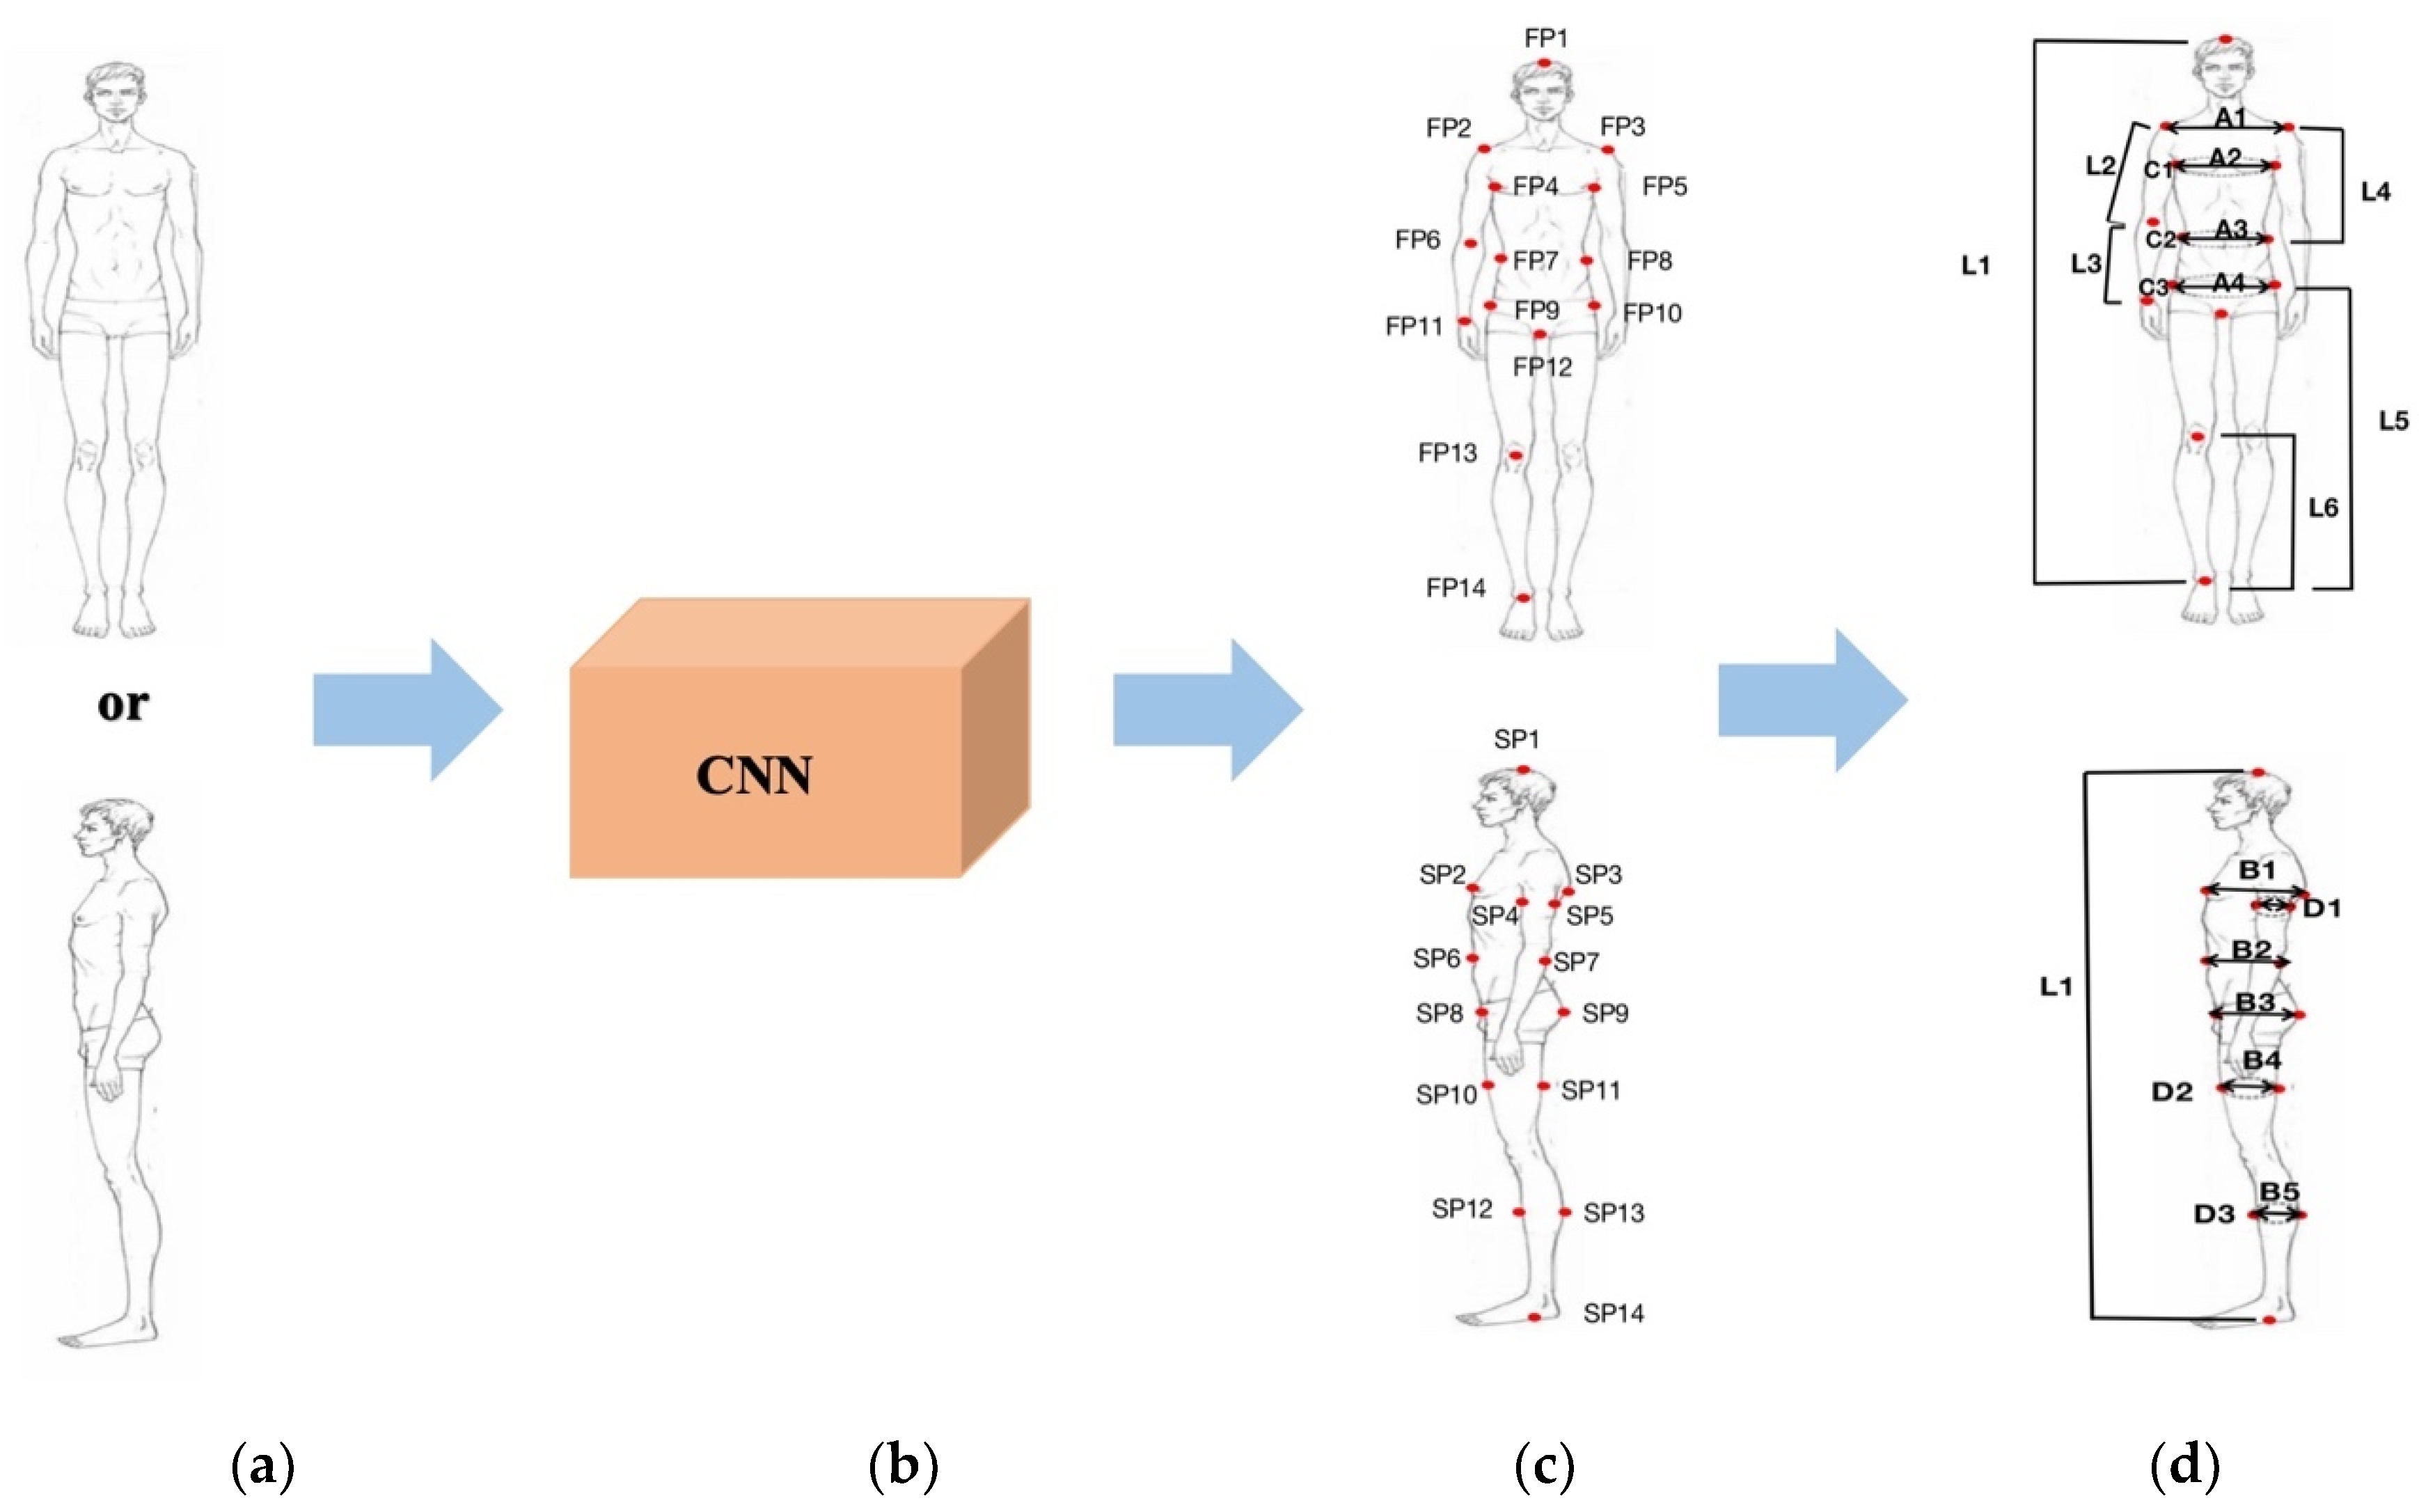
Figure 1 shows the process of the algorithm. First, we input human images on the front or side into 101-layer ResNet, which extracts features of images and predicts the heatmap of landmarks. The final output is the coordinate of landmarks. After that, the body parts are modeled, and the dimensions are calculated based on the landmarks.
Figure 1. The overview of measurement algorithms. (a) Input images; (b) Convolutional Neural Network; (c) Landmarks extraction; (d) Anthropometric dimensions measurement.

3.1. Landmarks Extraction Based on ResNet

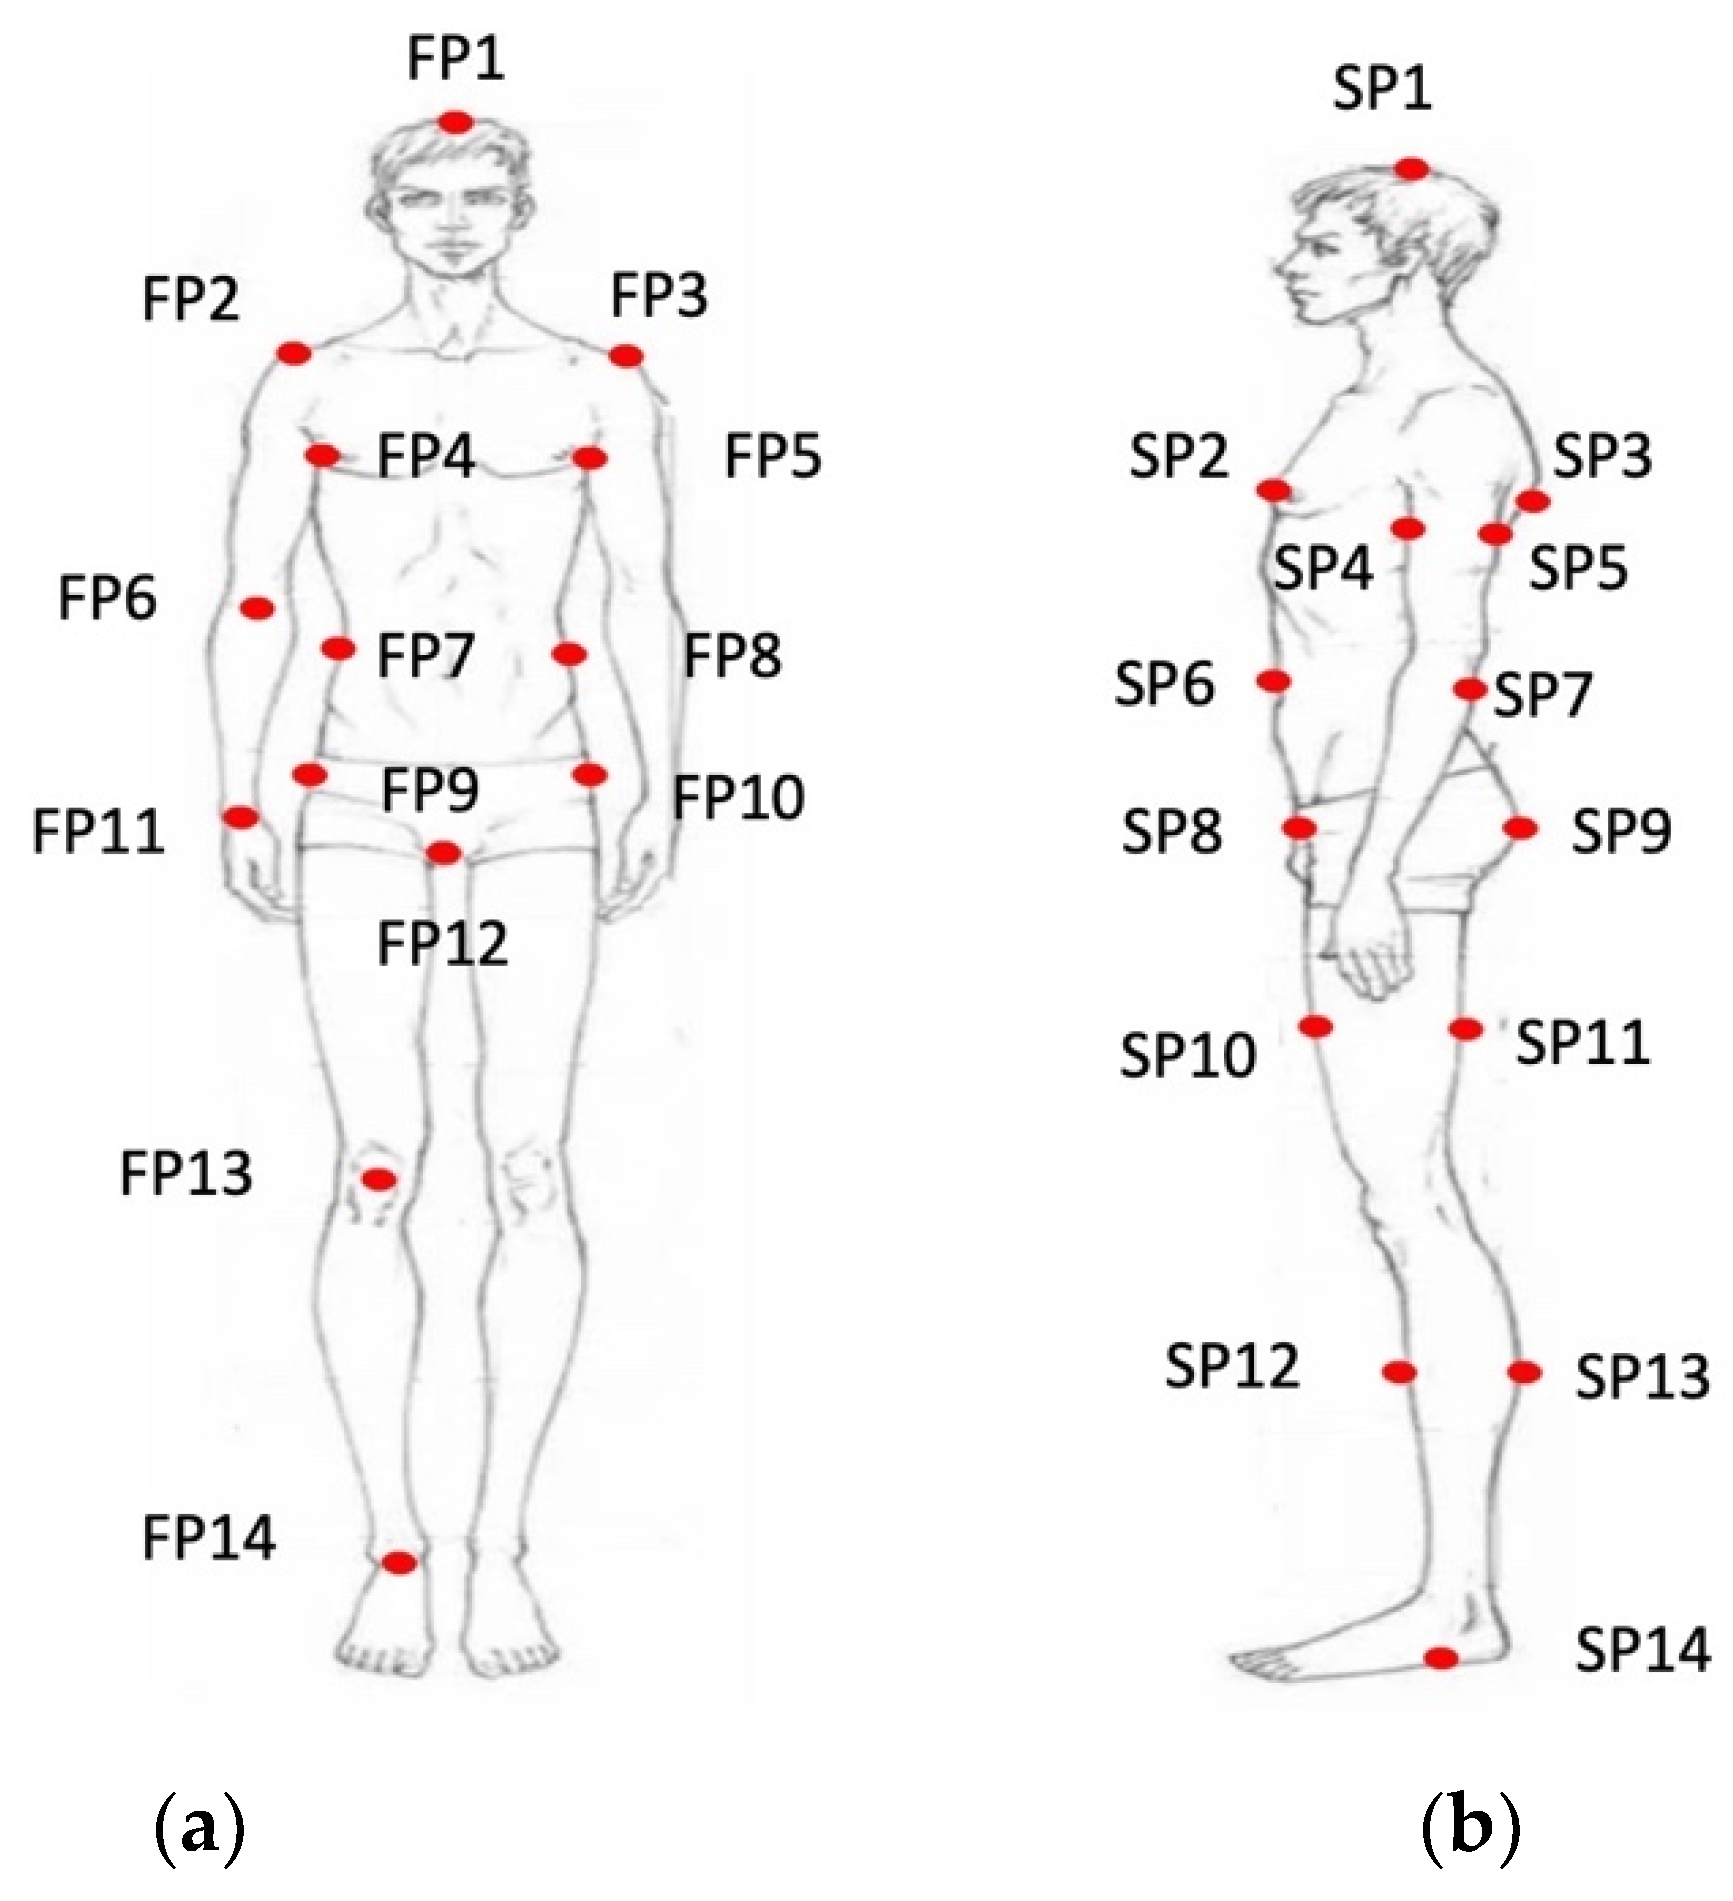
Measuring methods based on 2D images rely on landmarks highly related to body parts, and the accuracy of landmarks extraction directly affects measurement error. As is shown in Table 1, the coordinates of landmarks in the image are marked according to the method specified by GB/T 38131-2019 [21], which is the same as pose estimation [19]. The convolution neural network is used to implicitly learn the spatial information of the human body and the position of landmarks in the structure of the human body. Figure 2 shows all landmarks marked, with F representing the front and S representing the side.
Table 1. The definition of landmarks.
Figure 2. The landmarks. (a) Front image; (b) Side image.
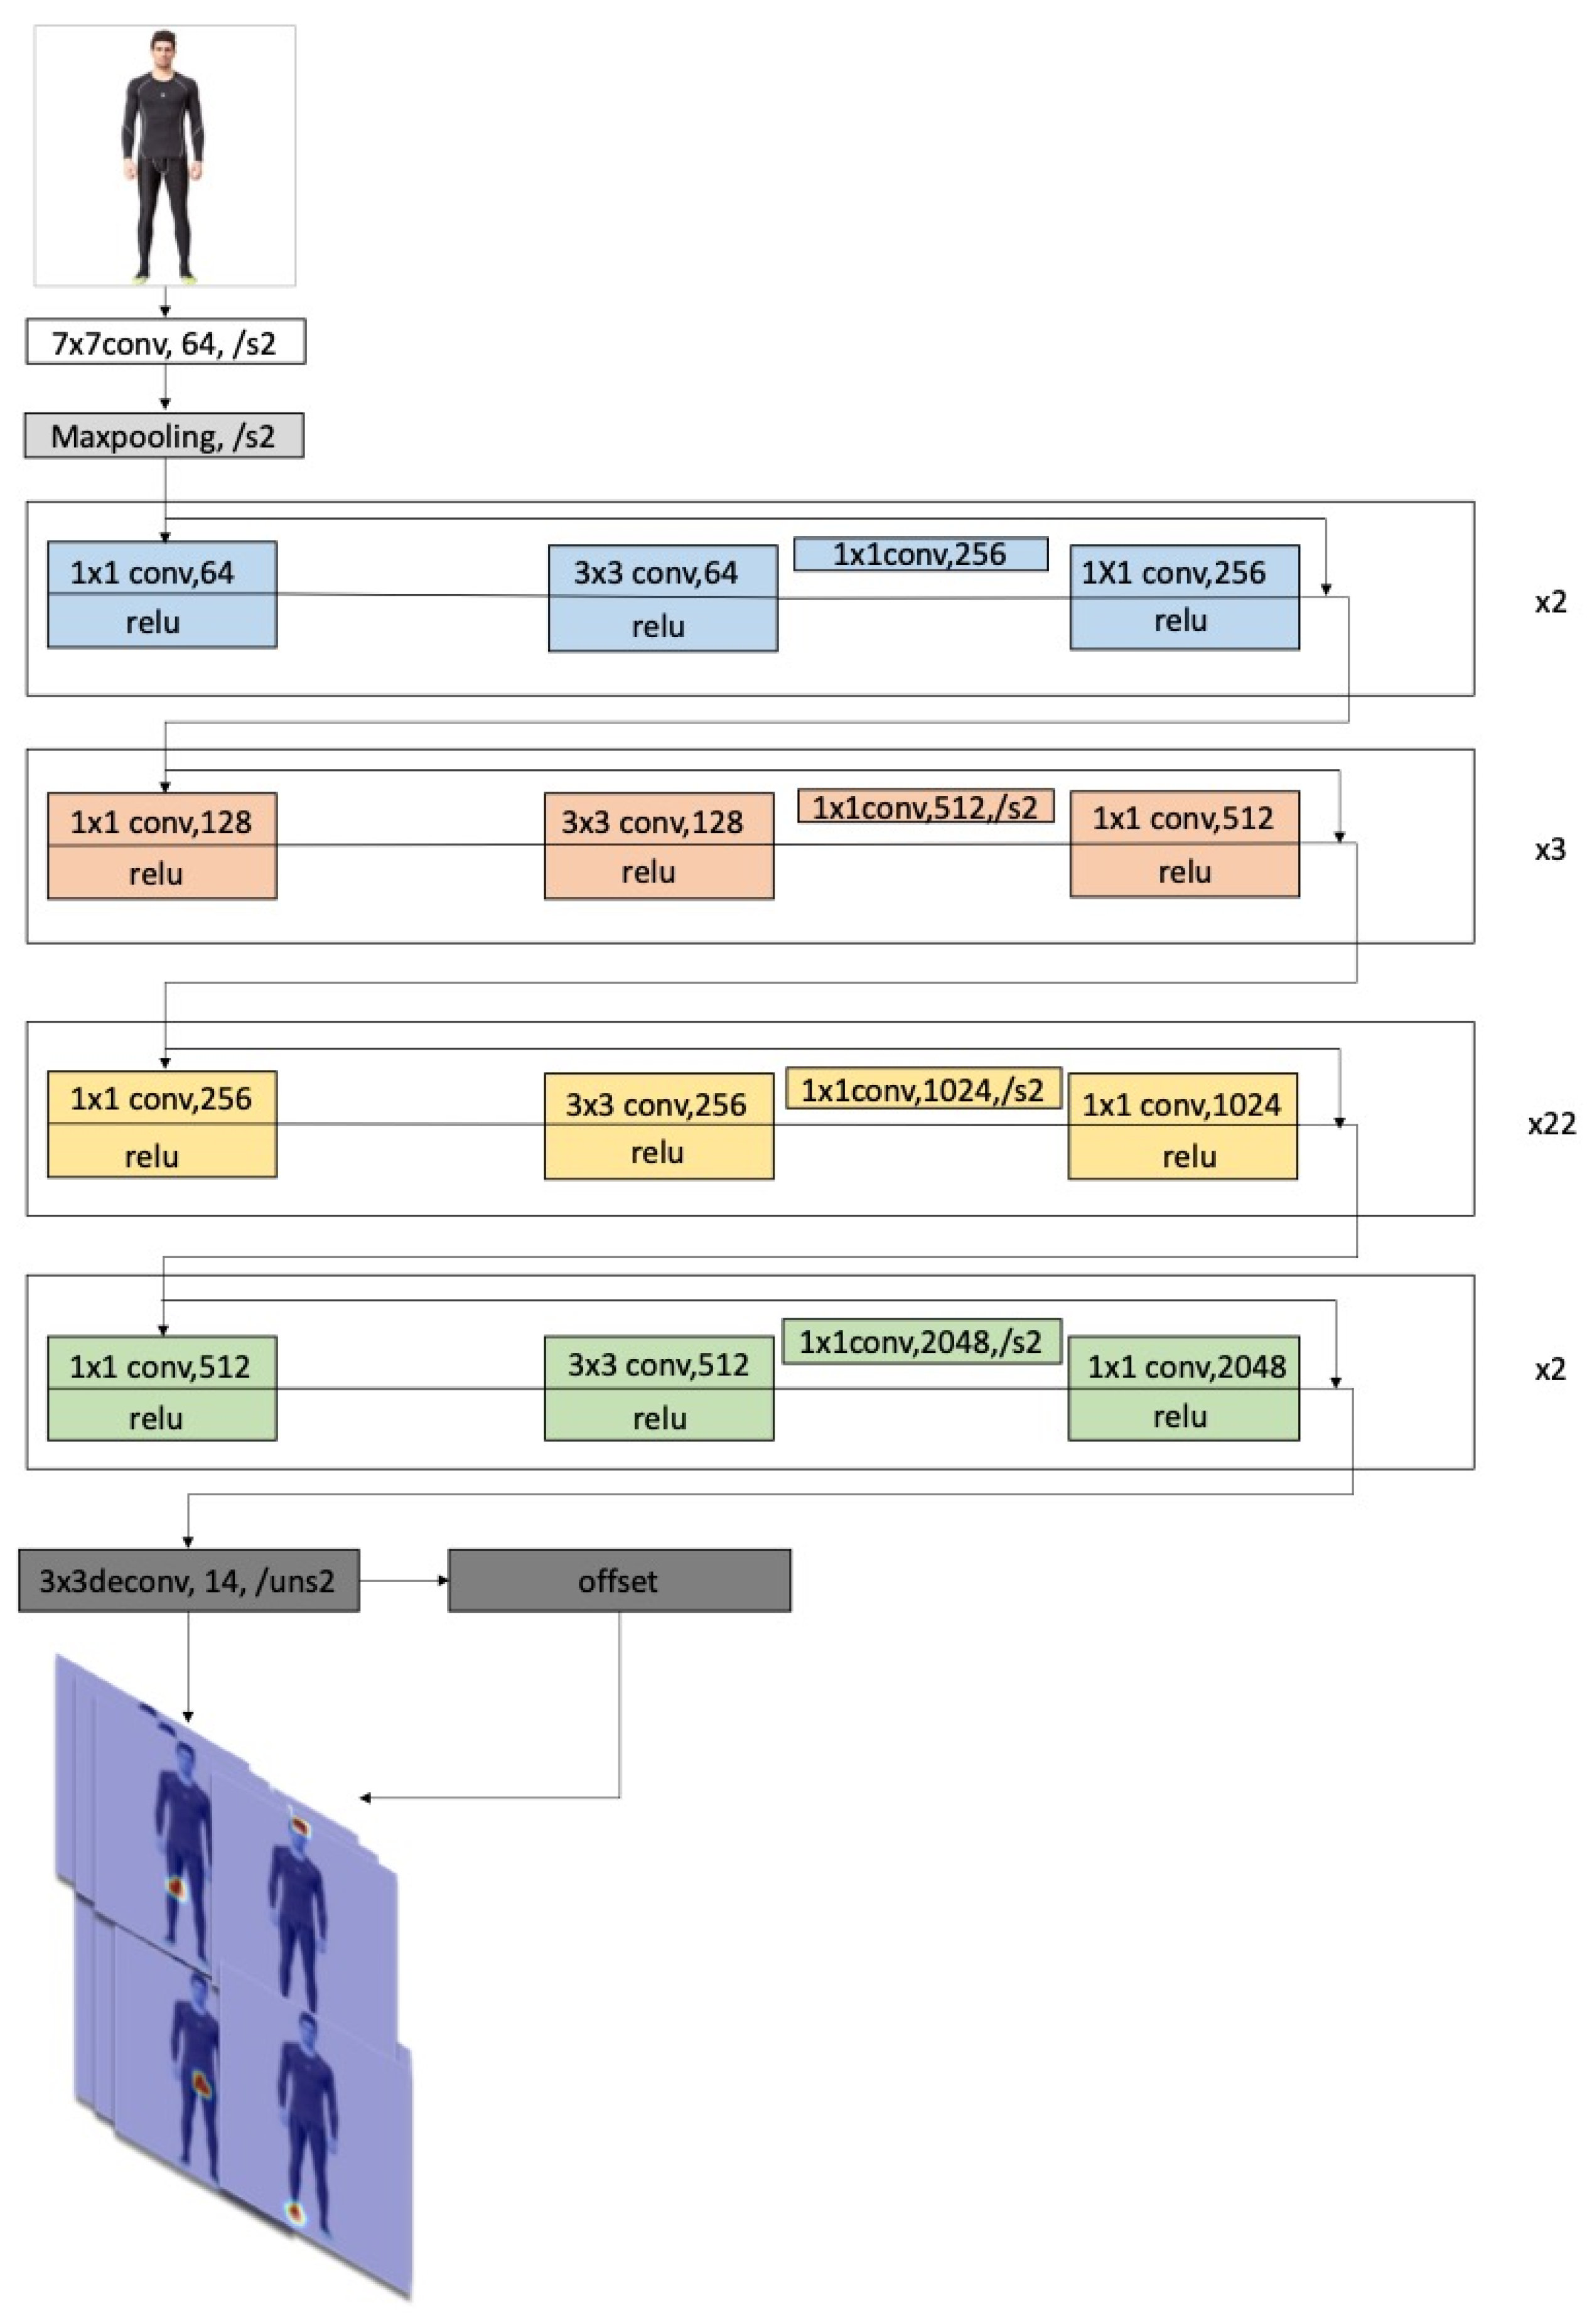
Predicting the position of landmarks from 2D images is a very complex problem because there is a large deformed range of human posture and body shape. In order to make the network learn useful information better, we consider decoupling posture information from body shape information and requiring people to stand with a fixed posture. The network does not need to learn posture information but only information on body shape. The network structure is shown in Figure 3. The deep network is prone to degradation, which will affect the learning effect. However, this problem can be solved by the skip connection between different layers. More importantly, many image features will lose in the convolution process, and a positive learning effect cannot be obtained only through features transferred between continuous layers. While features transferred between discontinuous layers can be achieved after introducing residuals into the network, and important features extracted from lower layers will not be lost in the process of convolution.
Figure 3. The landmarks extraction framework.
A deconvolution module is added after the feature-extracted module to restore images to a higher resolution level and to predict multichannel features, and the number of channels of the final output is the same as the number of landmarks. A location refinement module is also added to learn offset Lr of predicted location of feature maps, with an output dimension twice the number of landmarks because it contains offsets in the x and y directions.
The prediction process of CNN as f extracts features from input images and predicts confidence (the probability of x = z) that each pixel point z Z is the landmarks x. The process can be expressed as follows:
f ( i ) { p x ( x = z ) } x { 1 n }
where i represents input images, p is the score of prediction confidence, n is the number of landmarks, and cross-entropy is the loss function as follows:
l o s s = x = 1 x + 1 z Z L ( p x *   , p x   ) + L r ( p x *   , p x )
where p x * represents real confidence score, p x is the predicted confidence score, L is the cross-entropy loss function, and Lr is the Huber loss function.

3.2. Anthropometric Dimension Calculation Based on Multi-Ellipse Model

There are two human images used for dimension calculation and 14 landmarks labeled in the front and side images respectively. Assuming that the height of testers is known, the pixel-level height of testers is calculated from the landmark of the head and the foot, and the ratio of true height to pixel-level height is used as the scale of distance conversion.
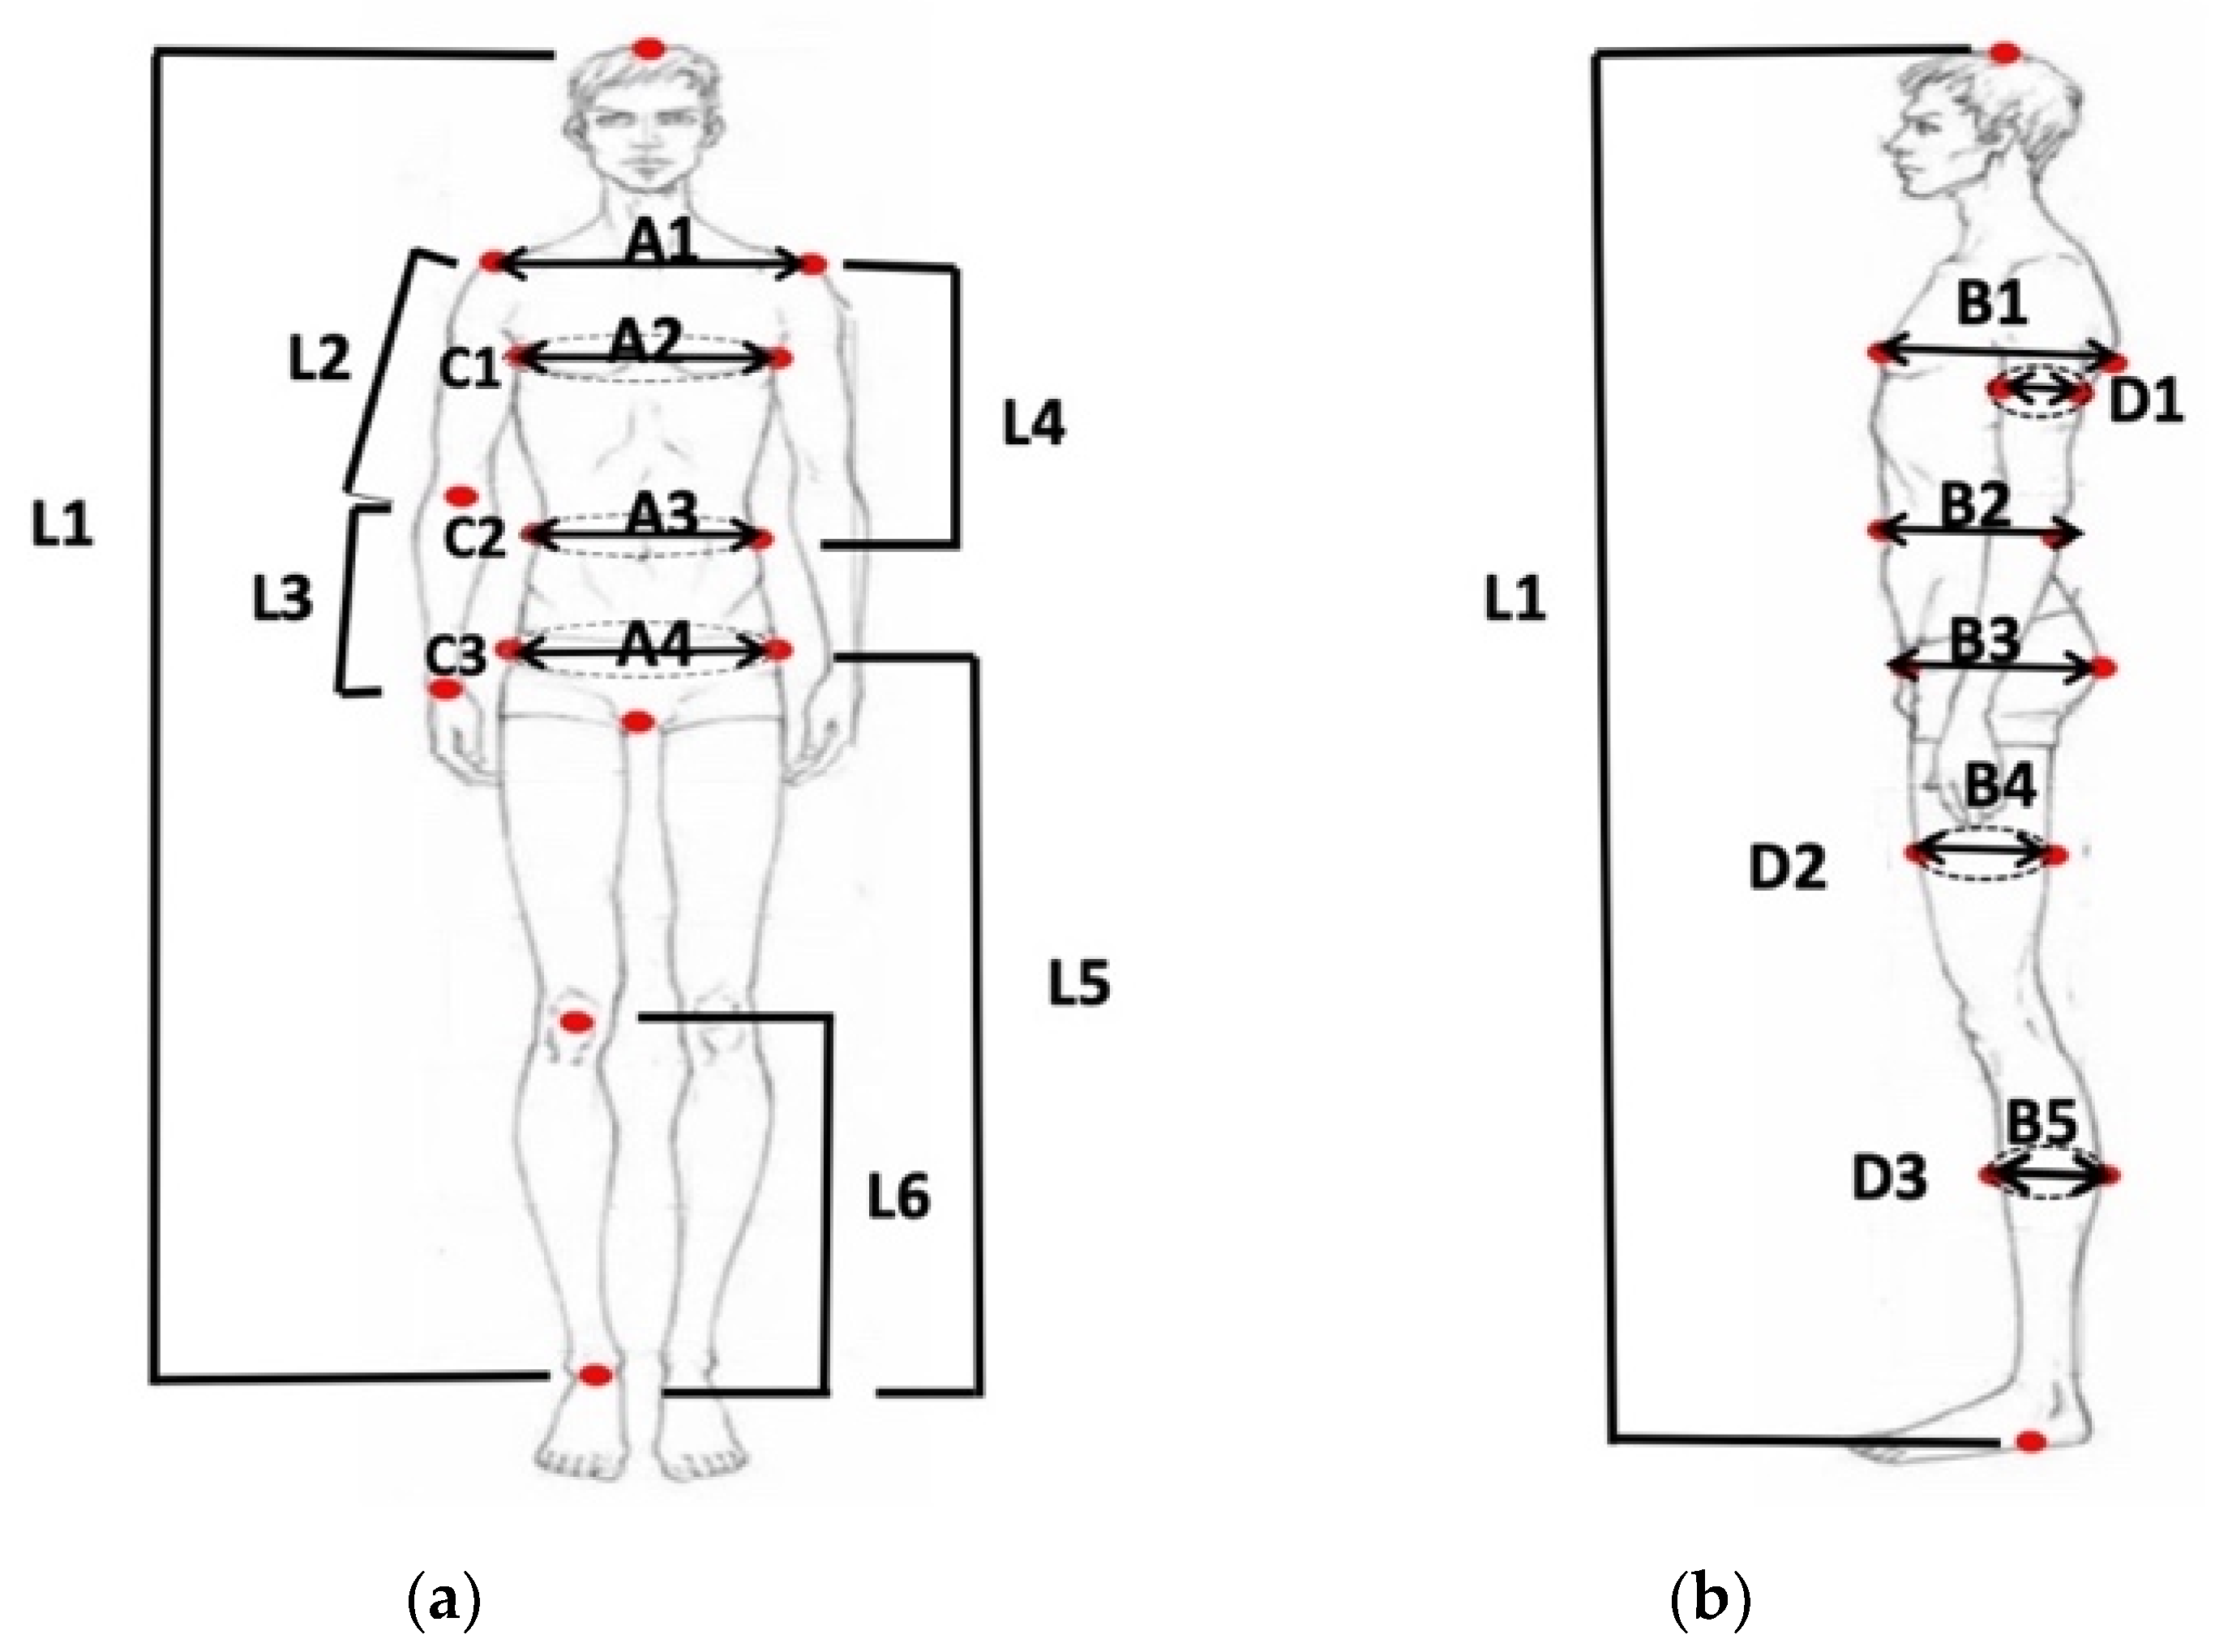
The anthropometric dimensions are obtained from landmarks extracted in the front and side images. As shown in Figure 4, the dimensions obtained include six lengths (L1–L6), nine widths (A1–A4, B1–B5), six girth (D1–D3, C1–C3). Table 2 shows the definition of dimensions according to the method specified by GB/T 16160-2017 [22].
Figure 4. The anthropometric dimensions. (a) Front image; (b) Side image.
Table 2. The definition of dimensions.
There are two types of dimensions that can be calculated, one type includes shoulder width, arm length, thigh circumference, etc. The other type includes chest, waist, hip circumference, etc., which is similar to ellipses and can be viewed as an ellipse with different curvatures.
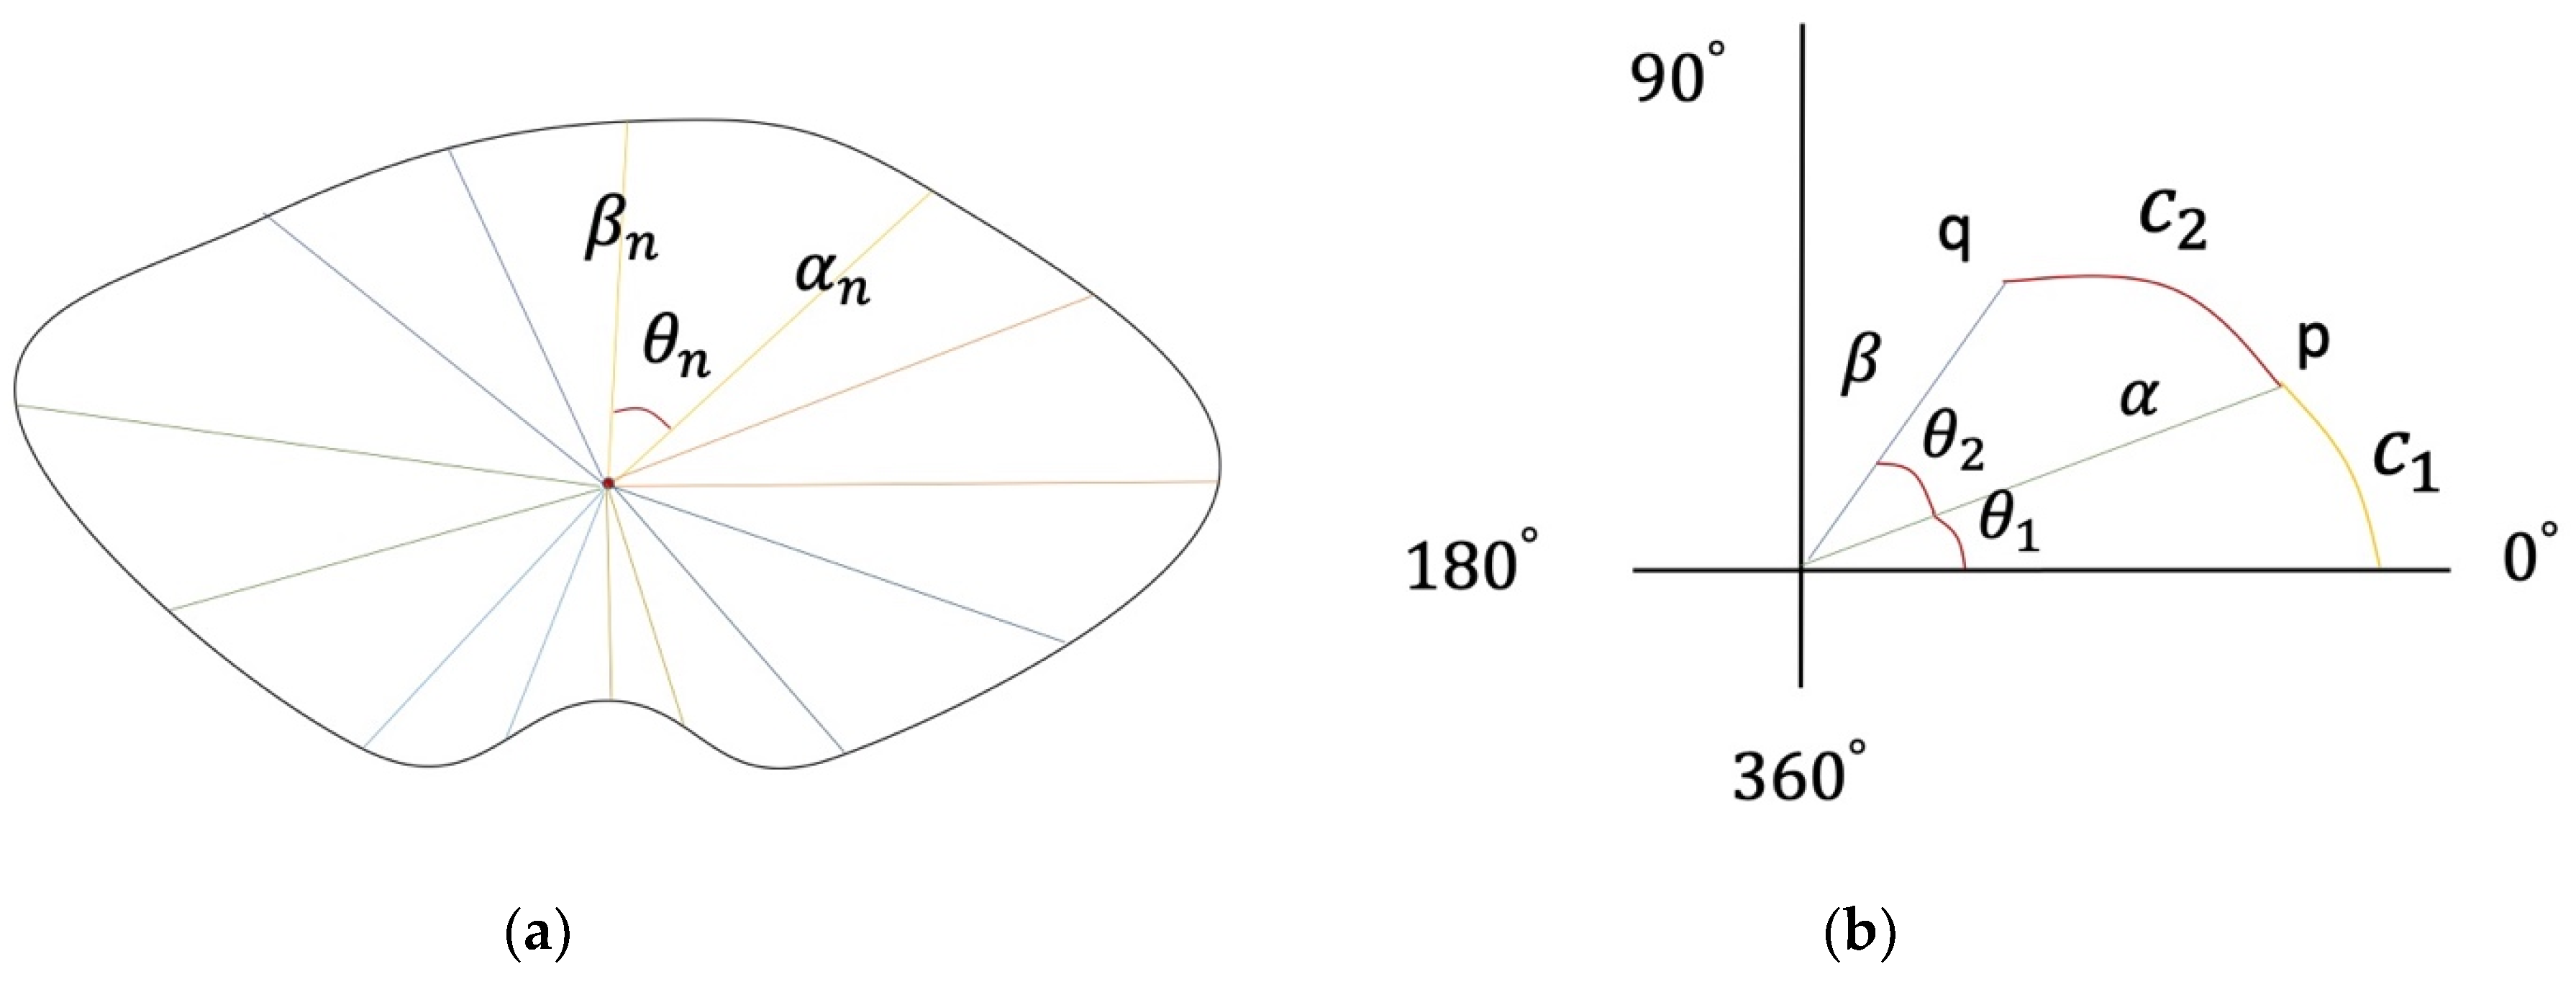
Based on human images from different angles, a multi-ellipse model in a polar coordinate system is built, which is a general model for calculating ellipse dimensions. Due to the special structure of the human body, the curvature of different segments of the same part is different. The dimensions calculated are the cumulative sum of elliptical segments with different curvature, as shown in Figure 5a.
Figure 5. The multi-ellipse model. (a) Multi-ellipse model of waist; (b) Ellipse segment in polar coordinate system.
The key factors to build a multi-ellipse model are the rotation angle θn(0 < θ < 2π) of human body images and two sides of ellipse αn, βn. Assuming that the human body image has n angles, the elliptical segment at one of the angles is shown in Figure 5b.
Where θ1, θ2 is the rotation angle of human body image, C1, C2 is the length of elliptical segment, p, q is the boundary points of elliptical segment C2, and α, β is the length of edge. A polar coordinate system ellipse equation with the center of ellipse as the origin is established, and the length of elliptical segment is calculated by the integral method as follows:
ρ ( θ ) = l s s 2 sin θ + l 2 cos θ
C 2 = θ 1 θ 2 ρ 2 ( θ ) + ρ 2 ( θ )
The standard elliptic equation with a focus on the coordinate axis is built by p(αcosθ1, αsinθ2), q(βcosθ1, βsinθ2). Due to the symmetry of the human body structure, only the length of curve segment in (0, π) is needed to be calculated.
C a l l = 2 i = 1 n θ 1 i θ 2 i ρ 2 ( θ ) + ρ 2 ( θ )
where Call represents dimension measurement and N represents rotation angle, which is the number of images.
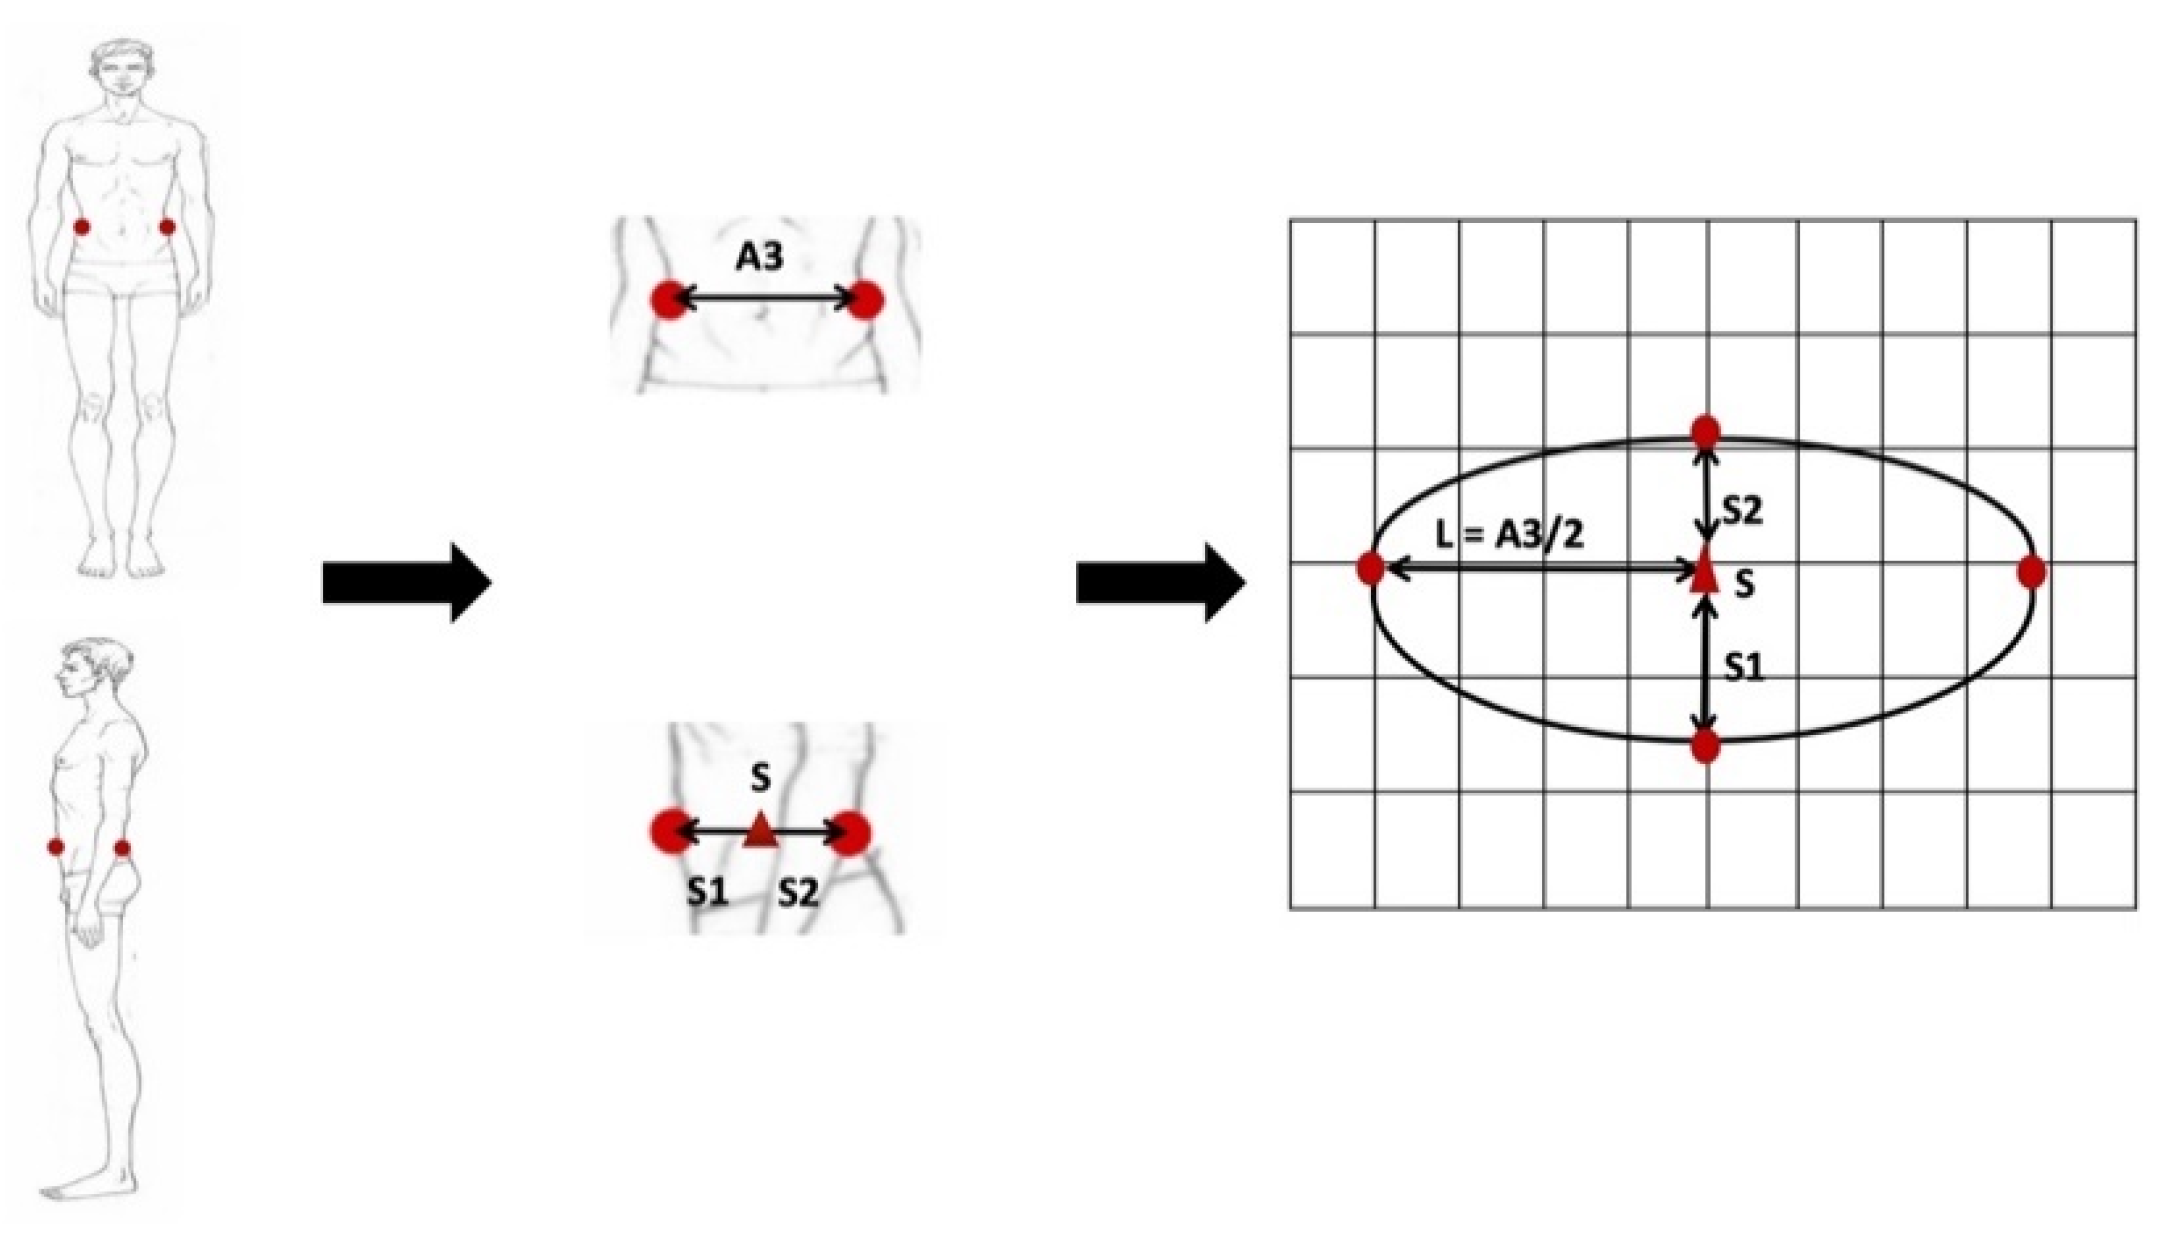
We get landmarks from the orthogonal image of the human body and build a multi-ellipse model with n = 2, as shown in Figure 6. In this case, θ1 = θ2 = π/2, the key to this model lies in how to determine the position of the division point S. The traditional ellipse model uses a fixed division point and has a large error when facing people of different body shape. In this paper, the location of the division point is determined by thickness–width ratio of human body parts.
Figure 6. The multi-ellipse model with n = 2.
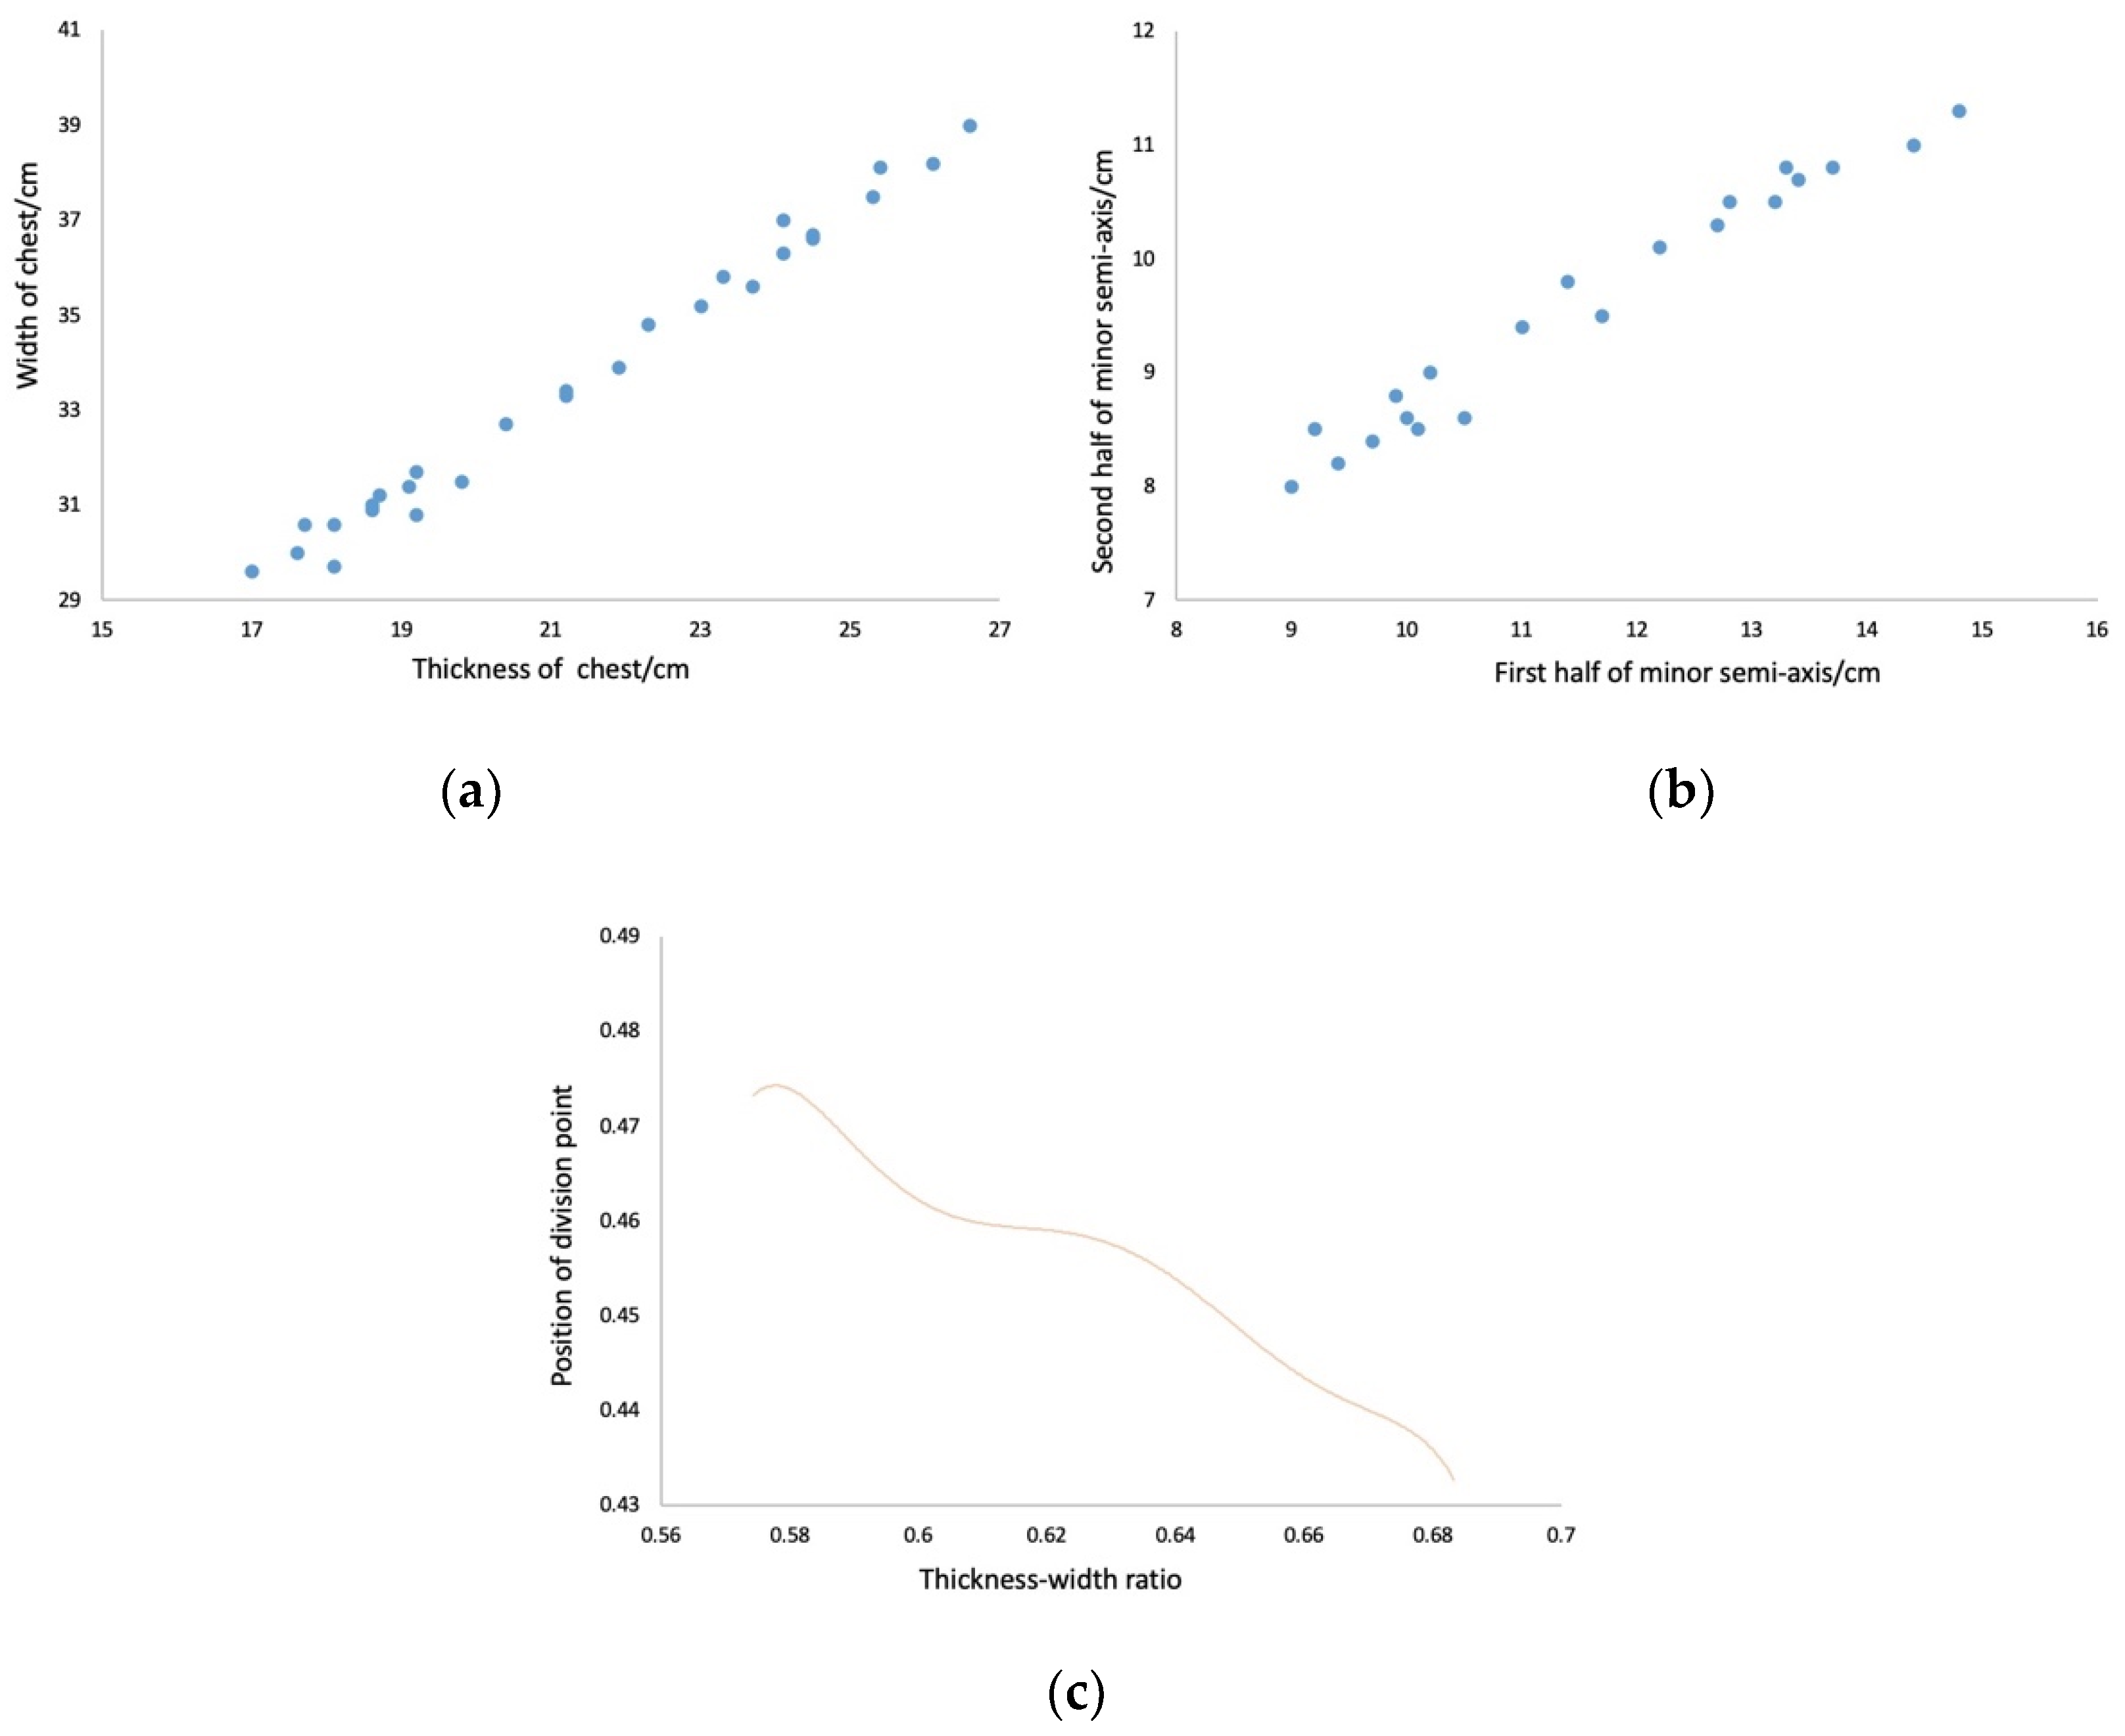
Taking the chest as an example, first the deformation range of thickness–width ratio is calculated by real data. As shown in Figure 7a, chest width is assumed as A3 and half of chest width as L, that is, the length of ellipse major semi-axis alpha, the division point of chest thickness as S, the first half of minor semi-axis as S1, and the second half as S2, that is, the ellipse minor semi-axis beta. By known chest data, the second half of the minor semi-axis is represented as X and the first half as B1-x. As shown in Figure 7b, the deformation range of minor semi-axis X is calculated when chest thickness is B1 according to the above formulas. As shown in Figure 7c, by calculating the correlation between thickness–width ratio and the position of division point, it is found that the thickness–width ratio is inversely proportional to the position of division points.
Figure 7. The data of chest. (a) deformation range of thickness–width ratio; (b) deformation range of the division point. (c) function of bust.
A mapping relationship F is established between the thickness–width ratio and the position of division points. When the deformation range of thickness–width ratio is [a1, b1] and the deformation range of the division point is [a2, b2], then at the thickness–width ratio c, the location of division point D should be:
d = F ( c ) ,   c [ a 1 , b 1 ] ,   d   [ a 2 ,   b 2 ]
where F represents the functional relationship between thickness–width ratio and the position of the division point.

4. Experiment and Result

This section describes the datasets and shows the accuracy of landmarks extraction. The algorithm is evaluated based on real samples and compared with previous methods.

4.1. Datasets

The datasets are divided into two parts: network training and size calculation. The first part is the front and side images of humans for network training. These images include different people, each with 3500 images, in which 3000 are used as the training set and 500 are used as the test set. The reason why we can get a good training effect on the small sample data set is that all people in the images stand with a fixed posture, so it is no need for the network to learn the deformation range of human posture but the deformation range of body shape. As is shown in Table 3, the second part is 87 groups of front and side images for the testing algorithm. The data are all from the laboratory staff whose ages are between 20 and 50 years old with a BMI between 17 and 28, so that enough body shape has been included. All subjects are required to wear tight clothes, which can facilitate learning body shape information from the images.
Table 3. The data parameters of subjects.

4.2. Training Details

The network is trained by front and side images marked with 14 landmarks, and the heatmap is generated by a Gaussian template. The network of front images is introduced as an example, because the structure and parameters of the two networks are most the same. The network is based on 101-layer ResNet, which using the weights trained by resnet-v101 on ImageNet as the initial weight, through which the image is sampled to 1/16 of the original image and deconvolute to 1/8 of the original image after that, then the position of landmarks is predicted. The images of any resolution can input onto the network because the batch of input images is 1, and the SGD optimizer [23] is used to iterate 103w times on GTX2080, the learning rate is shown in Table 4. The side images are mirrored, and all images are expanded in the form of an image pyramid to enhance the robustness of the network.
Table 4. The learning rate.

4.3. Result

As shown in Figure 2, the landmarks are classified based on body parts, and PCK, that is the proportion of correctly predicted key points, is evaluated on the sample of 500 images. The PCK [24] with landmark j is defined as follows:
p c k σ j = 1 n n = 1 n P ( | | x p r e j x t r u t h j | | 2 < σ )
where J represents the type of landmarks, σ is the detection threshold value, between 0.1 and 0.5 of head pixel value, n is the number of samples, x p r e j represents the predicted coordinates of j-th landmarks, and x t r u t h j is the true coordinates of the j-th landmarks. Because enough human body images are collected, the number of landmarks extracted remains steady, that is, the robustness of this method is better than other methods and has a high correlation with body parts. As shown in Table 5, the average accuracy of landmarks extraction is 96.6% because of the invariability of the data, that is, the posture of the human body is relatively fixed.
Table 5. The accuracy of landmarks extraction (* is the average of two landmarks).
The average dimensions, which served as the true value (T), are calculated after the process that 87 subjects of anthropometric dimensions are measured by three professional researchers on two successive days. In the process of manual measurements, there are two kinds of errors in general. The first kind occurs in the measurements of the same dimension by different researchers, which is also called inter-observer error, while the other kind of error occurs in multiple measurements of the same dimension by the same researchers, which is also called intra-observer error [13]. In order to evaluate different kinds of errors, the technical error of measurement (TEM) and reliability coefficient (R) [25] of 87 subjects of dimensions are calculated as follows:
T = 1 p ( i = 1 p ( 1 e j = 1 e m p e ) )
T E M = 1 n [ ( 1 q m q 2 ) ( ( 1 q m q 2 ) / q ) ] n ( q 1 )
R = 1 ( T E M 2 S 2 )
where p represents the number of researchers, e represents the number of measurements and n represents the number of subjects. Given this, q represents the number of researchers in the first type of error while for the second kind of error, q is two times the number of researchers, mq represents the qth measurement, S2 represents the sample variance. In this experiment, all researchers are required to make measurements twice.
As is shown in Table 6, the mean values for intra-observers reliability of the three trainers are 0.899 (range: 0.82–0.97), 0.914 (range: 0.84–0.98), 0.904 (range: 0.81–0.98). For all trainers, the intra-observer reliability coefficient has shown good to high reliability. Similarly, the mean values for inter-observers reliability are 0.857 (range: 0.78–0.95). These results illustrate that the manually measured anthropometric dimensions are reliable.
Table 6. The reliability of measured dimensions.
The measurement obtained by our method is affected by two factors: (i) the distance between camera and subject. (ii) the degree of looseness of the subject’s clothes. These factors should be adjusted for the most favorable measurements. According to the experiments, it is proved that the most favorable distance between subject and camera is 1 m and the subject had better wear tighter clothing. Under these conditions, the mean absolute difference (MAD) of dimensions are calculated, which is defined as:
M A D i = 1 n j = 1 n | P j T j |
where i represents the i-th anthropometric dimension, P j represents the measurements of the proposed method, and J represents the manual measurement. As shown in Table 7, MAD of all dimensions are calculated, the result shows all dimension errors measured are within the margin of error, Maximum Permissible Error (MAE) for garment measuring proposed in reference [26].
Table 7. The anthropometric dimensions and error.
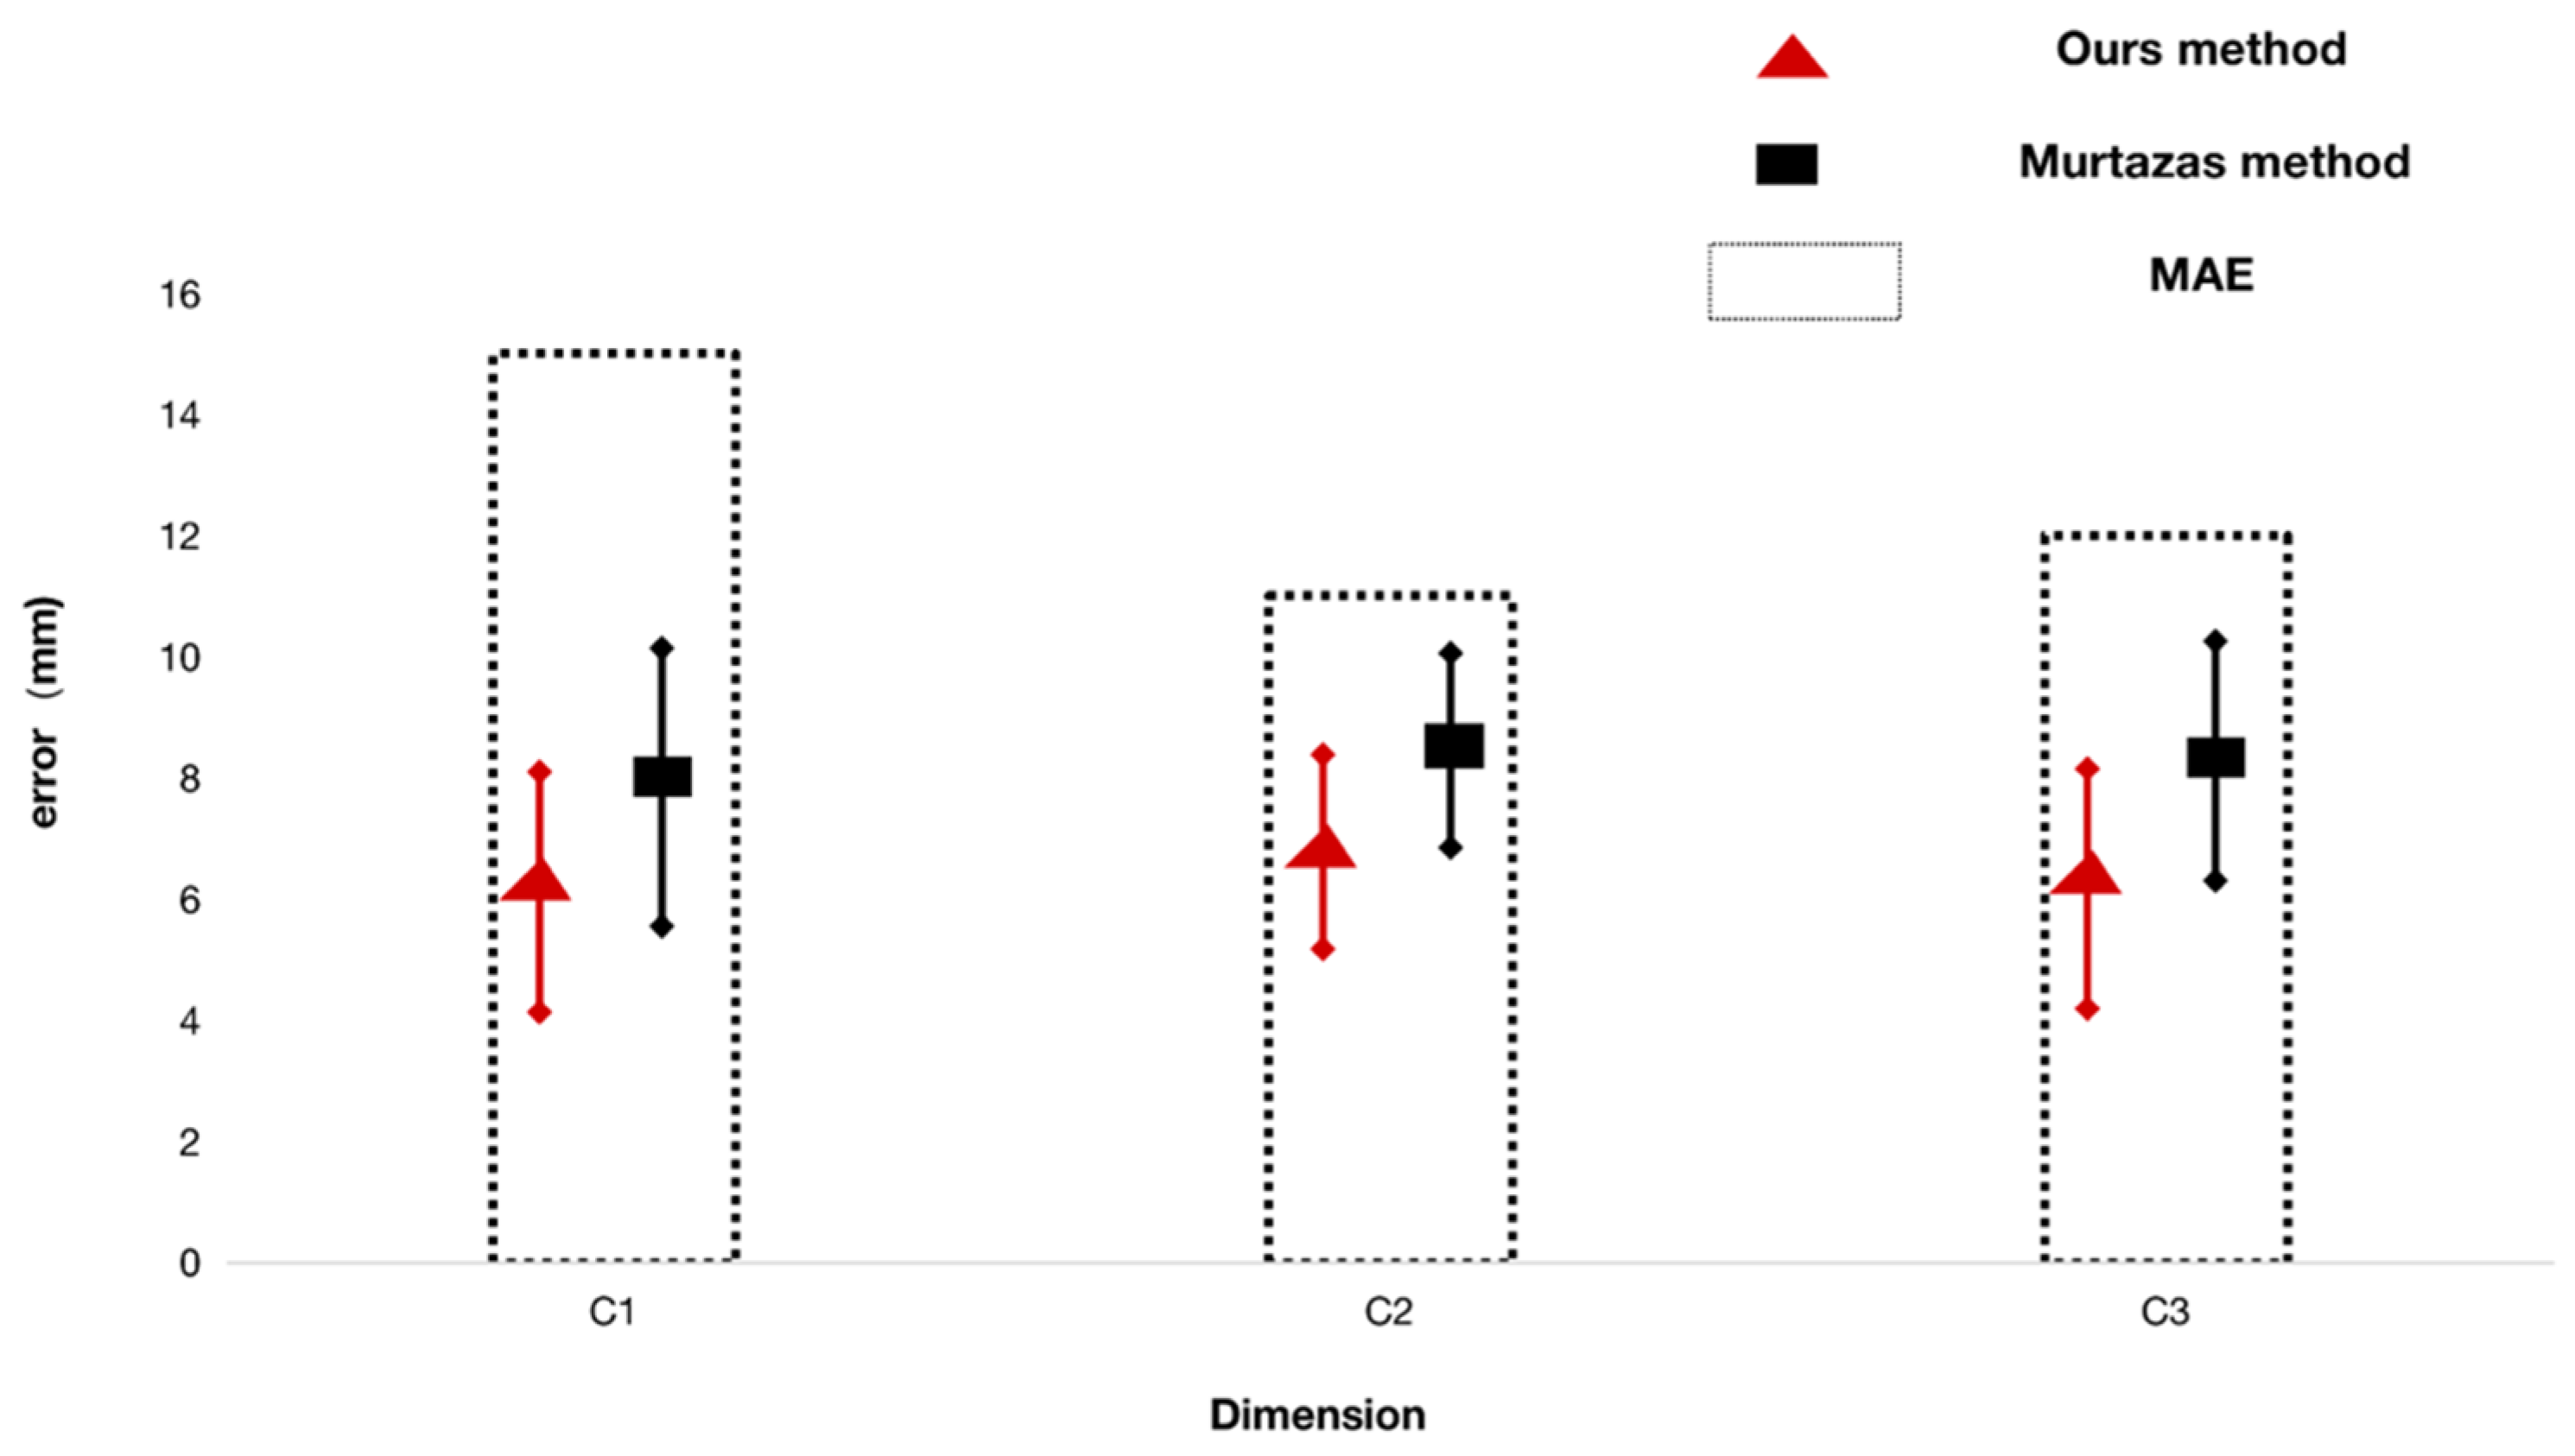
As shown in Figure 8, the errors of three dimensions of chest, waist and hip are compared with errors calculated by Murtaza et al. [13], and Maximum Permissible Error (MAE), which proves that the error of our method is smaller than that of other methods. The square or diamond symbol on the error bar represent MAD and the dotted bar represents MAE. The upper and lower limits of error bars represent the standard deviation (SD) of absolute difference.
Figure 8. Comparison of bust, waist and hip circumference.
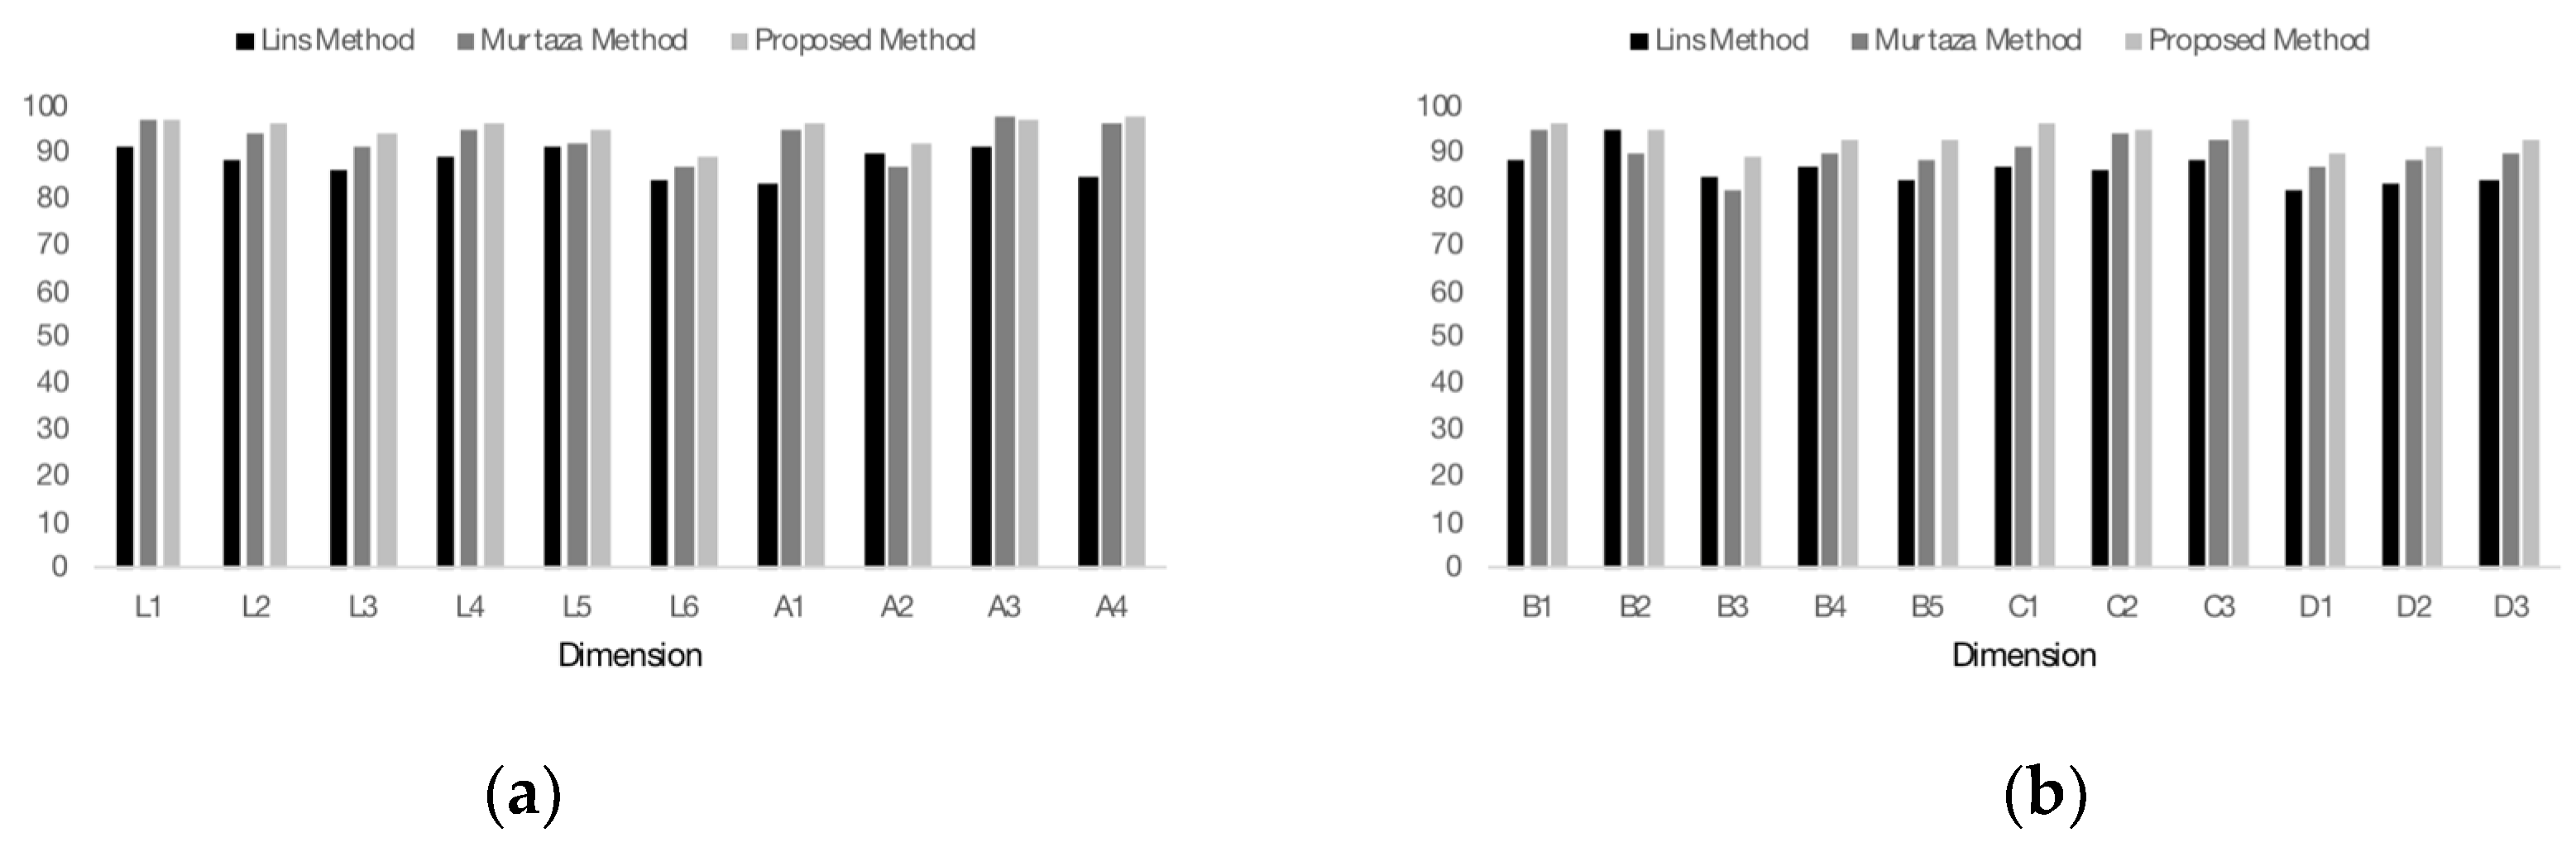
The absolute difference of a dimension greater than MAE is considered as an outlier. The PA of dimensions obtained by Lin [26] and Murtaza [13] is compared with proposed method based on the number of outliers. The PA of jth dimension (PAi) is evaluated as:
P A i = ( m n 100 )
where i represents the anthropometric dimension, m represents the number of outliners, and n represents the number of subjects.
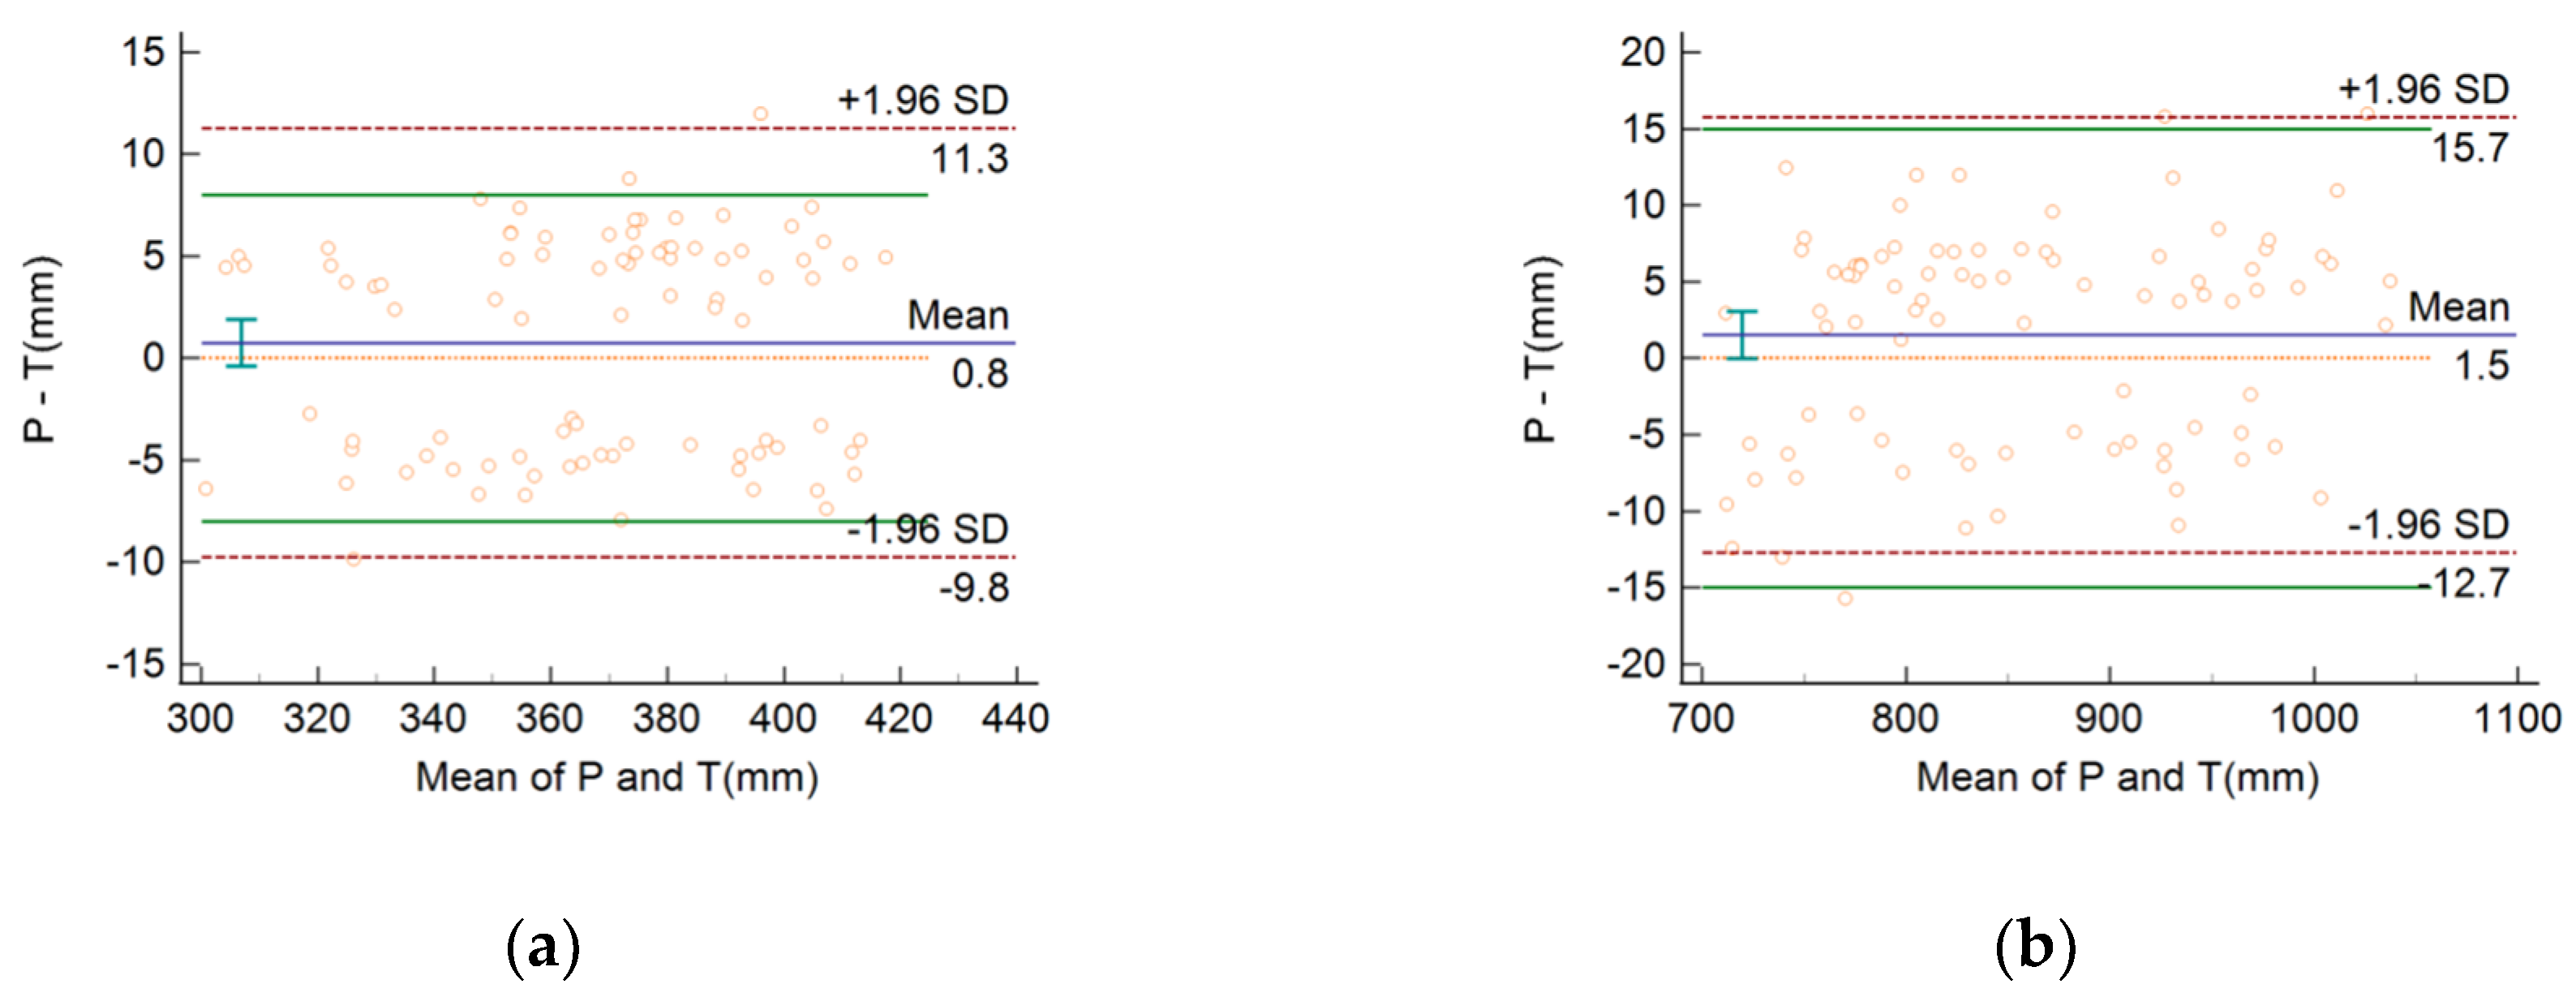
The agreement of methods on two important dimensions (A1, C1) in garment customization is evaluated. As shown in Figure 9, where T represents the result obtained by manual measurements and P represents the result calculated by our method. Among 87 subjects, the shoulder widths of 84 subjects are within the maximum error of clothing customization (8 mm), the PA is 96%, and the bust girths of 83 subjects are within the maximum error of clothing customization (15 mm), the PA is 95%. As shown in Figure 10, what is more important is that the proposed algorithm performed better for 20 out of 21 dimensions, and the average PA of all dimensions is 94.2% for the proposed method and 88% for [26] and 93% for [13]. Therefore, the results of statistical analysis illustrate that our method is more accurate and consistent after comparing with [26] and [13] in the automatic measurement of body dimensions.
Figure 9. The agreement study of methods. (a) study of A1 (Shoulder Breadth); (b) study of C1 (Chest Girth).
Figure 10. The PA comparison of dimensions obtained by proposed method with other methods. (a) comparison of dimensions (L1–A4); (b) comparison of dimensions (B1–D3).

5. Discussion and Conclusions

In this paper, a new method of anthropometric dimensions measurement based on 2D images is proposed for solving the problems of low extraction rate of landmarks, inaccurate division point of minor semi-axis of double ellipse model and big measurement error. The convolution neural network introduced to extract landmarks has higher robustness, that is, the number of landmarks is more stable and the correlation with body parts is higher. Then, a multi-ellipse model is proposed, in which the shape information (thickness–width ratio) is integrated into the multi-ellipse model with two images to correct the position of axis division point, so as to avoid the error of contour extraction and gradient calculation. The errors of 21 main dimensions measured are all within the margin of error for garment measuring. The errors of chest, waist and hip based on the multi-ellipse model are smaller than the existing methods.
In future work, more images with more postures can be added to the training set to improve the stability and accuracy of landmarks extraction. By expanding the number of test images, that is, using more human images with different rotation angles, the errors of the multi-ellipse model can be reduced. In addition, the data of dimensions measured in our experiment can also be used in garment customization, 3D human modeling, virtual fitting and other fields.

Author Contributions

Conceptualization, X.W. and B.L.; methodology, B.L. and S.P.; software, X.W. and B.L.; validation, X.W., B.L. and X.T.; writing—original draft preparation, B.L. and Y.D.; writing—review and editing, S.P. and Y.D.; supervision, X.W.; project administration, B.L. and X.T.; funding acquisition, X.W. and S.P. All authors have read and agreed to the published version of the manuscript.

Funding

This research was funded by National Natural Science Foundation of China, grant number 61972416, the Foundamental Research Funds for the Central University of China, grant number 19CX02028A.

Conflicts of Interest

The authors declare no conflict of interest.

References

  1. Gültepe, U.; Güdükbay, U. Real-time virtual fitting with body measurement and motion smoothing. Comput. Graph. 2014, 43, 31–43. [Google Scholar] [CrossRef] [Scilit]
  2. Mahnic, M.; Mahnica, M.; Petraka, S. Investigation of the Fit of Computer-based Parametric Garment Prototypes. J. Fiber Bioeng. Inform. 2013, 6, 51–61. [Google Scholar] [CrossRef] [Scilit]
  3. Apeagyei, P.R.; Tyler, D. Ethical practice and methodological considerations in researching body cathexis for fashion products. J. Fash. Mark. Manag. Int. J. 2007, 11, 332–348. [Google Scholar] [CrossRef] [Scilit]
  4. Heath, B.H.; Carter, J.E.L. A modified somatotype method. Am. J. Phys. Anthr. 1967, 27, 57–74. [Google Scholar] [CrossRef] [Scilit] [PubMed]
  5. Ahn, S.H.; Park, J.; Nam, Y.-J.; Yun, M.H. 1C1-2 Analysis and Usability Testing of the 3D Scanning Method for Anthropometric Measurement of the Elderly. Jpn. J. Ergon. 2015, 51, S394–S397. [Google Scholar] [CrossRef] [Scilit]
  6. Singh, A.K. The importance of anthropometric measurement error. Open Access Libr. J. 2014, 1, 1–9. [Google Scholar] [CrossRef]
  7. Jain, S.; Rustagi, A.; Saurav, S.; Saini, R.; Singh, S. Three-dimensional CNN-inspired deep learning architecture for Yoga pose recognition in the real-world environment. Neural Comput. Appl. 2020, 1–15. [Google Scholar] [CrossRef] [Scilit]
  8. Luvizon, D.C.; Picard, D.; Tabia, H. 2D/3D Pose Estimation and Action Recognition Using Multitask Deep Learning. In Proceedings of the 2018 IEEE/CVF Conference on Computer Vision and Pattern Recognition, Salt Lake City, UT, USA, 18–23 June 2018; pp. 5137–5146. [Google Scholar]
  9. Toshev, A.; Szegedy, C. DeepPose: Human Pose Estimation via Deep Neural Networks. In Proceedings of the 2014 IEEE Conference on Computer Vision and Pattern Recognition, Columbus, OH, USA, 23–28 June 2014; pp. 1653–1660. [Google Scholar]
  10. Arbelaez, P.; Maire, M.; Fowlkes, C.; Malik, J. Contour Detection and Hierarchical Image Segmentation. IEEE Trans. Pattern Anal. Mach. Intell. 2011, 33, 898–916. [Google Scholar] [CrossRef] [Scilit]
  11. Chen, L.-C.; Papandreou, G.; Kokkinos, I.; Murphy, K.; Yuille, A.L. DeepLab: Semantic Image Segmentation with Deep Convolutional Nets, Atrous Convolution, and Fully Connected CRFs. IEEE Trans. Pattern Anal. Mach. Intell. 2017, 40, 834–848. [Google Scholar] [CrossRef] [Scilit] [PubMed]
  12. Dai, J.; He, K.; Sun, J. Instance-Aware Semantic Segmentation via Multi-task Network Cascades. In Proceedings of the 2016 IEEE Conference on Computer Vision and Pattern Recognition (CVPR), Las Vegas, NV, USA, 27–30 June 2016; pp. 3150–3158. [Google Scholar]
  13. Aslam, M.; Rajbdad, F.; Khattak, S.; Azmat, S. Automatic measurement of anthropometric dimensions using frontal and lateral silhouettes. IET Comput. Vis. 2017, 11, 434–447. [Google Scholar] [CrossRef] [Scilit]
  14. He, K.; Zhang, X.; Ren, S.; Sun, J. Deep Residual Learning for Image Recognition. In Proceedings of the 2016 IEEE Conference on Computer Vision and Pattern Recognition (CVPR), Las Vegas, NV, USA, 27–30 June 2016. [Google Scholar]
  15. Cruz-Mota, J.; Bogdanova, I.; Paquier, B.; Bierlaire, M.; Thiran, J. Scale Invariant Feature Transform on the Sphere: Theory and Applications. Int. J. Comput. Vis. 2012, 98, 217–241. [Google Scholar] [CrossRef] [Scilit]
  16. Bay, H.; Tuytelaars, T.; Van Gool, L. SURF: Speeded Up Robust Features. Comput. Vis. Image Underst. 2008, 110, 404–417. [Google Scholar] [CrossRef] [Scilit]
  17. Loper, M.; Mahmood, N.; Romero, J.; Pons-Moll, G.; Black, M.J. SMPL: A Skinned Multi-Person Linear Model. ACM Trans. Graph. (TOG) 2015, 34, 1–16. [Google Scholar] [CrossRef] [Scilit]
  18. Tompson, J.J.; Jain, A.; Lecun, Y.; Bregler, C. Joint Training of a Convolutional Network and a Graphical Model for Human Pose Estimation. arXiv 2014, arXiv:1406.2984. [Google Scholar]
  19. Wei, S.-E.; Ramakrishna, V.; Kanade, T.; Sheikh, Y. Convolutional Pose Machines. In Proceedings of the 2016 IEEE Conference on Computer Vision and Pattern Recognition (CVPR), Las Vegas, NV, USA, 27–30 June 2016; pp. 4724–4732. [Google Scholar]
  20. Nie, X.; Feng, J.; Zuo, Y.; Yan, S. Human Pose Estimation with Parsing Induced Learner. In Proceedings of the 2018 IEEE/CVF Conference on Computer Vision and Pattern Recognition, Salt Lake City, UT, USA, 18–23 June 2018; pp. 2100–2108. [Google Scholar]
  21. GB/T 38131-2019. Acquisition Method of Datum Points for Clothing Anthropometry; Standards Press of China: Beijing, China, 2019. [Google Scholar]
  22. GB/T 16160-2017. Anthropometric Definitions and Methods for Garment; Standards Press of China: Beijing, China, 2017. [Google Scholar]
  23. Konečný, J.; Richtárik, P. Semi-Stochastic Gradient Descent Methods. Front. Appl. Math. Stat. 2017, 3, 9. [Google Scholar] [CrossRef] [Scilit]
  24. Pishchulin, L.; Insafutdinov, E.; Tang, S.; Andres, B.; Andriluka, M.; Gehler, P.; Schiele, B. DeepCut: Joint Subset Partition and Labeling for Multi Person Pose Estimation. In Proceedings of the 2016 IEEE Conference on Computer Vision and Pattern Recognition (CVPR), Las Vegas, NV, USA, 27–30 June 2016; pp. 4929–4937. [Google Scholar]
  25. Lohman, T.G.; Roche, A.F.; Martorell, R. Anthropometric Standardization Reference Manual; Human Kinetics Books: Champaign, IL, USA, 1988. [Google Scholar]
  26. Lin, Y.-L.; Wang, M.-J.J. Constructing 3D human model from front and side images. Expert Syst. Appl. 2012, 39, 5012–5018. [Google Scholar] [CrossRef] [Scilit]
Publisher’s Note: MDPI stays neutral with regard to jurisdictional claims in published maps and institutional affiliations.

Article Metrics

Citations

Article Access Statistics

Multiple requests from the same IP address are counted as one view.