Article

Suitability Study of Structure-from-Motion for the Digitisation of Architectural (Heritage) Spaces to Apply Divergent Photograph Collection

by
Juan Moyano
1,*,
Juan E. Nieto-Julián
1,
Daniel Antón
1,2,
Elena Cabrera
3,
David Bienvenido-Huertas
1 and
Nazareth Sánchez
1
1
Department of Graphical Expression and Building Engineering, University of Seville, 41012 Seville, Spain
2
The Creative and Virtual Technologies Research Laboratory, School of Architecture, Design and the Built Environment, Nottingham Trent University, 50 Shakespeare Street, Nottingham NG1 4FQ, UK
3
Department of Mechanical Engineering and Industrial Design, University of Cádiz, 11519 Cádiz, Spain
*
Author to whom correspondence should be addressed.
Symmetry 2020, 12(12), 1981; https://doi.org/10.3390/sym12121981
Submission received: 19 October 2020 / Revised: 26 November 2020 / Accepted: 27 November 2020 / Published: 30 November 2020

Abstract

:
The digitisation of architectural heritage has experienced a great development of low-cost and high-definition data capture technologies, thus enabling the accurate and effective modelling of complex heritage assets. Accordingly, research has identified the best methods to survey historic buildings, but the suitability of Structure-from-Motion/Multi-view-Stereo (SfM/MVS) for interior square symmetrical architectural spaces is unexplored. In contrast to the traditional SfM surveying for which the camera surrounds the object, the photograph collection approach is divergent in courtyards. This paper evaluates the accuracy of SfM point clouds against Terrestrial Laser Scanning (TLS) for these large architectural spaces with a symmetrical configuration, with the main courtyard of Casa de Pilatos in Seville, Spain, as a case study. Two different SfM surveys were conducted: (1) Without control points, and (2) referenced using a total station. The first survey yielded unacceptable results: A standard deviation of 0.0576 m was achieved in the northwest sector of the case study, mainly because of the difficulty of aligning the SfM and TLS data due to the way they are produced. This value could be admissible depending on the purpose of the photogrammetric model.

1. Introduction

1.1. General Framework

Both the national and regional public administration make great efforts in the conservation of the historical heritage in order to ensure its social, economic and cultural benefits. International organisations such as the International Council on Monuments and Sites (ICOMOS) or the International Committee of Architectural Photogrammetry (CIPA) were founded with clear objectives of applying different measurement and visualisation technologies to register, document and preserve the cultural heritage. The International Society of Photogrammetry and Remote Sensing (ISPRS) also promotes different data acquisition methods such as Structure-from-Motion (SfM) and Terrestrial Laser Scanning (TLS) or other non-invasive techniques. The analysis of heritage allows the virtual reconstruction of the lost spaces over time, supported by modern surveying technologies to digitally document and preserve the landscape and the historical heritage [1]. The way cultural heritage researchers and archaeologists work and collaborate is changing due to research based on point cloud data acquisition [2]. In this sense, the combination of TLS and SfM constitutes an ideal method to produce high-quality images of this sort of asset [3].
The study of cultural heritage can be carried out at different levels of scales of archaeological research [4]. In the field of architecture, there is special attention to heritage buildings due to the current need to control their unique geometry. The digitisation of architectural heritage has experienced a great development in data capture technologies. HBIM allows digital, three-dimensional integration and qualitative and quantitative information of the objects in the historical buildings [5]. Moreover, HBIM is becoming a reliable tool to produce the traditional drawings, mapped 3D models and, especially, the interoperability with diverse planning, measurement and organisation software. Architectural elements are catalogued and registered in the model, thus highlighting the new historical and cultural knowledge of the building [6]. However, the digitisation of historical buildings and their integration into HBIM require the use of accurate data acquisition techniques [7]. SfM is present in diverse fields of knowledge nowadays.

1.2. Related Work

Some of these data capture technologies are low cost and achieve high definition, which enables researchers to model complex heritage assets accurately and effectively. In this line, numerous studies analyse which are the best methods for the survey of archaeological objects, civil structures and historical buildings. Remondino et al. [8] analysed a set of objects to establish the parameters affecting the SfM. The findings reveal that all software packages achieve similar accuracies when a good set of images is taken. Fassi et al. [9] analysed archaeological remains, a façade of a church and a vault. Their methodology yields accurate results, even for complex objects. Remondino et al. [10] reviewed different algorithms applied to different shapes, and compared dense point cloud data. The accuracy and the study of shapes were studied by Teza et al. [11]. Differences in the range of 10% and 20% were found between TLS and SfM under the condition that the point-of-view positions were optimal. In this way, a great number of published articles focused on small-scale buildings. Koutsoudis et al. [12] analysed a museum artefact: A replica of a Cycladic female figurine. Riveiro et al. [13] used historical masonry bridge arches as 3D geometric models. Fassi et al. [9] analysed a Roman Thermal Complex-Naplex. Verdiani et al. [14] focus on a small portion of the garden at the Archaeological Museum in Florence. Finally, Teza et al. [11] compared TLS and SfM within a morphological analysis on the square cross-section of the 48 m high Garisenda tower in Bologna. However, few published works tried to establish the problem of comparing data acquisition techniques in large architectural spaces. The research by Roncella et al. [15] in architectural heritage showed exhaustive accuracy. On the other hand, Green et al. [16] analysed various SfM algorithms on different archaeological ensembles in terms of dimensions. As seen in the scientific literature in the field, their results indicated that SfM is less accurate than LIDAR, although it is more economical and easy to use.
Most studies on photogrammetric accuracy are based on TLS data and total stations. Many of them focus on small archaeological heritage objects in order to ascertain the accuracy of both data acquisition techniques. On the one hand, there are research works into the calibration of laser scanners to ascertain their measurement uncertainties, errors and accuracies [17,18,19,20,21,22,23]. It is also worth mentioning other applications of TLS technology, which include change detection and deformation monitoring in buildings, constructions and engineering systems [24,25,26,27,28,29], as well as the digitisation of archaeological heritage sites for analysis [7,30,31].
On the other hand, focusing on the accuracy of SfM, Pérez Zapata [32] compared the convergent digital photogrammetry with laser scanning, from which an accuracy of 4 mm was calculated for TLS, as well as 5 mm (XY axes) and 4 mm (Z axis) for SfM. Nevertheless, the procedures carried out to take the photographs and to compare a single point cloud with only two images are not described. The study of divergent photographic shots is related to the study of interior spaces. Thus, Ding et al. [33] proposed a hierarchical 3D reconstruction method which used disordered images taken by mobile phones. The improvements in the semantic segmentation by object labelling were the main contribution of these authors. Likewise in interior spaces, Furukawa et al. [34] proposed a multi-view-stereo algorithm specifically designed for plane surface scenes with dominant directions. This allows for automatically reconstructing scenes lacking texture. Concerning the study of SFM and the structured-light 3D optical scanning of small architectural elements, Molero et al. [35] used Agisoft PhotoScan software to capture the geometry of complex elements such as the column capitals of the Patio de la Muñecas in the Real Alcázar of Seville, Spain. Other researchers compared the efficacy of diverse SfM software. From the analysis of a small statue, Kersten and Lindstaedt [36] found that there are not significant differences in the number of points and triangles in the models. Koutsoudis et al. [12] proved that high-quality models can be obtained from a large set of images under suitable light conditions and software. Here, Photoscan was used to compare the mesh with the point cloud, from which an error of 20 mm at 7 m was calculated, where 7 m was the largest distance studied by these researchers. In addition, the standard deviation did not exceed 0.001 on smooth surfaces for distances from 70 mm to 30 cm (in 17 cm the error was 2 mm).
UAV-based photogrammetry studies are currently being carried out as an alternative to TLS surveying, what can be seen in geology and other terrestrial applications [37,38]. UAV platforms solve the great problem in capturing the geometry of high and inaccessible buildings or in the field of archaeology. Haala et al. [39] studied the accuracy and assess the algorithm quality from standard LIDAR flights. However, interior spaces and non-accessible areas for Small/UAV cannot be captured using this technology. Nex and Remondino [40] reviewed the different UAV platforms and software to open new perspectives. Focusing on the reliability of this technique, another research work calculated 95% accuracy of UAV photogrammetry against classic topography measurements [41]. The model accuracy through UAV photogrammetry depends of certain parameters [42]: The angle of homologous rays in different photographs [43], the number of control points—directly proportional to model accuracy [44]—the flight height [45] and the angle of photogrammetry shots [46], among others.
In the case of buildings, the use of photogrammetry is an opportunity to create 3D models. The so-called Photo Tourism approaches allow the reconstruction of numerous buildings and heritage sites [47]. With the appearance of PhotoModeler software in 2000, Pollefeys et al. [48] created a more robust algorithm from sequence models of non-calibrated and latest generation images applied to buildings and archaeological sites. Researchers who base their studies on Agisoft PhotoScan against other software highlight the advantages of high precision and simplicity of their methodology [49]. Numerous comparison studies determine the quality and accuracy of these algorithms. Doneus et al. [50] determined 95% confidence in vertical measurements between the PhotoScan DSM 10 software and TLS. Teza et al. [11] carried out a morphological analysis of a façade in a masonry building from the evaluation of the difference between the point cloud and a regular reference surface adjusted to it. The results showed that the difference between both methods was below 20%, but the variation can be between 25% and 30% for large dimensions, which showed the variability of the measurement system. Other authors [14] scanned a small-scale model where the camera positions surround the element examined. The study was intended to create a 3D model of the courtyard of the archaeological museum in Florence for visitors. Here, SfM and TLS were compared in the case of a Roman pavilion, taking the latter as the reference. Agisoft Photoscan and Autodesk 123D Catch were used to ascertain the accuracy and the average deviation of the set of points. The data distribution revealed that most of the errors were within a range between 5 mm and −5 mm, and that the approach was accurate enough to merge the polygon mesh with the TLS point cloud data. Ippoliti et al. [51] studied the conditions of closed spaces to analyse the advantages and limitations of SfM.
According to researchers in the field, the advantages go beyond generating the mesh from the point cloud, since the 3D model can also be mapped from different photographs. Reu et al. [49] created a three-dimensional record of archaeological excavations for three elements, of which two were based on GPS spatial data, and the third was recorded using a total station. In that research, the percentage differences of each element were obtained: Errors of 15 mm for 2.40 m length, and 11 mm for 0.32 m height. When using a total station, the comparison is not conducted from the point cloud, but manually, which may produce new errors. On the other hand, Sapirstein [52] studied areas larger than 25 m and achieved 1 mm resolution. However, SfM/MVS accuracy is difficult to be addressed [52]. The proportion 1:K is a theoretical estimation of the real accuracy and, according to Fraser and Brown [53], it can vary in each image. The accuracy of the photogrammetric systems results from comparing the measurements given by the software and the real measurements [52], and the proportion 1:K represents the absolute error divided by the maximum scene dimension [52]. Therefore, the relative accuracy from Table 1 (1:1000—represents a maximum absolute error of 20 mm for a 20 m length in the object. On the other hand, the largest dimension of object column stands for the building length in metric units. When dealing with accuracy, it should be noted that it is the closeness of the result of a measurement, calculation or process to an independent higher order reference value [54]. According to Remondino, this concept coincides with the precision when significant errors in measurements are not considered, i.e., outliers are removed. Diverse parameters found in the scientific literature can influence the accuracy of SfM such as lighting, focal length, camera calibration among other causes, but it is important to know the accuracy of the TLS when comparing SfM and TLS point clouds, since SfM may entail lower errors.
The growing development in the automated processing of low-cost and open source images for 3D reconstruction purposes leads to the dissemination of digitised models in all areas of knowledge related to cultural heritage [8]. Nevertheless, the accuracy of these algorithms is debateable in almost all existing scientific studies. The estimated accuracy is gathered in Table 1, and provided by other researchers who deal with non-architectural elements [55]: De Reu et al. [56], Olson et al. [57], Dellepiane et al. [58], Martínez et al. [59], Remondino et al. [8], Lerma et al. [60], Koutsoudis et al. [12], Jennings [61], Frasser and Brown [53], Barazzetti et al. [62], Frasser et al. [63] and Sapirstein [52], who highlighted a significant variation in absolute errors. Most of the times, this error is subject to the algorithm used, the diverse equipment and the survey methods.
Table 1 gathers research works on the difference in accuracy between SfM and TLS for architectural spaces. Sapirstein [52] briefly reviewed this in 2016, but subsequent studies have not gathered the advances in the scientific literature. This carried out in this paper (Table 1).
Table 1. Accuracy and relative accuracies in literature review.
StudyLargest Dimension of Object (m)Accuracy (mm)Relative AccuracySubjectSoftwarePoint Comparison
Reinoso et al., 2014 * [52]10_2010_26<1:1000Façade of BuildingsPhotomodelerTotal Station and SfM
Remondino et al., 2012 * [8]
15351:500Railway BuildingsDiverse softwareTotal Station and SfM
Green et al., 2014 * [16]
5_1519_39<1:400Church BuildingsDiverse softwareTotal Station and SfM
Koutsoudis et al., 2014 * [64]
10141:700Church BuildingPhotoScanTotal Station and SfM
Riveiro et al., 2011 * [13]
<10121:800BridgePhotomodelerTLS and SfM
Fassi et al., 2013 [13]
551:1000Façade of ChurchPhotoScanTLS and SfM
Verdiani and Braghiroli, 2012 [14]
1_251:400Detached TemplePhotoScan, 123D CatchTLS and SfM
Teza et al., 2016 [11]
441:1000TowerPhotoScanTLS and SfM
Roncella et al., 2012 [15]
25251:1000Façade of ChurchPhotomodelerTotal Station and SfM
Remondino et al., 2008 * [65]
1_21.41:1500Façade of TemplePhotomodelerTLS and SfM
Remondino et al., 2009 * [66]
<1.2<0.41:3000Façade of BasilicaPhotomodelerTotal Station and SfM
Sapirstein, 2016 [52]5531:16,000Façade of TemplePhotoScanTotal Station and SfM
* Already cited in Table 1 by Sapirstein [52]. The rest of the references are provided by the authors of this paper.
From this table, it can be noticed that there is a lack of studies that analyse the accuracy of SfM in large architectural spaces. For this reason, the objective of this research article is to verify the suitability of the SfM technique for the digitisation of architectural spaces with a symmetrical configuration. The Casa de Pilatos in Seville, Spain, is selected as a case study due to the large dimensions of its main courtyard. Firstly, the TLS data of the courtyard is taken as the reference to compare the point cloud data obtained using SfM in order to verify the accuracy and the point deviation between both technologies. The low accuracy of the method in comparison with the work by Roncella et al. [15] leads to optimise the work by improving the methods and using a total station to set control points. The results of both surveys are compared in relation to image acquisition and processing procedures.

2. Methodology

The study is designed to digitise and assess the accuracy of SfM for large architectural spaces, which is carried out in the main courtyard of Casa de Pilatos. To do this, the camera follows a circular route to record the four sides of this Renaissance-characterised courtyard, of which three arcades have two floors, and the fourth is on ground floor. The data are collected in two different surveys carried out using SfM: A and B. No control points are recorded in Survey A. For Survey B, a total station is used to record control points, considering each arcade as independent elements.

2.1. Case Study: The Main Patio of the Casa de Pilatos

One of the most interesting palaces due to its architectural features and decorative elements (Figure 1) is located in the historic centre of the city of Seville. It is the Palacio de los Adelantados de Andalucía, now known as the Casa de Pilatos, which consists of a series of spaces with elements of Mudejar, Gothic and Renaissance styles—this is the traditional Sevillian architecture of the early 16th century. This palace is considered one of the most orientalist in Seville because of its multiple Mudejar components and architectural shapes.
The building is based on the Reales Alcázares in Seville, especially on the Palace of Rey Don Pedro, whose influence is more evident in the inscriptions on its gypsum friezes [67]. The magnificence of the main courtyard of Casa de Pilatos is represented by its architectural shapes: The decoration of the arches, the Genoese marble columns imported by Don Fadrique and the window openings to the courtyard on ground floor, with pseudo-Nasrid columns in 1861 [68]. There are certain peculiarities in the courtyard, such as the difference in the axes of the arches; there are two minor arches beside each side of a major arch. This pattern is Islamic and can be found in the Patio de las Doncellas and the Patio del Yeso in the Alcázar in Seville. The structure of the building encloses this 25 m by 25 m courtyard, which presents a series of structural deformations due to the course of time. This makes this space a suitable case to be analysed from the morphological point of view. Thus, the structural alterations could be later quantified from point cloud data and imported into BIM.

2.2. Data Collection

Three survey methods are used in this research: (i) Classic topographic measurement techniques such as the laser meter and the tape meter; (ii) terrestrial laser scanner (TLS) and total station; and (iii) photogrammetry using a reflex camera.
While the classic measurements were not initially considered, they were used to compare wall thicknesses with TLS data. For the second phase (Survey B), four control points visible from the three scanner positions in the courtyard were set to create the reference XYZ coordinate system. The laser scanner used was the Leica ScanStation C10, with a range of 120 m for geometry capture and an embedded camera of 4 Megapixels to map colours onto the point cloud data. However, the NCTech Istar camera was used for the colour mapping, since it has higher resolution and HDR imaging. On the other hand, according to the manufacturer’s information, the Leica Flexline TS02 total station with 2 mm accuracy [69] was used to record the control points.

2.2.1. Structure-from-Motion Survey

The data was collected using the total station from a single position at the centre of the courtyard to cover all the arches of the ground floor gallery. The coordinate system was determined with the axes parallel and perpendicular to the four arcades of the courtyard. The XYZ coordinates set were 100, 100, 10 m. Next, coordinates of elements on each arcade were recorded so that a uniform set of points could be achieved.
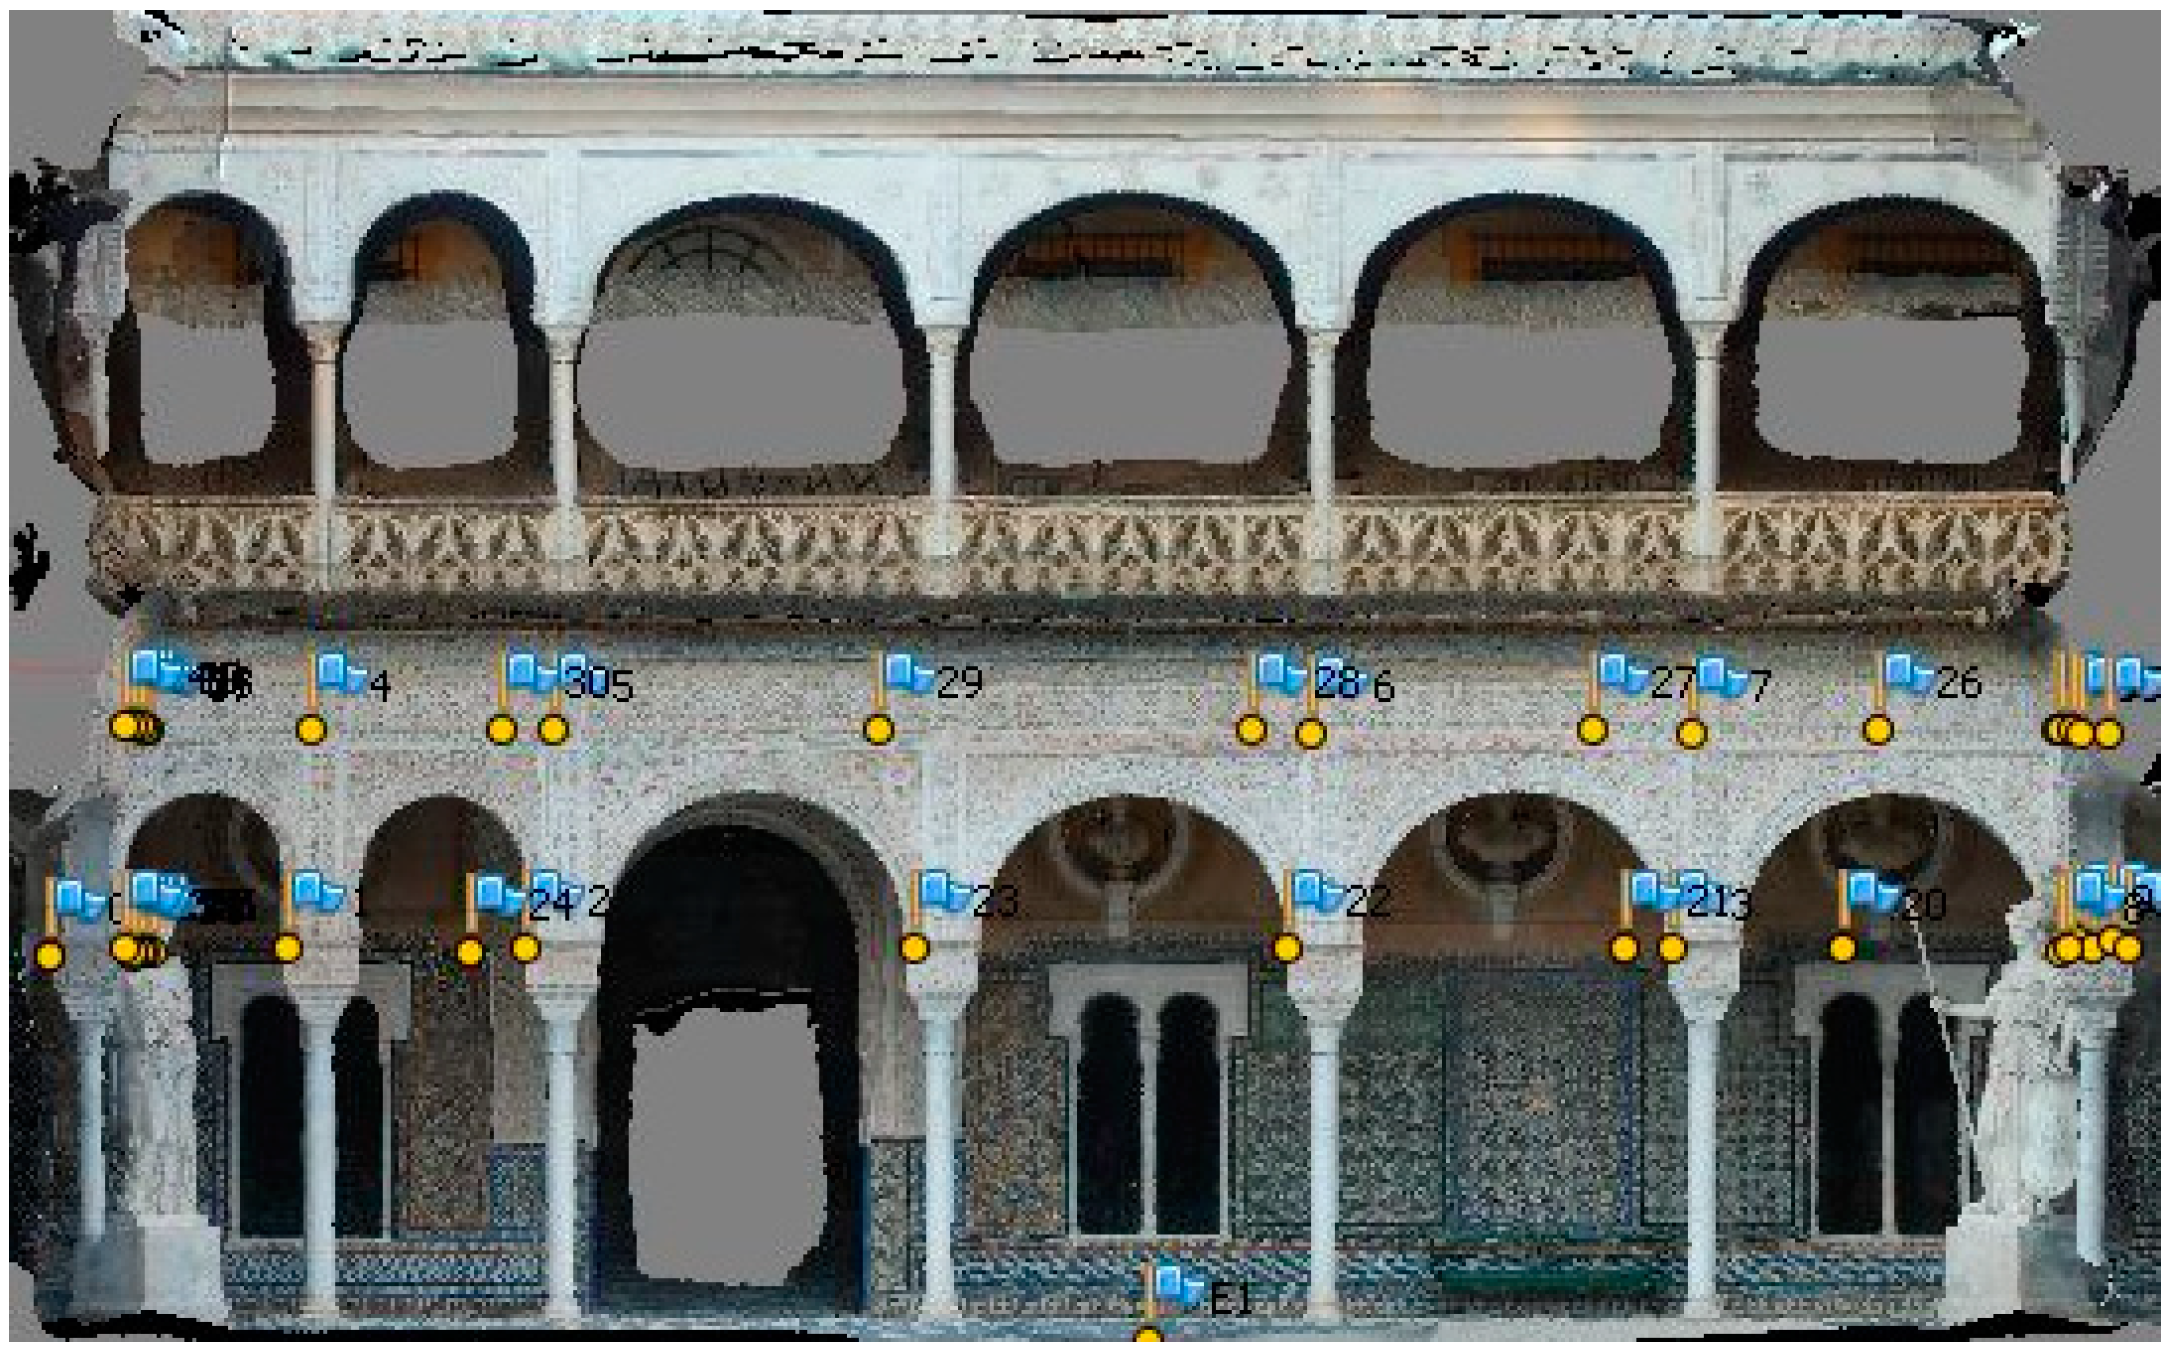
Particularly, these Ground Control Points (GCPs) were taken from the decorative patterns on the column capitals and the column shafts. The GCPs were directly measured in the façade, and were imported as coordinates in the software in the reference option. These points were taken as markers to align the different “chunks”. The points recorded had to be identifiable in the subsequent photographs for SfM. 42 control points were captured; Figure 2 shows two of these control points.
In photogrammetry it is important to take into account aspects such as: Camera calibration; guarantee linear routes for the images; ensure at least 80% overlap between adjacent photographs; and the separation between shots. Moreover, the relation existing in the photographs between the focal distance (f) and the sensor width (w) is equal to the relation between the camera-object distance (H) and the width of the view (W) according to the basic principles of Krishnan [70]. Considering that, 20% of W is the maximum lateral displacement that must be made between shots so that the photos obtained have 80% minimum overlap. In addition, the recommendations indicated in the data capture section are taken into consideration to achieve the quality of the studies on A-class architectural heritage [71].
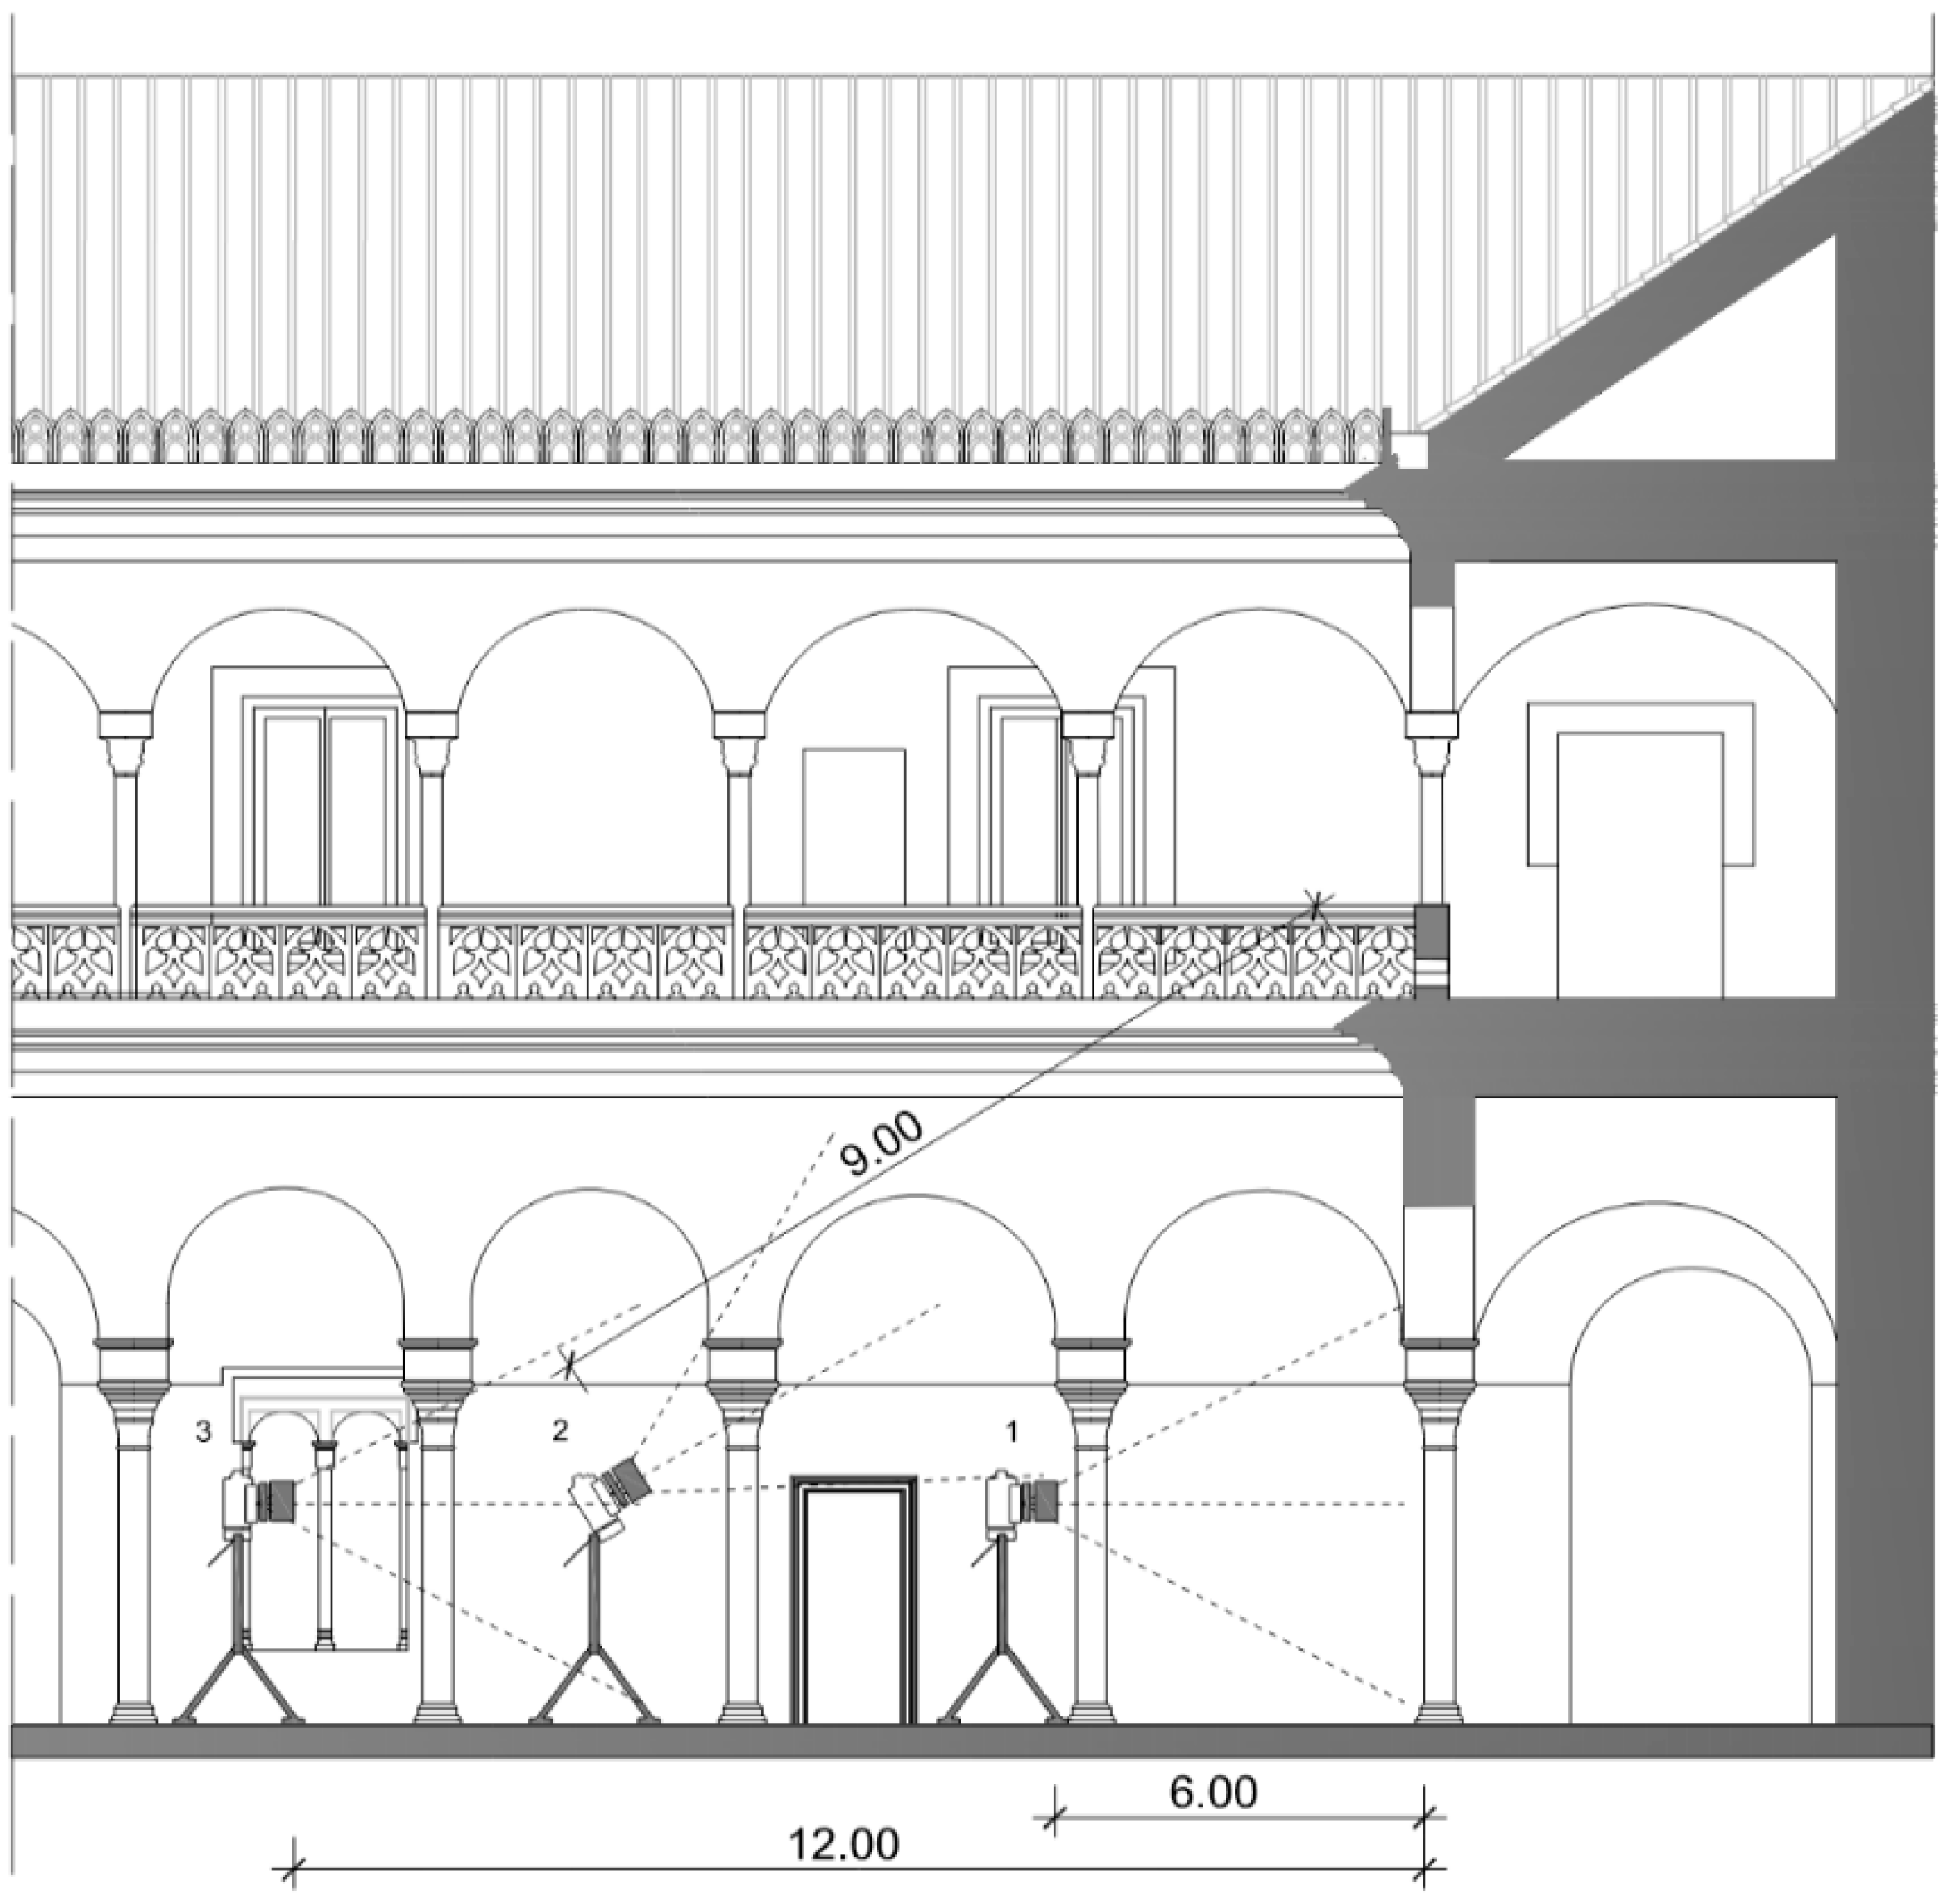
This survey technique allows to obtain data of the objects from both aerial and terrestrial photographs, taking into account the shooting series from Table 2. The photogrammetric survey consists of photographs taken considering the orientation of the building and several reference measurements in order to increase the size of the 3D model once it is created. This process was performed for northwest, northeast and southeast arcades. However, fewer photographs were taken for southwest arcade, since it lacks a second floor. A total of 99 photographs for Survey A and of 175 photographs for Survey B were taken, using a NIKON D80 digital reflex camera at 12 MP sensor with size: 23.6–15.6 mm, lens Nikon DX AF-S NIKKOR 18–135 mm f/3.5–5.6 G ED and a tripod. The focal length used was 18 mm, image stabilizer optical and exposure (fix) 1/400 s f 3.5. The CCD sensor size is 23.6 mm × 15.8 mm, distributed in 3872 × 2592 pixels for a maximum resolution in NEF RAW format. The ISO was set to 200 with 9 m altitude (relative to start altitude). The photographs must be taken in the usual RAW format [72], although these images may use significant computational resources, they have to be processed through Lightroom software for developing. The image file was recorded in JPG format, implying a file size of about 2.5 MB in order to simplify the developing processing [73]. This led to avoid the use of RAW format. The position and dimensions are shown in Figure 3. The NIKON D80 digital reflex camera was not calibrated, since the Agisoft PhotoScan v.1.2.3 [74] SfM software has automatic calibration functions.
In order to calculate the Ground Sampling Distance (GSDs), the sensor size (23.6 mm × 15.8 mm) and the image resolution (2896 × 1944 pixels) are taken into consideration. The size of each pixel can be obtained dividing the horizontal sensor dimension by the number of pixels in the horizontal direction of the image. The pixel size obtained is 8.14 microns. Knowing that the relation between the pixel size and the focal distance is proportional to the relation between the GSDs and the distance from the camera to the object, the GSDs can be obtained (Table 2). The correction of GSDs when the images are not perpendicular should be carried out using the formulae given by Leachtenauer [75]. Nevertheless, the effective pixel size in the object space may vary due to the lens distortion, but, given the fact that these images are not intended to perform a detailed mapping, the nominal GSDs was considered [76].
Agisoft Metashape software’s algorithms [77] and based on standard algorithms similar to other software packages. The interior orientation parameters, as well as the focal length and the sensor size, are obtained from the images properties, and their determination is carried out by searching for conjugated points. The scale of the final 3D model is obtained by geo-referencing using the GCPs, which are manually input in the system; this implies an arduous process due to the divergent photogrammetric approach in this research. Agisoft software performs the auto-calibration of the camera. The process follows the distortion model by Brown [76] with a set of parameters that can be configured by the user Gonçalves and Henriques, and others [76,78,79] defined the mathematical formulae of the distortion model. The dense point cloud data is obtained once the accurate orientation of each image is achieved by the programme.

2.2.2. Terrestrial Laser Scanning Survey

TLS was used to obtain the reference point cloud for the geometric comparison with SfM. The use of time-of-flight sensors is advisable for large entities such as buildings or landscapes. This type of scanner emits laser pulses and measures the time light needs to reach the sensor (time of flight). That flight lapse, given the constant speed of light, allows for calculating the range to the object. In this sense, occlusions must be avoided in the 3D survey; therefore, the scanner positions were planned to capture the whole geometry of the courtyard. Three positions were established inside the courtyard and four more by the corners inside the galleries. The resolution of the Leica ScanStation C10 scanner was set to 6 mm at 10 m, and the scan quality value was 3 out of 4. The accuracy of this scanner is 4 mm (standard deviation) [80]. A UTM global reference system was subsequently linked to the local coordinate system, according to recommendations by the Institute of Cultural Heritage of Spain (IPCE). TLS technology can achieve an accuracy in spatial coordinates with an error range of 1–10 mm [81]; therefore, the TLS point resolution of 6 mm at 10 metres is considered acceptable for this study. The alignment or registration of the point clouds corresponding to the different stations or positions of the laser scanner was carried out in Leica Geosystems Cyclone REGISTER 360 software [82]. The point cloud error alignment—bundle error or scan group error—was 3 mm, with a scan overlapping of 49% and 77% strength value in the scan links. Concerning the point cloud colour mapping, a NCTech iSTAR Fusion 3D HDR camera was used to capture the images against the laser scanner’s camera. The light conditions must be taken into account during data capture, thus ensuring scenes as homogeneous as possible in terms of contrasts due to the presence of shades.

2.3. Data Processing and Analysis

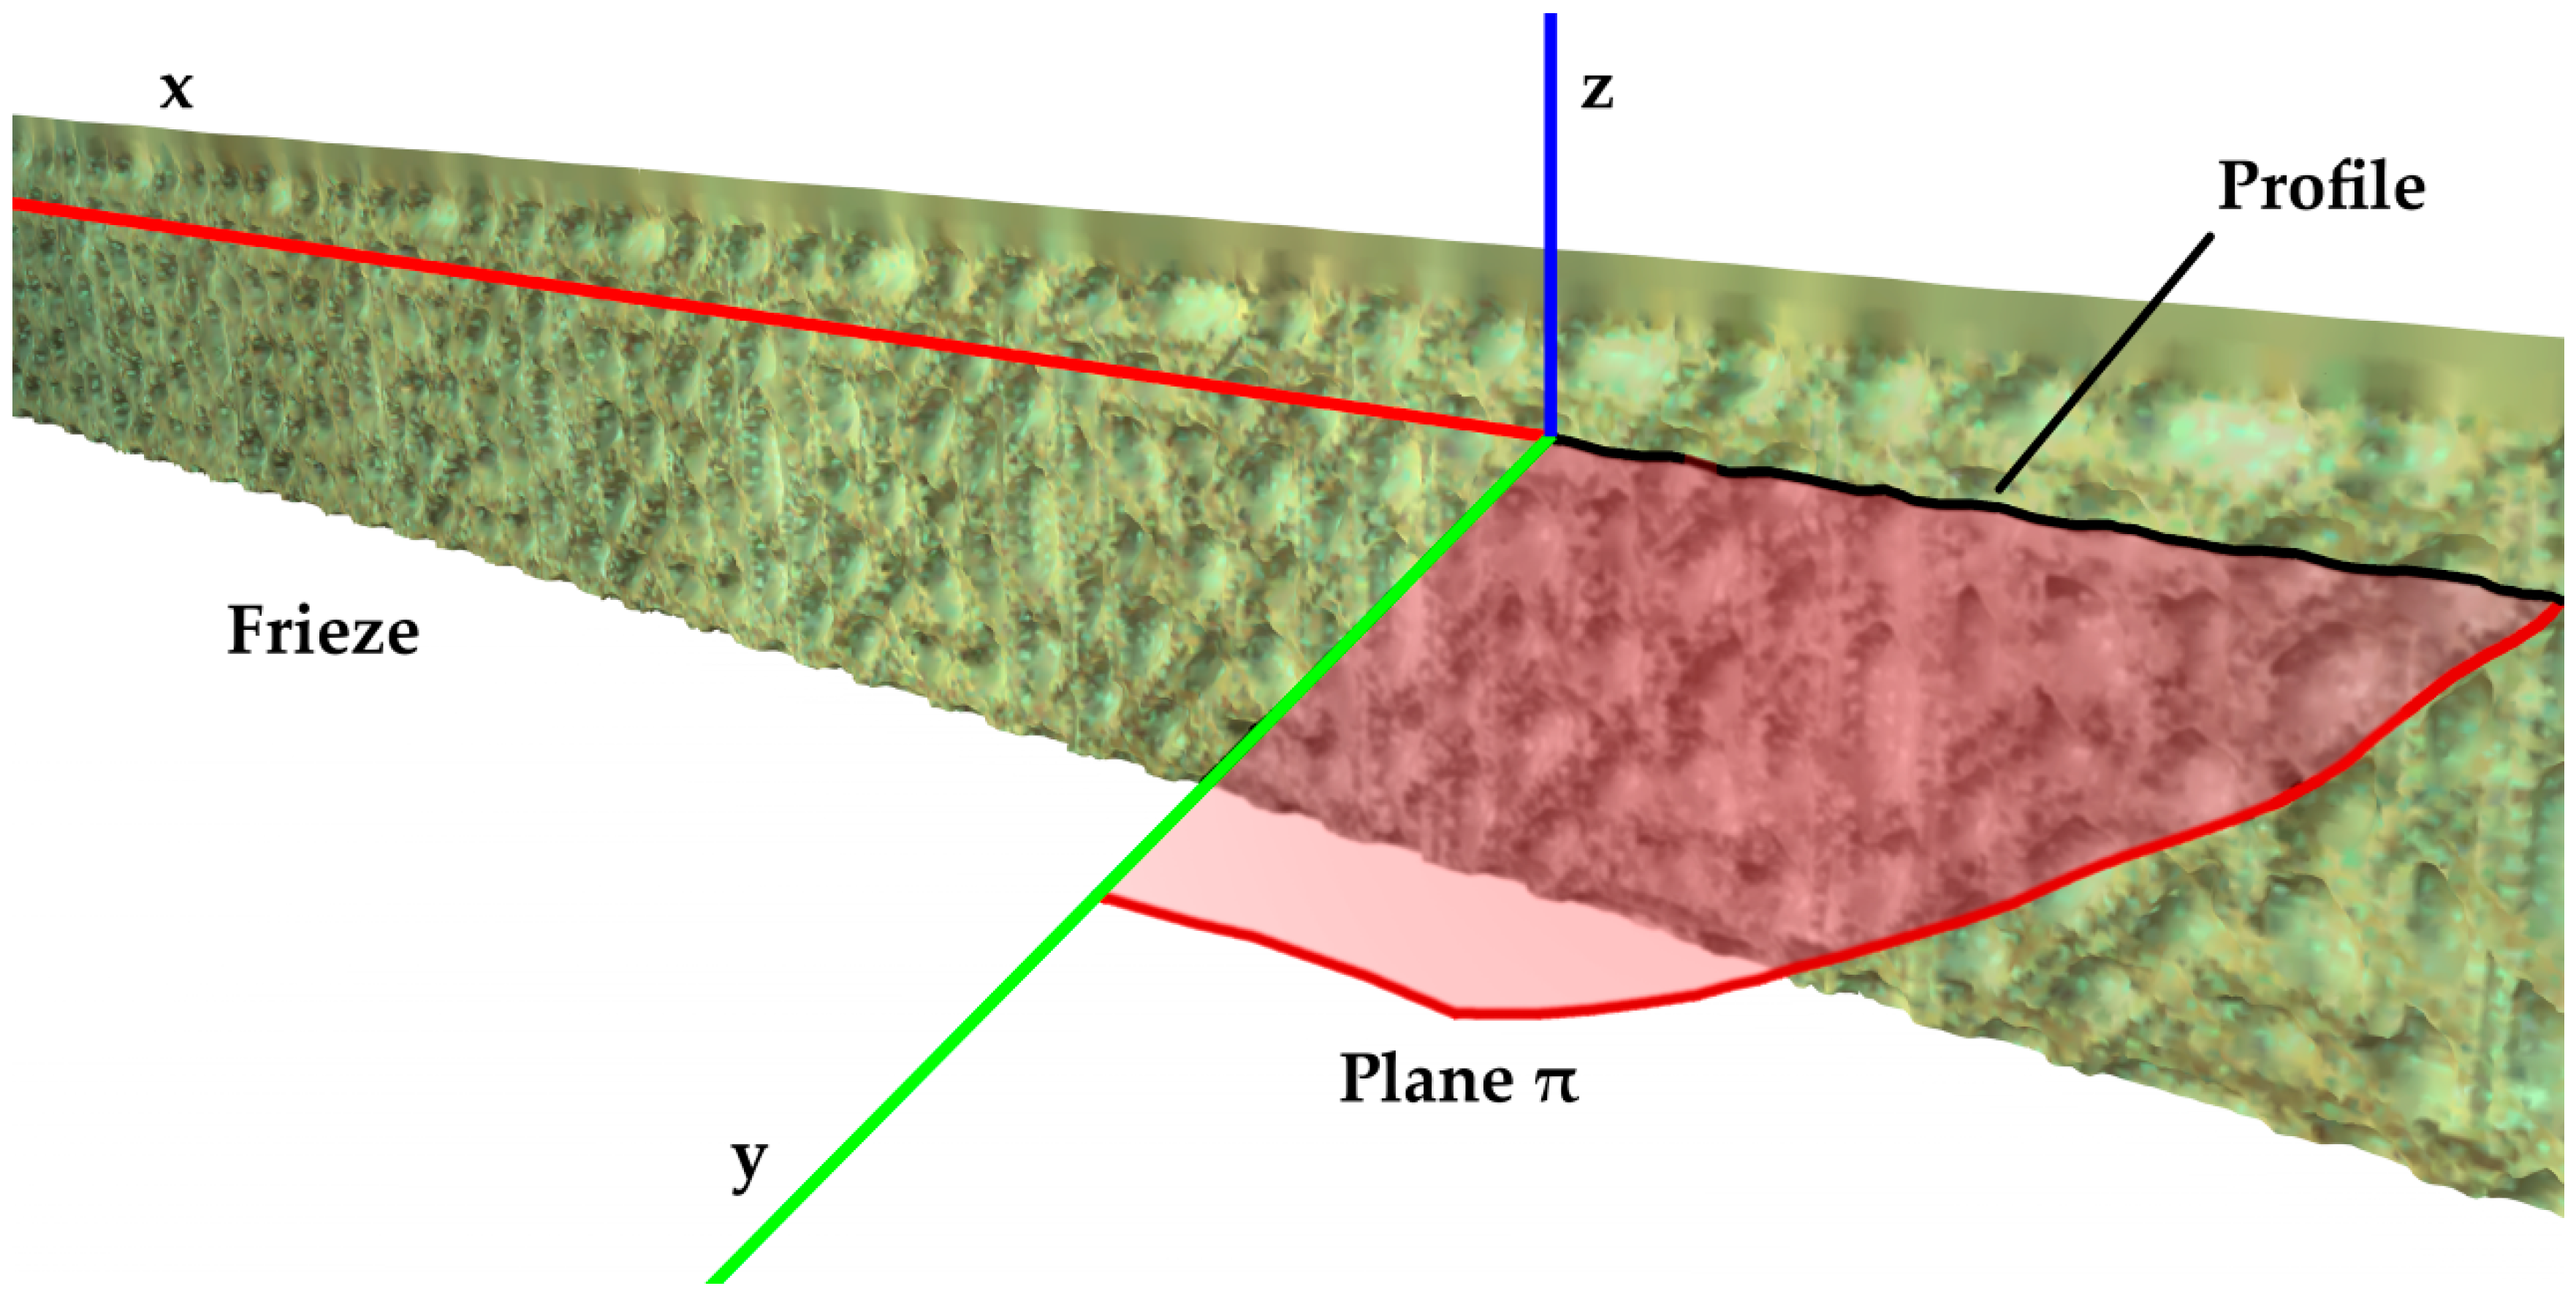
Manual segmentation was performed to subsequently calculate the geometric deviation between the SfM and TLS point clouds. Polygon fencing in CloudCompare v. 2.10-alpha [83] software allows to remove noise, points out of context and unwanted elements such as the statues of the courtyard. Moreover, the friezes of the ground floor arcades were segmented for the comparison of Survey A and B in this large architectural space (Figure 4). The segmented elements were meshed in CloudCompare using the Poisson Surface Reconstruction plug-in [7,84] so that their profiles (horizontal sections) could be created in Rhinoceros V6 [85] for comparison.
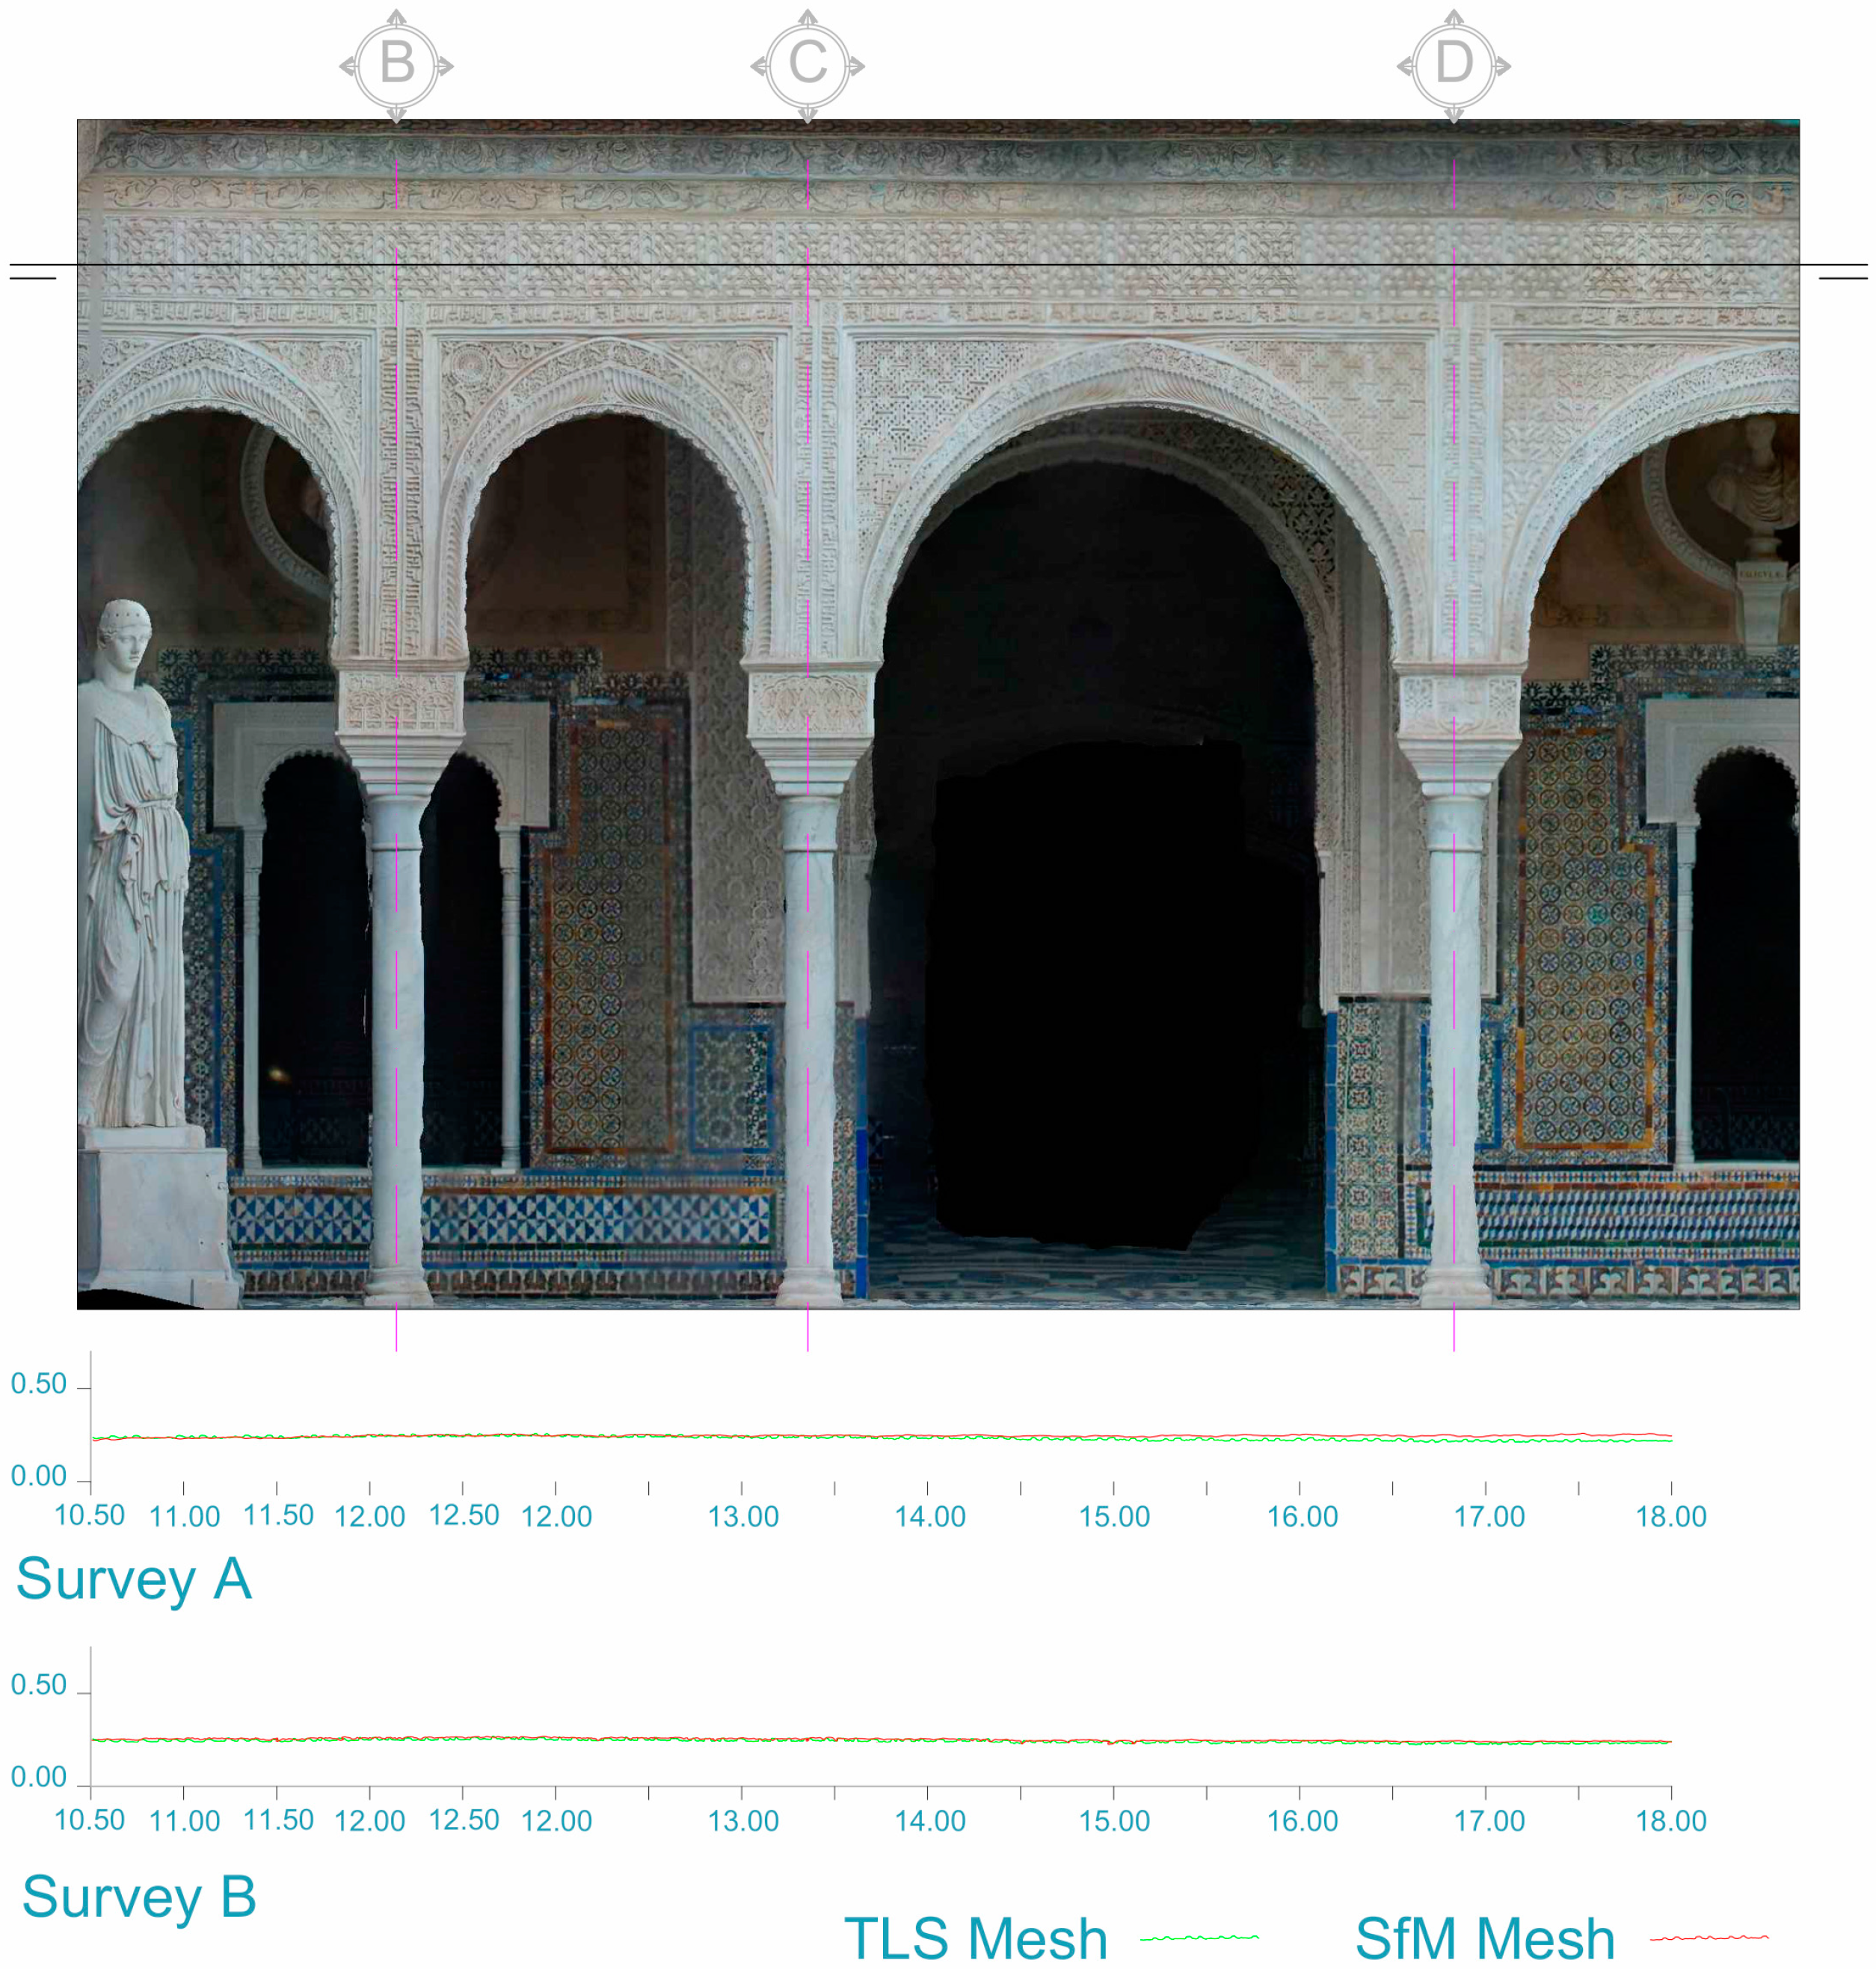
The dispersion of these shapes was compared with the distribution of photographs taken in Survey A and B, thus obtaining two graphs (Figure 5) in which the deviation in metres can be seen from a section π in the centre of the frieze.

3. Results

3.1. Survey A

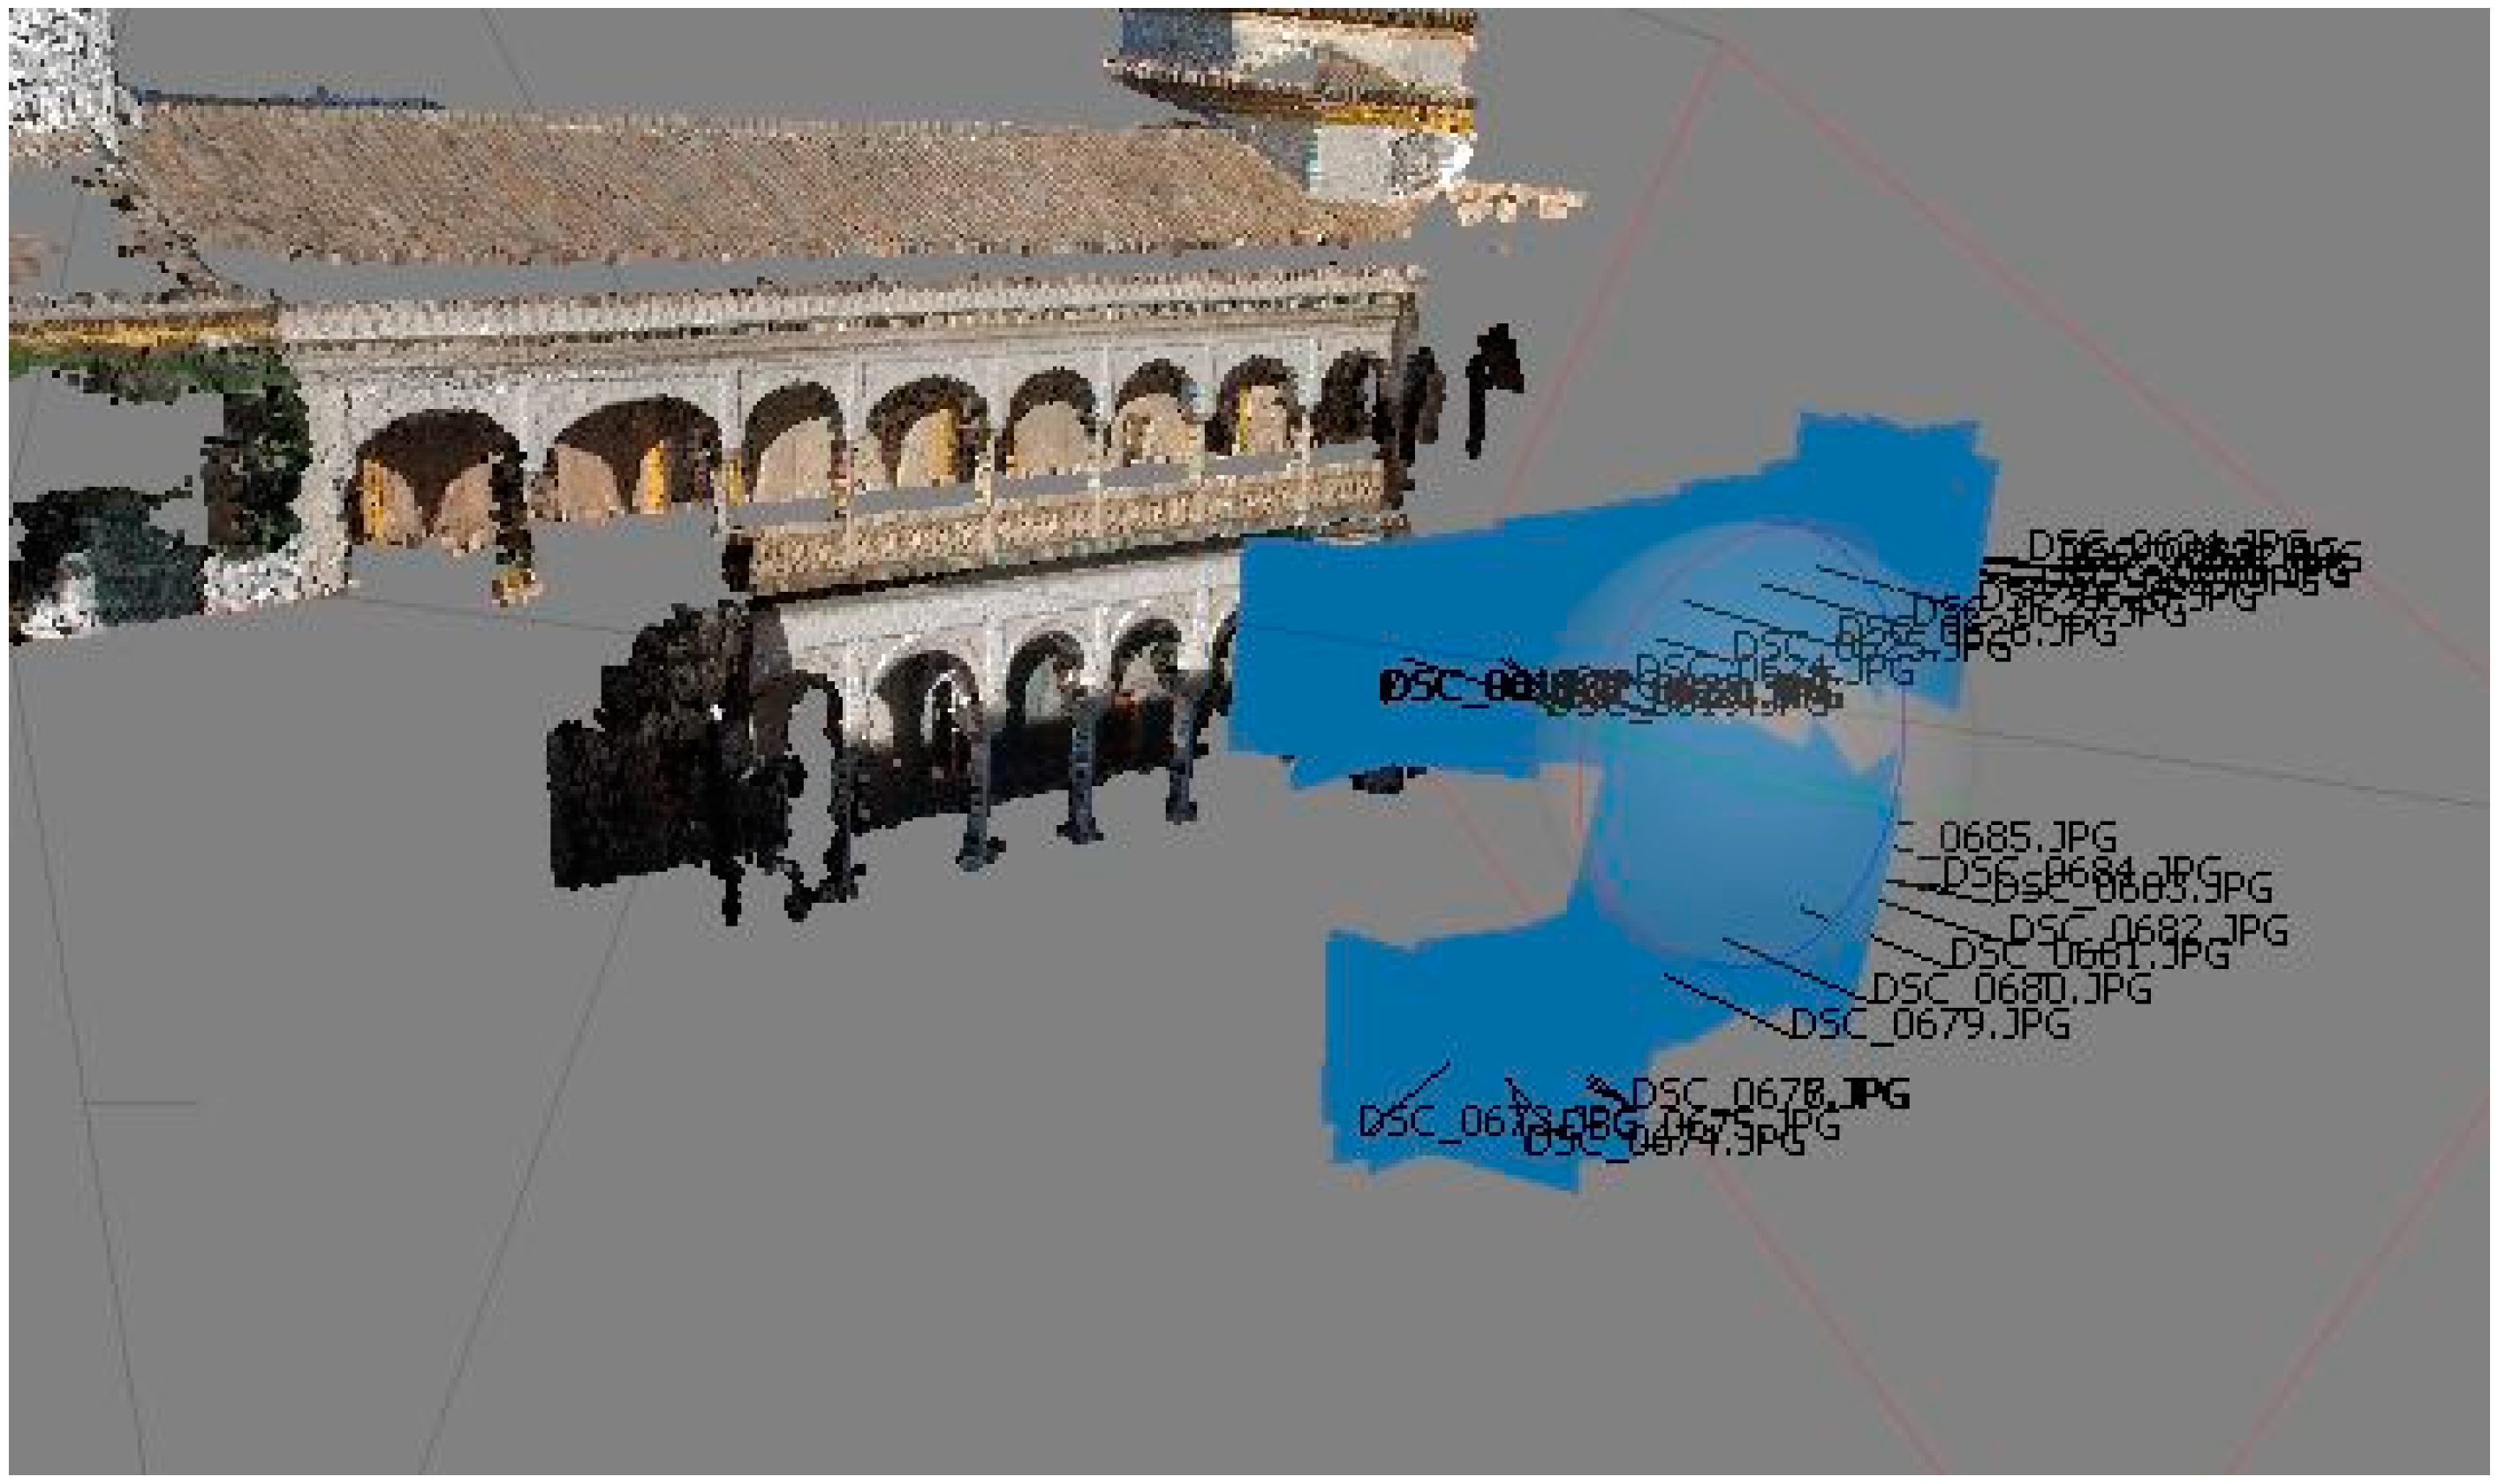
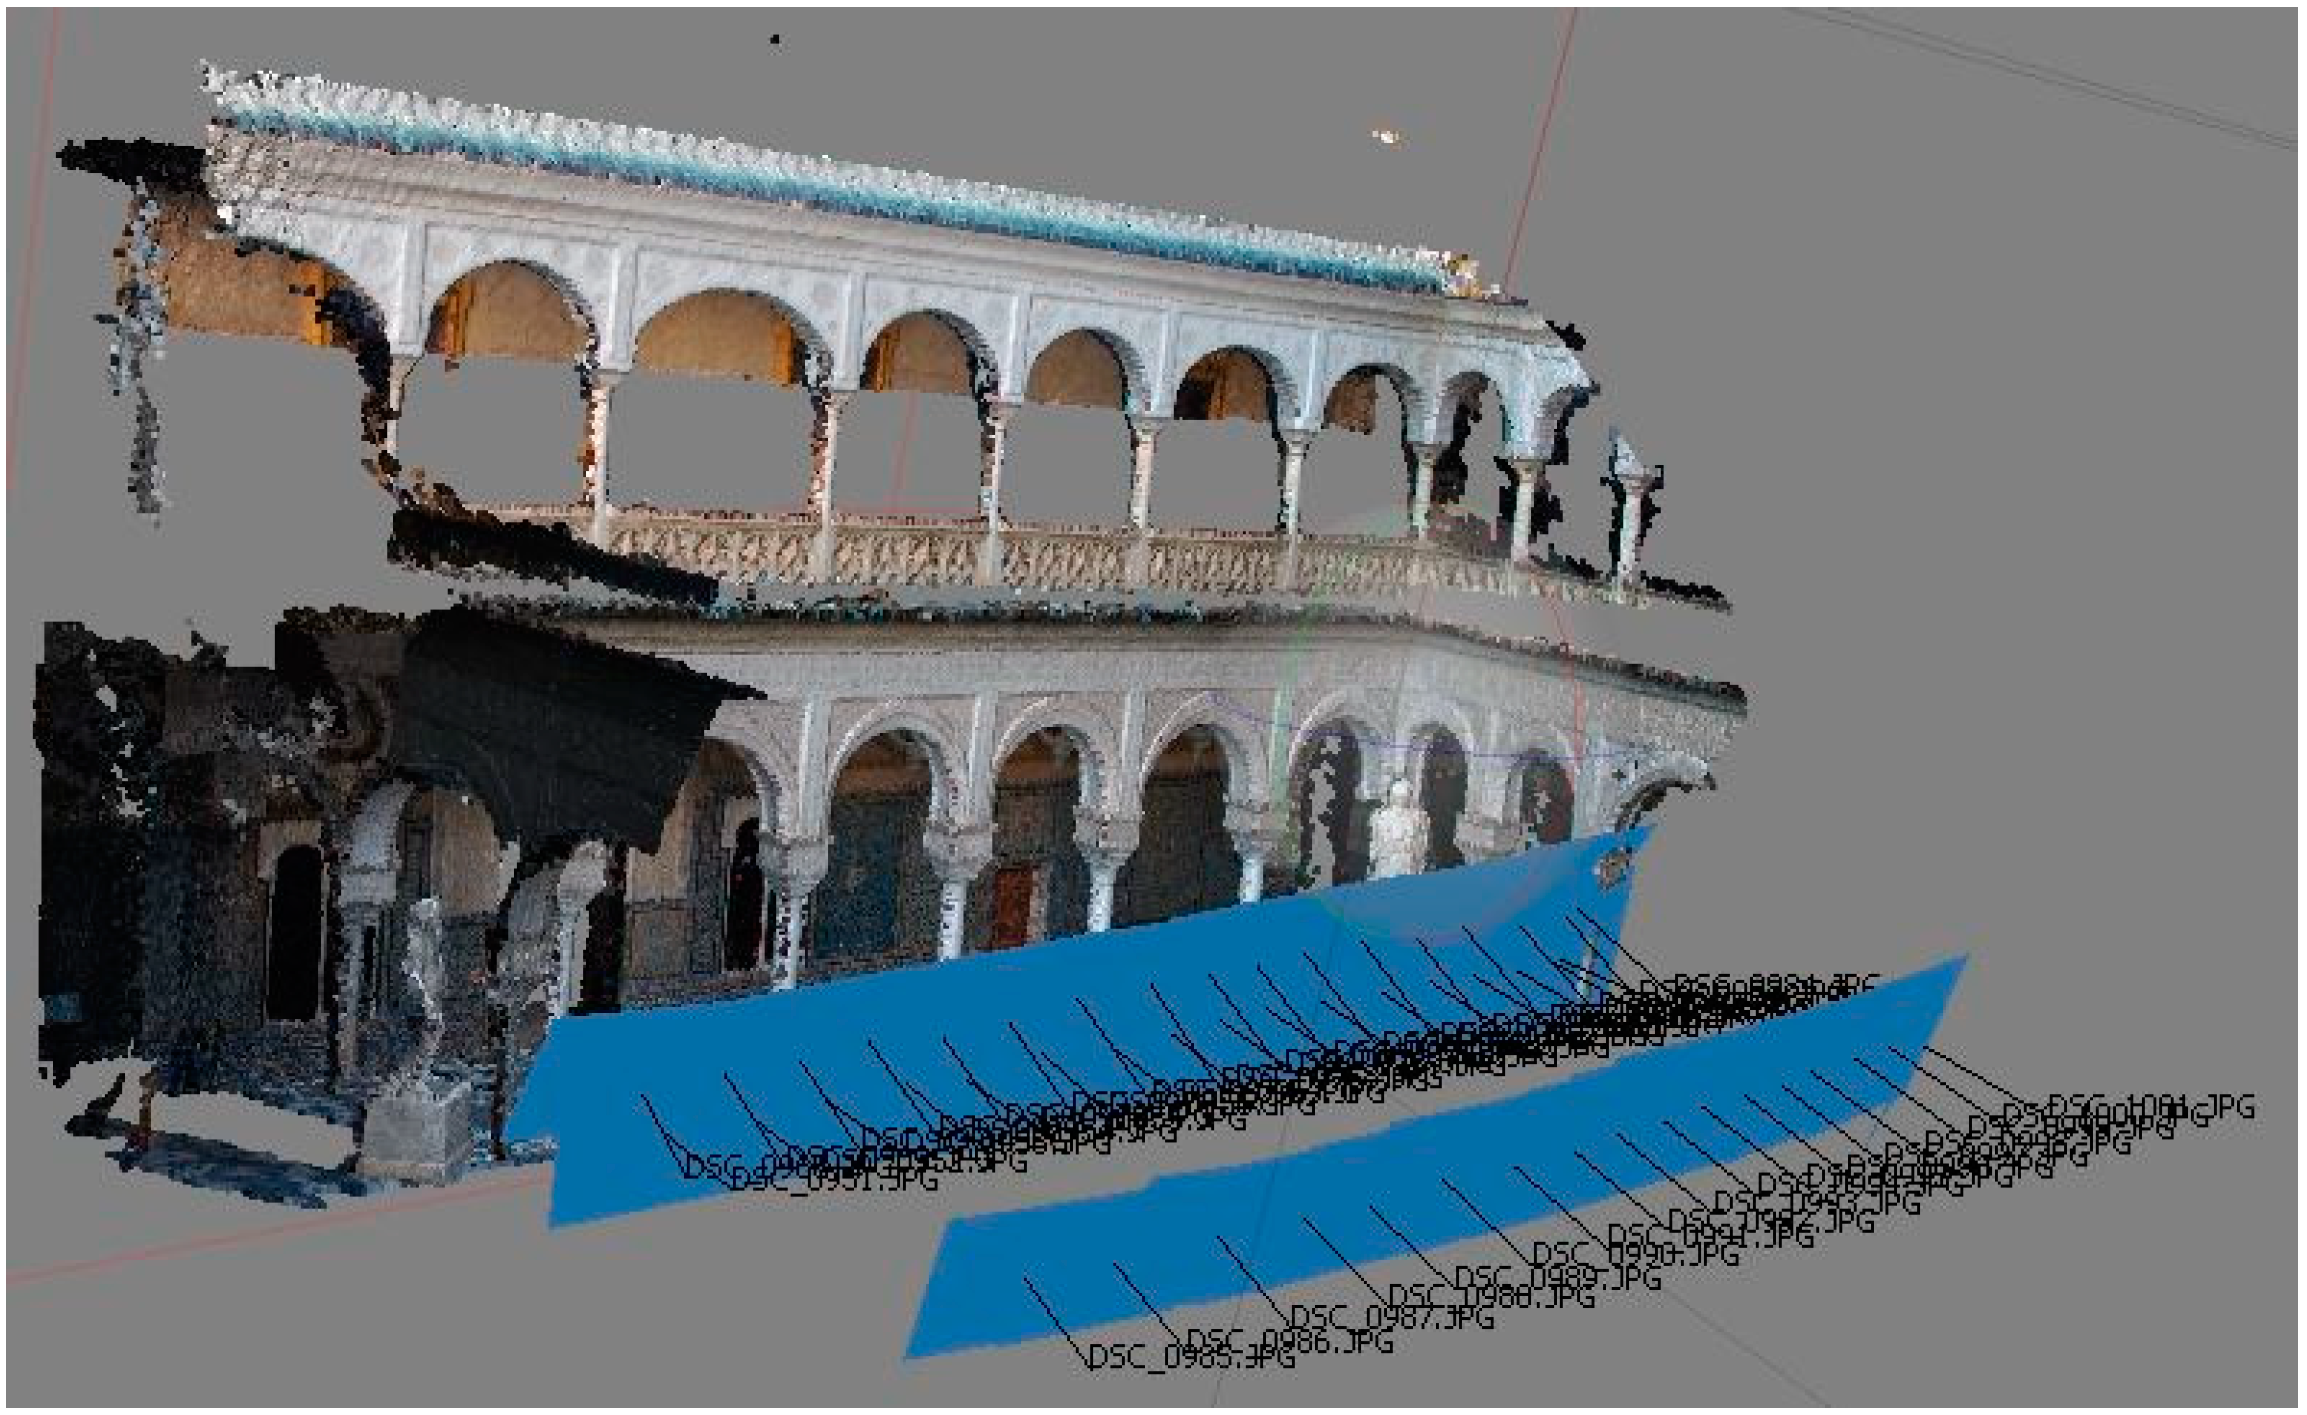
The first Survey in this research was carried out through series of images taken at a distance of approximately 16 metres from the galleries constituting the courtyard of Casa de Pilatos. Each series contains about 15 to 19 photographs for each side of the courtyard, divided into two series; one on the ground floor and another one on the top floor. The distribution of the photographs is shown in Figure 6.
An 80% overlap for each photograph is taken into account. The number of images depends on the desired accuracy and the complexity of the building. The images are processed, using Agisoft PhotoScan v.1.2.3. Neither a reference system nor control points are considered in this case, since the aim is to evaluate the speed of the survey, which is the key parameter according to Fassi et al. [9]. The auto-calibration of Agisoft software calculates the camera calibration parameters. Thus, the calibration could not be necessary in short-range studies [86] and when achieving 1:20,000 error sequences [52]. The accuracy of these parameter calculations is demonstrated by Koutsoudis et al. [12]. The duration of the process is approximately 1 h and 30 min. The resulting dense point cloud contains approximately 22 million points.
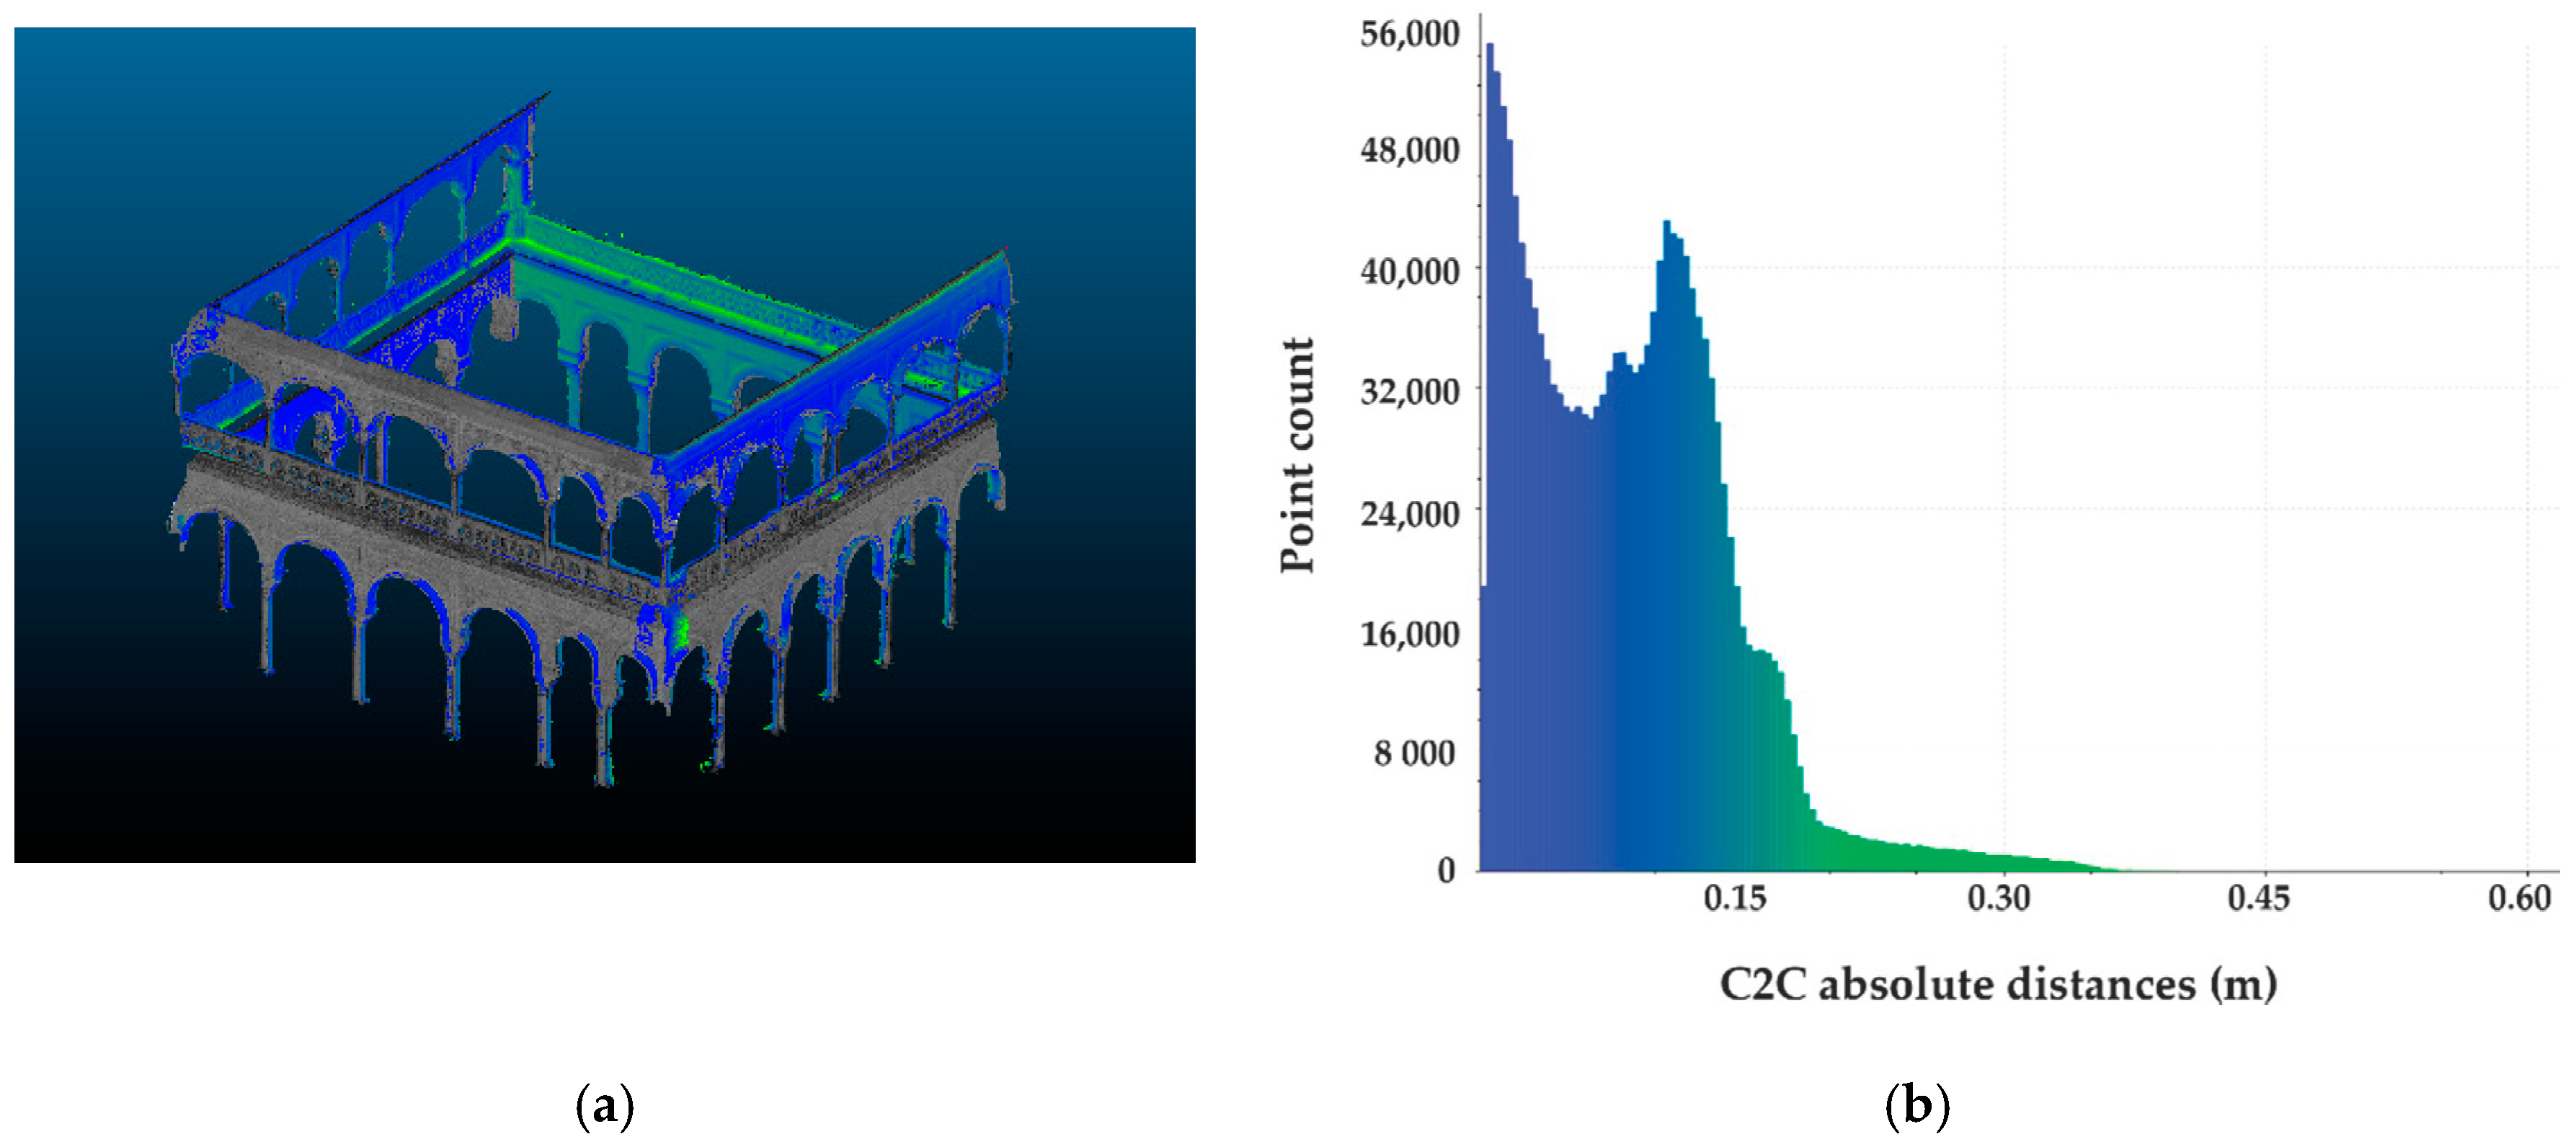
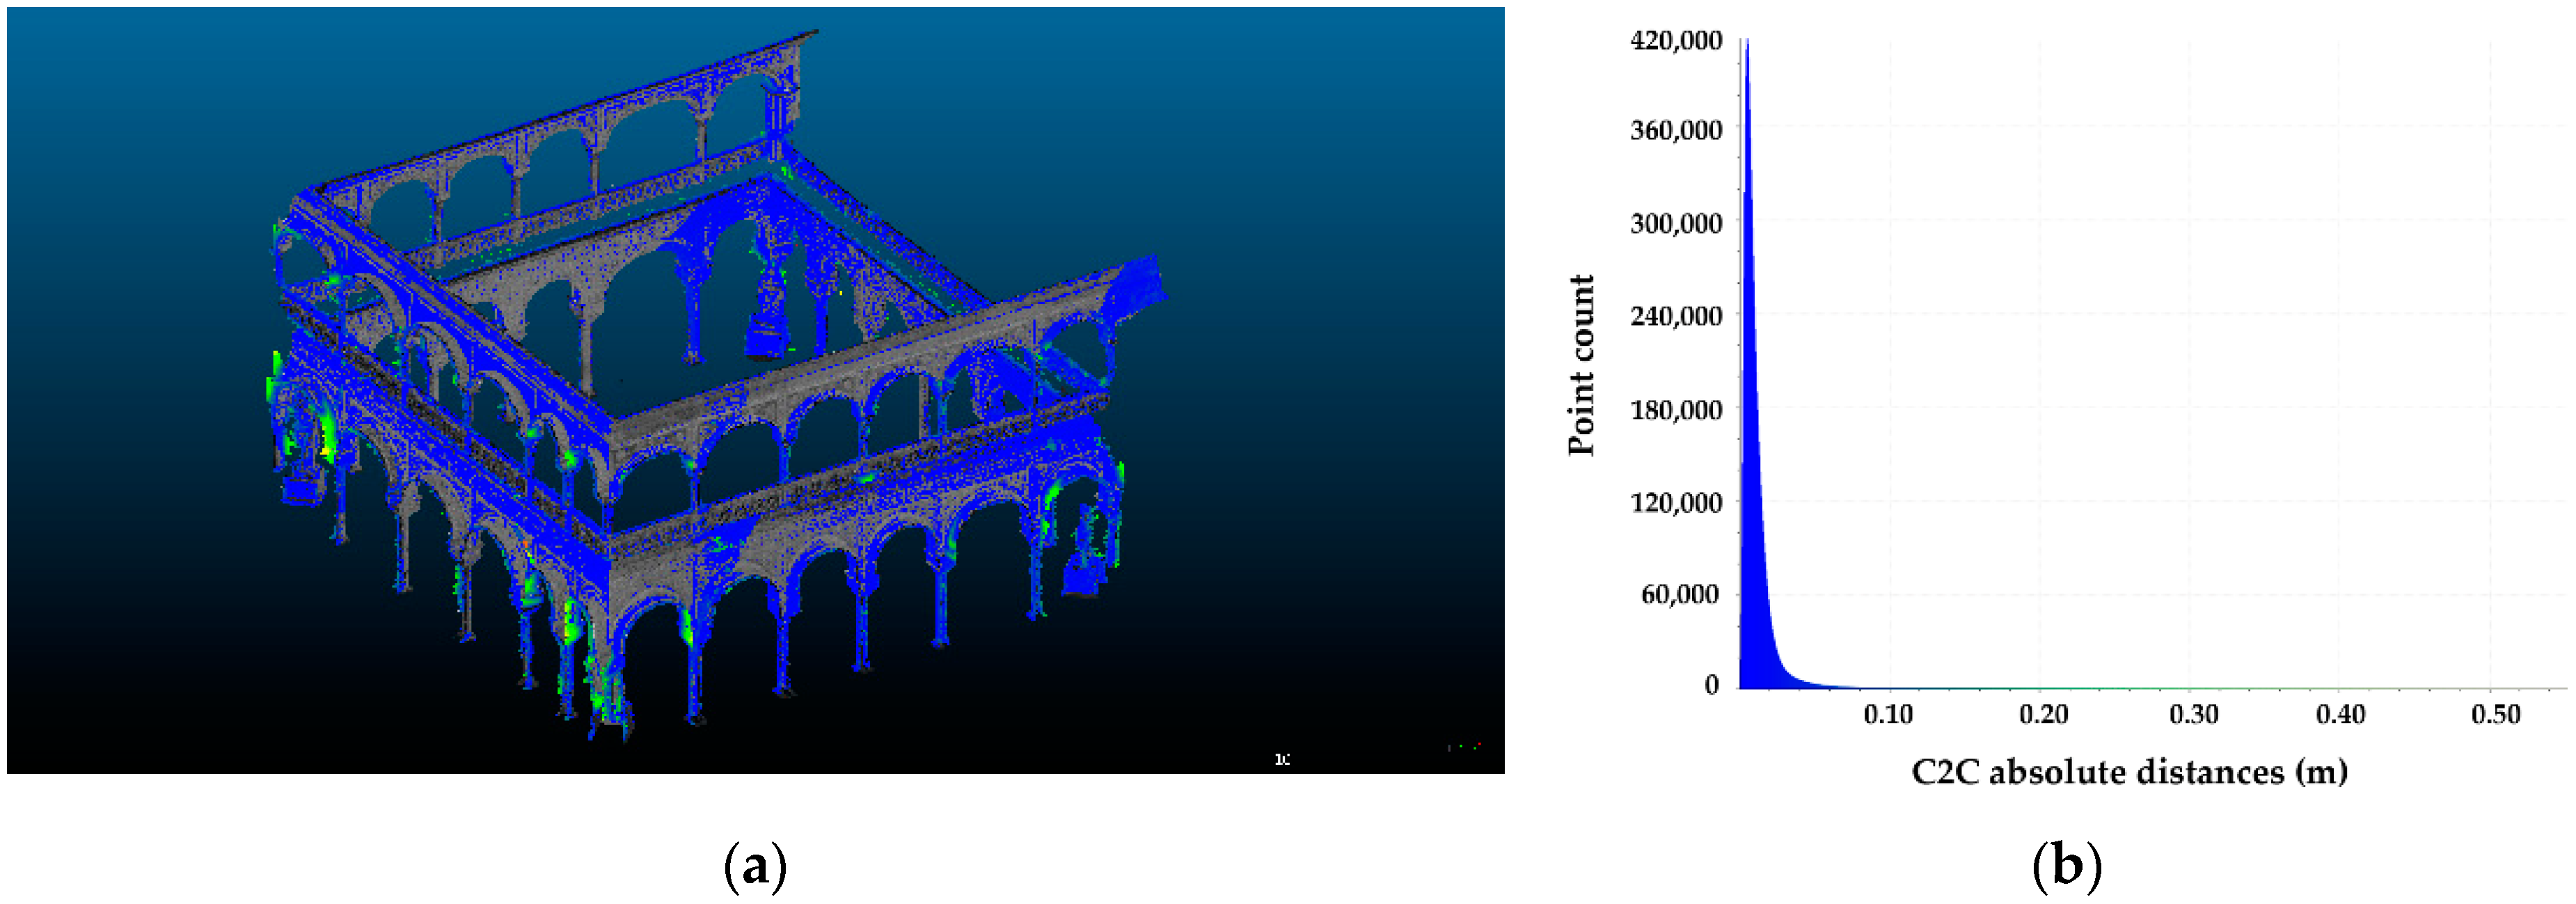
Once the SfM point cloud data was obtained and previously scaled with measurements taken in PhotoScan software, it was aligned with the TLS data by selecting pairs of common points between these two point clouds in CloudCompare. The four point pairs (R0-A0, R1-A1, R2-A2 y R3-A3) were located on three column capitals in the courtyard’s arcades, with errors of 0.56; 1.30; 0.82 and 0.64 m, respectively, and a final RMS of 0.88 m. Subsequently, the Iterative Closest Point (ICP) algorithm was applied to try to automatically optimise the alignment. The algorithm is based on a search for pairs of adjacent points in the two data sets and then the transformation parameters between them are calculated [81,87]. The TLS point cloud was the reference in the alignment, with a final RMS of 0.13 m. The geometric deviation was then calculated through cloud-to-cloud distance in CloudCompare, which computes the distance from each point, in this case, in the SfM cloud to its nearest point in the TLS cloud. The distances are shown in the abscissa axis, and the ordinate axis indicates the number of points. Significant deviation was revealed in Survey A between both data capture techniques (Figure 7).
This point cloud deviation is due to the fact that the photographs were taken without considering separate shooting by individual arcades. Thus, the 3D model was generated in a single, continuous process without control points. The lack of alignment of the SfM software in creating a square interior space (the courtyard) and the poor alignment of the SfM series produced these expected errors.
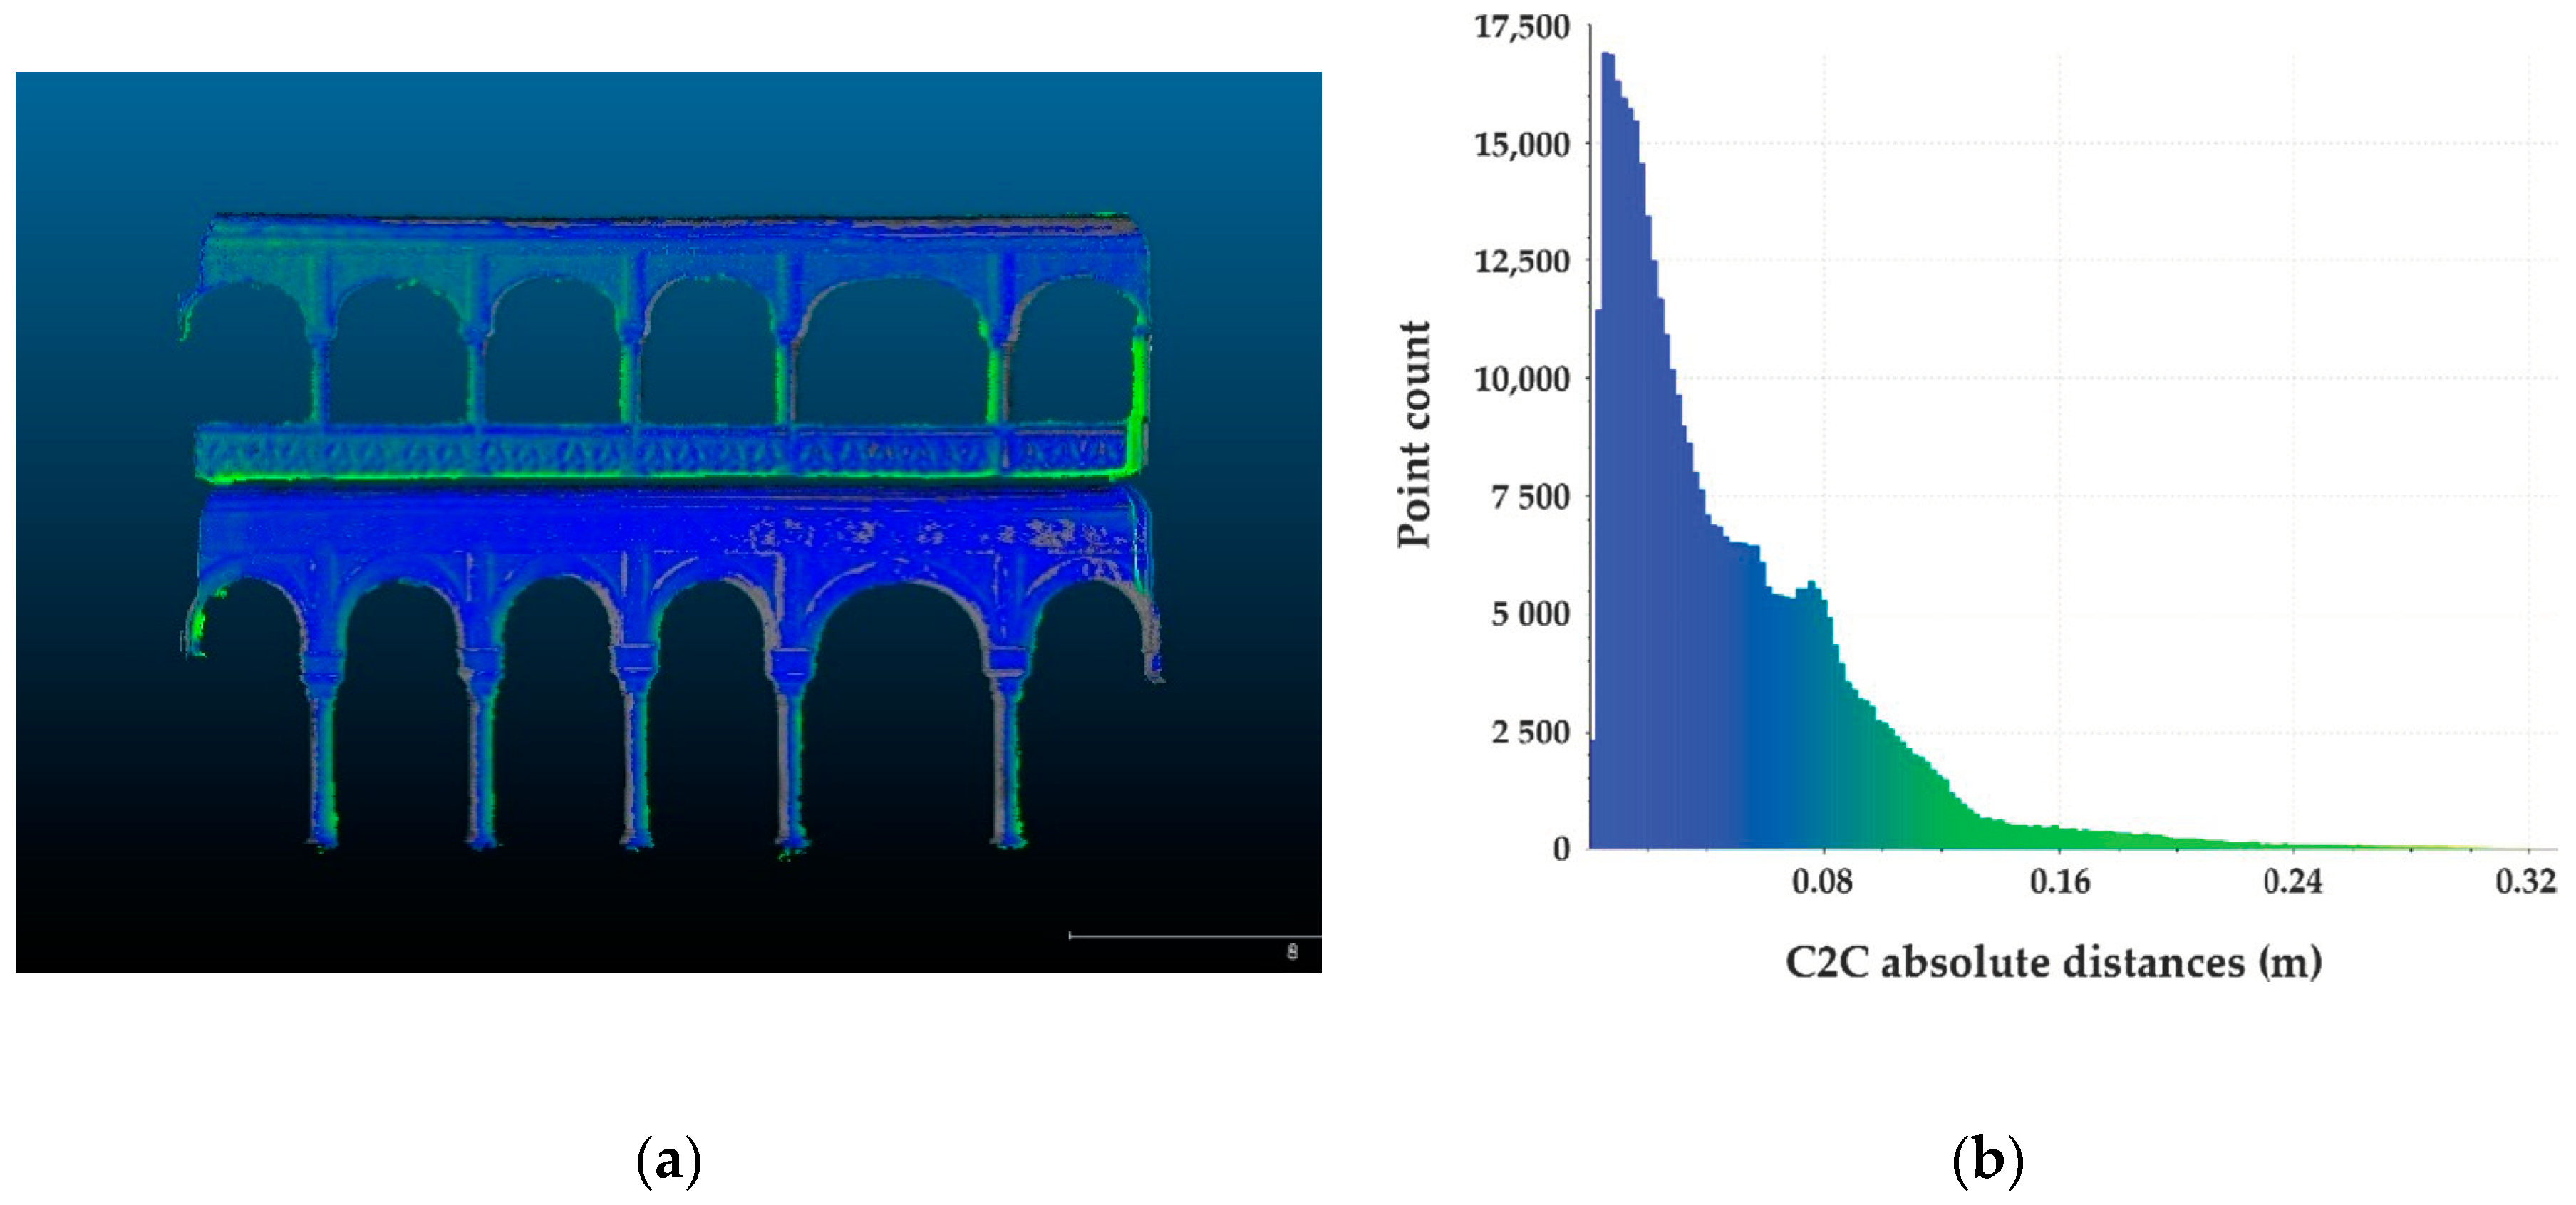
Figure 8 shows the SfM and TLS point clouds for the southeast arcade and the deviation histogram.
The mean distances, errors and standard deviation values between TLS and SfM point cloud data are shown in Table 3.
The distance between both datasets for each arcade in the Casa de Pilatos courtyard were calculated in order to identify the elements influencing the way the photographs are taken for subsequent modelling. The parameters studied were the root mean square (RMS) error, the minimum and maximum distances between the point clouds, the average distance, the standard deviation and the estimated standard error in metres. According to Antón et al. [88], the deviation between similar objects presents two main characteristics: The high presence of points in the zero value with respect to the rest of the distance intervals and the high standard deviation, which can be calculated as per the formulae given by Arias et al. [89] (Equation (1)) of the points along those intervals.
σ = 1 n 1 i = 1 n ( x i x ¯ ) 2
where n is the sample size, x i are the points in the intervals and   x ¯ is the average sample value.

3.2. Survey B

In this survey, the work was systematised in four different processes, one for each façade of the courtyard. The photographs were arranged in three consecutive series according to Figure 9, where the camera used has a rotating head tripod. The total number of photographs is 175. Aerial photographs were not taken in this case, because they were considered unnecessary for BIM. As for Survey A, 80% overlap between adjacent photographs was taken into account. The images were processed using PhotoScan parameters similar to those used for Survey A, and the additional control points measured for Survey B.
The alignment procedure is carried out taking the control points shown in Figure 10. A total station was used to create the reference system as in Figure 2. The resulting dense point cloud contains 1,658,794 vertexes.
As for Survey A, CloudCompare is used to calculate the geometric deviation between the SfM and the TLS point clouds. Figure 11 shows the alignment of the SfM and the TLS point clouds of Survey B, as well as the comparison histogram.
Once the SfM and the TLS data were aligned, both global point clouds of the patio were manually segmented in CloudCompare in order to extract the façades individually, so that the deviation between each façade’s (SfM and TLS) points could be separately computed (Table 4).
The mean distances, errors and standard deviation values between TLS and SfM point cloud data are shown in Table 4.
In order to ascertain the accuracy of the SfM results, the distances of the geo-referenced real points were compared with the points of the transformed point cloud. Pairs of points obtained using the total station were chosen. As is well known in the scientific community, it is not possible to achieve 100% accuracy by any means [16]. Table 5 shows in absolute values of accuracy that can be achieved by the two experimental campaigns obtained from the processing report, using the NIKON D80 camera with 2896 × 1944 pixels resolution and 18 mm focal length.
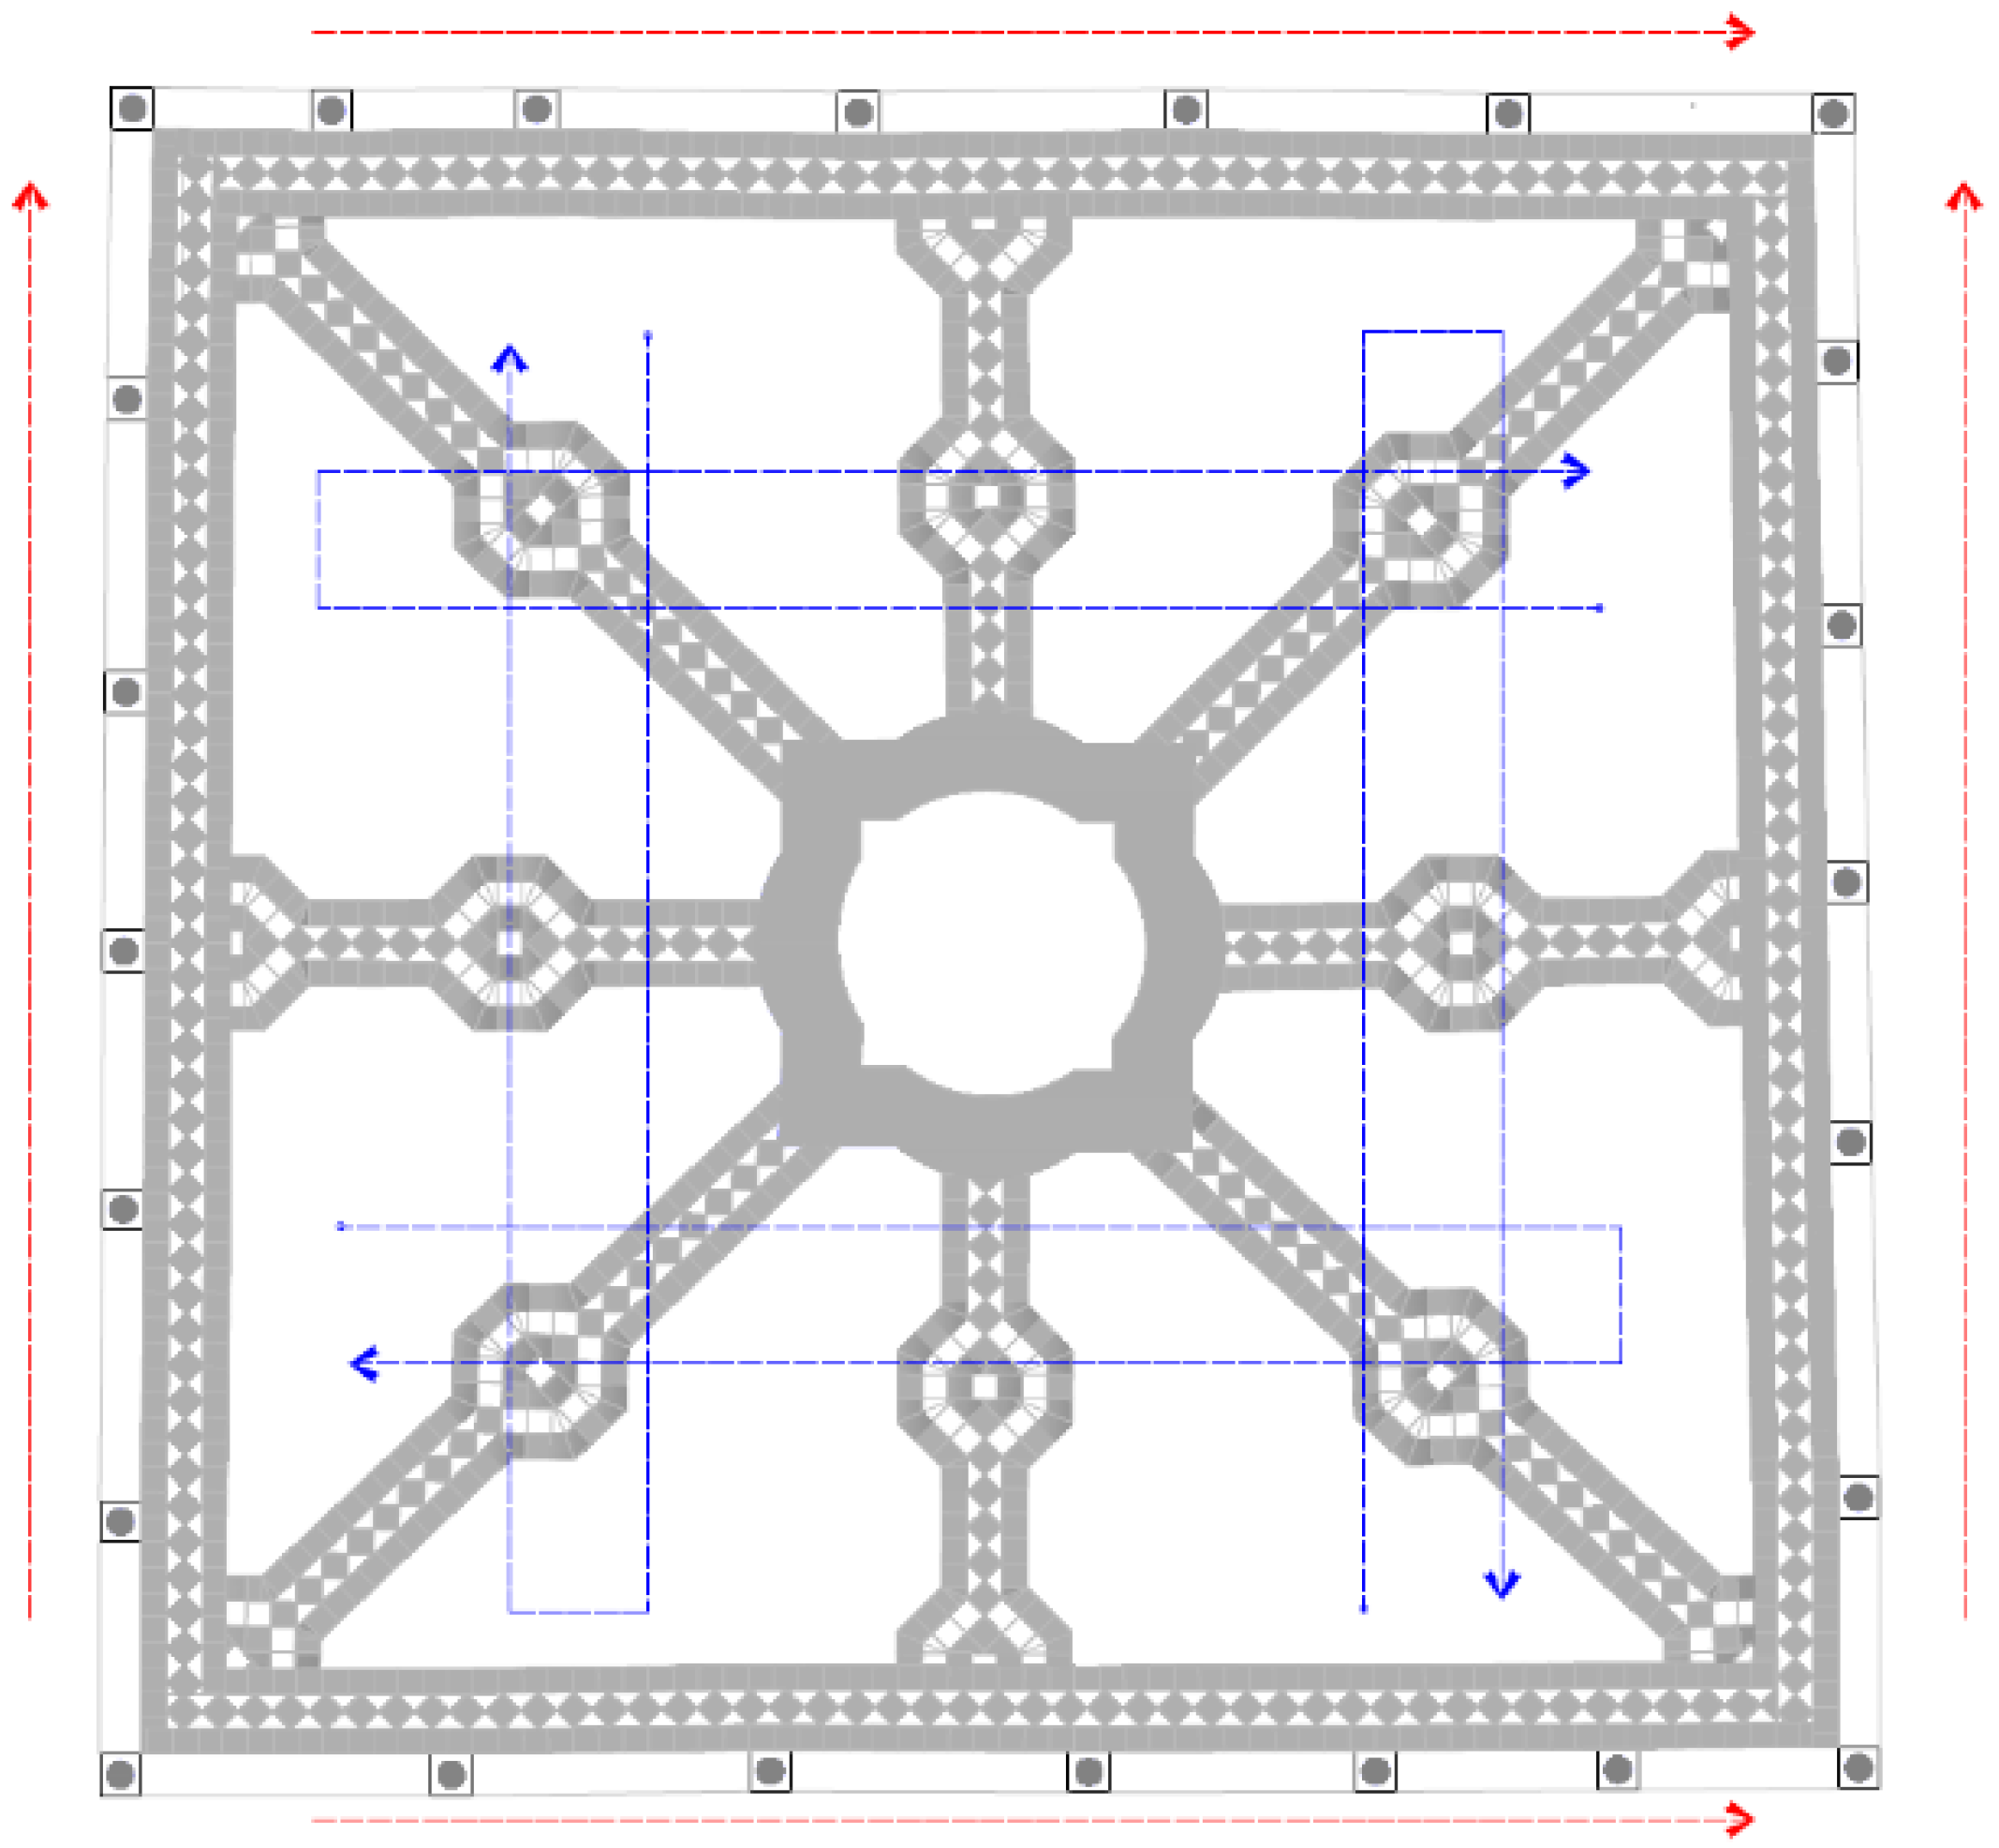
The photogrammetric sequence productivity was also measured in this research. To do this, the photogrammetric series of Surveys A and B were taken into consideration. Whereas Survey A was conducted on the ground floor level by means of divergent image capture, Survey B was carried out on a two-floor basis (from the ground floor and the second floor) by following the directions in Figure 12.
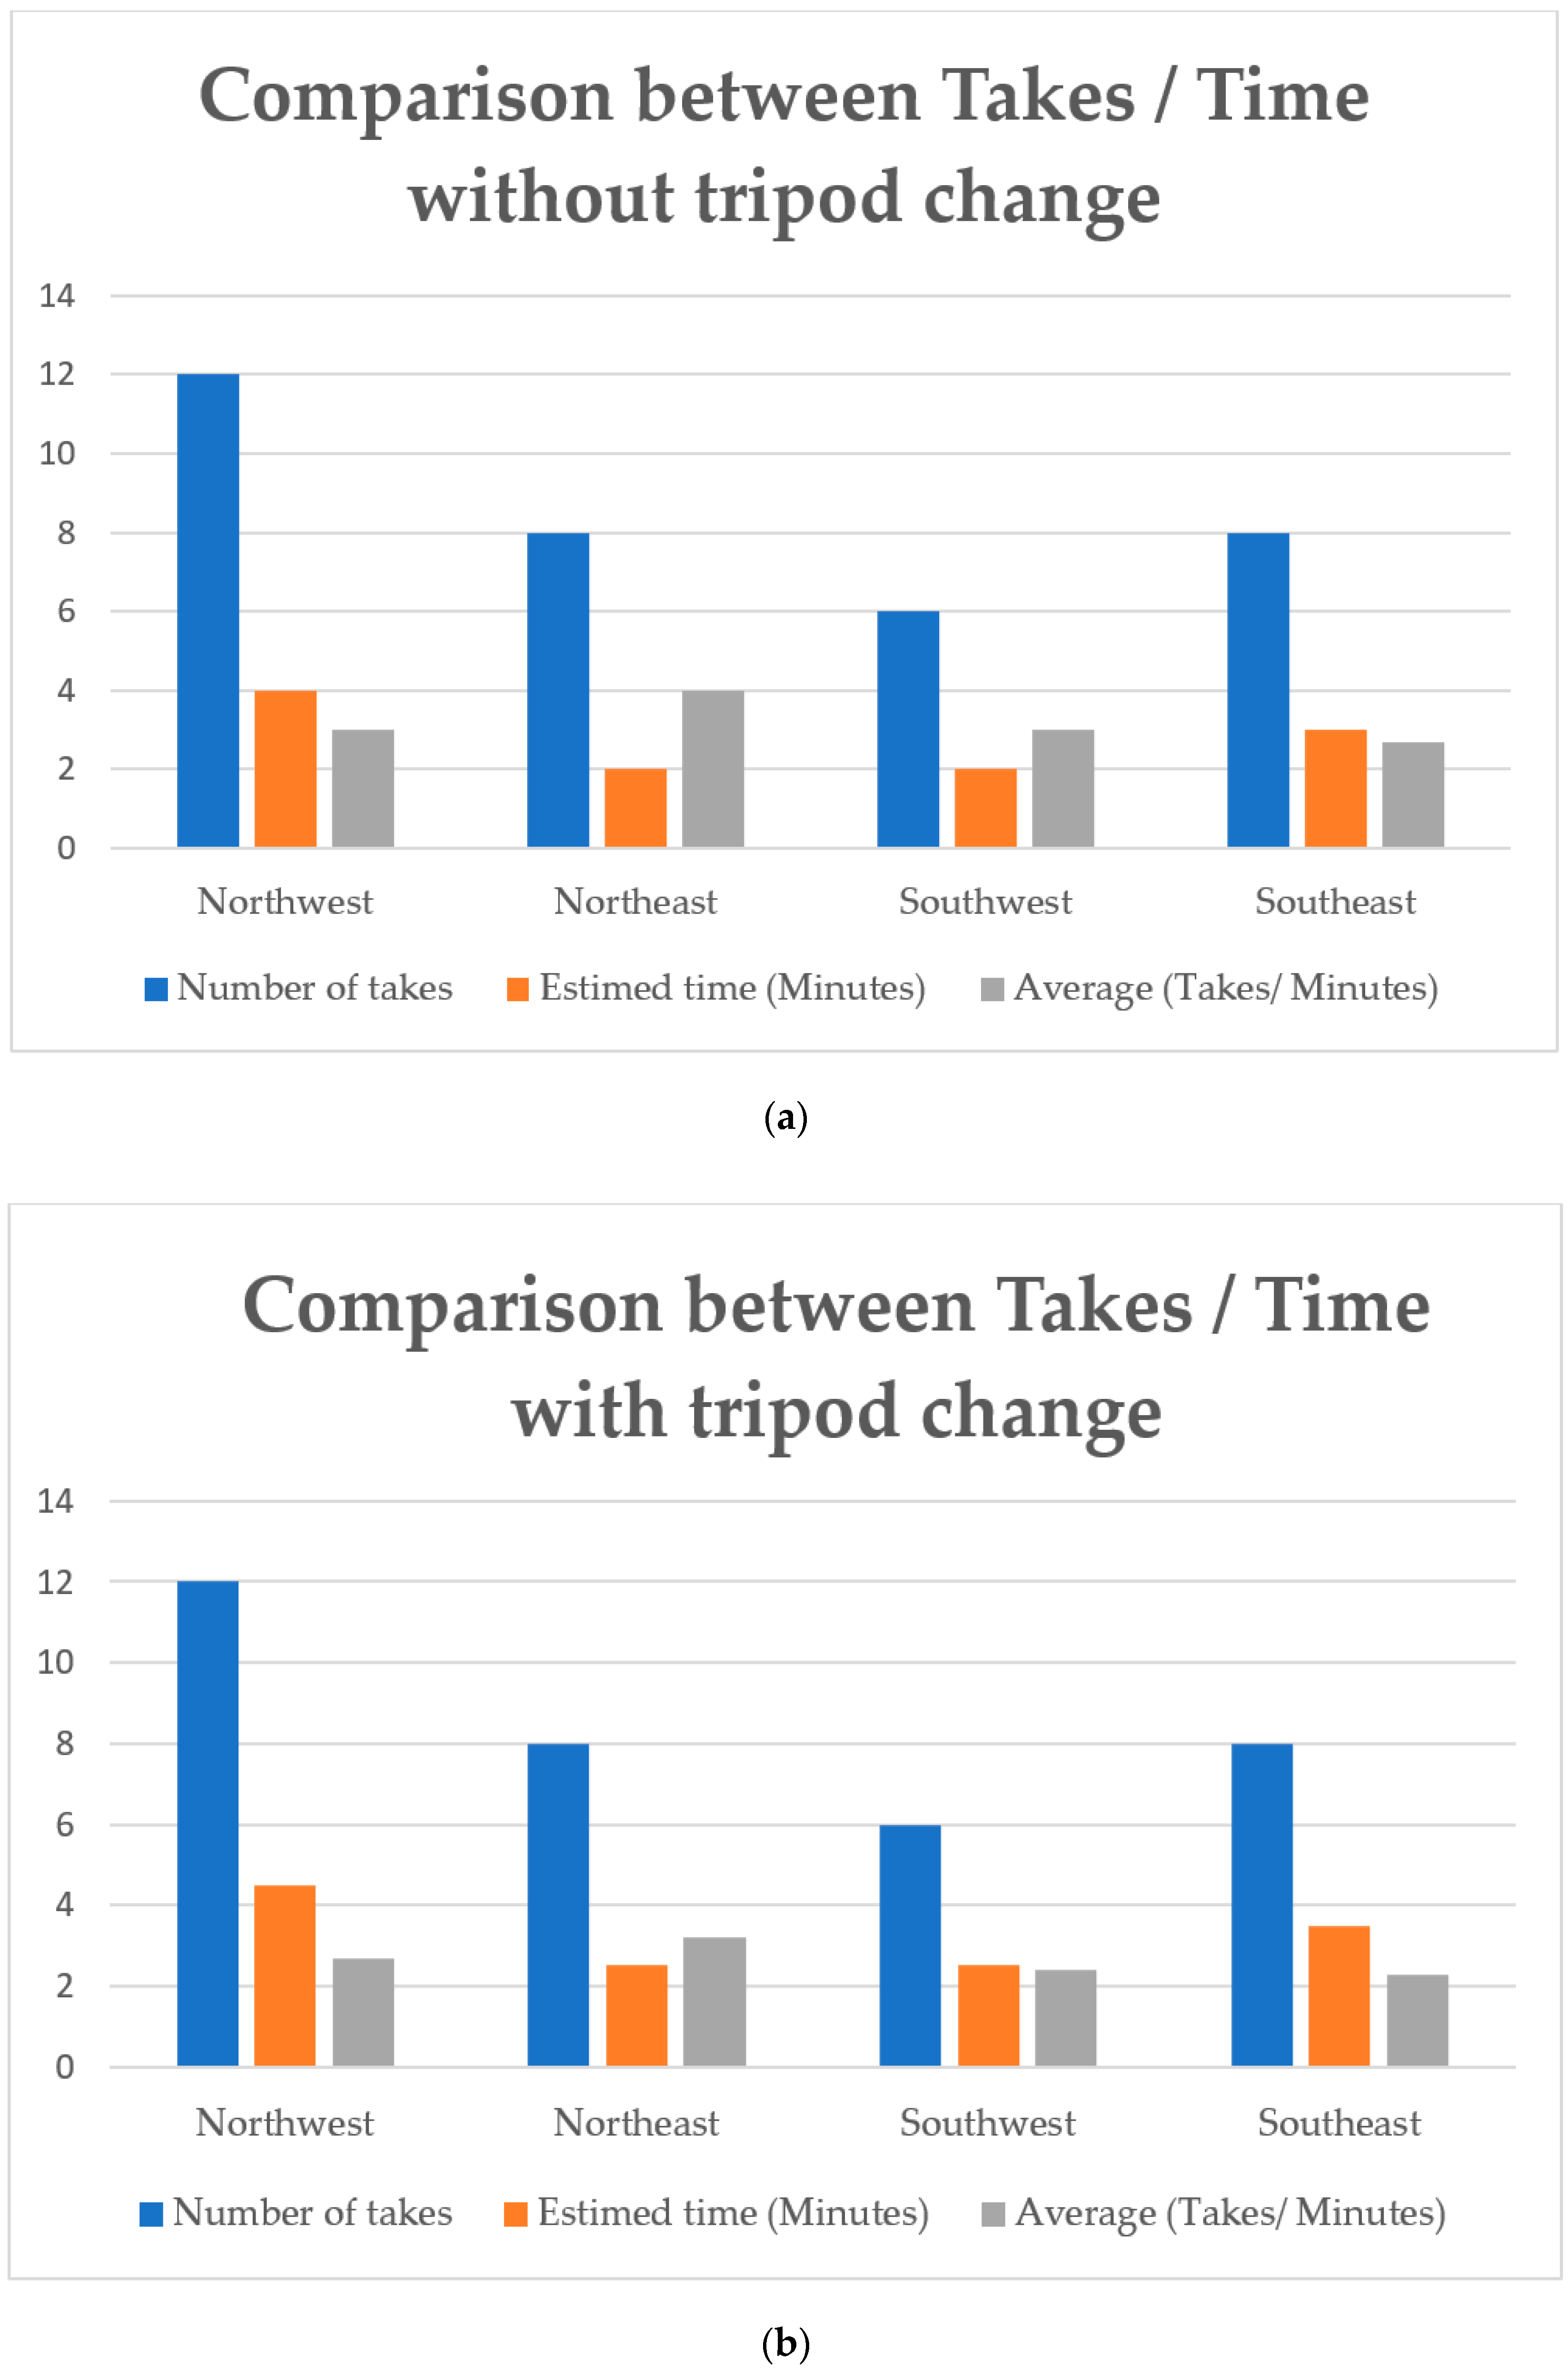
The time for each series in the different façades and their number of shots are shown below (Figure 13, Figure 14 and Figure 15). In Survey A, 44 shots of the ground floor gallery were taken in 13 min, and the 52 shots of the second-floor gallery needed 18 min (96 shots and 31 min in total). Three takes in Survey A and eight takes in Survey B were repeated photographs. In Survey B, 167 shots were taken in 41.5 min. The same tripod was used in each series for both the ground floor and the top floor galleries. Figure 13, Figure 14 and Figure 15 aim at determining the difference between using a tripod and the time the process could take without it. When using a camera with stabiliser control, the recording time decreases and there is no need for a tripod, but the latter is actually recommended to obtain precise geometric data [89].

4. Discussion

The effectiveness and accuracy of the data acquisition techniques are debated in the scientific literature on photogrammetry applied to large-scale buildings and the applicability of TLS. From Table 1 regarding the accuracy of both techniques SfM and TLS, Teza et al. [11] stated that they are qualitatively similar and that the relative differences in morphology are lower than 10–20%. This disagrees with the data proposed by Sapirstein [52], who stated that the model analysed yielded more accurate results than could be expected from a mid-range laser scanner. This author reviewed the scientific literature on the accuracies of SfM/MVS and analysed the errors by considering the object, the scene size and the accuracy for small objects. The results revealed a minimal accuracy error, whilst it increased considerably for large surfaces. The largest surface analysed in an archaeological site using SfM control points was 25 × 35 m [57]. 7 scale bars were considered in Survey A to increase the size of the model. The accuracy (average distance) achieved in the most unfavourable façade was 124 mm. However, Doneus et al. [50] analysed a smaller area for vertex positions of MVS meshes (in a 10 metres profile), and achieved 20 mm error. The work by Sapirstein [52] in the Temple of Olympia (25 × 55 m) achieved 1:16000 relative accuracy and 2–3 mm accuracy using photogrammetry for both digitisation and 3D reconstruction. Barazzetti et al. [91,92] worked with high-resolution panoramic images to achieve satisfactory results for 3D modelling in architecture.
For Survey A, no control points are set and the photographs are taken in a continuous process, which has greater difficulty in reconstructing the 3D model. The image acquisition for Survey A took approximately 1 h 30 min. The Survey B is carried out through three shooting series as described in this paper. Each series is considered separately and subsequently merged. Moreover, control points through total station are used, which made the duration increase to 5 h—a full work session. The results show standard deviation values between 0.01 and 0.0010 m. The maximum value is similar to the results by Koutsoudis et al. [64], and the minimum value is similar to the studies by Remondino et al. [66]. In order to determine the alignment fit between series, the reprojection error distribution was studied. This error is the average of all linking points between the images, and is the basis of the 3D point reconstruction procedure. The reprojection error is the geometric error corresponding to the Euclidean image distance between a projected 3D point and the marked points based off the GCPs locations [93], and according to [54] it is the Euclidean distance between a manually or automatically measured image point and the back-projected position of the corresponding 3D point in the same image. Other studies highlighted the importance of these results [42] in the photogrammetric accuracy. The data obtained in Surveys A (0.416 px) and B (0.408 px) are similar. A high reprojection error usually indicates poor localisation accuracy of the corresponding point at the point-matching step [94].
The profile comparison between the frieze meshes produced from SfM and TLS data in Survey A yields dispersion values of up to 120 mm for the northeast façade. Moreover, the deviation can reach unacceptable values of up to 300 mm in other façades. From the distribution analysis of the camera positions according to Figure 6, it is found a direct relationship between the number of shots and the deviation of points in space. For the northwest façade, the standard deviation of 0.07 m could be acceptable, and it is similar to the values achieved by Green et al. [16], Remondino et al. [8] and Verdiani et al. [14], according to Table 1.
The better arrangement and the greater overlap of the photographs imply an average distance of 0.0838 below 57% of the coinciding points for the northwest façade (please refer to the column “Average distance (m)” in Table 3 for the values achieved in Survey A). This means that approximately 60% of the points are below 9 cm, which would imply acceptable results for English Heritage guidelines [95] and for the creation of BIM. Next, the northeast and southeast façades show relatively high deviation values. The southwest façade reaches unacceptable values, but this is mainly due to the lack of photographs in the second level, as the building only has a ground floor level in that part.
It is found that the correlation in the number of photographs is important, and that the alignment of the ground floor and top-floor shooting series is good. In Survey B, an arrangement of the series is conducted as in Figure 5. There is a negligible deviation (2 mm or 1:88,000) in the ground floor frieze (17.679 m width) of the northeast façade between SfM and TLS. This value (relative accuracy) is slightly lower than those achieved by Sapirstein [52]. The data analysis of the courtyard yields standard deviation values of 0.0593 for Survey A and 0.0055 for Survey B.
Concerning the limitations of the study, the methodology used to compare TLS and SfM demonstrates the effectiveness of photogrammetry when the shooting series are planned and supported by control points. While the series in Survey A were recorded in two different levels in order to cover all the elements in the arcades, the series of Survey B were recorded from the ground floor level. This fact may have influenced the results by improving the accuracy of Survey B. Moreover, it is well known that photogrammetry is nowadays one of the most used technologies to produce point clouds. Thus, the comparison method and software used in this research are the most widespread in the scientific community. The photogrammetric processing is limited by the algorithms currently available on the market. In addition, an exhaustive assessment of the impact of the use of RAW and JPG formats on the 3D model quality could be carried out.
Concerning the sequence productivity (time needed to take the photographs of each series), also addressed in this paper, the results reveal a difference of 10.5 min between Surveys A and B. In both surveys, the façade from which the works started (northeast) entailed the greatest number of photographs and, consequently, required more time. When weighing two relevant factors in 3D surveying such as time and deviation error, further point-cloud-to-HBIM reverse engineering would benefit from a time reduction of 25 min for the accuracy achieved in Survey B.

5. Conclusions

In this research, the accuracy of SfM in large-scale buildings is evaluated in relation to TLS through two surveys: Firstly, considering the camera position in a survey of less than 1 h and 30 min; secondly, a more accurate and longer survey with total station control points to enhance the 3D reconstruction —a full work session. In this research, the lack of GCPs in the survey affects the geometric deviation between SfM and TLS. According to Koutsoudis et al. [64], multiple parameters are influenced by adequate lighting, the algorithm used and the recording of control points, which improves the accuracy of the SfM data, as seen in this research article. For the northwest façade in Survey A, the standard deviation (0.0576) m could be admissible depending on the purpose for which the photogrammetric model is used. Therefore, we agree with Sapirstein [52] on that photogrammetry is a complex process, where the error varies depending on the implementation. Thus, it would be necessary to establish what is the purpose of photogrammetry: To be a recording and measuring tool to create archaeological or building models with multiple decorative and/or structural deformations; to be the digital basis of their 3D reconstruction models; or, on the other hand, to be a means to generate a Heritage/Historic Building Information Model (HBIM). Therefore, the usefulness of SfM for HBIM becomes an interesting topic in the scientific community in the field nowadays. In this sense, the suitability of the SfM measurements for HBIM, particularly regarding parameters and errors, is discussed. The error of 2–3 mm for a 17 metre frieze in this research, the courtyard of Casa de Pilatos, is higher than the error of 2 mm for 30 metres length found in the scientific literature. However, it should be noted that the measurement system establishes the initial parameters of the study. The accuracy obtained in this work (1:8000) is lower than that given by Sapirstein [52], who achieved accuracies of 1:16,000 with fixed lenses, but authors such as Green et al. [16], Remondino et al. [8] and Verdiani et al. [14] achieved accuracies lower than 1:700, which imply significant deviations, similar to those obtained in the northwest façade of Survey A in this paper. Therefore, the study carried out in Casa de Pilatos shows that an appropriate planning of the photogrammetric survey with stable parameters and no control points in large-scale areas yields admissible accuracies for HBIM.
This type of survey is low cost and reduces the time to approximately 30% in comparison with the normal duration. The difference and the alignments of the series in photogrammetry are two of the most interesting issues that should be studied in depth, as well as the independent processes for each façade, since these aspects would entail greater reliability in courtyards like those in Seville, where the series are shot inversely in relation to the object.
The results obtained in this research through the analysis of the ground floor friezes show that the use of pre-established control points reveals that the photogrammetry is an accurate data acquisition technique. Consequently, the Scan-to-BIM methodology can benefit from it to create parametric objects in the diverse BIM platforms, since Garagnani and Manferdini [95] indicate that automatic procedures of complex geometries are not yet resolved. Once the accuracy is calculated in this research, the workflow from the data acquisition to BIM could be analysed in the future with regards to limitations and effectiveness. In this research, while the case study is a rectangular two-floor courtyard, other shapes of the Sevillian architecture could have been addressed, e.g., the case study by Ippoliti et al. [51], where the complexity of the place due to its height entails revising the photogrammetric procedures. Nevertheless, future research on the relationship between the camera positions and the shooting series could shed light on the parameters affecting SfM in interior spaces of heritage architecture.

Author Contributions

Conceptualisation, J.M.; Methodology, E.C. and J.E.N.-J.; Software, D.A., E.C. and N.S.; Validation, J.E.N.-J. and D.A.; Formal Analysis, D.A. and N.S.; Investigation, D.A. and N.S.; Resources, D.A.; Data Curation, D.A. and E.C.; Writing—Original Draft Preparation, J.M., D.A. and D.B.-H.; Writing—Review & Editing, J.M., D.A. and D.B.-H.; Visualisation, D.A. and J.E.N.-J.; Supervision, J.M., D.A. and D.B.-H.; Project Administration, J.M.; Funding Acquisition, D.A. and J.M. All authors have read and agreed to the published version of the manuscript.

Funding

This research was funded by Universidad de Sevilla through VI Plan Propio de Investigación y Transferencia (VIPPIT) grant number CONV-822 and PP2018-10628, and PEJUS Marco del Programa de Garantía Juvenil de la Universidad de Sevilla—Empleo Joven 2/2017.

Acknowledgments

Thanks to the Administration of Casa de Pilatos for providing access to the building.

Conflicts of Interest

The authors declare no conflict of interest. The funders had no role in the design of the study; in the collection, analyses, or interpretation of data; in the writing of the manuscript, or in the decision to publish the results.

Data Availability Statement

All data, models, and code generated or used during the study appear in the submitted article.

Abbreviations

TLSTerrestrial Laser Scanning
SfMStructure-from-Motion
CIPAInternational Committee of Architectural Photogrammetry
ICOMOSInternational Council on Monuments and Sites
ISPRSInternational Society of Photogrammetry and Remote Sensing
BIMBuilding Information Modelling
HBIMHistorical Building Information Modelling
UAVUnmanned Aerial Vehicle
HDRHigh Dynamic Range
RMSRoot-Mean-Square
MVSMulti-view Stereo
GSDsGround Sampling Distance
GCPsGround Control Points
Symbols
The following symbols are used in this manuscript:
fFocal distance
wSensor width
WWidth of the view at distance H
HDistance from camera to object
σStandard deviation
nSample size
x, yObserved values
x ¯ Mean value

References

  1. Remondino, F. Heritage recording and 3D modeling with photogrammetry and 3D scanning. Remote Sens. 2011, 3, 1104–1138. [Google Scholar] [CrossRef] [Green Version]
  2. Poux, F.; Neuville, R.; Van Wersch, L.; Nys, G.-A.; Billen, R.; Poux, F.; Neuville, R.; Van Wersch, L.; Nys, G.-A.; Billen, R. 3D Point Clouds in Archaeology: Advances in Acquisition, Processing and Knowledge Integration Applied to Quasi-Planar Objects. Geosciences 2017, 7, 96. [Google Scholar] [CrossRef] [Green Version]
  3. Guarnieri, A.; Remondino, F.; Vettore, A. Digital Photogrammetry and Tls Data Fusion Applied To Cultural Heritage 3D Modeling. Int. Arch. Photogramm. Remote Sens. Spat. Inform. Sci. 2006, 36, 1–6. [Google Scholar]
  4. Lambers, K.; Remondino, F. Optical 3D measurement techniques in archaeology: Recent developments and applications. In Proceedings of the Computer Applications and Quantitative Methods in Archaeology (CAA), Berlin, Germany, 2–6 April 2007; pp. 27–35. [Google Scholar]
  5. Castellano Román, M. Generación de un modelo de información del patrimonio inmueble en el momento de su protección jurídica. EGA. Rev. Expresión Gráfica Arquit 2015, 20, 266. [Google Scholar] [CrossRef] [Green Version]
  6. Bienvenido-Huertas, D.; Nieto-Julián, J.E.; Moyano, J.J.; Macías-Bernal, J.M.; Castro, J. Implementing Artificial Intelligence in H-BIM Using the J48 Algorithm to Manage Historic Buildings. Int. J. Archit. Herit. 2019, 14, 1148–1160. [Google Scholar] [CrossRef]
  7. Antón, D.; Pineda, P.; Medjdoub, B.; Iranzo, A. As-built 3D heritage city modelling to support numerical structural analysis: Application to the assessment of an archaeological remain. Remote Sens. 2019, 11, 1276. [Google Scholar] [CrossRef] [Green Version]
  8. Remondino, F.; Del Pizzo, S.; Kerten, T.; Troisi, S. Low-Cost and Open-Source Solutions for Automated Image Orientation—A Critical Overview. In Progress in Cultural Heritage Preservation; Springer: Berlin/Heidelberg, Germany, 2012. [Google Scholar]
  9. Fassi, F.; Fregonese, L.; Ackermann, S.; De Troia, V. Comparison between laser scanning and automated 3D modelling techniques to reconstruct complex and extensive cultural heritage areas. Int. Arch. Photogramm. Remote Sens. Spat. Inf. Sci. 2013, XL-5/W1, 73–80. [Google Scholar] [CrossRef] [Green Version]
  10. Remondino, F.; Spera, M.G.; Nocerino, E.; Menna, F.; Nex, F.; Gonizzi-Barsanti, S. Dense image matching: Comparisons and analyses. In Proceedings of the 2013 Digital Heritage International Congress (DigitalHeritage), Marseille, France, 28 October–1 November 2013; pp. 47–54. [Google Scholar]
  11. Teza, G.; Pesci, A.; Ninfo, A. Morphological Analysis for Architectural Applications: Comparison between Laser Scanning and Structure-from-Motion Photogrammetry. J. Surv. Eng. 2016, 142, 04016004. [Google Scholar] [CrossRef]
  12. Koutsoudis, A.; Vidmar, B.; Arnaoutoglou, F. Performance evaluation of a multi-image 3D reconstruction software on a low-feature artefact. J. Archaeol. Sci. 2013, 40, 4450–4456. [Google Scholar] [CrossRef]
  13. Riveiro, B.; Caamaño, J.C.; Arias, P.; Sanz, E. Photogrammetric 3D modelling and mechanical analysis of masonry arches: An approach based on a discontinuous model of voussoirs. Autom. Constr. 2011, 20, 380–388. [Google Scholar] [CrossRef]
  14. Verdiani, G.; Braghiroli, A. The Ancient Fragment Collection at the Museo Archeologico in Florence, Italy, a Digital Proposal to Allow Its Acces. In Progress in Cultural Heritage Preservation; Springer: Berlin/Heidelberg, Germany, 2012; pp. 461–468. [Google Scholar]
  15. Roncella, R.; Re, C.; Forlani, G. Performance Evaluation of a Structure and Motion Strategy in Architecture and Cultural Heritage. Int. Arch. Photogramm. Remote Sens. Spat. Inf. Sci. 2012, XXXVIII-5/W16, 285–292. [Google Scholar] [CrossRef] [Green Version]
  16. Green, S.; Bevan, A.; Shapland, M. A comparative assessment of structure from motion methods for archaeological research. J. Archaeol. Sci. 2014, 46, 173–181. [Google Scholar] [CrossRef]
  17. Abbas, M.A.; Setan, H.; Majid, Z.; Chong, A.K.; Idris, K.M.; Aspuri, A. Calibration and Accuracy Assessment of Leica ScanStation C10 Terrestrial Laser Scanner. In Lecture Notes in Geoinformation and Cartography; Springer: Berlin/Heidelberg, Germany, 2013; pp. 33–47. [Google Scholar]
  18. Abbas, M.A.; Setan, H.; Majid, Z.; Lichti, D.D.; Chong, A.K. A self-calibration of the Leica ScanStation C10 scanner. In Proceedings of the 2013 IEEE Business Engineering and Industrial Applications Colloquium (BEIAC), Kuala Lumpur. Malaysia, 22–25 September 2013; pp. 262–266. [Google Scholar]
  19. Genta, G.; Minetola, P.; Barbato, G. Calibration procedure for a laser triangulation scanner with uncertainty evaluation. Opt. Lasers Eng. 2016, 86, 11–19. [Google Scholar] [CrossRef]
  20. Son, S.; Park, H.; Lee, K.H. Automated laser scanning system for reverse engineering and inspection. Int. J. Mach. Tools Manuf. 2002, 42, 889–897. [Google Scholar] [CrossRef]
  21. Gong, Z.; Wen, C.; Wang, C.; Li, J. A Target-Free Automatic Self-Calibration Approach for Multibeam Laser Scanners. IEEE Trans. Instrum. Meas. 2018, 67, 238–240. [Google Scholar] [CrossRef]
  22. Gašparović, M.; Malarić, I. Increase of readability and accuracy of 3D models using fusion of close range photogrammetry and laser scanning. Int. Arch. Photogramm. Remote Sens. Spat. Inf. Sci. 2012, XXXIX-B5, 93–98. [Google Scholar] [CrossRef] [Green Version]
  23. Yu, C.; Chen, X.; Xi, J. Modeling and Calibration of a Novel One-Mirror Galvanometric Laser Scanner. Sensors 2017, 17, 164. [Google Scholar] [CrossRef] [Green Version]
  24. Mukupa, W.; Roberts, G.W.; Hancock, C.M.; Al-Manasir, K. A review of the use of terrestrial laser scanning application for change detection and deformation monitoring of structures. Surv. Rev. 2017, 49, 99–116. [Google Scholar] [CrossRef]
  25. Baraccani, S.; Silvestri, S.; Gasparini, G.; Palermo, M.; Trombetti, T.; Silvestri, E.; Lancellotta, R.; Capra, A. A Structural Analysis of the Modena Cathedral. Int. J. Archit. Herit. 2016, 10, 235–253. [Google Scholar] [CrossRef]
  26. Pesci, A.; Teza, G.; Bonali, E.; Casula, G.; Boschi, E. A laser scanning-based method for fast estimation of seismic-induced building deformations. ISPRS J. Photogramm. Remote Sens. 2013, 79, 185–198. [Google Scholar] [CrossRef]
  27. Shen, Y.; Wang, J.; Lindenbergh, R.; Hofland, B.G.; Ferreira, V. Range Image Technique for Change Analysis of Rock Slopes Using Dense Point Cloud Data. Remote Sens. 2018, 10, 1792. [Google Scholar] [CrossRef] [Green Version]
  28. Xu, H.; Li, H.; Yang, X.; Qi, S.; Zhou, J. Integration of Terrestrial Laser Scanning and NURBS Modeling for the Deformation Monitoring of an Earth-Rock Dam. Sensors 2018, 19, 22. [Google Scholar] [CrossRef] [PubMed] [Green Version]
  29. Vezočnik, R.; Ambrožič, T.; Sterle, O.; Bilban, G.; Pfeifer, N.; Stopar, B. Use of Terrestrial Laser Scanning Technology for Long Term High Precision Deformation Monitoring. Sensors 2009, 9, 9873–9895. [Google Scholar] [CrossRef] [PubMed]
  30. Cortés-Sánchez, M.; Riquelme-Cantal, J.A.; Simón-Vallejo, M.D.; Parrilla Giráldez, R.; Odriozola, C.P.; Calle Román, L.; Carrión, J.S.; Monge Gómez, G.; Rodríguez Vidal, J.; Moyano Campos, J.J.; et al. Pre-Solutrean rock art in southernmost Europe: Evidence from Las Ventanas Cave (Andalusia, Spain). PLoS ONE 2018, 13, e0204651. [Google Scholar] [CrossRef] [Green Version]
  31. Lerma, J.L.; Navarro, S.; Cabrelles, M.; Villaverde, V. Terrestrial laser scanning and close range photogrammetry for 3D archaeological documentation: The Upper Palaeolithic Cave of Parpalló as a case study. J. Archaeol. Sci. 2010, 37, 499–507. [Google Scholar] [CrossRef]
  32. Pérez Zapata, C. Estudio Comparativo de Sistemas para la Adquisición de Datos Métricos en Rehabilitación. In Proceedings of the CD-ROM Libro de Actas I Jornada Nacional de Investigación en la Edificación, Madrid, Spain, 5 October–5 November 2007; pp. 1–12. [Google Scholar]
  33. Ding, Y.; Zheng, X.; Zhou, Y.; Xiong, H.; Gong, J. Low-Cost and Efficient Indoor 3D Reconstruction Through Annotated Hierarchical Structure-from-Motion. Remote Sens. 2018, 11, 58. [Google Scholar] [CrossRef] [Green Version]
  34. Furukawa, Y.; Curless, B.; Seitz, S.M.; Szeliski, R. Reconstructing building interiors from images. In Proceedings of the 2009 IEEE 12th International Conference on Computer Vision, Kyoto, Japan, 27 September–4 October 2009; pp. 80–87. [Google Scholar]
  35. Molero Alonso, B.; Barba, S.; Álvaro Tordesillas, A. Documentación del patrimonio cultural. Método basado en la fusión de técnicas fotogramétricas y de escaneado óptico de triangulación. EGA. Rev. expresión gráfica Arquit. 2016, 21, 236. [Google Scholar] [CrossRef] [Green Version]
  36. Kersten, T.P.; Lindstaedt, M. Image-Based Low-Cost Systems for Automatic 3D Recording and Modelling of Archaeological Finds and Objects. In Progress in Cultural Heritage Preservation; Springer: Berlin/Heidelberg, Germany, 2012; pp. 1–10. [Google Scholar]
  37. Chiabrando, F.; Nex, F.; Piatti, D.; Rinaudo, F. UAV and RPV systems for photogrammetric surveys in archaelogical areas: Two tests in the Piedmont region (Italy). J. Archaeol. Sci. 2011, 38, 697–710. [Google Scholar] [CrossRef]
  38. Colomina, I.; Molina, P. Unmanned aerial systems for photogrammetry and remote sensing: A review. ISPRS J. Photogramm. Remote Sens. 2014, 92, 79–97. [Google Scholar] [CrossRef] [Green Version]
  39. Haala, N. The Landscape of Dense Image Matching Algorithms. Photogramm. Week 2013 2013, 271–284. [Google Scholar]
  40. Nex, F.; Remondino, F. UAV for 3D mapping applications: A review. Appl. Geomatics 2014, 6, 1–15. [Google Scholar] [CrossRef]
  41. Nikolakopoulos, K.G.; Soura, K.; Koukouvelas, I.K.; Argyropoulos, N.G. UAV vs. classical aerial photogrammetry for archaeological studies. J. Archaeol. Sci. Reports 2017, 14, 758–773. [Google Scholar] [CrossRef]
  42. Barba, S.; Barbarella, M.; Di Benedetto, A.; Fiani, M.; Gujski, L.; Limongiello, M. Accuracy Assessment of 3D Photogrammetric Models from an Unmanned Aerial Vehicle. Drones 2019, 3, 79. [Google Scholar] [CrossRef] [Green Version]
  43. Kraus, K. Photogrammetry: Geometry from Images and Laser Scans, 2nd ed.; De Gruyter: Vienna, Austria, 2007. [Google Scholar]
  44. Agüera-Vega, F.; Carvajal-Ramírez, F.; Martínez-Carricondo, P. Accuracy of digital surface models and orthophotos derived from unmanned aerial vehicle photogrammetry. J. Surv. Eng. 2017, 143, 04016025. [Google Scholar] [CrossRef]
  45. Harwin, S.; Lucieer, A. Assessing the Accuracy of Georeferenced Point Clouds Produced via Multi-View Stereopsis from Unmanned Aerial Vehicle (UAV) Imagery. Remote Sens. 2012, 4, 1573–1599. [Google Scholar] [CrossRef] [Green Version]
  46. Pádua, L.; Adão, T.; Hruška, J.; Marques, P.; Sousa, A.; Morais, R.; Lourenço, J.M.; Sousa, J.J.; Peres, E. UAS-based photogrammetry of cultural heritage sites: A case study addressing Chapel of Espírito Santo and photogrammetric software comparison. In Proceedings of the ACM International Conference Proceeding Series, Osaka, Japan, 6–8 January 2018; pp. 72–76. [Google Scholar]
  47. Snavely, N.; Seitz, S.M.; Szeliski, R. Modeling the world from Internet photo collections. Int. J. Comput. Vis. 2008, 80, 189–210. [Google Scholar] [CrossRef] [Green Version]
  48. Pollefeys, M.R.K.; Gool, L.V. Realistic Surface Reconstruction of 3{D} Scenes from Uncalibrated Image Sequences. J. Vis. Comput. Animat. 2000, 11, 115–127. [Google Scholar] [CrossRef]
  49. Reu, J.; Plets, G.; Verhoeven, G.; Smedt, P.; Bats, M.; Cherretté, B.; Maeyer, W.; Deconynck, J.; Herremans, D.; Laloo, P.; et al. Towards a three-dimensional cost-effective registration of the archaeological heritage. J. Archaeol. Sci. 2013, 40, 1108–1121. [Google Scholar] [CrossRef]
  50. Doneus, M.; Verhoeven, G.; Fera, M.; Briese, C.; Kucera, M.; Neubauer, W. From Deposit to Point Cloud—A Study of Low-Cost Computer Vision Approaches for the Straightforward Documentation of Archaeological Excavations. Geoinformatics FCE CTU 2011, 6, 81–88. [Google Scholar] [CrossRef] [Green Version]
  51. Ippoliti, E.; Meschini, A.; Sicuranza, F. Structure from motion systems for architectural heritage. A survey of the internal loggia courtyard of palazzo dei capitani, ascoli piceno, italy. Int. Arch. Photogramm. Remote Sens. Spat. Inf. Sci. ISPRS Arch. 2015, 40, 53–60. [Google Scholar] [CrossRef] [Green Version]
  52. Sapirstein, P. Accurate measurement with photogrammetry at large sites. J. Archaeol. Sci. 2016, 66, 137–145. [Google Scholar] [CrossRef]
  53. Fraser, C.S.; Brown, D.C. Industrial Photogrammetry: New developments and recent applications. Photogramm. Rec. 2006, 12, 197–217. [Google Scholar] [CrossRef]
  54. Remondino, F.; Nocerino, E.; Toschi, I.; Menna, F. A critical review of automated photogrammetric processing of large datasets. In Proceedings of the International Archives of the Photogrammetry, Remote Sensing and Spatial Information Sciences—ISPRS, Ottawa, ON, Canada, 28 August–1 September 2017; Volume XLII-2-W5, pp. 591–599. [Google Scholar]
  55. Dai, S.-L.; Lin, H.; Ge, S.S. Scheduling-and-Control Codesign for a Collection of Networked Control Systems With Uncertain Delays. IEEE Trans. Control Syst. Technol. 2010, 18, 66–78. [Google Scholar] [CrossRef]
  56. De Reu, J.; De Clercq, W.; De Smedt, P.; Laloo, P.; Van Meirvenne, M.; Herremans, D. On introducing an image-based 3D reconstruction method in archaeological excavation practice. J. Archaeol. Sci. 2013, 41, 251–262. [Google Scholar] [CrossRef]
  57. Olson, B.R.; Placchetti, R.A.; Quartermaine, J.; Killebrew, A.E. The Tel Akko Total Archaeology Project (Akko, Israel): Assessing the suitability of multi-scale 3D field recording in archaeology. J. Field Archaeol. 2013, 38, 244–262. [Google Scholar] [CrossRef]
  58. Dellepiane, M.; Lindgren, S.; Callieri, M.; Scopigno, R.; Dellepiane, M. Archeological excavation monitoring using dense stereo matching techniques. J. Cult. Herit. 2012, 14, 201–210. [Google Scholar] [CrossRef]
  59. Martínez, S.; Ortiz, J.; Gil, M.L. Geometric documentation of historical pavements using automated digital photogrammetry and high-density reconstruction algorithms. J. Archaeol. Sci. 2015, 53, 1–11. [Google Scholar] [CrossRef]
  60. Lerma, J.L.; Muir, C. Evaluating the 3D documentation of an early Christian upright stone with carvings from Scotland with multiples images. J. Archaeol. Sci. 2014, 46, 311–318. [Google Scholar] [CrossRef]
  61. Jennings, A.; Black, J. Texture-Based Photogrammetry Accuracy on Curved Surfaces. AIAA J. 2012, 50, 1060–1071. [Google Scholar] [CrossRef]
  62. Barazzetti, L.; Mussio, L.; Remondino, F.; Scaioni, M. Targetless Camera Calibration. ISPRS Int. Arch. Photogramm. Remote Sens. Spat. Inf. Sci. 2012, XXXVIII-5/W16, 335–342. [Google Scholar] [CrossRef] [Green Version]
  63. Fraser, C.S.; Woods, A.; Brizzi, D. Hyper redundancy for accuracy enhancement in automated close range photogrammetry. Photogramm. Rec. 2005, 20, 205–217. [Google Scholar] [CrossRef]
  64. Koutsoudis, A.; Vidmar, B.; Ioannakis, G.; Arnaoutoglou, F.; Pavlidis, G.; Chamzas, C. Multi-image 3D reconstruction data evaluation. J. Cult. Herit. 2014, 15, 73–79. [Google Scholar] [CrossRef]
  65. Remondino, F.; Baltsavias, E.; El-Hakim, S.; Picard, M.; Grammatikopoulos, L. Image-Based 3D Modeling of the Erechteion, Acropolis of Athens. Int. Arch. Photogramm. Remote Sens. Spat. Inf. Sci. 2008, 37, 1083–1092. [Google Scholar]
  66. Remondino, F.; Girardi, S.; Rizzi, A.; Gonzo, L. 3D modeling of complex and detailed cultural heritage using multi-resolution data. J. Comput. Cult. Herit. 2009, 2, 1–20. [Google Scholar] [CrossRef]
  67. Bernal, A.A. El origen de la Casa de Pilatos de Sevilla. 1483–1505. Atrio. Rev. Hist. Arte 2011, 17, 133–172. [Google Scholar]
  68. Lleó Cañal, V. La Casa de Pilatos. Actes Colloquie Tenue Tours 1994, 6, 181–192. [Google Scholar]
  69. Geosystems Leica Geosystems. Leica FlexLine TS02/TS06/TS09 User Manual. 2008. Available online: https://leica-geosystems.com/ (accessed on 16 March 2020).
  70. Krishnan, J.V.G.; Manoharan, N.; Rani, B.S. Estimation of Distance to Texture Surface Using Complex Log Mapping. J. Comput. Appl. 2010, 3, 16. [Google Scholar]
  71. Campos, M.; Tommaselli, A.; Ivánová, I.; Billen, R. Data Product Specification Proposal for Architectural Heritage Documentation with Photogrammetric Techniques: A Case Study in Brazil. Remote Sens. 2015, 7, 13337–13363. [Google Scholar] [CrossRef] [Green Version]
  72. Sanz-Ablanedo, E.; Chandler, J.; Rodríguez-Pérez, J.; Ordóñez, C. Accuracy of Unmanned Aerial Vehicle (UAV) and SfM Photogrammetry Survey as a Function of the Number and Location of Ground Control Points Used. Remote Sens. 2018, 10, 1606. [Google Scholar] [CrossRef] [Green Version]
  73. Agisoft LLC. 11 Degtyarniy per., St. Petersburg, Russia, 191144. 2006. Available online: https://www.agisoft.com/about/ (accessed on 18 March 2020).
  74. Leachtenauer, J.C.; Driggers, R.G. Surveillance and Reconnaissance Imaging Systems: Modeling and Performance Prediction; Artech House: Norwood, MA, USA, 2001. [Google Scholar]
  75. Gonçalves, J.A.; Henriques, R. UAV photogrammetry for topographic monitoring of coastal areas. ISPRS J. Photogramm. Remote Sens. 2015, 104, 101–111. [Google Scholar] [CrossRef]
  76. Szeliski, R. Computer Vision: Algorithms and Applications; Springer: Berlin/Heidelberg, Germany, 2010. [Google Scholar]
  77. Wang, H.; Li, J.; Wang, L.; Guan, H.; Geng, Z. Automated mosaicking of UAV images based on SFM method. In Proceedings of the International Geoscience and Remote Sensing Symposium (IGARSS), Quebec, QC, Canada, 13–18 July 2014; pp. 2633–2636. [Google Scholar]
  78. Sanz-Ablanedo, E.; Rodríguez-Pérez, J.R.; Armesto, J.; Taboada, M.F.Á. Geometric Stability and Lens Decentering in Compact Digital Cameras. Sensors 2010, 10, 1553–1572. [Google Scholar] [CrossRef] [PubMed] [Green Version]
  79. Geosystems, L. Leica ScanStation C10. Available online: http://w3.leica-geosystems.com/downloads123/hds/hds/scanstation c10/brochures-datasheet/leica_scanstation_c10_ds_en.pdf (accessed on 16 March 2020).
  80. Moon, D.; Chung, S.; Kwon, S.; Seo, J.; Shin, J. Comparison and utilization of point cloud generated from photogrammetry and laser scanning: 3D world model for smart heavy equipment planning. Autom. Constr. 2019, 98, 322–331. [Google Scholar] [CrossRef]
  81. Geosystems, L. Leica Cyclone REGISTER 360-3D Laser Scanning Point Cloud Registration Software; Leica Geosystems AG: Heerbrugg, Switzerland, 2018. [Google Scholar]
  82. Daniel Girardeau-Montaut, D. CloudCompare: 3D Point Cloud and Mesh Processing Software. Open Source Project 2016. Available online: https://www.danielgm.net/index.php (accessed on 9 May 2019).
  83. Kazhdan, M.; Hoppe, H. Screened poisson surface reconstruction. ACM Trans. Graph. 2013, 32, 1–13. [Google Scholar] [CrossRef] [Green Version]
  84. Robert McNeel & Associates Rhinoceros. Available online: https://www.rhino3d.com/ (accessed on 27 March 2020).
  85. Stamatopoulos, C.; Fraser, C.S. Automated target-free network orientation and camera calibration. ISPRS Ann. Photogramm. Remote Sens. Spat. Inf. Sci. 2014, 2, 339–346. [Google Scholar] [CrossRef] [Green Version]
  86. Rajendra, Y.D.; Mehrotra, S.C.; Kale, K.V.; Manza, R.R.; Dhumal, R.K.; Nagne, A.D.; Vibhute, D.; Ramanujan, S.; Chair, G. Evaluation of Partially Overlapping 3D Point Cloud’s Registration by using ICP variant and CloudCompare. Int. Arch. Photogramm. Remote Sens. Spat. Inf. Sci. 2014, XL-8, 891–897. [Google Scholar] [CrossRef] [Green Version]
  87. Antón, D.; Medjdoub, B.; Shrahily, R.; Moyano, J. Accuracy evaluation of the semi-automatic 3D modeling for historical building information models. Int. J. Archit. Herit. 2018, 12, 790–805. [Google Scholar] [CrossRef] [Green Version]
  88. Arias, P.; Ordóñez, C.; Lorenzo, H.; Herraez, J. Methods for documenting historical agro-industrial buildings: A comparative study and a simple photogrammetric method. J. Cult. Herit. 2006, 7, 350–354. [Google Scholar] [CrossRef]
  89. Jalandoni, A.; Domingo, I.; Taçon, P.S.C. Testing the value of low-cost Structure-from-Motion (SfM) photogrammetry for metric and visual analysis of rock art. J. Archaeol. Sci. Reports 2018, 17, 605–616. [Google Scholar] [CrossRef]
  90. Barazzetti, L.; Fangi, G.; Remondino, F.; Scaioni, M. Automation in multi-image spherical photogrammetry for 3D architectural reconstructions. In VAST: International Symposium on Virtual Reality, Archaeology and Intelligent Cultural Heritage—Short and Project Papers; The Eurographics Association: Goslar, Germany, 2010. [Google Scholar]
  91. Barazzetti, L.; Previtali, M.; Roncoroni, F. Can we use low-cost 360 degree cameras to create accurate 3D models? Int. Arch. Photogramm. Remote Sens. Spat. Inf. Sci. 2018, XLII-2, 69–75. [Google Scholar] [CrossRef] [Green Version]
  92. Burns, J.H.R.; Delparte, D. Comparison of commercial structure-from-motion photogrammety software used for underwater three-dimensional modeling of coral reef environments. In Proceedings of the International Archives of the Photogrammetry, Remote Sensing and Spatial Information Sciences—ISPRS Archives, Wuhan, China, 18–22 September 2017; Volume 42, pp. 127–131. [Google Scholar]
  93. Tagle, X.; Zabala, S. Workflow Agisoft Photoscan for Micasense Rededge Images. 2017. Available online: https://www.researchgate.net/profile/Ximena_Tagle/publication/320134833_Workflow_Agisoft_Photoscan_for_Micasense_Rededge_images/links/59cfe795a6fdcc181ace0866/Workflow-Agisoft-Photoscan-for-Micasense-Rededge-images.pdf (accessed on 27 March 2020).
  94. McCarthy, J. Multi-image photogrammetry as a practical tool for cultural heritage survey and community engagement. J. Archaeol. Sci. 2014, 43, 175–185. [Google Scholar] [CrossRef]
  95. Garagnani, S.; Manferdini, A.M. Parametric accuracy: Building information modeling process applied to the cultural heritage preservation. Int. Arch. Photogramm. Remote Sens. Spat. Inf. Sci. 2013, 40, 87–92. [Google Scholar] [CrossRef] [Green Version]
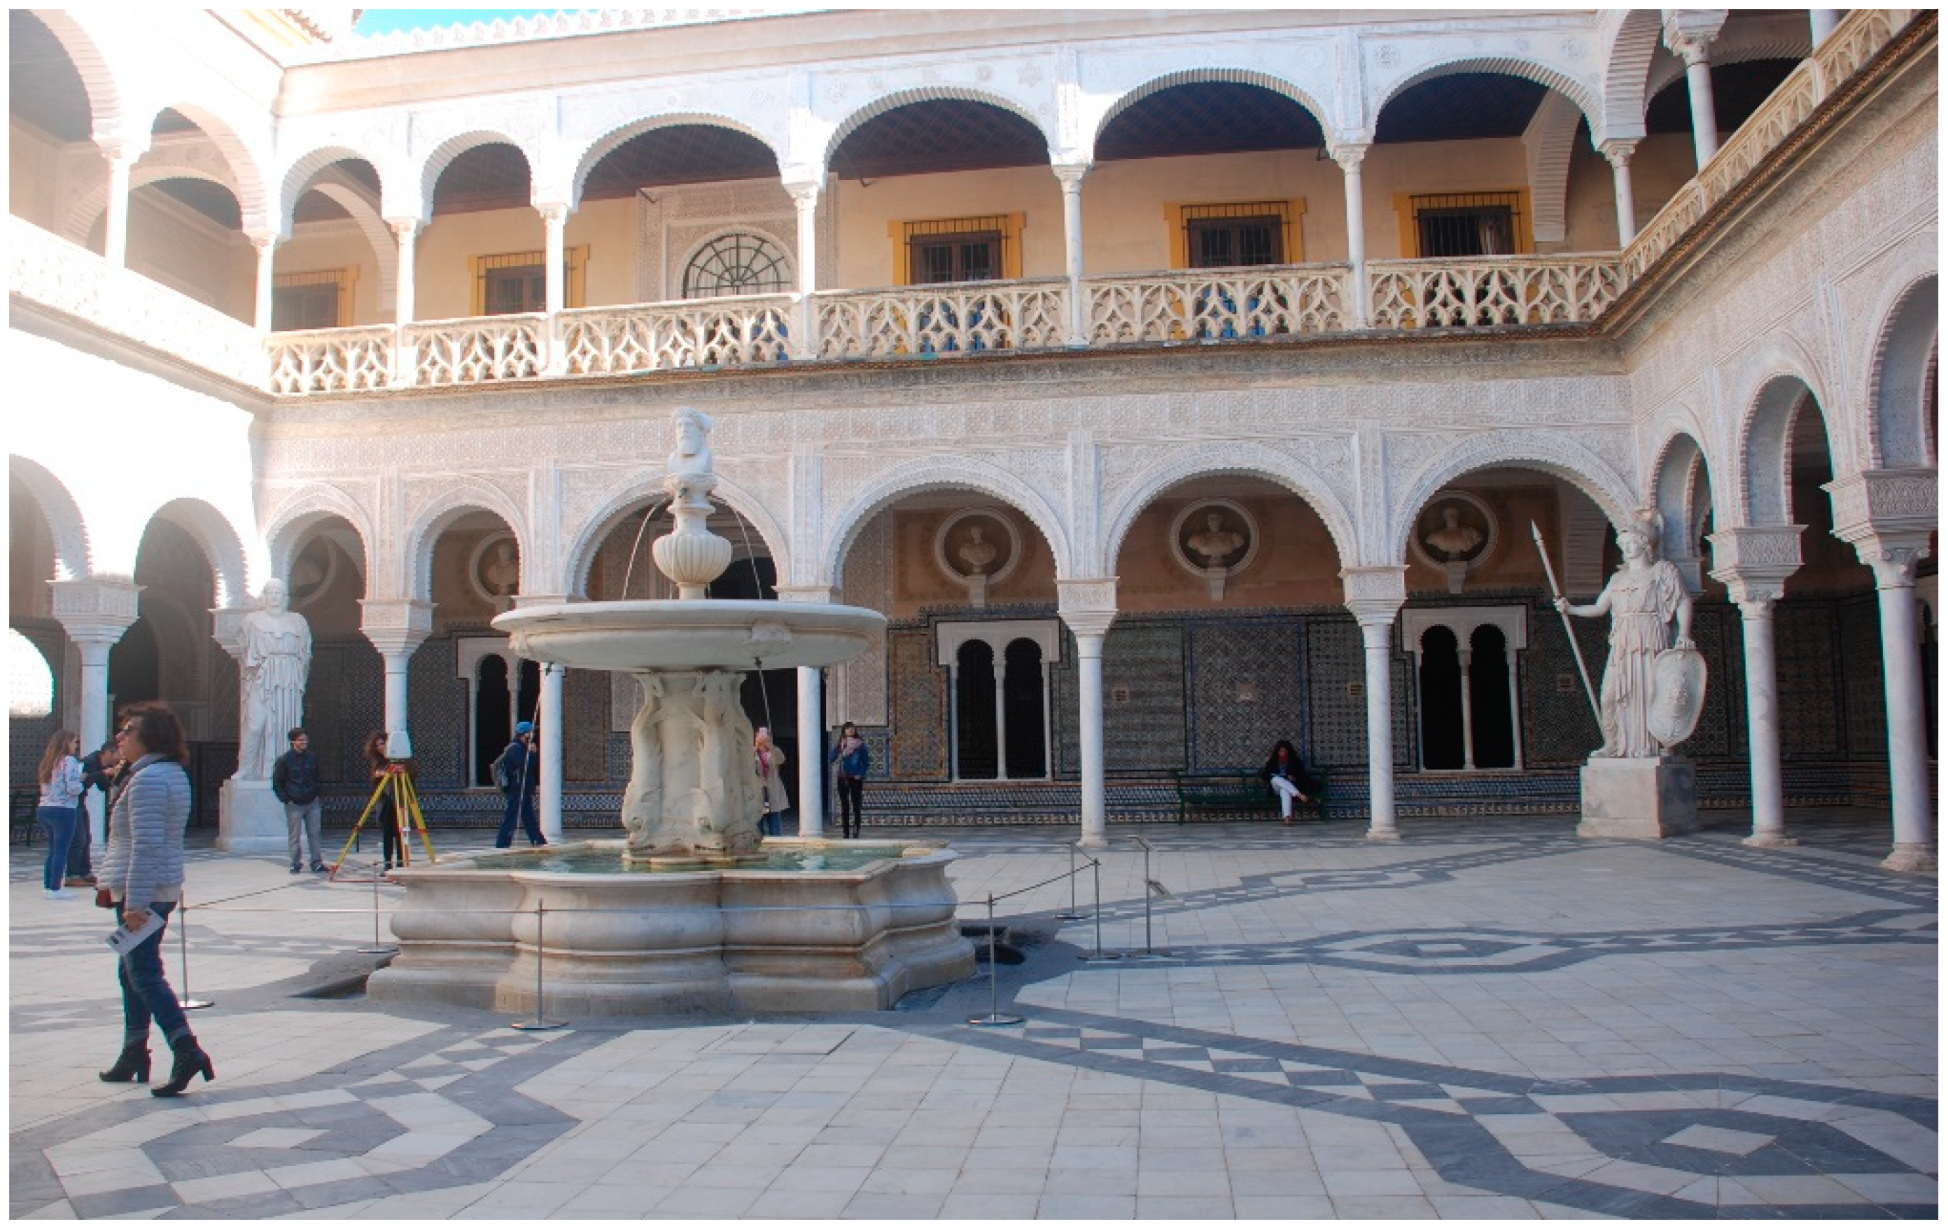
Figure 1. View of the main patio of Casa de Pilatos.
Symmetry 12 01981 g001
Figure 2. Points recorded using total station.
Symmetry 12 01981 g002
Figure 3. Maximum distance (in metres) between the camera and the object in shots from the different series in Survey B.
Symmetry 12 01981 g003
Figure 4. Meshed frieze in the northeast arcade of the courtyard of Casa de Pilatos.
Symmetry 12 01981 g004
Figure 5. Comparison between Surveys A and B, taking Terrestrial Laser Scanning (TLS) as the reference: Frieze profiles of the northeast ground floor arcade. Units: Metres (X axis) and metres (Y axis).
Symmetry 12 01981 g005
Figure 6. Survey A: Northeast arcades in PhotoScan software.
Symmetry 12 01981 g006
Figure 7. (a) Aligned Structure-from-Motion (SfM) and TLS point clouds; (b) Deviation histogram. Units: Metres (X axis) and number of points (Y axis).
Symmetry 12 01981 g007
Figure 8. (a) Aligned southeast SfM and TLS arcades; (b) Histogram Units: Metres (X axis) and number of points (Y axis).
Symmetry 12 01981 g008
Figure 9. Survey B: Northeast arcades in PhotoScan software.
Symmetry 12 01981 g009
Figure 10. Control point distribution in the northeast arcade.
Symmetry 12 01981 g010
Figure 11. (a) Aligned SfM and TLS point clouds; (b) Deviation histogram. Units: Metres (X axis) and number of points (Y axis).
Symmetry 12 01981 g011
Figure 12. Top view of the itinerary of Surveys A (blue colour) and B (red colour).
Symmetry 12 01981 g012
Figure 13. Shot taking in Survey A, ground floor gallery: (a) Without tripod change, (b) with tripod change.
Symmetry 12 01981 g013
Figure 14. Shot taking in Survey A, top floor gallery: (a) Without tripod change, (b) with tripod change.
Symmetry 12 01981 g014
Figure 15. Shot taking in Survey B: (a) Without tripod change, (b) with tripod change.
Symmetry 12 01981 g015
Table 2. Maximum distance between shots for the shooting series in Survey B.
Shooting Series H W 0.20 WGSDs (mm)
Series 16.007.861.572.71
Series 29.0011.802.364.07
Series 312.0015.733.145.42
Table 3. Deviation between the aligned SfM and TLS datasets in Survey A in metres.
Survey AStandard Deviation (σ)RMSMinimum Distance (m)Maximum Distance (m)Average Distance (m)Estimated Standard Error (m)
Northeast0.05810.110400.40440.09390.0450
Northwest0.05760.101600.40560.08380.0485
Southeast0.04220.063800.31910.04790.0412
Southwest0.05390.135000.36500.12380.0521
Table 4. Deviation between the aligned SfM and TLS datasets in Survey B in metres.
Survey BStandard Deviation (σ) (m)RMS (m)Minimum Distance (m)Maximum Distance (m)Average Distance (m)Estimated Standard Error (m)
Northeast0.01040.03140.00000.21900.00090.0551
Northwest0.00130.04530.00000.26350.00130.0537
Southeast0.00940.05400.00000.35420.00080.0541
Southwest0.00100.05590.00000.46000.00100.0565
Table 5. Accuracy results of SFM in Surveys A and B.
ResolutionPointsNº ImagesError (m)
Survey A2896 × 194421,973,146990.21339
Survey B2896 × 19441,658,7941670.00345
Publisher’s Note: MDPI stays neutral with regard to jurisdictional claims in published maps and institutional affiliations.