Architectural Graphics Research: Topics and Trends through Cluster and Map Network Analyses


Abstract
1. Introduction
2. Graphic Analysis Research
2.1. Techniques and Theories of Graphic Analysis
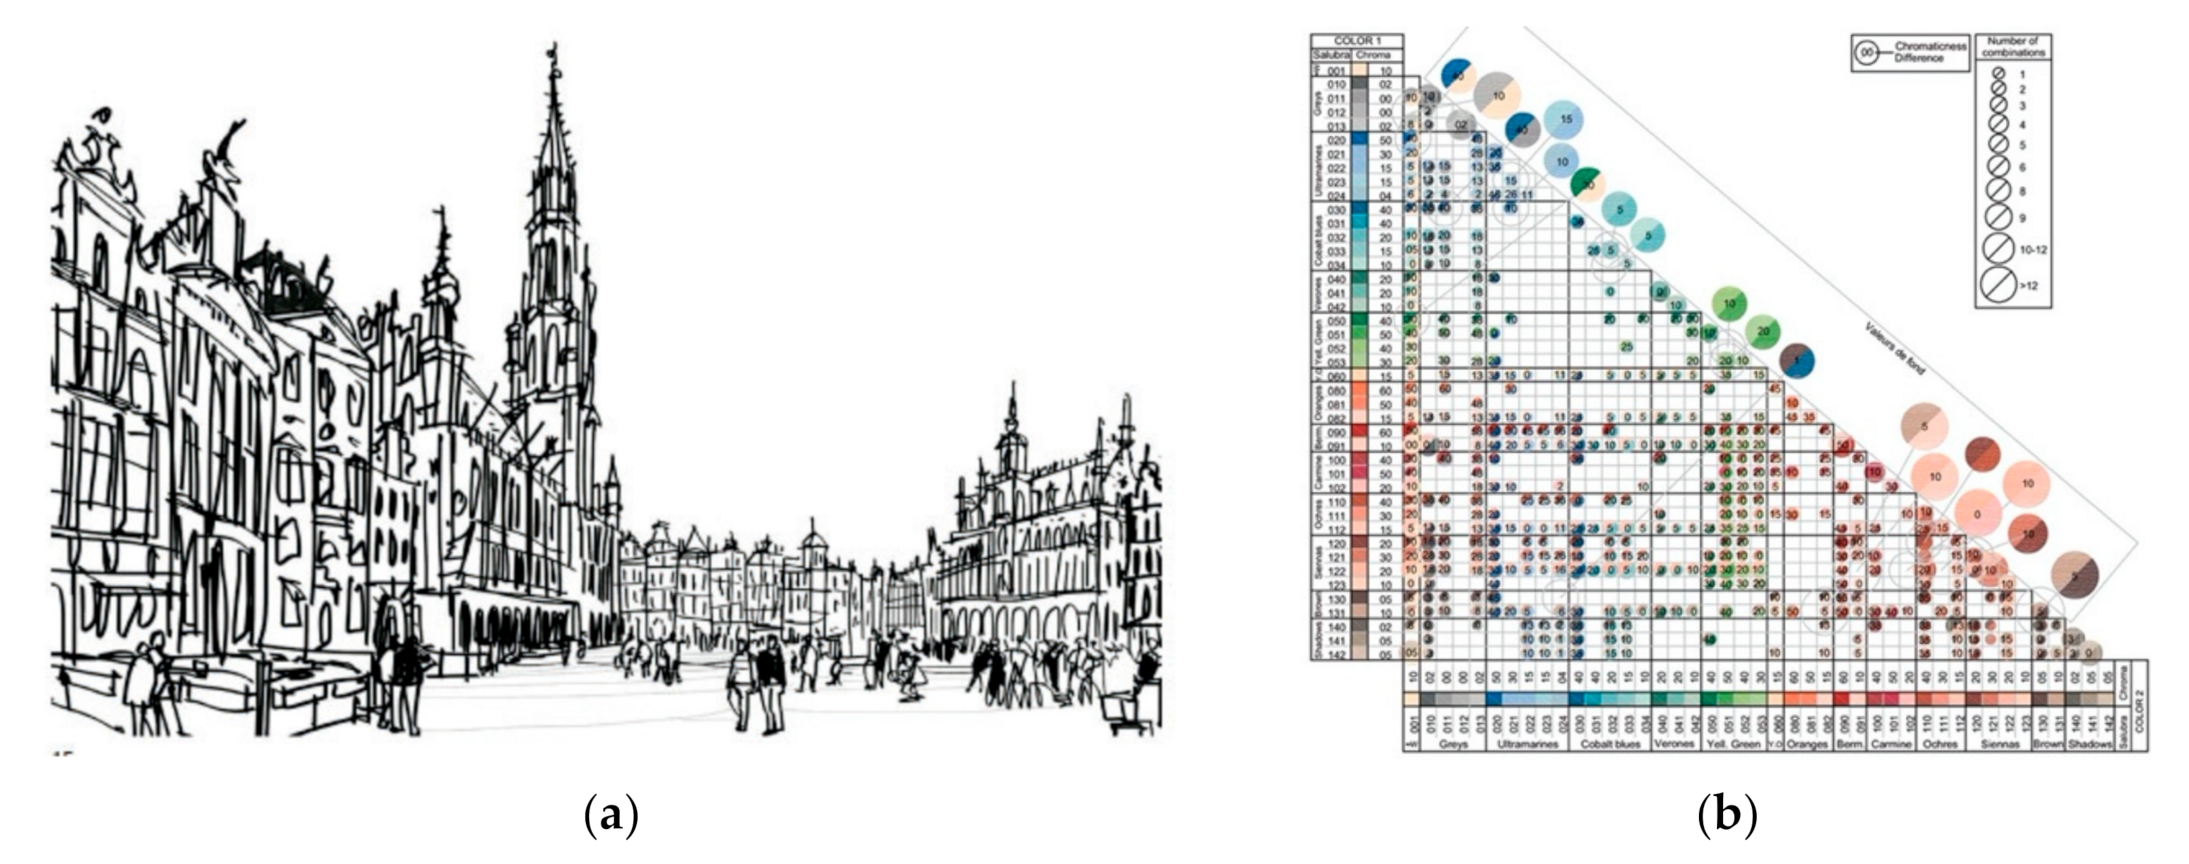
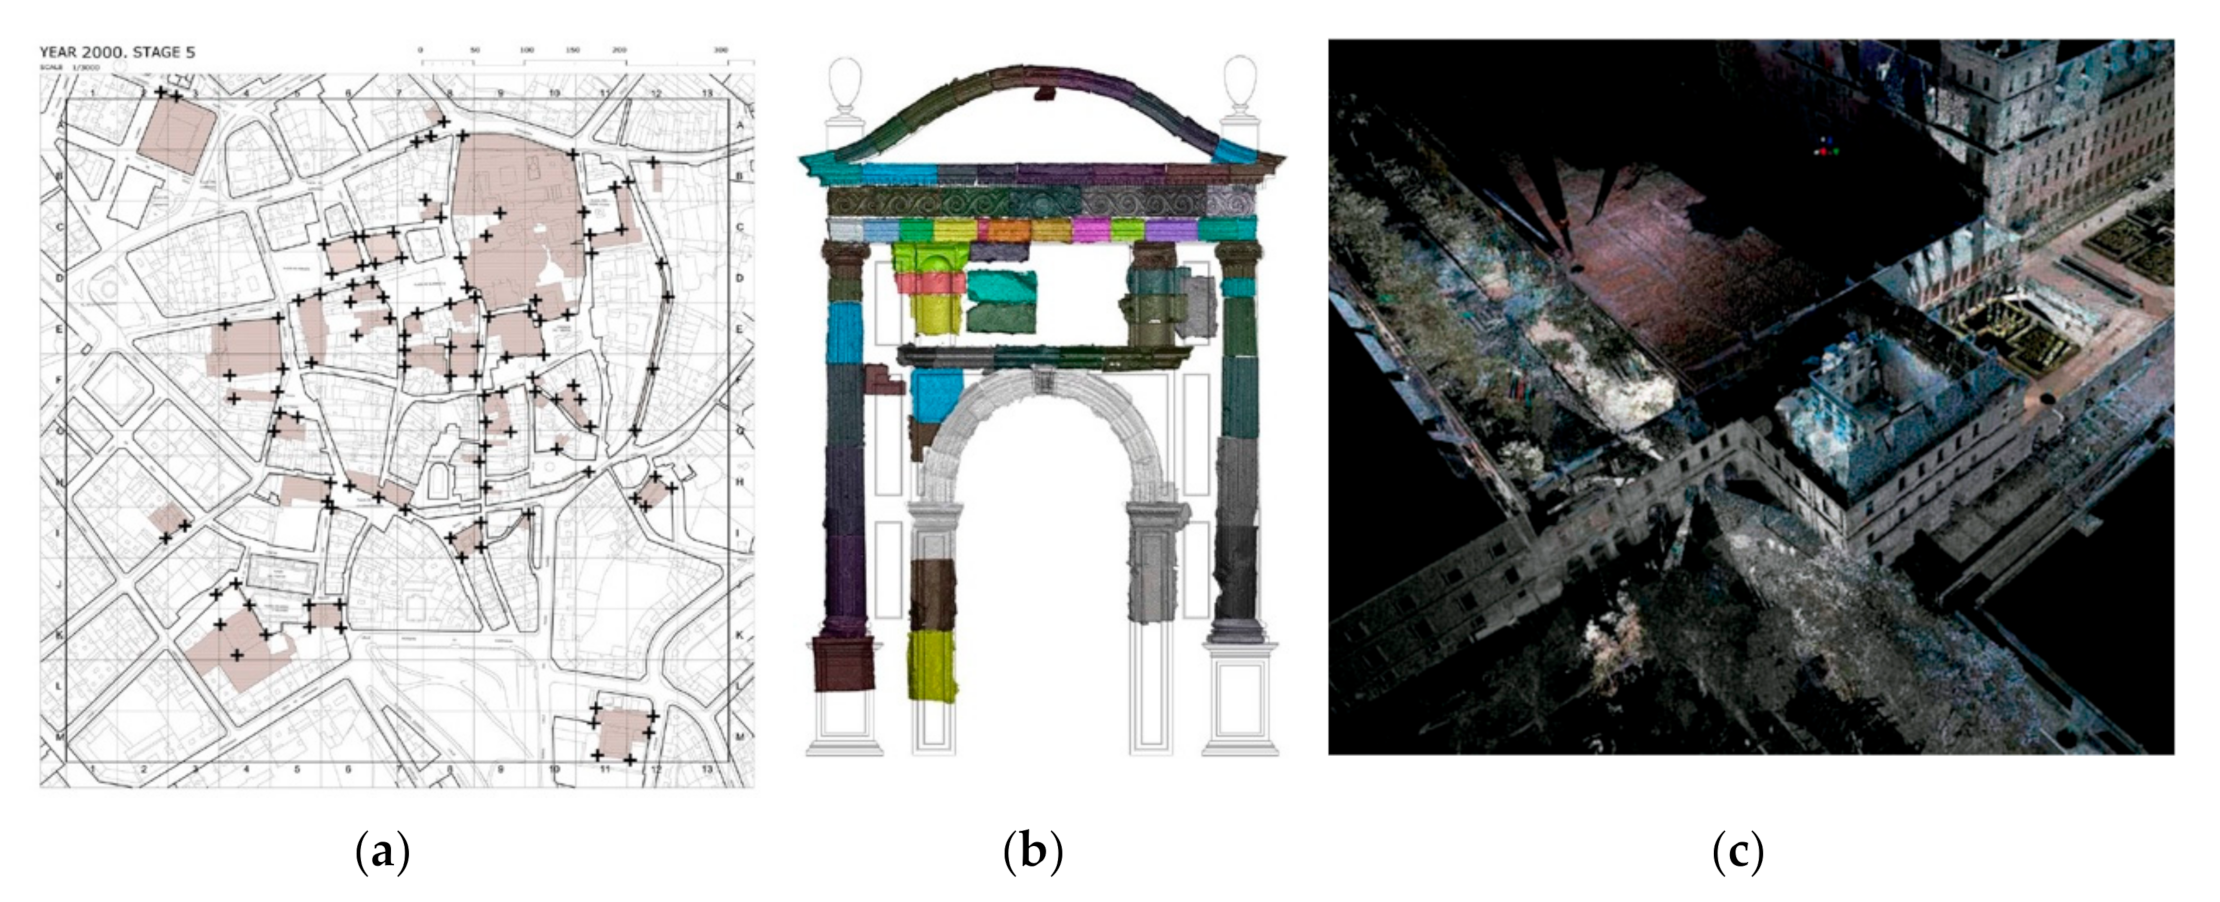
- Representation and graphical analysis. This topic includes research such as the study of urban representations in Leonardo da Vinci’s manuscripts [6], formal and composition analysis [7], descriptive analysis of buildings [8], the model as an analytic tool in training [9], the historical analysis of the city of Cádiz [10], the elaboration of graphic criteria through the first planimetries of the Granada territory [11], the thought of fundamental graphic elements, such as the line [12], or the solution of complex geometries in the case of fire [13]. The analysis of architecture and urban planning from graphic techniques has been the most important set of methods throughout history. These contributions are of great interest as they provide a scientific approach in terms of explaining the research procedure, design and data collection.
- Photogrammetry consists of the three-dimensional digital representation of an element from the capture and processing of photographs. Some of its applications are the verification of structures [14], the control and management of land use and coverage [15], structural, stratigraphic and natural scenery analysis for purposes related to archeology, chemistry or biochemistry [16,17]. Other aspects have focused on exploring proposals to evaluate the accuracy and precision of photogrammetric mappings, such as through the variation of the number of control points [18] or the use of sub-pixel technology [19], also presenting the development of automatic procedures that take advantage of satellite images to draw building plans [20]. Both this technology and other surveying procedures, such as laser and LIDAR (Laser Imaging Detection and Ranging) scanners, have brought enormous advances in heritage conservation. This is because they are very accurate documentation methods, especially when working with ancient buildings with structural deformations and cracked, worn or damaged finishes (such as texture and color).
- Computer-aided design (CAD) and Computer-aided engineering (CAE) incorporate graphical tools and methods that benefit from digital environments. Some of its applications are to recreate elements and their subsequent analysis, such as the study of press and beam towers for the extraction of oil from olives [21], the recovery of industrial heritage in educational settings [22] or the digital reconstruction of disappeared historical heritage [23]. CAD has favored many design tasks, such as the tracing technique and the drawing of complex geometries, above all in terms of speed and accuracy. Likewise, it has provided the possibility to model and to display interactive three-dimensional architecture.
- Building information modeling (BIM) is an architectural information management tool arranged in a three-dimensional environment that allows to combine the dispersed information of a project [24]. It has had a great impact on architecture and engineering education through the use of software such as Revit or ArchiCAD [25,26]. It is one of the newer technologies and offers many opportunities to manage and analyze architecture.
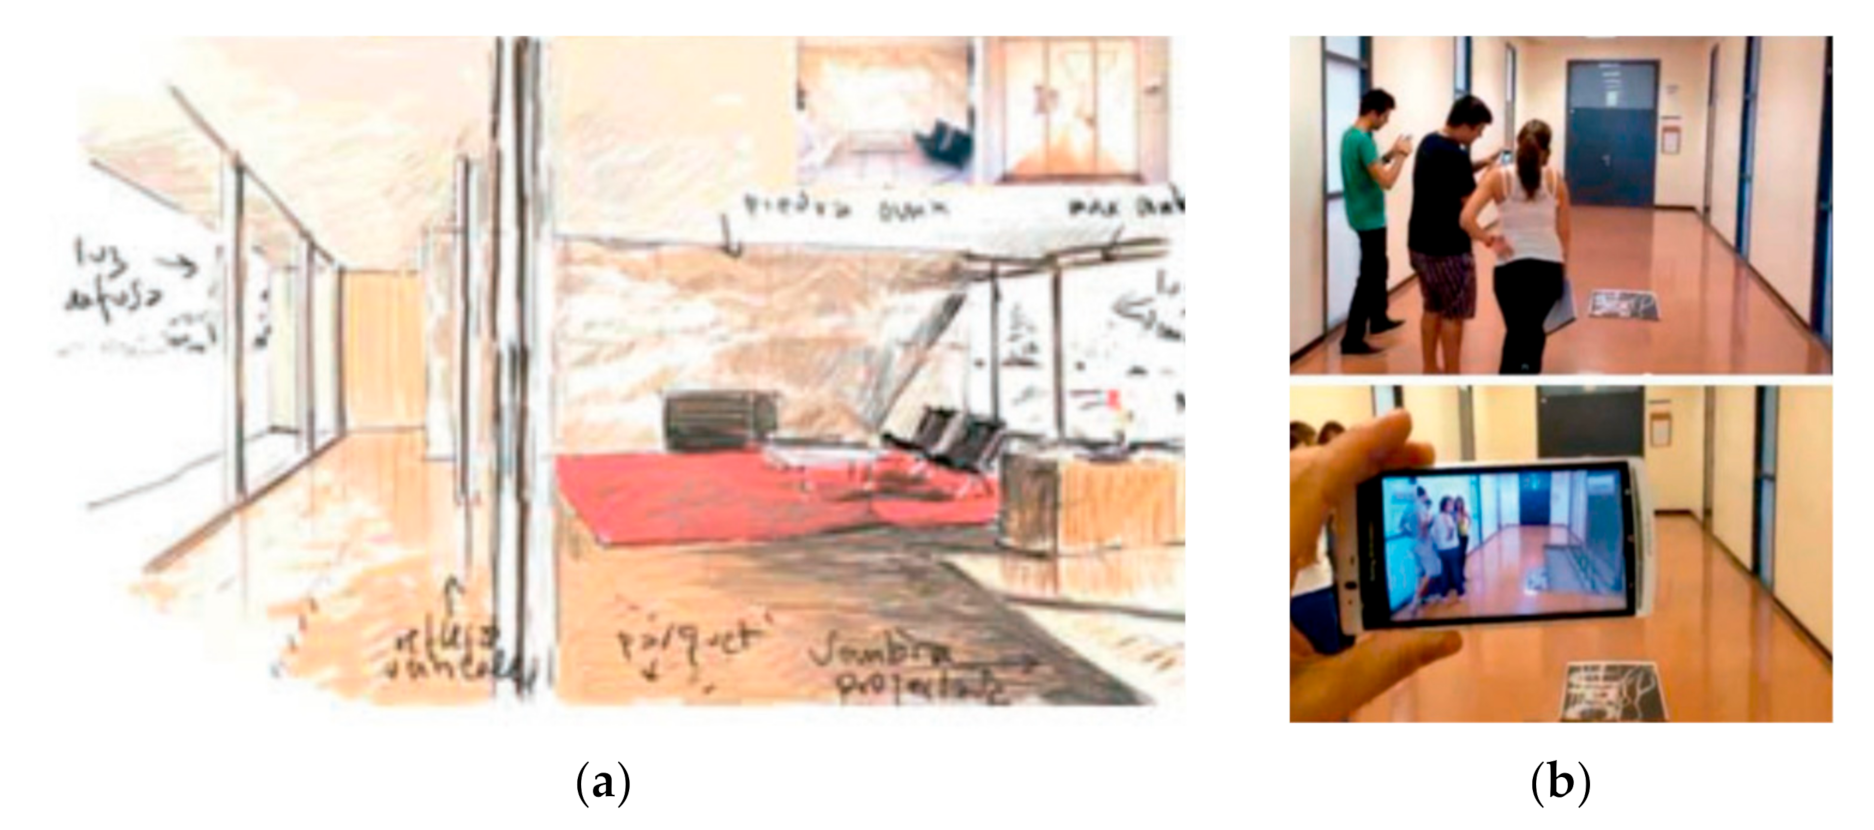
- Virtual reality (VR) and augmented reality (AR) have been the focus of research with the aim of providing an immersive visualization of 3D models. They are useful tools for the teaching of architecture projects [27] and for the development renewable energies projects [28]. VR and AR provide an environment to visualize architecture in which the user chooses from where to perceive the building. Therefore, they are an attractive tool in education and an effective tool for assessing projects before spending large amounts of money and building them.
2.2. Innovation and Creation
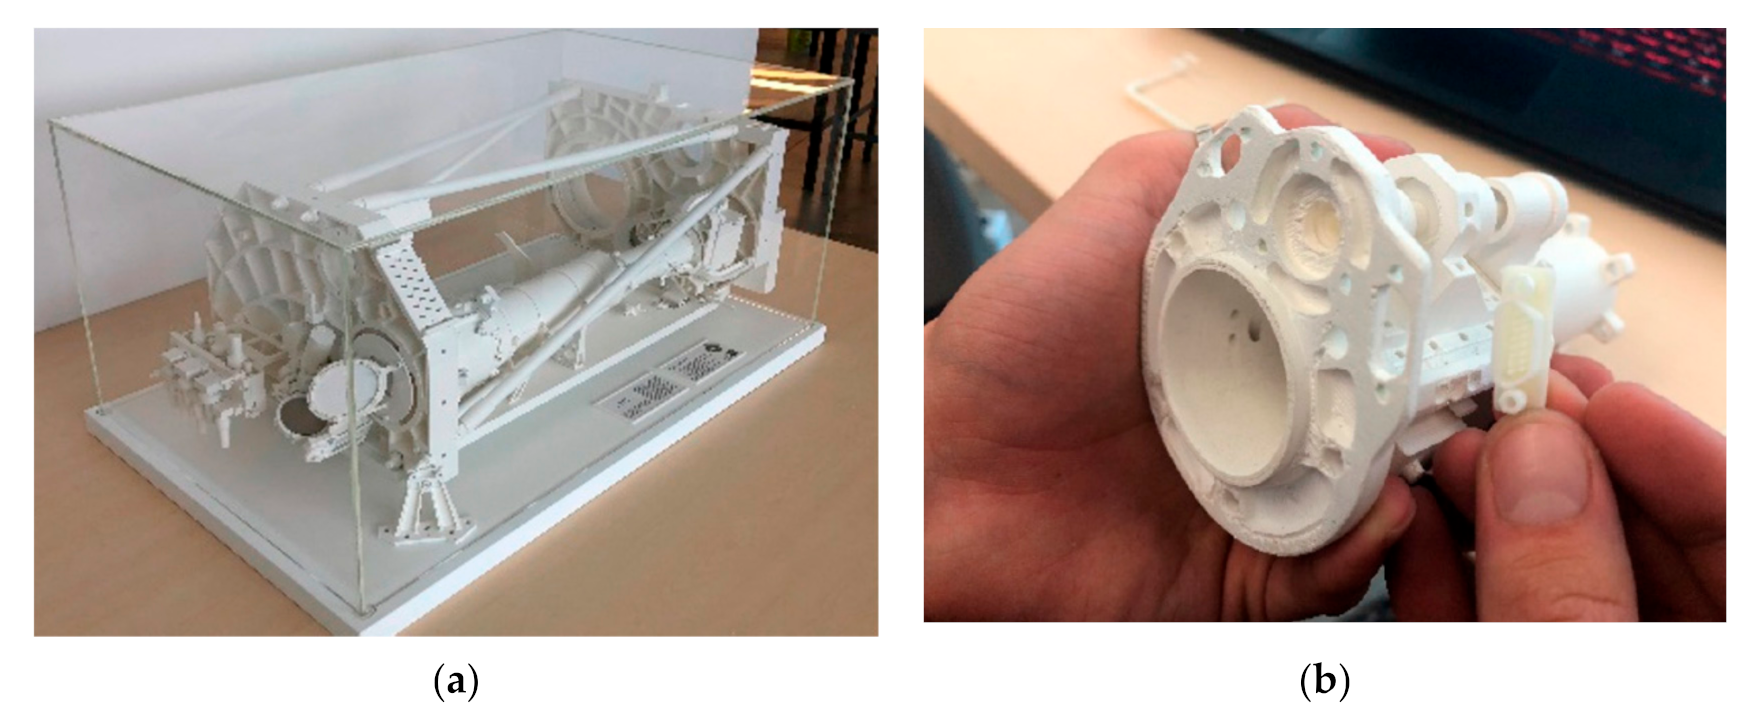
2.3. Design and Manufacturing
2.4. Education
2.5. Heritage and History
2.6. Analysis of the Territory
3. Materials and Methods
3.1. Source of Information
3.2. Sample
4. Results
4.1. Cluster and Network Map Analyses: Co-Ocurrence Fields—Title and Abstract
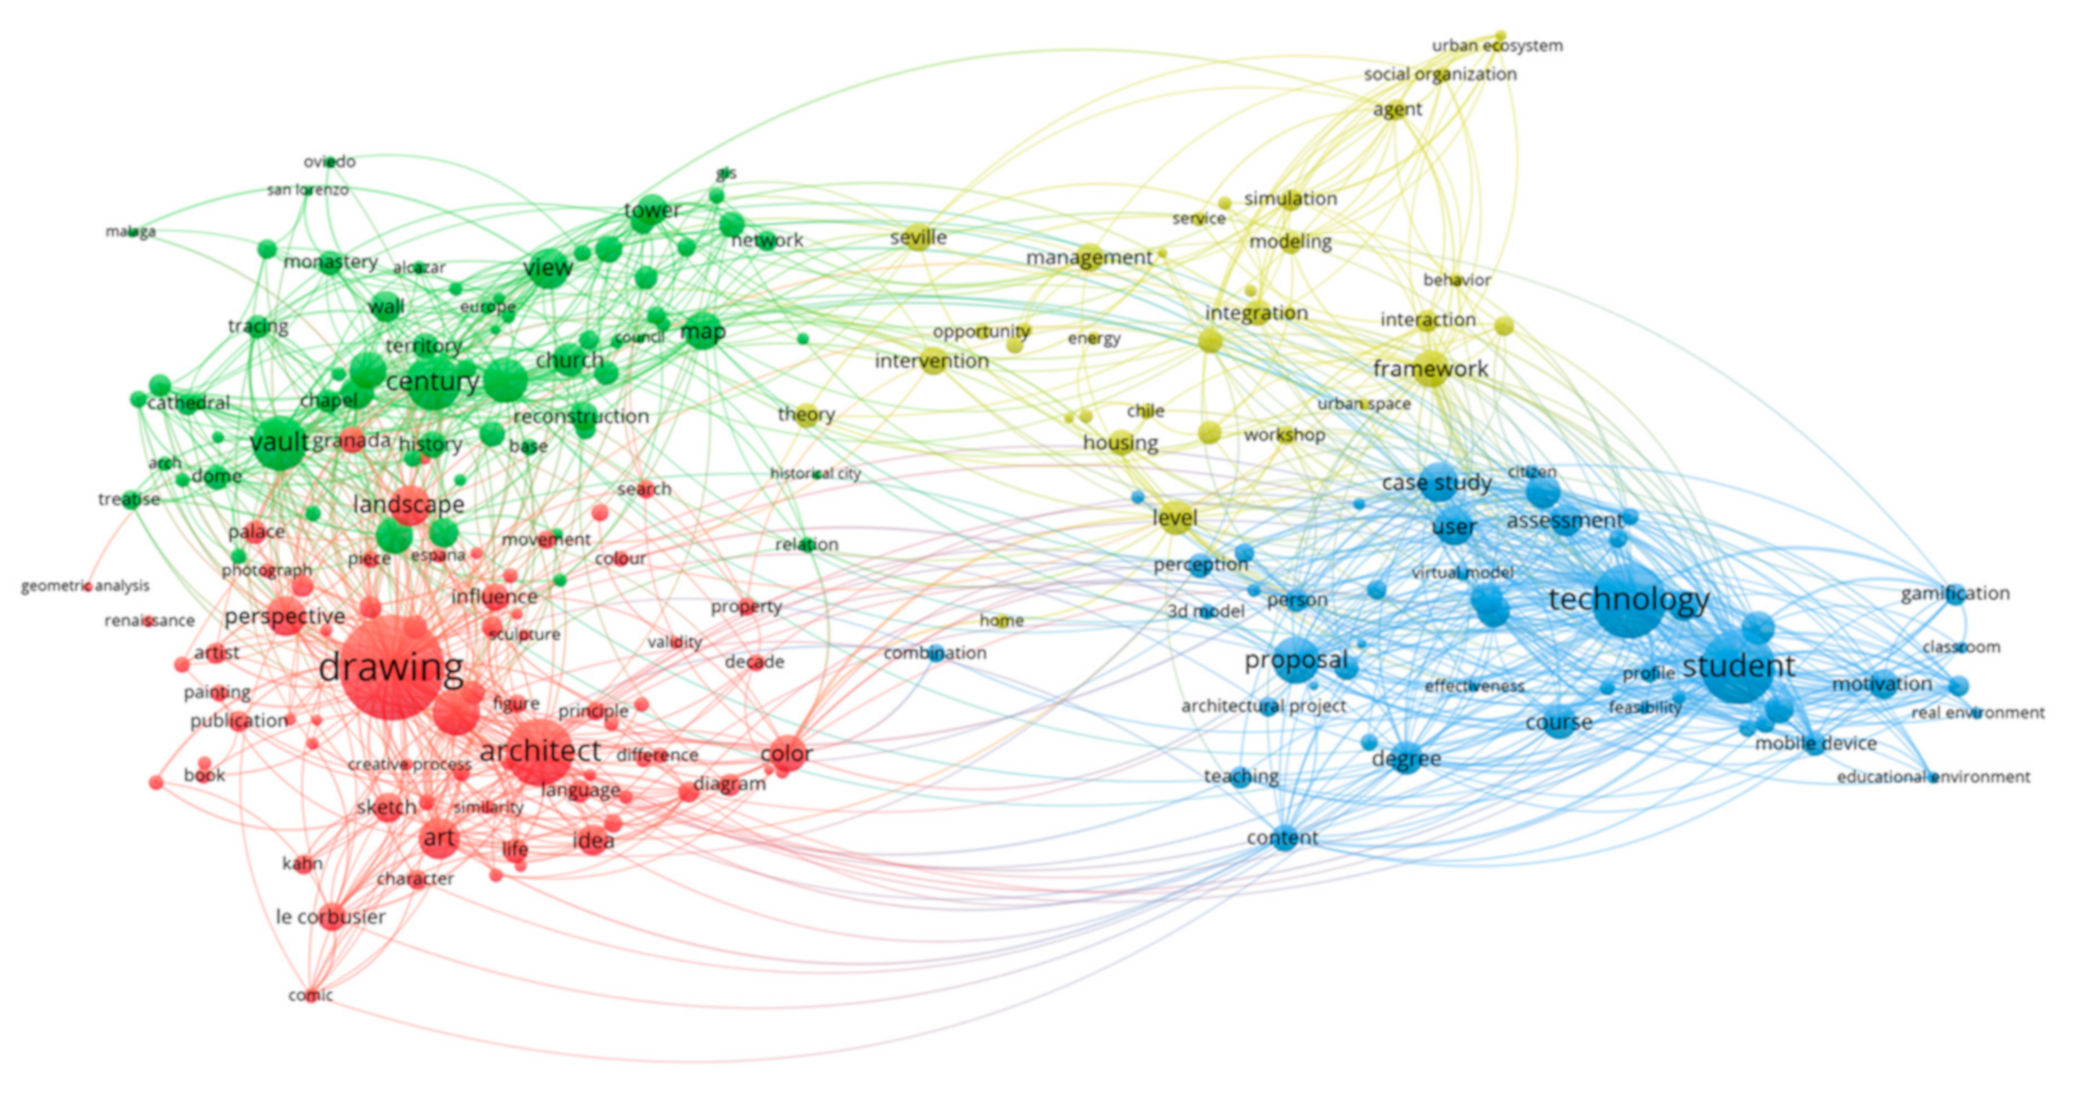
- The first cluster (red color) contains 72 terms that falls under the philosophy and theory of architectural graphics. Those that are repeated the most are drawing, architect, shape, landscape, art, perspective, color, house, diagram, language, model, photography and sculpture.
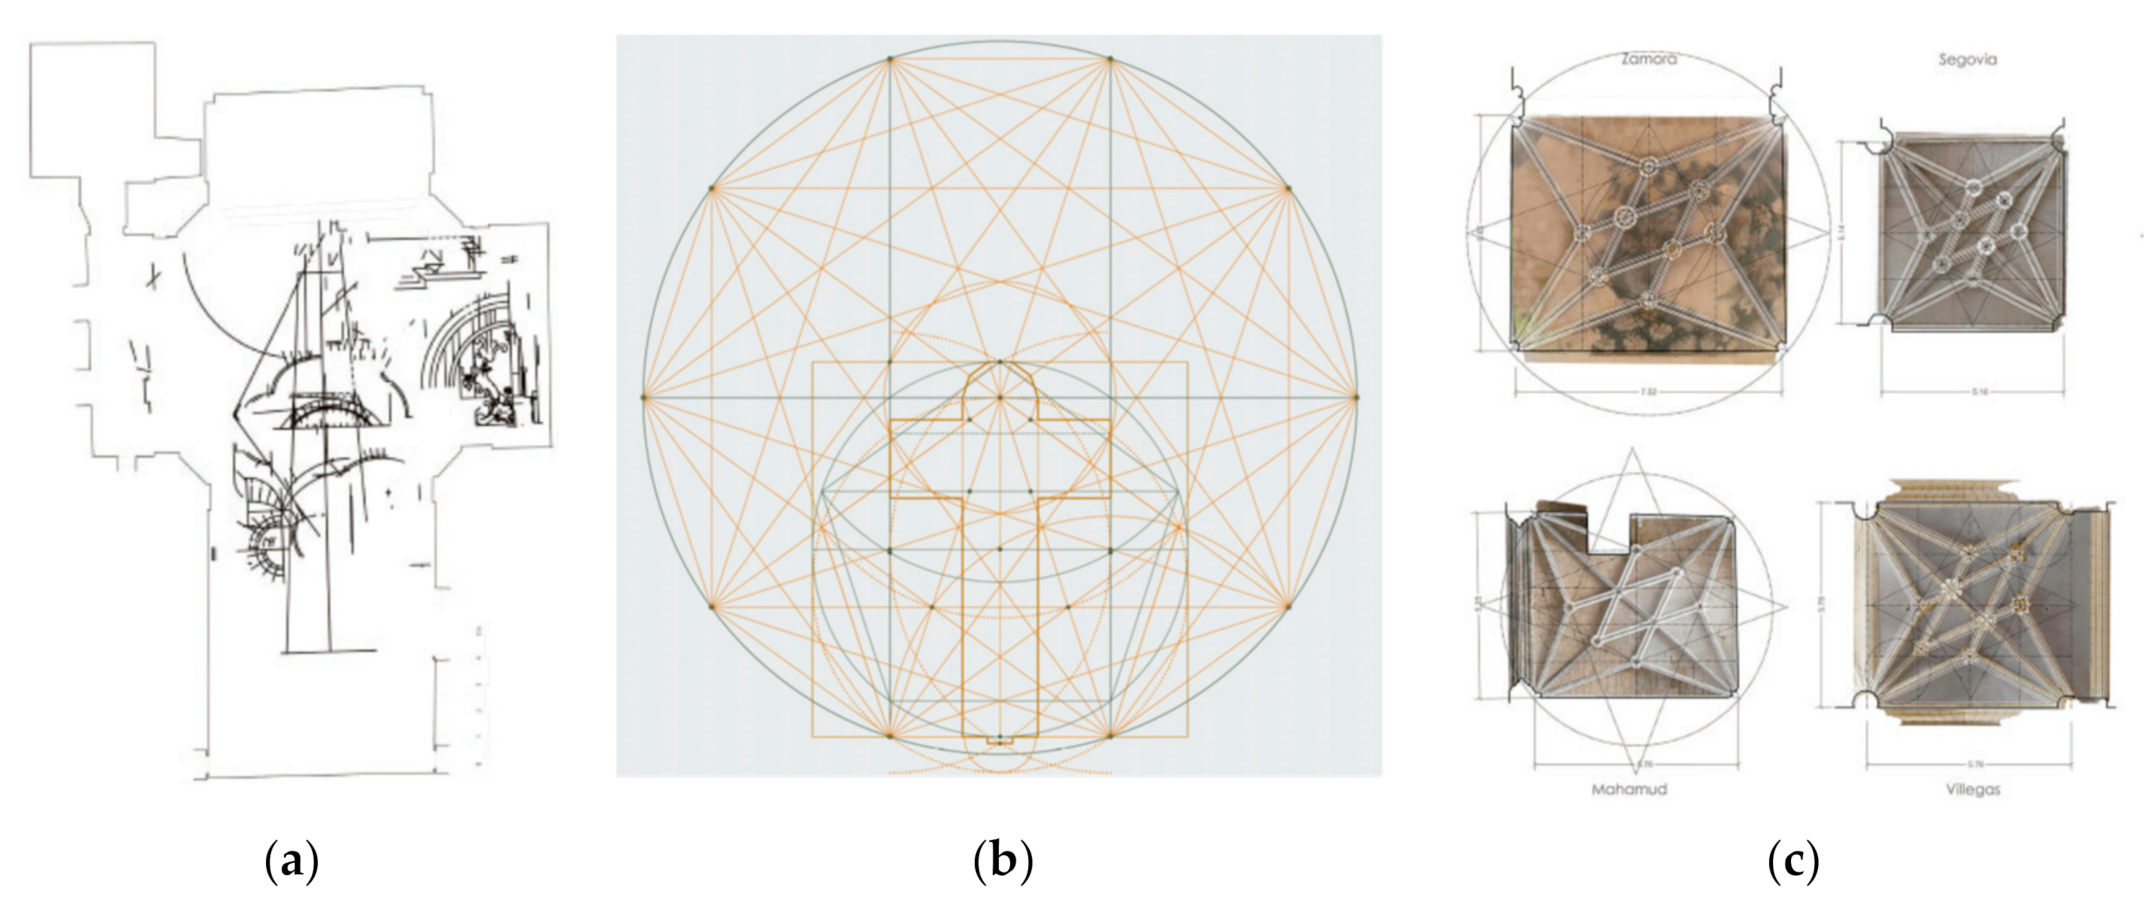
- The second cluster (green color) is made up of 67 terms concerning the theory of geometry in architectural heritage. The most repeated terms are vault, survey, map, church, tower, wall, surface, photogrammetry, history, wall, conservation, dome, layout, historical heritage, cathedral, cartography, proportion, arch and GIS.
- The third cluster (blue) includes 44 terms on the application of digital graphics in architecture education. Among those that stand out are technology, student, proposal, user, education, motivation, evaluation, visualization, motivation, augmented reality, mobile device, teaching, satisfaction, 3D model, virtual model and virtual reality.
- The fourth cluster (yellow color) includes 34 terms that comprise urban design management, and the most repeated terms are frame of reference, management, intervention, housing, simulation, interaction, workshop, planning, organization, energy, behavior, urban space and urban planning.
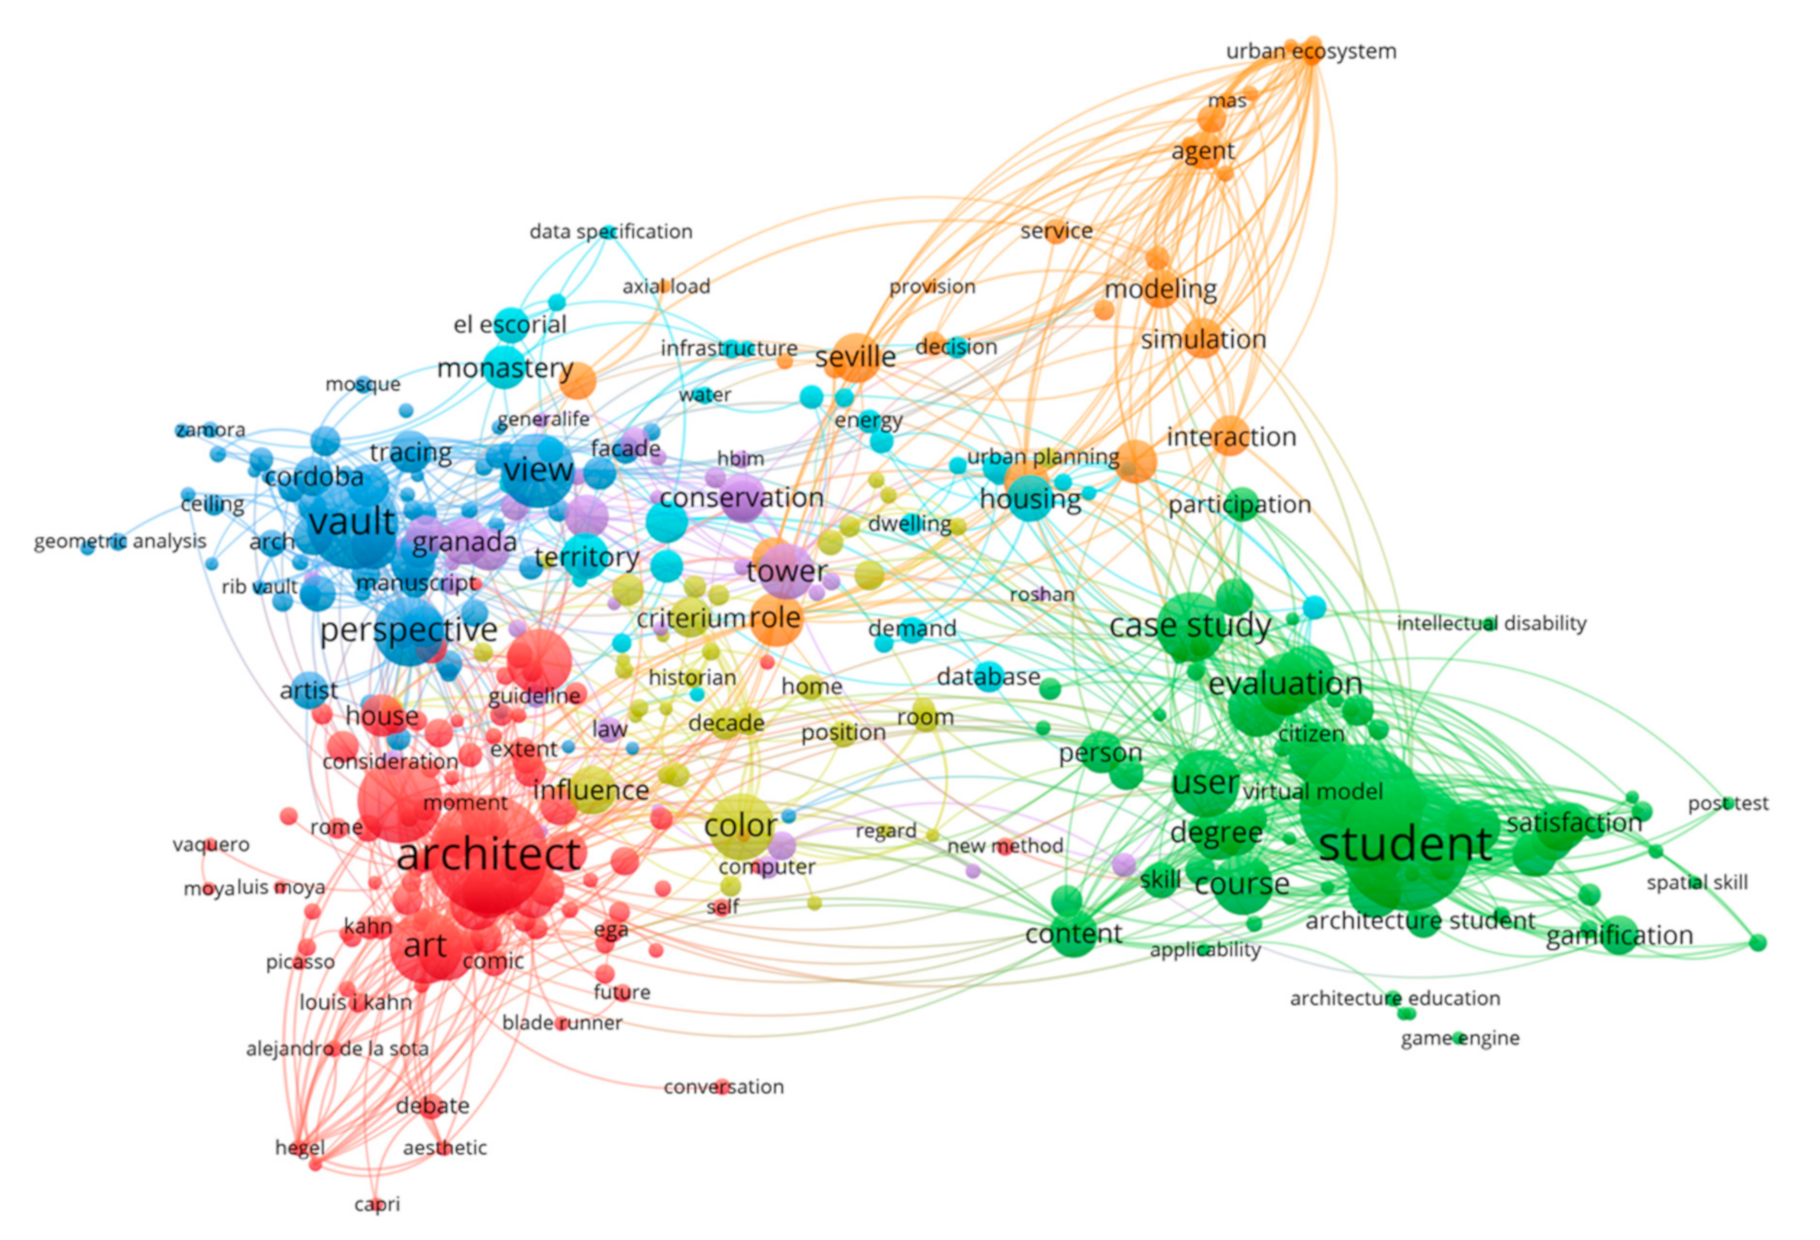
- The first cluster (red color) contains 102 terms that fall under the philosophy and theory of architectural graphics, among which the following are repeated the most: architect, form, art, life, landscape, culture, sketch, painting, drawing, architecture, thought, diagram, color, abstraction, aesthetics, ideation, mind, analogy and graphic expression.
- The second cluster (green color) consists of 72 terms on the application of digital graphics in architecture education. The most repeated terms are technology, student, evaluation, education, visualization, usability, device, augmented reality, virtual model, satisfaction, mobile device, urban space, virtual reality, communication, gamification, motivation, spatial skills, video game engine and 3D technology.
- The third cluster (blue) includes 70 terms on the theory of geometry applied to the study of architectural heritage. The following words stand out: view, perspective, vault, design, cathedral, restoration, photography, arch, dome, proportion, rib, layout, stereotomy, descriptive geometry and geometric analysis. Theory of geometry applied to the study of architectural heritage.
- The fourth cluster (yellow color) encompasses 37 terms that encompass research on urban models, among which the following are repeated the most: planning, urban development, color, urban landscape rehabilitation, property, city, identity, urban form, intervention model and historic city.
- The fifth cluster (purple color) incorporates 37 terms on digital graphic techniques for the study of architectural heritage: conservation, monument, photogrammetry, permanence, architectural heritage, tower, comparative analysis, recovery, traces, laser scan, HBIM, point clouds and graphic information.
- The sixth cluster (cyan color) is made up of 36 words are combined on the analysis of territory information: territory, cultural heritage, decision, database, demand, cartography, identification, energy, diagnosis, memory, infrastructure, GIS and infrastructure energetic.
- The seventh cluster (orange color) includes 29 terms on the graph of population behaviors: integration, communication, interaction, simulation, modeling, theory, population, service, behavior, social organization, urban ecosystem and management processes.
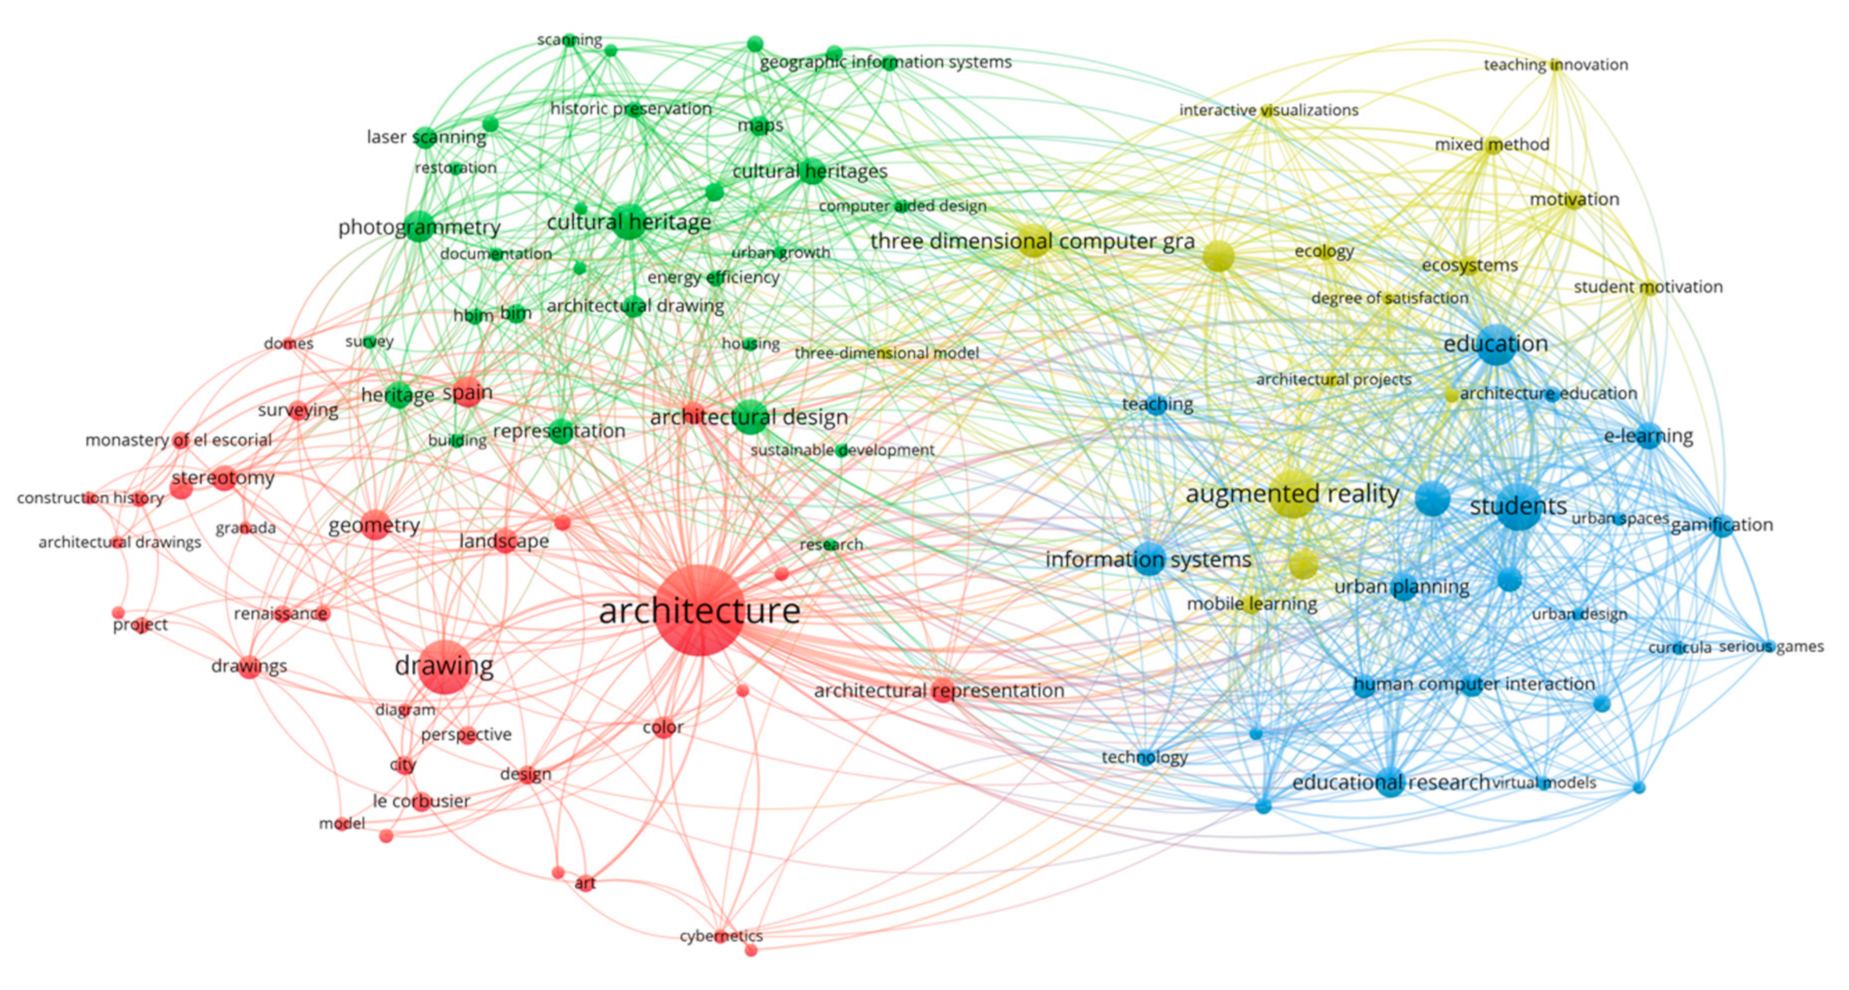
4.2. Cluster and Network Map Analyses: Co-Ocurrence Fields—Keywords
- The first cluster (red color) contains 36 terms that are framed in fundamental elements of architectural graphics, such as architecture, survey, geometry, architectural representation, drawing, landscape, stereotomy, design, color, city, perspective, art, sketch, photography, mockup and diagram.
- The second cluster (green color) consists of 31 terms on digital graphic techniques; among the most repeated are cultural heritage, photogrammetry, computer-aided design, architectural design, maps, laser scanner, historical preservation, representation, cartography, GIS, HBIM, BIM, archeology, sustainable development and restoration.
- The third cluster (color blue) includes 23 terms on interactive architecture education tools: education, students, virtual reality, mobile devices, gamification, human-computer interaction, academic performance, architecture education and virtual models.
- The fourth cluster (yellow color) includes 16 terms on innovative visual methods to communicate architecture: three-dimensional computer graphics, augmented reality, visualization, user experience, three-dimensional model, motivation, interactive visualization and satisfaction.
5. Discussion and Conclusions
Author Contributions
Funding
Acknowledgments
Conflicts of Interest
References
- Saorín, J.L.; Navarro, R.; Martín, N.; Contero, M. Las Habilidades Espaciales Y El Programa De Expresión Gráfica En Las Carreras De Ingeniería. Encuentro Int. Enseñanza Ing. Civ. 2003. Available online: http://www.regeo.uji.es/publicaciones/SNMC05.pdf (accessed on 5 July 2020).
- Pena, V.L.; López-Chao, V.A.; L-Chao, A.M. Analysis of teaching methods in graphic design in the Galician university system (GUS) in Spain. Anthropologist 2016, 25, 214–219. [Google Scholar] [CrossRef]
- Martin-Gutiérrez, J.; Saorín, J.L.; Martín-Dorta, N.; Contero, M. Do video games improve spatial abilities of engineering students? Int. J. Eng. Educ. 2009, 25, 1194–1204. [Google Scholar]
- Redondo, E.; Fonseca, D.; Giménez, L.; Santana, G.; Navarro, I. Alfabetización digital para la enseñanza de la arquitectura. Un estudio de caso. Arquiteturarevista 2012, 8, 76–87. [Google Scholar] [CrossRef]
- López-Chao, V.; Amado Lorenzo, A. Research training impact on the SJR scientific production of Architectural Graphics. Rev. Española Doc. Científica 2020, in press. [Google Scholar]
- García, D.H.; Doménech, S.G. Urban graphic representation in Leonardo da Vinci’s manuscripts. EGA Rev. Expr. Graf. Arquit. 2017, 29, 128–135. [Google Scholar] [CrossRef][Green Version]
- Llopis Verdú, J. El claustro del Colegio de Corpus Christi de Valencia. Análisis formal y compositivo. Arch. Esp. Arte 2007, 80, 45–65. [Google Scholar] [CrossRef][Green Version]
- Bañón, J.J.P. Dos fragmentos de otaisa en la universidad laboral de sevilla: Cinco gimnasios y un taller en agonía. RA Rev. Arquit. 2008, 10, 69–84. [Google Scholar]
- Carazo Lefort, E.; Galvan Desvaux, N. Aprendiendo con maquetas. Pequeñas maquetas para el análisis de arquitectura. EGA. Rev. Expr. Graf. Arquit. 2014, 19, 62–71. [Google Scholar] [CrossRef]
- Granado Castro, G.; Barrera Vera, J.A.; Aguilar-Camacho, J. The scale model of Cadiz 1779: Military utility or power metaphor. Rev. Proy. Prog. Arquit. 2016, 15, 16–29. [Google Scholar]
- García-Pulido, L.J. The graphical representation of the territory of granada in the topographic maps of the nineteenth century. EGA Rev. Expr. Graf. Arquit. 2016, 27, 242–253. [Google Scholar] [CrossRef][Green Version]
- Ampliato Briones, A.L. Apuntes sobre el origen de la línea. EGA. Rev. Expr. Graf. Arquit. 2012, 17, 60–67. [Google Scholar] [CrossRef]
- Nestares Pleguezuelo, P.; Rubio Romero, J.C.; Martínez Aires, M.D.; Parras Anguita, L. Un paso m´sa allá del triángulo y el tetaedro. El modelo qf7 para el conocimiento del fuego. DYNA Ing. E Ind. 2015. [Google Scholar] [CrossRef]
- Roca-Pardiñas, J.; Ordóñez, C.; García-Cortés, S.; Bello, A. Validating The Supporting Structure of A Parabolic Solar Collector Using Close Range Photogrammetry. Photogramm. Rec. 2013, 28, 211–226. [Google Scholar] [CrossRef]
- Larranaga, A.; Alvarez-Mozos, J.; Albizua, L.; Peters, J. Backscattering behavior of rain-fed crops along the growing season. IEEE Geosci. Remote Sens. Lett. 2012, 10, 386–390. [Google Scholar] [CrossRef]
- Manzano-Agugliaro, F.; Corchete, V.; Lastra, X.B. Spectral analysis of tide waves in the Strait of Gibraltar. Sci. Res. Essays 2011, 6, 453–462. [Google Scholar]
- Bestué Cardiel, I.; Gutiérrez Carrillo, M.L. Multidisciplinary, diachronic methodology for the conservation of archeological remains. Restoration of the Arab baths of the San Francisco Parador Hotel in the grounds of the Alhambra (Granada, Spain). J. Cult. Herit. 2015, 16, 623–631. [Google Scholar] [CrossRef]
- Agüera-Vega, F.; Carvajal-Ramírez, F.; Martínez-Carricondo, P. Assessment of photogrammetric mapping accuracy based on variation ground control points number using unmanned aerial vehicle. Meas. J. Int. Meas. Confed. 2017, 98, 221–227. [Google Scholar] [CrossRef]
- Aguilar, F.J.; Nemmaoui, A.; Aguilar, M.A.; Chourak, M.; Zarhloule, Y.; García Lorca, A.M. A quantitative assessment of forest cover change in the moulouya river watershed (Morocco) by the integration of a subpixel-based and object-based analysis of Landsat data. Forests 2016, 7, 23. [Google Scholar] [CrossRef]
- Agüera, F.; Liu, J.G. Automatic greenhouse delineation from QuickBird and Ikonos satellite images. Comput. Electron. Agric. 2009, 66, 191–200. [Google Scholar] [CrossRef]
- Rojas-Sola, J.I. Ancient technology and computer aided design: Olive oil production in southern Spain. Interdiscip. Sci. Rev. 2005, 30, 59–67. [Google Scholar] [CrossRef]
- Suárez, J.; Rojas-Sola, J.I.; Rubio, R.; Martín, S.; Morán, S. Teaching applications of the new computer-aided modelling technologies in the recovery and diffusion of the industrial heritage. Comput. Appl. Eng. Educ. 2009, 17, 455–466. [Google Scholar] [CrossRef]
- Franco Taboada, J.A.; Goy Diz, A.E. Renaissance drawings of the 16th century in the city of Lugo: Three fountains from Gonzalo de la Bárcena’s workshop. Buildings 2018, 8, 44. [Google Scholar] [CrossRef]
- Angulo Fornos, R. Construcción de la base gráfica para un sistema de información y gestión del patrimonio arquitectónico: Casa de Hylas. Arqueol. Arquit. 2013, 9, 11–25. [Google Scholar] [CrossRef][Green Version]
- Lei, Z.; Quian, R.; Zhang, L.; Tan, P.; Luo, Z.; Bai, L. Application of BIM in Engineering Drawing Course. Creat. Educ. Stud. 2019, 7, 80–85. [Google Scholar] [CrossRef]
- Turk, Ž. Should BIM Change the Language of Engineering Education? Budapest University of Technology and Economics: Budapest, Hungary, 2018. [Google Scholar] [CrossRef]
- Fonseca, D.; Valls, F.; Redondo, E.; Villagrasa, S. Informal interactions in 3D education: Citizenship participation and assessment of virtual urban proposals. Comput. Human Behav. 2016, 55, 504–518. [Google Scholar] [CrossRef]
- Lizcano, P.E.; Manchado, C.; Gomez-Jauregui, V.; Otero, C. Virtual reality to assess visual impact in wind energy projects. In Advances on Mechanics, Design Engineering and Manufacturing; Springer: Berlin/Heidelberg, Germany, 2017. [Google Scholar]
- Martín-Pastor, A.; Granado-Castro, G. A Contribution to the Study of Instruction in Geometry and Architectural Representation in Spain during the 17th Century. Nexus Netw. J. 2015, 17, 231–251. [Google Scholar] [CrossRef]
- Gordo, G.; Antonio, J.F. Lewis’s original drawings of the alhambra palaces (1832-33). EGA Rev. Expr. Graf. Arquit. 2012, 20, 74–85. [Google Scholar]
- Martín, F.G. Drawer of ideas an d builder of images. Foundations for architectural drawing. EGA Rev. Expr. Graf. Arquit. 2016, 28, 190–197. [Google Scholar]
- López Mozo, A. Ovals for Any Given Proportion in Architecture: A Layout Possibly Known in the Sixteenth Century. Nexus Netw. J. 2011, 13, 569–597. [Google Scholar] [CrossRef]
- Serra, J.; Llopis, J.; Torres, A.; Giménez, M. Color combination criteria in le Corbusier’s Purist architecture based on Salubra claviers from 1931. Color Res. Appl. 2016, 41, 85–100. [Google Scholar] [CrossRef]
- Amado Lorenzo, A.; Fraga López, F. El dibujante digital. Dibujo a mano alzada sobre tabletas digitales. EGA. Rev. Expr. Graf. Arquit. 2015, 20, 108–119. [Google Scholar] [CrossRef]
- Franco Taboada, J.A. La importancia del dibujo en la obra de Rafael Moneo. A propósito de una exposición. EGA. Rev. Expr. Graf. Arquit. 2014, 19, 36–45. [Google Scholar] [CrossRef][Green Version]
- Amado, A. Las caricaturas de los arquitectos. EGA. Rev. Expr. Graf. Arquit. 2013, 18, 96–107. [Google Scholar] [CrossRef]
- Marcos, C.L. Ser y devenir de los diagramas. Huellas y protoformas como subtexto arquitectónico: De Deleuze a Eisenman. EGA. Rev. Expr. Graf. Arquit. 2012. [Google Scholar] [CrossRef]
- Franco Taboada, J.A. Sobre perspectiva, fotografía e infografía. Apuntes para una fenomenología de la representación. EGA. Rev. Expr. Graf. Arquit. 2011, 16, 54–64. [Google Scholar] [CrossRef]
- López-Mozo, A.; Senent-Domínguez, R. Late Gothic Asymmetrical Diamond Vaults in Spain. Nexus Netw. J. 2017, 19, 323–343. [Google Scholar] [CrossRef]
- Tarrio Carrodeagüas, S.B. Geometría y proporción en San Francisco de Orense. EGA Rev. Expr. Graf. Arquit. 2012, 16. [Google Scholar] [CrossRef]
- Calvo-López, J.; Salcedo-Galera, M. Geometrical Proportion in the Sixteenth Century: Methods and Constraints. Nexus Netw. J. 2017, 19, 155–178. [Google Scholar] [CrossRef]
- Calvo López, J.; Alonso Rodríguez, M.Á.; Taín Guzmán, M.; Camiruaga Osés, I. Métodos de documentación, análisis y conservación de trazados arquitectónicos a tamaño natural. Arqueol. Arquit. 2015, 12, 026. [Google Scholar] [CrossRef][Green Version]
- García-Ortega, A. Reglas de dimensionamiento en trazas tardogóticas españolas. Las catedrales de Sevilla y Segovia. Inf. Constr. 2017. [Google Scholar] [CrossRef]
- Pinto-Puerto, F.; Jiménez-Martín, A. Geometric Working Drawing of a Gothic Tierceron Vault in Seville Cathedral. Nexus Netw. J. 2016, 18, 439–466. [Google Scholar] [CrossRef]
- Freire-Tellado, M.J.; Tarrío-Carrodeguas, S.B. Las bóvedas pétreas nervadas de Galicia: Identificación de soluciones. Inf. Constr. 2015. [Google Scholar] [CrossRef]
- Ortega, A.J.G. Diseño y construcción de muros en el primer gótico cordobés. Inf. Constr. 2009, 61, 37–52. [Google Scholar] [CrossRef]
- Del Río-Cidoncha, M.G.; Martínez-Palacios, J.; Ortuño-Ortiz, F. Task automation for modelling solids with Catia V5. Aircr. Eng. Aerosp. Technol. 2007. [Google Scholar] [CrossRef]
- Mercado-Colmenero, J.M.; Paramio, M.A.R.; Perez-Garcia, J.M.; Martin-Doñate, C. A new hybrid method for demoldability analysis of discrete geometries. CAD Comput. Aided Des. 2016, 80, 43–60. [Google Scholar] [CrossRef]
- Saorín, J.L.; Lopez-Chao, V.; de la Torre-Cantero, J.; Díaz-Alemán, M.D. Computer aided design to produce high-detail models through low cost digital fabrication for the conservation of aerospace heritage. Appl. Sci. 2019, 9, 2338. [Google Scholar] [CrossRef]
- Íñiguez-Macedo, S.; Somovilla-Gómez, F.; Lostado-Lorza, R.; Corral-Bobadilla, M.; Martínez-Calvo, M.Á.; Sanz-Adán, F. The design of a knee prosthesis by finite element analysis. In Advances on Mechanics, Design Engineering and Manufacturing; Springer: Cham, Switzeland, 2017. [Google Scholar]
- Rodríguez-Parada, L.; Pardo-Vicente, M.Á.; Mayuet-Ares, P.F. Digitalization fresh food using 3D scanning for custom packaging design. Dyna 2018, 93, 681–688. [Google Scholar]
- Martín-Pastor, A.; Martín-Mariscal, A.; López-Martínez, A. Rethinking ephemeral architecture. Advanced geometry for citizen-managed spaces. In Sustainable Development and Renovation in Architecture, Urbanism and Engineering; Springer: Cham, Switzeland, 2017; pp. 301–310. [Google Scholar] [CrossRef]
- Ayala Alvarez, F.J.; Blázquez Parra, E.B.; Montes-Tubío, F.D.P. Incorporation of 3D ICT elements into class. Comput. Appl. Eng. Educ. 2017, 25, 542–549. [Google Scholar] [CrossRef]
- Valls, F.; Redondo, E.; Sánchez, A.; Fonseca, D.; Villagrasa, S.; Navarro, I. Simulated environments in architecture education. Improving the student motivation. In Proceedings of the Advances in Intelligent Systems and Computing; Springer: Cham, Switzeland, 2017. [Google Scholar]
- Contero, M.; Naya, F.; Company, P.; Saorín, J.L.; Conesa, J. Improving visualization skills in engineering education. IEEE Comput. Graph. Appl. 2005, 25, 24–31. [Google Scholar] [CrossRef]
- Navarro, I.; Galindo, A.; Fonseca, D. Augmented reality uses in educational research projects: The “Falcones Project”, a case study applying technology in the Humanities framework at high school level. In Proceedings of the ACM International Conference Proceeding Series; ACM Digital Library: Salamanca, Spain, 2013. [Google Scholar]
- de Ravé, E.G.; Jiménez-Hornero, F.J.; Ariza-Villaverde, A.B.; Taguas-Ruiz, J. DiedricAR: A mobile augmented reality system designed for the ubiquitous descriptive geometry learning. Multimed. Tools Appl. 2016, 75, 9641–9663. [Google Scholar] [CrossRef]
- Manzano-Agugliaro, F.; Castro-García, M.; Pérez-Romero, A.M.; García-Cruz, A.; Novas, N.; Salmerón-Manzano, E. Alternative methods for teaching cadastre and remote sensing. Surv. Rev. 2016, 48, 450–459. [Google Scholar] [CrossRef]
- Antón García, D.; Pérez Suárez, M. La docencia universitaria novel como mejora metodológica. Opcion 2015, 31, 104–124. [Google Scholar]
- Saorín, J.L.; de la Torre-Cantero, J.; Díaz, D.M.; López-Chao, V. Cloud-based collaborative 3D modeling to train engineers for the industry 4.0. Appl. Sci. 2019, 9, 4559. [Google Scholar] [CrossRef]
- Martín-Dorta, N.; Saorín, J.L.; Contero, M. Development of a fast remedial course to improve the spatial abilities of engineering students. J. Eng. Educ. 2008, 97, 505–513. [Google Scholar] [CrossRef]
- Sierra-Uria, E.; Garmendia-Mujika, M.; Garikano-Oxinaga, X.; Solaberrieta-Mendez, E. Reading technical drawings: A learning-teaching proposal for engineering schools. Dyna 2013, 88, 591–600. [Google Scholar]
- Ramírez-Juidías, E.; Tejero-Manzanares, J.; Amaro-Mellado, J.L.; Ridao-Ceballos, L. Developing experimental learning in a graphical course using thurstone’s law of comparative judgment. Eng. Lett. 2017, 25, 1–6. [Google Scholar]
- Melian, D.; Luis Saorin, J.; De La Torre-Cantero, J.; Lopez-Chao, V. Analysis of the Factorial Structure of Graphic Creativity of Engineering Students through Digital Manufacturing Techniques. Int. J. Eng. Educ. 2020, 36, 1151–1160. [Google Scholar]
- Redondo Dominguez, E.; Sanchez Riera, A.; Moya Sala, J.N.; Regot Marimon, J. La ciudad como aula digital. Enseñando urbanismo y arquitectura mediante mobile learning y la realidad aumentada. Un estudio de viabilidad y de caso. Archit. City Environ. 2012, 7, 27–54. [Google Scholar]
- Sánchez, A.; Redondo, E.; Fonseca, D.; Navarro, I. Hand-held augmented reality: Usability and academic performance assessment in educational environments. Case study of an engineering degree course. Information 2013, 16, 8621–8634. [Google Scholar]
- Del Rio-Guerra, M.S.; Martin-Gutierrez, J.; Lopez-Chao, V.A.; Parra, R.F.; Ramirez Sosa, M.A. AR Graphic representation of musical notes for self-learning on guitar. Appl. Sci. 2019, 9, 4527. [Google Scholar] [CrossRef]
- Domínguez, E.R.; Roma, G.S. Metodologías docentes basadas en interfases táctiles para la docencia del dibujo y los proyectos arquitectónicos. Arquiteturarevista 2010, 6, 90–105. [Google Scholar] [CrossRef]
- Alonso-Rodriguez, M.; Alvaro-Tordesillas, A.; Carazo-Lefort, E. Infographic restitution of the historic centre of the Spanish town of Oviedo. Comput. Environ. Urban Syst. 2017, 64, 154–168. [Google Scholar] [CrossRef]
- Llopis, J.; Torres, A.; Serra, J.; García, Á. The preservation of the chromatic image of historical cities as a cultural value. The old city of Valencia (Spain). J. Cult. Herit. 2015, 16, 611–622. [Google Scholar] [CrossRef]
- Rojas-Sola, J.I.; De la Morena-De la Fuente, E. Agustín de betancourt’s double-acting steam engine: Analysis through computer-aided engineering. Appl. Sci. 2018, 8, 2309. [Google Scholar] [CrossRef]
- Fonseca, D.; Navarro, I.; de Renteria, I.; Moreira, F.; Ferrer, Á.; de Reina, O. Assessment of Wearable Virtual Reality Technology for Visiting World Heritage Buildings: An Educational Approach. J. Educ. Comput. Res. 2018, 56, 940–973. [Google Scholar] [CrossRef]
- Angulo, R.; Pinto, F.; Rodríguez, J.; Palomino, A. Digital Anastylosis of the Remains of a Portal by Master Builder Hernán Ruiz: Knowledge Strategies, Methods and Modelling Results. Digit. Appl. Archaeol. Cult. Herit. 2017, 7, 32–41. [Google Scholar] [CrossRef]
- Chias, P.; Abad, T. The Botica or Apothecary in the Monastery of San Lorenzo el real de El Escorial (Madrid, Spain): Written sources, historic drawings, and new surveys applied to architectural analysis. Buildings 2018, 8, 4. [Google Scholar] [CrossRef]
- Tejero-Manzanares, J.; Garrido-Sáenz, I.; Pérez-Calle, M.D.; Montes-Tubío, F. Virtual reconstruction in recovery metallurgical heritage of almaden mines. Dyna 2013, 88, 299–307. [Google Scholar] [CrossRef]
- Carvajal-Ramírez, F.; Navarro-Ortega, A.D.; Agüera-Vega, F.; Martínez-Carricondo, P.; Mancini, F. Virtual reconstruction of damaged archaeological sites based on Unmanned Aerial Vehicle Photogrammetry and 3D modelling. Study case of a southeastern Iberia production area in the Bronze Age. Meas. J. Int. Meas. Confed. 2019, 136, 225–236. [Google Scholar] [CrossRef]
- Rodríguez-Moreno, C.; Reinoso-Gordo, J.F.; Rivas-Lpez, E.; Gmez-Blanco, A.; Ariza-Lpez, F.J.; Ariza-Lpez, I. From point cloud to BIM: An integrated workflow for documentation, research and modelling of architectural heritage. Surv. Rev. 2018, 50, 212–231. [Google Scholar] [CrossRef]
- Castellano-Román, M.; Pinto-Puerto, F. Dimensions and Levels of Knowledge in Heritage Building Information Modelling, HBIM: The model of the Charterhouse of Jerez (Cádiz, Spain). Digit. Appl. Archaeol. Cult. Herit. 2019, 14, e00110. [Google Scholar] [CrossRef]
- Antón, D.; Medjdoub, B.; Shrahily, R.; Moyano, J. Accuracy evaluation of the semi-automatic 3D modeling for historical building information models. Int. J. Archit. Herit. 2018, 12, 190–805. [Google Scholar] [CrossRef]
- Nieto, E.; Moyano, J.J.; García, Á. Construction study of the Palace of the Children of Don Gome (Andújar, Jaén), managed through the HBIM project. Virtual Archaeol. Rev. 2019, 10, 84–97. [Google Scholar] [CrossRef]
- Granado-Castro, G.; Aguilar-Camacho, J. Cartographic style in the first urban maps of Cadiz, Spain: A technique in transition. Cartogr. J. 2019, 56, 18–41. [Google Scholar] [CrossRef]
- Serrano, S.; Jiménez-Hornero, F.J.; Gutiérrez de Ravé, E.; Jodral, M.L. GIS design application for “Sierra Morena Honey” designation of origin. Comput. Electron. Agric. 2008, 64, 307–317. [Google Scholar] [CrossRef]
- Aguilar, F.J.; Fernandez-Luque, I.; Aguilar, M.A.; García Lorca, A.M.; Viciana, A.R. The integration of multi-source remote sensing data for the modelling of shoreline change rates in a mediterranean coastal sector. Int. J. Remote Sens. 2019, 40, 1148–1174. [Google Scholar] [CrossRef]
- Amaro-Mellado, J.L.; Morales-Esteban, A.; Martínez-Álvarez, F. Mapping of seismic parameters of the Iberian Peninsula by means of a geographic information system. Cent. Eur. J. Oper. Res. 2018, 26, 739–758. [Google Scholar] [CrossRef]
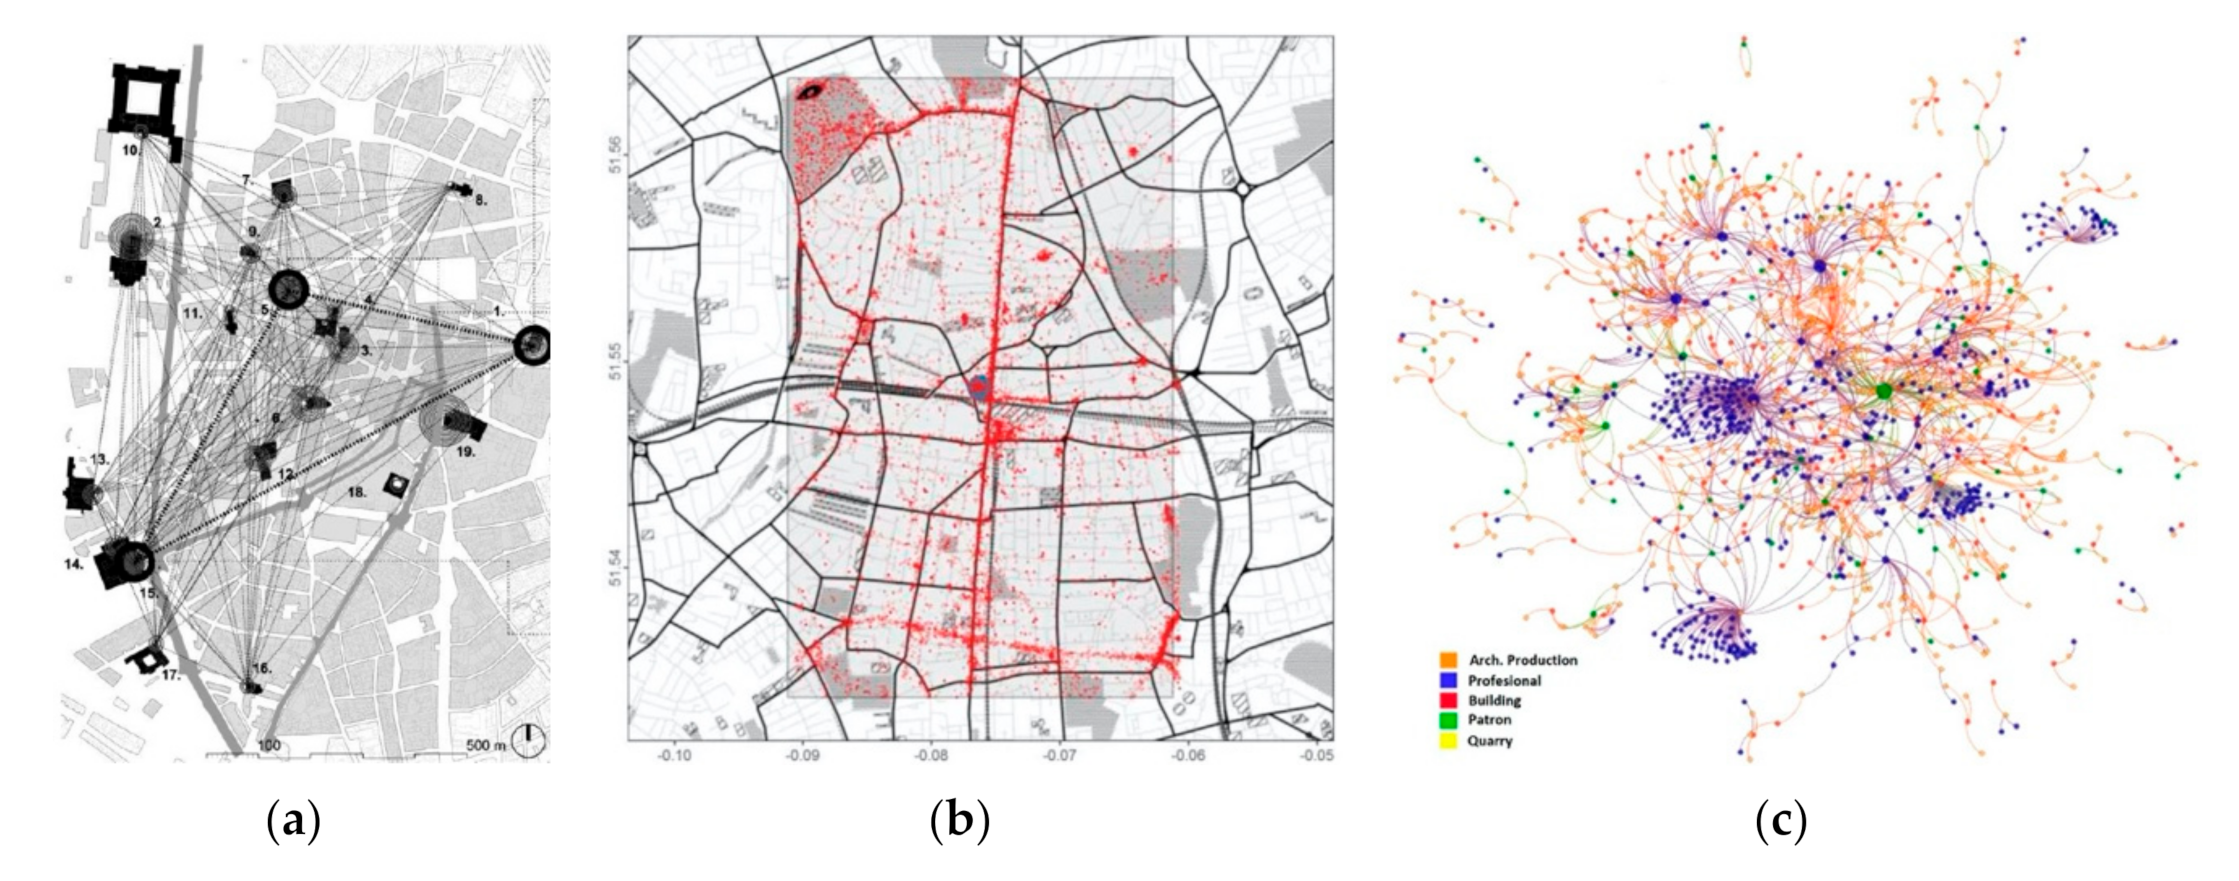
- Ferreira-Lopes, P.; Pinto-Puerto, F. GIS and graph models for social, temporal and spatial digital analysis in heritage: The case-study of ancient Kingdom of Seville Late Gothic production. Digit. Appl. Archaeol. Cult. Herit. 2018, 9, e00074. [Google Scholar] [CrossRef]
- Barrera-Vera, J.A.; Benavides-López, J.A. Handheld mobile mapping applied to historical urban areas. Disegnarecon 2018, 11, 20. [Google Scholar]
- Giménez, R.; Marzolff, I.; Campo, M.A.; Seeger, M.; Ries, J.B.; Casalí, J.; Álvarez-Mozos, J. Accuracy of high-resolution photogrammetric measurements of gullies with contrasting morphology. Earth Surf. Process. Landforms 2009, 34, 1915–1926. [Google Scholar] [CrossRef]
- Serrano, F.; Saumell, J.; Berenguer, F. Metric results analysis of point cloud and direct measure in building heritage. Sanctuary of “La Montaña” in Cáceres. Inf. Constr. 2014, 66. [Google Scholar] [CrossRef]
- Martínez-Rubio, A.; Sanz-Adan, F.; Santamaría-Peña, J.; Martínez, A. Evaluating solar irradiance over facades in high building cities, based on LiDAR technology. Appl. Energy 2016, 183, 133–147. [Google Scholar] [CrossRef]
- Torrecillas, C.; Berrocoso, M.; Pérez-López, R.; Torrecillas, M.D. Determination of volumetric variations and coastal changes due to historical volcanic eruptions using historical maps and remote-sensing at Deception Island (West-Antarctica). Geomorphology 2012, 136, 6–14. [Google Scholar] [CrossRef]
- Aguilar, M.A.; Nemmaoui, A.; Aguilar, F.J.; Qin, R. Quality assessment of digital surface models extracted from WorldView-2 and WorldView-3 stereo pairs over different land covers. GISci. Remote Sens. 2019, 56, 109–129. [Google Scholar] [CrossRef]
- García Sánchez, M.T. El diseño sonoro de la ciudad: Las campanas de Madrid a manos de Llorenç Barber. ACE Archit. City Environ. 2019, 41, 109. [Google Scholar] [CrossRef]
- Valls, F.; Redondo, E.; Fonseca, D.; Torres-Kompen, R.; Villagrasa, S.; Martí, N. Urban data and urban design: A data mining approach to architecture education. Telemat. Inform. 2018, 35, 1039–1052. [Google Scholar] [CrossRef]
- Cervero Sánchez, N.; Agustín Hernández, L. Evaluación gráfica de la rehabilitación urbana del poblado dirigido de Caño Roto. ACE Archit. City Environ. 2018. [Google Scholar] [CrossRef]
- Ortega Vidal, J.; Martínez Díaz, Á.; Muñoz de Pablo, M.J. La representación de la ciudad, entre la planta y el volumen: El plano del Prado y la maqueta de la Gran Vía de Madrid. EGA. Rev. Expr. Graf. Arquit. 2012, 17, 256–266. [Google Scholar] [CrossRef][Green Version]
- van Eck, N.J.; Waltman, L. Software survey: VOSviewer, a computer program for bibliometric mapping. Scientometrics 2010, 84, 523–538. [Google Scholar] [CrossRef]
- van Eck, N.J.; Waltman, L. Citation-based clustering of publications using CitNetExplorer and VOSviewer. Scientometrics 2017, 111, 1053–1070. [Google Scholar] [CrossRef]
- Leydesdorff, L.; Rafols, I. Interactive overlays: A new method for generating global journal maps from Web-of-Science data. J. Informetr. 2012, 6, 318–332. [Google Scholar] [CrossRef]
- Rojas-Sola, J.I.; Navarrete-Cortés, J.; Fernández-López, J.A.; Chaichio-Moreno, J.A. Scientific production in the graphic expression in engineering area at the Spanish universities: An approach to ISI Database. Rev. Española Doc. Cientifica 2008, 31, 190–204. [Google Scholar] [CrossRef]


| Conference | Research Topics |
|---|---|
| EGA | Theories, principles and masters; graphic representation; graphic analysis; geometry and projection; scale models, models and prototypes |
| APEGA | ICT applications; architectural drawing; graphical analysis of the building; virtual and augmented reality; BIM technology |
| INGEGRAF | Virtual approaches to interactive design; virtual design based on the prototype; CAD, CAE, IFC and BIM; image processing and analysis; geometric modeling and analysis; reverse engineering; virtual and augmented reality; building information modeling; photogrammetry and remote sensing |
| Conferences | Topics |
|---|---|
| EGA | Built and unbuilt graphic concepts; graphic concepts of heritage; artistic creations; phenomenology, perception and interaction; shape grammar |
| INGEGRAF | Creativity and innovation methods; collaborative engineering; management of intellectual and industrial property; design and research methods |
| Conference | Topics |
|---|---|
| APEGA | Interior design, technological design and industry; parametric design and digital fabrication |
| INGEGRAF | Green engineering and eco-design; user-centered design; design based on the product life cycle; robust design, reliability and maintenance; simulation-based modeling and design; ergonomics and human factors; global product development; integrated/advanced manufacturing; manufacturing process and production management; rapid prototyping; additive manufacturing; flexible assemblies; remanufacturing; Industry 4.0 |
| Conference | Topics |
|---|---|
| EGA | Theories and didactic models applied to architectural graphic expression; formal and informal learning; new media and contexts; interdisciplinary collaborations and contributions; teaching the graphic representation of architectural heritage |
| APEGA | Teaching innovation |
| INGEGRAF | Teaching of graphic expression; theoretical and applied geometry; graphic design; new approaches in teaching–learning processes; project-based learning; interactive 3D modeling |
| Conference | Topics |
| EGA | Documentation and graphic restitution; low-tech/high-tech interactions between tradition and innovation; analysis techniques; reconstruct and show what is no longer there; virtual and augmented reality to communicate and interpret the present, the past and the future; architectural heritage survey |
| APEGA | Drawing in the history of construction |
| INGEGRAF | Virtual environments; augmented reality in architecture, engineering and construction heritage and territory; conservation of industrial heritage |
| Conference | Topics |
|---|---|
| EGA | Historical and historiographic cartographies; new cartographies (Space Syntax, GIS, BIG DATA, analytical, perceptual, subjective cartographies, etc.); landscape representation (urban landscape, storytelling, urban sketching, etc.) |
| APEGA | Topography and cartography; remote sensing and GIS; technical projects; visual communication and smart city |
| INGEGRAF | Sustainable building; sustainable construction; geoinformation; data capture; urban regeneration |
| Cluster | Label | Weight (Links) | Weight (Total Link Strength) | Weight (Occurrences) |
|---|---|---|---|---|
| 1 | drawing | 179 | 2089 | 234 |
| architect | 170 | 1238 | 121 | |
| form | 153 | 859 | 72 | |
| art | 117 | 803 | 59 | |
| landscape | 124 | 652 | 59 | |
| 2 | vault | 105 | 1003 | 89 |
| century | 159 | 939 | 90 | |
| survey | 152 | 862 | 66 | |
| view | 153 | 764 | 60 | |
| map | 97 | 579 | 53 | |
| 3 | technology | 154 | 2126 | 143 |
| student | 123 | 2115 | 140 | |
| case study | 127 | 853 | 56 | |
| proposal | 160 | 846 | 71 | |
| user | 93 | 768 | 54 | |
| 4 | framework | 136 | 759 | 52 |
| integration | 114 | 474 | 30 | |
| communication | 89 | 386 | 28 | |
| intervention | 99 | 370 | 34 | |
| management | 89 | 349 | 34 |
| Cluster | Label | Weight (Links) | Weight (Total Link Strength) | Weight (Occurrences) |
|---|---|---|---|---|
| 1 | architect | 232 | 1397 | 121 |
| art | 154 | 999 | 59 | |
| form | 202 | 916 | 75 | |
| landscape | 150 | 631 | 50 | |
| idea | 146 | 595 | 40 | |
| 2 | student | 168 | 2171 | 140 |
| technology | 192 | 1953 | 128 | |
| case study | 171 | 860 | 56 | |
| user | 111 | 771 | 54 | |
| evaluation | 131 | 685 | 47 | |
| 3 | view | 193 | 792 | 60 |
| vault | 107 | 779 | 83 | |
| perspective | 144 | 551 | 56 | |
| cathedral | 84 | 313 | 24 | |
| collection | 124 | 313 | 25 | |
| 4 | color | 69 | 570 | 52 |
| influence | 115 | 370 | 33 | |
| criterium | 77 | 277 | 25 | |
| planning | 95 | 244 | 16 | |
| position | 72 | 229 | 14 | |
| 5 | tower | 52 | 424 | 40 |
| conservation | 90 | 367 | 31 | |
| monument | 89 | 325 | 28 | |
| palace | 72 | 265 | 27 | |
| photogrammetry | 81 | 227 | 26 | |
| 6 | territory | 107 | 346 | 31 |
| cultural heritage | 103 | 338 | 26 | |
| housing | 54 | 331 | 31 | |
| decision | 76 | 198 | 11 | |
| cartography | 68 | 174 | 19 | |
| 7 | integration | 136 | 539 | 30 |
| agent | 70 | 467 | 22 | |
| interaction | 99 | 423 | 25 | |
| communication | 101 | 390 | 28 | |
| simulation | 86 | 370 | 25 |
| Cluster | Label | Weight <Links> | Weight <Total Link Strength> | Weight <Occurrences> |
|---|---|---|---|---|
| 1 | architecture | 92 | 307 | 89 |
| surveys | 43 | 66 | 11 | |
| geometry | 22 | 35 | 18 | |
| architectural representation | 21 | 31 | 13 | |
| drawing | 16 | 31 | 41 | |
| 2 | cultural heritage | 45 | 103 | 23 |
| photogrammetry | 39 | 70 | 19 | |
| maps | 26 | 51 | 10 | |
| architectural design | 27 | 43 | 22 | |
| historic preservation | 23 | 43 | 7 | |
| 3 | students | 46 | 272 | 34 |
| education | 51 | 217 | 28 | |
| virtual reality | 43 | 137 | 22 | |
| education computing | 39 | 119 | 13 | |
| e-learning | 37 | 114 | 15 | |
| 4 | augmented reality | 48 | 218 | 35 |
| three dimensional computer graphics | 55 | 146 | 21 | |
| visualization | 45 | 140 | 19 | |
| user experience | 38 | 117 | 17 | |
| motivation | 28 | 94 | 10 |
Publisher’s Note: MDPI stays neutral with regard to jurisdictional claims in published maps and institutional affiliations. |
© 2020 by the authors. Licensee MDPI, Basel, Switzerland. This article is an open access article distributed under the terms and conditions of the Creative Commons Attribution (CC BY) license (http://creativecommons.org/licenses/by/4.0/).
Share and Cite
López-Chao, V.; Amado Lorenzo, A. Architectural Graphics Research: Topics and Trends through Cluster and Map Network Analyses. Symmetry 2020, 12, 1936. https://doi.org/10.3390/sym12121936
López-Chao V, Amado Lorenzo A. Architectural Graphics Research: Topics and Trends through Cluster and Map Network Analyses. Symmetry. 2020; 12(12):1936. https://doi.org/10.3390/sym12121936
Chicago/Turabian StyleLópez-Chao, Vicente, and Antonio Amado Lorenzo. 2020. "Architectural Graphics Research: Topics and Trends through Cluster and Map Network Analyses" Symmetry 12, no. 12: 1936. https://doi.org/10.3390/sym12121936
APA StyleLópez-Chao, V., & Amado Lorenzo, A. (2020). Architectural Graphics Research: Topics and Trends through Cluster and Map Network Analyses. Symmetry, 12(12), 1936. https://doi.org/10.3390/sym12121936