Article

EEG-Based EMG Estimation of Shoulder Joint for the Power Augmentation System of Upper Limbs

1
Maebashi Institute of Technology, Center for Regional Collaboration, 460-1, Kamisadori, Maebashi, Gunma 371-0816, Japan
2
Department of Systems Life Engineering, Graduate School of Engineering, Maebashi Institute of Technology, 460-1 Kamisadori, Maebashi, Gunma 371-0816, Japan
3
Department of Environment and Life Engineering, Graduate School of Engineering, Maebashi Institute of Technology, 460-1, Kamisadori, Maebashi, Gunma 371-0816, Japan
4
Department of Systems Life Engineering, Maebashi Institute of Technology, 460-1 Kamisadori, Maebashi, Gunma 371-0816, Japan
*
Authors to whom correspondence should be addressed.
Symmetry 2020, 12(11), 1851; https://doi.org/10.3390/sym12111851
Submission received: 8 October 2020 / Revised: 9 November 2020 / Accepted: 9 November 2020 / Published: 10 November 2020
(This article belongs to the Special Issue Biological Network Analysis and Synthesis for Symmetry)

Abstract

:
Brain–Machine Interfaces (BMIs) have attracted much attention in recent decades, mainly for their applications involving severely disabled people. Recently, research has been directed at enhancing the ability of healthy people by connecting their brains to external devices. However, there are currently no successful research reports focused on robotic power augmentation using electroencephalography (EEG) signals for the shoulder joint. In this study, a method is proposed to estimate the shoulder’s electromyography (EMG) signals from EEG signals based on the concept of a virtual flexor–extensor muscle. In addition, the EMG signal of the deltoid muscle is used as the virtual EMG signal to establish the EMG estimation model and evaluate the experimental results. Thus, the shoulder’s power can be augmented by estimated virtual EMG signals for the people wearing an EMG-based power augmentation exoskeleton robot. The estimated EMG signal is expressed via a linear combination of the features of EEG signals extracted by Independent Component Analysis, Short-time Fourier Transform, and Principal Component Analysis. The proposed method was verified experimentally, and the average of the estimation correlation coefficient across different subjects was 0.78 (±0.037). These results demonstrate the feasibility and potential of using EEG signals to provide power augmentation through BMI technology.

Graphical Abstract

1. Introduction

With the rapid aging of the population and the increase in the number of disabled people, the care burden increases as does the demand for power augmentation. For example, when transferring a patient from a bed to a wheelchair in caregiving or when carrying heavy objects in logistic centers or construction sites, our upper limbs endure a large amount of strain. In such tasks, the most dominant movements of the upper limbs are the flexion and extension of elbow and shoulder joints. Therefore, power augmentation for these joints is of importance.
Until now, various power augmentation exoskeleton robots have been developed [1,2,3,4,5], in which force/torque sensors [6,7,8] and/or electromyography (EMG) sensors [2,9,10,11,12] are commonly used to obtain control signals. As a result of the inherent delay of the physical sensor’s signals, biological signals are more widely used for control of the system [13]. Indeed, EMG-based power augmentation devices have shown effectiveness in detecting and following user’s motion intentions to allow volitional control [2,9,10,11,12,14]. For example, Hybrid Assistive Limb (HAL) is an outstanding example of a wearable exoskeleton controlled by EMG signals [2]. This controller allows for the robust and smooth generation of suitable motion patterns for different motion modes. We also developed a wearable upper limb exoskeleton robot based on EMG signals and successfully achieved power augmentation [15]. However, the EMG signal is only the response, not the source signal of the user’s motion intentions. When the number of functional muscles or neuromuscular information in the EMG signals from the limb is insufficient, the responsiveness decreases, which leads complications for EMG-based controls [16]. One possible solution to address this limitation is to estimate EMG signals from brain activity, which are the source of the motion intentions and can be used to predict (rather than respond) to the user’s motion intentions [17].
As a result of the burdens and high risks of heavy surgery, as well as issues related to the durability and stability of the implanted electrodes, it is difficult to employ invasive brain–machine interfaces (BMIs) in humans to steadily obtain brain activity for practical use [18]. Alternatively, electroencephalogram (EEG) is a convenient, non-invasive, and risk-free recording method for BMI systems, as compared with other approaches such as functional magnetic resonance imaging (fMRI) and magnetoencephalography (MEG). Moreover, it has high temporal discrimination and can measure large-scale neuronal activity in the brain at a low cost, as well as being easy to use in practical applications [19]. Thus, EEG signals are commonly used for non-invasive BMIs to obtain brain activity. Some studies have made various attempts and shown the possibility of decoding EMG signals from EEG signals [20,21,22]. fMRI data are generally used to improve spatial resolution [21], which is not suitable for power augmentation in practical applications due to its bulk, weight, and cost. Until now, there are still few successful reports of EMG estimation through non-invasive BMI compared with those of invasive recording. Furthermore, the majority of studies based on EEG signals focus on the elbow joint [20] or wrist [21], due to the relatively simple bone and muscle structures, and because they correspond to larger cortical areas of the brain. There is no report on the complicated shoulder joint for power augmentation based on EEG signals.
The reasons for the above are as follows. First, invasive electrodes can directly contact neurons and record the activity. However, EEG signals are contaminated with a lot of noise, which results in poor signal quality. Second, the EEG signals’ spatial discriminability is quite low. Intrinsically, EEG signals are mixed signals generated from spatially broad areas in a few scalp regions. Obviously, the recorded signals include signals from regions of no interest. Therefore, under the premise of knowing the contribution to the functions of interest, many studies have used invasive methods because that can directly record the corresponding neuron’s activity, making it easier to obtain higher estimation accuracy. Third, the shoulder joint is the most complex and the most flexible joint in the upper limb [23]. Any movements of the shoulder joint are driven by multiple muscles, including polyarticular muscles and others. Despite there being various approaches focused on the polyarticular muscle for controlling exoskeleton robots [12,24,25], there are currently no satisfactory solutions for power augmentation with the polyarticular muscle’s EMG signals. This is because functional separation from the EMG signal is difficult, before even approaching EEG signals. Thus, in this study, we used Independent Component Analysis (ICA) to clarify the location of the component to improve the spatial discriminability of EEG signals. This allowed us to easily eliminate the noise components and the components generated from regions of no interest to improve the quality of the signal. Moreover, to avoid dealing with the difficult problem of the polyarticular muscles and to simplify the estimation and control method, a new concept of virtual flexor–extensor muscle is herein introduced for EMG estimation.
The purpose of this study was to assess the feasibility of EMG estimation from EEG signals for power augmentation of the shoulder joint in activities of daily living. The main contributions of this paper can be summarized in the following two points.
Firstly, a new concept of virtual flexor–extensor muscle is introduced to represent all of the muscles driving the shoulder joint to perform flexion and extension. Consequently, the estimated EMG signal from EEG signals is assumed to be generated by this virtual flexor–extensor muscle, not by the actual muscles that co-activate the shoulder joint. This solves the problem of the inability to locate the relevant muscles due to the complicated shoulder structure. Secondly, the EMG signal is estimated from EEG signals based on an established model of EEG and EMG signals. Since power augmentation robots require high real-time performance, we focus on the frequency band below 45 Hz, which is different from previous studies that were limited to single low-frequency band data [20,22]. Furthermore, the power spectrum changes in each period during flexion and extension are interpreted with Short-time Fourier Transform (STFT) and Principal Component Analysis (PCA). Moreover, we further reduce the signals of the seven measurement channels to two-dimensional principal components through PCA, which cannot only retain most of the original feature information, but also effectively simplifies the calculation. Finally, a linear model for EMG estimation is established with PCA, and the results show that the EMG signal is successfully estimated during voluntary flexion and extension, which had an average r-value of more than 0.78 across three subjects. To the best of our knowledge, this study is the first to investigate an EEG-based exoskeleton’s power augmentation for the shoulder joint.

2. A Concept of a Virtual Flexor–Extensor Muscle

In this study, the concept of a virtual flexor–extensor muscle is introduced to avoid dealing with the difficult problem of polyarticular muscles and to simplify the model. The virtual flexor–extensor muscle represents all of the muscles, including the polyarticular muscles, agonist–antagonist muscles, and other muscles that co-activate the shoulder joint and generate the EMG signals for flexion and extension.
According to physiological anatomy and various previous studies [23,26], the deltoid muscle is the most sensitive to load from the many muscles that co-activate the shoulder joint. This means that the amplitude of the deltoid muscle’s EMG signal is the largest as compared with those of the other muscles under the same load.
Meanwhile, the EMG signal’s amplitude of the deltoid muscle is approximately linear with the torque generated by flexion and extension [23,27,28,29,30], since the joint torque is caused by the muscles contracting, which is almost linear with the EMG signal’s amplitude generated by the muscle [31,32,33,34].
Therefore, the EMG signal’s amplitude E M G d e l t of the deltoid muscle is linear with the virtual flexor–extensor muscle’s EMG signal E M G v m for flexion and extension of the shoulder joint.
Since the true EMG signal for flexion and extension of the shoulder joint cannot be directly measured, we used the EMG signal of the deltoid muscle when we established the EMG estimation model and evaluated the experimental results. After the model was established, there was no further need for EMG signal collection.

3. Materials and Methods

3.1. Experimental Setup

Three right-handed healthy adults (three males, no experience with BMI), between 22 and 34 years of age (mean: 28.33, standard error: 6.03), participated in this study. They were informed of the experimental protocols and consented to the study. This research was also approved by the Institutional Review Board at the Maebashi Institute of Technology.
Due to the accurate response frequency band of event-related desynchronization/synchronization of different subjects are different [35], a broadband of EEG signals without the direct current component should be used. Furthermore, the higher frequency bands (above 45 Hz) are heavily influenced by strong noises (e.g., utility frequency, etc.) and showed a poor signal-to-noise ratio. Thus, in this paper, we focus on changes in the EEG signal frequency band from 0.1–45 Hz for EMG estimation. This solution proved to be very robust, and the information contained in all the EEG motion-related potentials could be exploited fully [36].
As shown in Figure 1a,b, active electrodes g.GAMMAsys (g.tec medical engineering GmbH, Schiedlberg, Austria) were used for measuring the EEG signals, which can reduce the artifacts from motions and electromagnetic interference. Since the calculation cost rapidly escalates with the increase in the measurement points and it also takes time to set up the electrodes and fix each one in the correct position, we give priority to considering how to extract the EMG information included in EEG signals effectively while using the minimum number of electrodes. Fz, C3, C4, CP1, CP2, O1, and O2 (according to International 10–10 system) were selected as the EEG measurement points by considering the occurrence locations of frequency bands below 45 Hz, and EEG signals from these seven points were simultaneously recorded. A reference electrode was placed on the subject’s right ear lobe, and the ground electrode was set at a measurement point called TP10. An amplifier g.BSamp (g.tec medical engineering GmbH, Schiedlberg, Austria) was used to amplify the EEG signals from the electrodes. Simultaneously, the EMG signal at the anterior deltoid of the right shoulder was recorded. The EMG signal was measured with DELSYS’s electrodes and amplifiers (BAGNOLI-2 EMG system (Delsys, Inc., Natick, MA, USA)). The ground electrode of the EMG signal was placed on the subject’s right wrist. We moved the electrode to find the position with the largest amplitude during flexion/extension, and set it as the measurement point for EMG signals. The EEG and EMG signals were synchronized by a multifunctional interface board that performs data acquisition and analog-to-digital (A/D) conversion at a sampling frequency of 1000 Hz. Moreover, an elastic mesh was applied on top of the EEG cap (g.GAMMAcap) and the electrode wires were fixed on the subject’s back to minimize the motion artifacts and baseline drift during movements.

3.2. Task

As shown in Figure 1, the subject wore an exoskeleton robot to simulate the actual power augmentation scene and performed a shoulder flexion and extension within 15 s with eyes open. To eliminate the interference signals from the lower limbs, the subjects were in a sitting position. The subject was conscious of all movements for the whole, i.e., they were voluntary movements. The experiments comprised a total of 15 trials for each subject, and each trial included rest, the flexion movement, and the extension movement. In the flexion movement, the subjects flexed their right arm to an angle of about 90 degrees relative to the resting position. The extension movement was to extend the arm from the 90-degree position back to the resting position. Between the flexion and extension movement, the subject was made to hold the 90-degree position for about 2 s. After the extension movement, the subject took a short break and then proceeded with the next trial to avoid muscle fatigue. The subjects were instructed to refrain from other movements, such as eye movements, during the recording.

3.3. Model

The whole process of our proposed approach is shown in Figure 2. After the components were separated and selected by ICA, it was important to extract only the changes relevant to features of interest and establish the model for estimation. This was realized through the fluctuations in the amplitude of slow cortical potentials of EEG signals, such as 0.01–1 Hz [20] and 0.1–3 Hz [22]. However, as a result of individual differences, the activated frequency band of each EEG signal often differed [37], especially for very narrow bandwidths [38]. This leads to poor robustness and estimation accuracy. Moreover, this is not suitable for real-time control systems since the control cycle is long compared with that of high-frequency EEG signals. Therefore, STFT was used to extract the features that fluctuate in the power spectra in the EEG signal band of 0.1–45 Hz, and PCA was used to reduce the dimension to increase the computational speed. Then, PCA was further used to establish linear models between EEG and EMG signals for time series EMG estimation. This continuously reproduces human movements and realizes the power augmentation, which is a further step toward the development of multimodal BMIs for intuitive control of advanced power exoskeletons. The details are explained in the following subsection.

3.3.1. EEG and EMG Signal Pre-Processing and Independent Component Analysis (ICA)

After the Analog/Digital (A/D) conversion, the measured EEG signals were processed through a 4th order Butterworth high-pass filter with a cutoff frequency of 0.1 Hz to eliminate the baseline drift. Then, the filtered EEG data of each trial were decomposed into seven independent components (ICs) by ICA. After IC decomposition, IC properties were confirmed, and ICs were selected as follows. Firstly, the power spectrum of each component was confirmed. The low frequency band had higher energy, and as the frequency band rose, the components whose energy gradually decreased or changed little were regarded as EEG components. Secondly, the waveform of each trial of each component was confirmed. The fluctuation of the waveform was evenly distributed in each trial, indicating that this component had reproducibility and was related to repetitive movement tasks. On the contrary, the components whose power was mainly concentrated on certain trials were regarded as random noise components, including body movement, head movement, etc. In the IC map, the components whose energy was concentrated in the front, whose low-frequency energy was high, and whose waves randomly appeared in pulselike waveforms in each trial were judged to be eye movements or blink components. After IC selection, the EEG signals of 0.1–45 Hz were obtained by a 4th order Butterworth low-pass filter at a cutoff frequency of 45 Hz.
EMG signal processing was as follows. The measured EMG signals converted by A/D conversion were processed by full-wave rectification and a 20-point moving average. In our study, we aim at obtaining the smooth envelope of the EMG signal which is more conducive to the control of the exoskeleton. A filter of the cutoff frequency of 0.7 Hz can remove sudden fluctuations, and has a small delay, compared to those filters of cutoff frequency from 0.1 to 3 Hz in our preliminary experiments. Moreover, the frequency distribution of the raw EMG signals after full-wave rectification and 20 points moving average is changed, and concentrated in the low-frequency band (about 1 Hz), so there is no effect on the component of EMG signals with smoothing by a cutoff frequency of 0.7 Hz. Thus, the signals were then smoothed by a 1st order Butterworth low-pass filter at a cutoff frequency of 0.7 Hz. Since the amplitude of the processed EMG signals was significantly reduced compared to the original signal due to signal processing, the recovery factor was set to 2 to restore the original amplitude of the EMG signals.

3.3.2. Feature Extraction by STFT and PCA

To guarantee the future real-time control of the power augmentation system, STFT was executed on the pre-processed EEG signals and their power spectra were obtained. In STFT, a Hanning window function was used with a width of 1024 points, and the length of each data segment was set to 1024 points. The value of the overlap was set to 99% to make the constructed system update every 10.24 milliseconds. Further, the integral value of the spectra between 0.1 Hz and 45 Hz was calculated.
From the mathematical point of view, PCA aims to finds the new dimension with the largest variation and minimize the projection error to minimize information loss [39]. This means PCA can be used as a tool through data reduction or filtering for data exploration to detect and summarize features that may escape visual inspection. Because of its simple principle, low computational cost, and high reliability, PCA was used to further extract features from the STFT results in our study. Since the redundant information is removed from the STFT results, the features are more distinguishable after PCA. Concretely, PCA was used to calculate the covariance matrix or correlation matrix of STFT results to obtain the eigenvalues to identify the largest direction of change. Each eigenvalue corresponds to an eigenvector and a new principal component, which can be obtained by rotating the STFT results (the original data) with the eigenvectors.
The changes in EEG associated with shoulder joint motion are described as follows.
Z = E · S
where Z = [ z 1 , , z i , , z 7 ] T , z i ( i = 1 , , 7 ) is the principal component vector calculated from the STFT results of EEG signals S ; E = [ e 1 , , e i , , e 7 ] T , e i = [ e i 1 , , e i j , , e i 7 ] , e i j is the eigenvector of the STFT results from channel i; i = 1 , , 7 is the number of electrodes used in the measurement; and S = [ Fz, C3, C4, CP1, CP2, O1, O2 ] T is the STFT results from seven measurement points.
Herein, Z is a new set of linearly unrelated data, and it represents the minimum projected value of STFT results in each linearly unrelated direction. Taking into account our task, in which only the flexion and extension of the shoulder joint was performed, the covariance of EEG signals was mainly generated from the changes in EEG signals due to flexion and extension of the shoulder joint. Thus, the largest component of this dataset corresponded to the most dominant changes in EEG signals caused by the motion of the shoulder joint, which, in our study, was defined as the motion-related feature of the EEG signals.

3.3.3. PCA-Based EEG—EMG Model

In this paper, PCA was also used to establish a linear model between the EEG signals and the EMG signal; this was then used to estimate the EMG signals from the EEG signals as shown in Figure 2.
Firstly, the EEG principal component z u ( u = 1 , 2 ) obtained from (1) and the measured EMG signals y of the deltoid muscle were used to construct the EEG–EMG linear model, which is described below:
F = E · X = [ E v 1 , E v 2 , E vy ] · [ z 1 , z 2 , y ] T
where each principal component f v ( v = 1 , 2 , 3 ) is a linear combination of EEG and EMG signals, and the weight values of the linear combination are the eigenvectors E v 1 , E v 2 , and E vy ( v = 1 , 2 , 3 ), corresponding to the EEG principal component z u ( u = 1 , 2 ) and the measured EMG signals y, respectively. The construction process of the EEG–EMG linear model is shown in the upper frame of Figure 2.
Consequently, the EMG signals estimated from each principal component based on (2) can be obtained as follows:
y ^ v = f v u = 1 2 e v u z u e v y
The EMG signals used for exoskeleton control can be estimated from the following equation:
y ^ = v = 1 3 y ^ v η v
where η v is the contribution rate of each principal component. It also expresses the contribution of one eigenvalue λ i in m eigenvalues, which is described as follows:
η i = λ i j = 1 m λ j
The larger the value of η i , the greater the contribution of this component to the changes in all the data. The estimation process of the EMG signal is shown in the lower frame of Figure 2.
Finally, we calculated Pearson’s correlation coefficient (r-value) between the estimated EMG and the measured EMG to quantify how well the two waveforms matched. Cross-validation was applied so that every trial was used to validate the model.

4. Data Analysis and Results

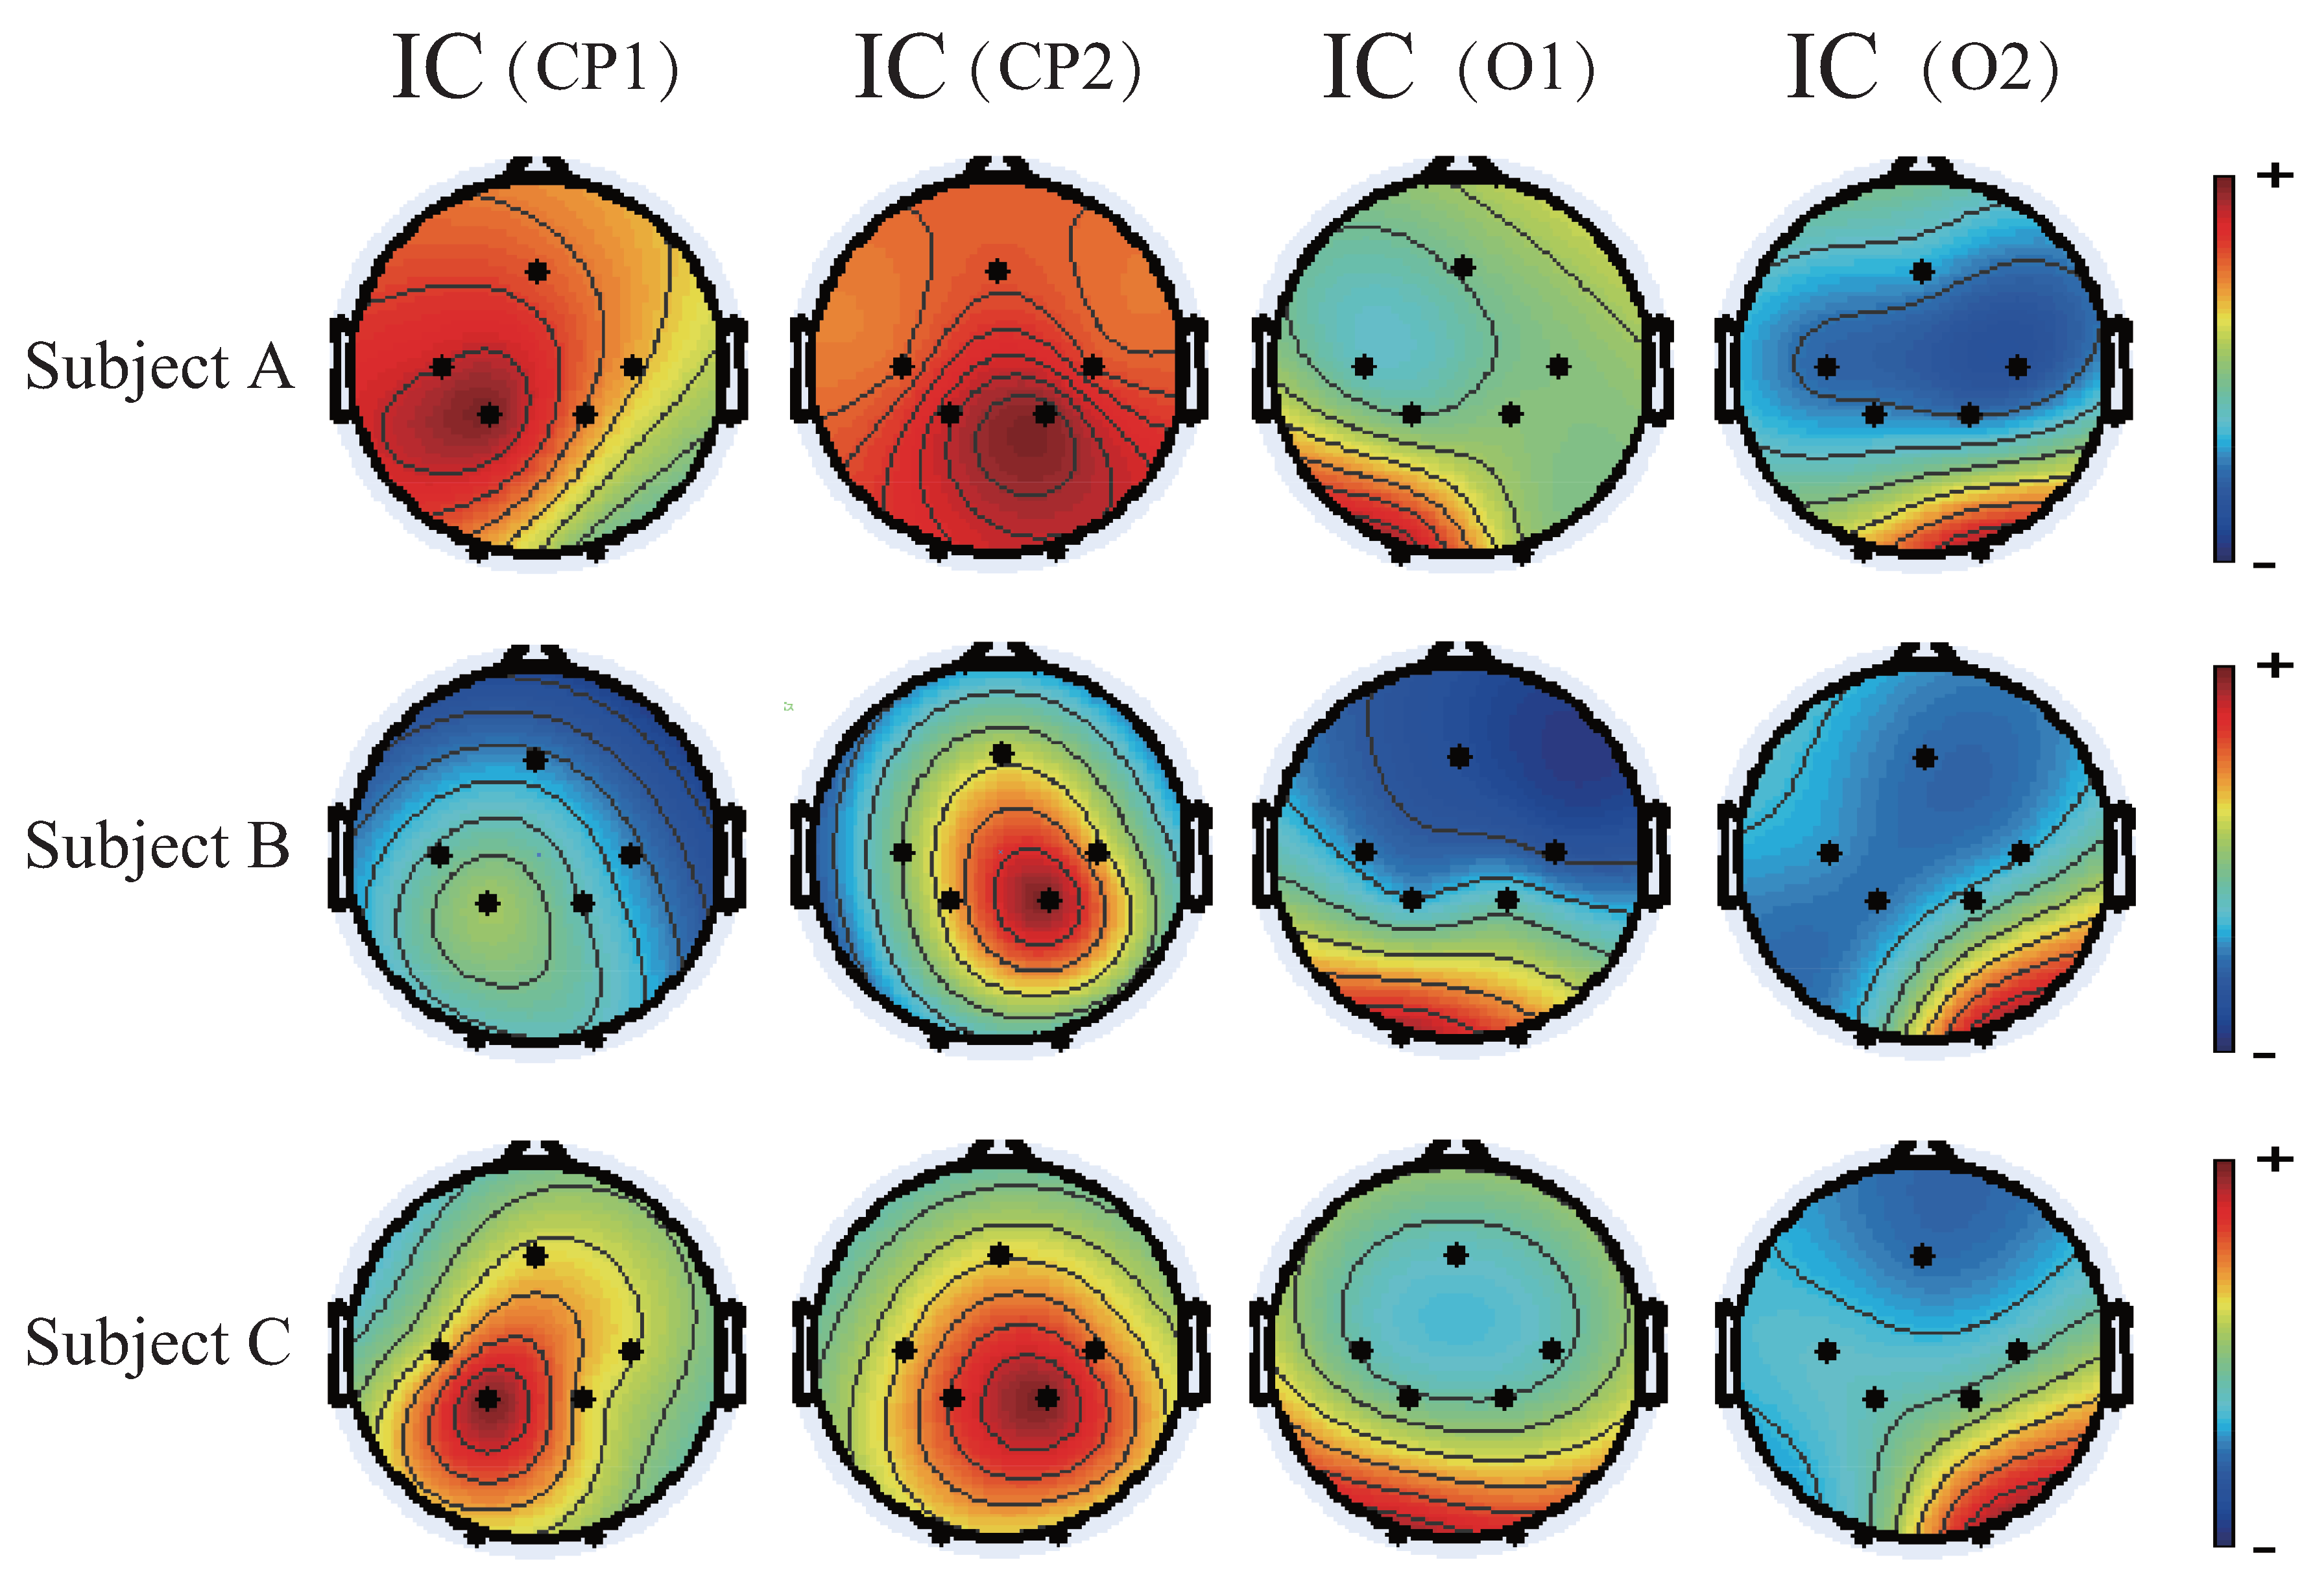
4.1. Motion-Related Independent Components

After IC selection, various components with similar scalp distributions in each trial were found across different subjects. The topographies of these independent components are summarized in Figure 3. In Figure 3, for example, the components whose signals at CP2 were significantly larger (red color denotes greater intensity) than other measurement points (green color denotes equal to zero) were observed in all the subjects. Similarly, other components whose signals were mainly concentrated at CP1, O1, and O2 were also observed. On the basis of the design of the experimental task, we concluded that the information associated with the flexion and extension of the shoulder joint was likely to be contained in these four ICs. Thus, these four components were selected as the components associated with the flexion and extension of the shoulder joint, and other ICs were neglected as artifacts. Then, these four ICs were projected back to the seven scalp channels to obtain the EEG data associated with the motion without artifacts for further analysis and feature extraction.

4.2. Feature Extraction by STFT and PCA

The STFT results of subject A are shown in Figure 4. The seven figures from left to right and top to bottom in sequences are the STFT results of seven measurement points.
The results of each measurement point consist of three subfigures. Each figure in the top row shows three-dimensional STFT results. The figure in the middle row is the spectrogram of STFT results. The amplitude of the power spectrum is mapped from blue to red, denoting zero to the maximum value. The bottom figure represents the results of the EMG signals. The green part is the full-wave rectified result of the measured raw EMG signals. The red curve is the EMG signal result after pre-processing, which accurately represents the amplitude of the measured EMG signals. Thus, it was used as an input signal in the EEG–EMG model.
From the spectrogram, it was confirmed that from 1 to 2 s before the motion started (when the EMG signal rapidly arises), the power spectrum of the low-frequency band (lower than 7 Hz), the μ rhythm (7–11 Hz) at the Fz (in the supplementary motor area), and C3 and C4 (in the primary motor cortex area) increased. The moment after motion started (when flexing is beginning), the power of the low-frequency band increased and reached the maximum level before the EMG signal amplitude reached the maximum at Fz, C3, C4, CP1, and CP2 in the motor cortex. However, the power of the low-frequency band at O1 and O2 (in the primary visual cortex) began to increase, and then reached the maximum after the EMG signal amplitude reached the maximum level. Moreover, the power spectrum of the μ rhythm in all channels began to decrease compared to that of the rest. At the moment when the shoulder joint began to flex (when the EMG started to decrease), the power spectrum in the low-frequency band increased again in all channels. After that, since the subject began to rest, the power spectra of the μ rhythm increased, and the power spectra of the β waves (13–25 Hz) began to decrease, as compared to during motion.
PCA was then used for feature extraction of the principal variation of STFT results, including those features that escaped visual inspection in the time-frequency domain at the seven measurement points and the data dimensionality reduction for the EEG–EMG model construction. The results before and after PCA are shown in Figure 5. The left figures show the STFT results of each measurement point. The horizontal axis is time, and the vertical axis is the integral value of the power spectra of 0.1–45 Hz after STFT. The right figures show the PCA results of the left figure, which includes seven principal components (PCs).
The contribution rates η in (5) of the first and second principal components of each subject are summarized in Table 1. From the table, we know that the first principal component (PC1)’s average contribution rate for subject A reached 73.7 ± 10.1% over 15 trials, in which the maximum was 91.2%, and the minimum was 58.3%. Similarly, PC2, which was the component with the largest variance of the remaining information after removing the information contained in PC1, had a maximum contribution rate of 25.0% and a minimum of 6.23%, with an average of 16.1 ± 6.00%. From the results of the cumulative contribution ratio of PC1 and PC2, we can see that the maximum value was 97.6%, the minimum value was 82.0%, and the average was 89.8 ± 5.26% over 15 trials. Specifically, the information included in these two PCs alone represented 89.8% of the information included in all seven measurement points. Similarly, the results of subjects B and C are shown in Table 1. These results show that the first and second principal components alone already accounted for more than 80% of the information of STFT from the seven measurement points. This means that other components would not have a significant effect on the construction of the EEG–EMG model. Therefore, the system could be reduced to the second-order PCA space from the seven-order space. In summary, the first and second principal components were used for model construction, the third PC to the seventh PC were neglected in this study.

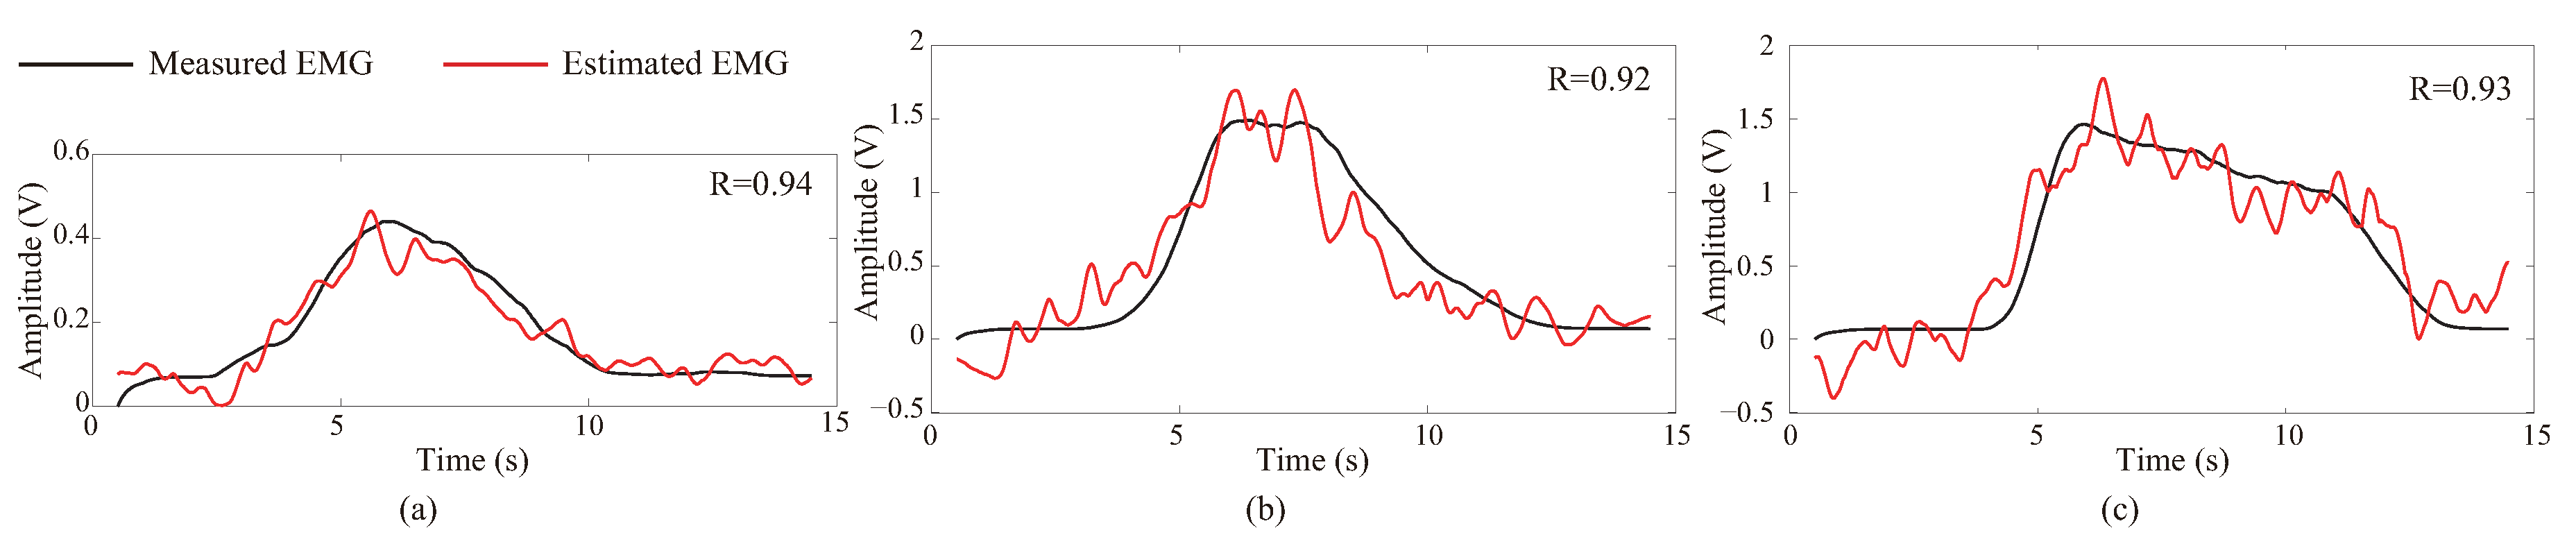
4.3. Results of EMG Estimation

The EMG signals estimated from the EEG signals with (4) are shown in Figure 6. The three figures correspond to the results of subjects A, B, and C from left to right, respectively. The solid black line and the solid red line in each figure represent the measured and estimated EMG signals, respectively. The horizontal axis is time, and the vertical axis is the amplitude of EMG signals. We can observe that the estimated and measured EMG signals had a consistent trend; the correlation coefficient R between the estimated and the measured EMG signals was as high as 0.94.
To evaluate the constructed system and make it more reliable and stable, data from 15 trials for each subject were cross-validated, and a total of 210 sets of estimation results were obtained for each subject. The correlation coefficient and its standard error were used to confirm the validity of the proposed method and evaluate the estimation accuracy of the model trained with the training dataset. The results are shown in Table 2.
For subject A, the average of the correlation coefficients was 0.74 and the standard error was 0.004. Similarly, for subject B, the average of the correlation coefficients was 0.83 and the standard error was 0.002. For subject C, the average of the correlation coefficients was 0.77 and the standard error was 0.002. From the results of the three subjects, the average R value was 0.78, and the R 2 was 0.61. The results of the standard error indicate that the model can estimate the EMG signals at similar accuracies within each task. Specifically, the estimated EMG signals and the measured signals demonstrated a high degree of fitness, which proves the proposed method is valid and effective.

5. Discussion

In this study, a new concept of a virtual flexor–extensor muscle was introduced to model all of the muscles that drive the shoulder joint for flexion and extension. We also propose a method to estimate the shoulder’s EMG from EEG signals based on the concept of a virtual flexor–extensor muscle for power augmentation during voluntary flexion and extension of the shoulder joint. That is, the EMG signals were expressed through the linear combination of the EEG features. We showed that estimation is possible, achieving an r-value of more than 0.74, and an average of 0.78 (±0.037) across three subjects. The average r-value was 0.78 ( R 2 = 0.61) means the estimated EMG signals had a high correlation with the measured ones. That also means the performance of the EMG estimation in our study is comparable to previous studies, including results from invasive neural recording technology, in which the EMG envelope is reconstructed. Table 3 reviews the EMG Estimation results for brain activity from previous research. The results of our study prove the feasibility of using noninvasive scalp EEG to develop a BMI system for power augmentation. To the best of our knowledge, this study is the first to investigate an EEG-based exoskeleton’s power augmentation for the shoulder joint.
The lack of progress so far in this field is due to the difficulty of signal processing and feature extraction of EEG signals. It is well known that environmental noise, body motion, line noise, muscle noise, eye movements/blinks, and cardiac signals are also recorded during EEG measurements. This causes many serious problems for EEG signal interpretation and analysis. We can solve this problem by rejecting the contaminated EEG segments, but this results in an unacceptable level of data loss. Regression is often used in the time domain [40,41,42] or frequency domain [43,44] to derive the parameters of the artifact’s appearance and spread in the EEG channels. However, the relevant EEG signals will also inevitably be subtracted when removing the artifacts. Furthermore, regression methods become more problematic when the regressing channel for the artifact source is not reliable, such as is the case with muscle artifacts, line noise, electrode noise. In [45], they showed that the PCA method can remove ocular artifacts more effectively than regression or using spatiotemporal dipole models [46]. However, some artifacts cannot be completely separated from brain activity using PCA methods, especially when they all have comparable amplitudes [47]. In [48], they showed that the contamination can be effectively detected, separated, and removed from a variety of artifactual sources using ICA during EEG recording, and the results compare favorably with those obtained using regression and PCA methods. Specifically, the “real” EEG signal can be obtained by eliminating the contributions of the artifact sources, since the independent time courses of the brain and the artifact sources are defined. In this study, ICA, STFT, and PCA were used to extract the EMG-related information of the shoulder joint from EEG signals. STFT was used to focus on the power spectra changes in specific frequency bands over time from the four motion-related components extracted by ICA. Then, PCA was used to synthesize the information from seven measurement channels to reconstruct the seven linearly unrelated components with the largest variance; the first two principal components were set as the EEG features of flexion and extension of the shoulder joint in this paper. Moreover, our results show that the system can estimate EMG signals at similar accuracy over 210 trials. These results indicate that there are fairly common neural characteristics for each task. This also proves the effectiveness of signal processing and the correctness of the extracted features using ICA, STFT, and PCA.
Regarding the distribution of EEG components on the scalp (the IC map) during shoulder flexion and extension movements, we found that these components are symmetrically distributed and are reflected both in the left (CP1, O1) and right (CP2, O2) hemispheres. This result also indicates that the brain not only uses the motor cortex area, but the entire brain performs coordinated operations to complete a movement.
One of the limitations of our research is the small number of subjects. For this reason, it is uncertain whether the current research can be extended to the population. However, the purpose of this study was to prove the feasibility of using EEG signals for power augmentation and to justify the rationality of future applications to test the effectiveness of this method on the population level. The feasibility of EMG estimation using EEG signals for power augmentation is demonstrated by the excellent results and very small standard error for EMG estimation, as shown in Table 2, as well as the fact that none of the subjects in this study had experience with BMIs.
The construction of a closed-loop system is also essential for the control of the power augmentation system. Future work will focus on how subjects learn to use the closed-loop BMI to control the power augmentation system. We expect that the learning effect will change the neural activity related to EMG signals, which may affect the performance of EMG estimation.

6. Conclusions

This paper aimed to realize robotic power augmentation by using EEG signals for the shoulder joint. A method is proposed to estimate the shoulder’s EMG signals from EEG signals based on the concept of a virtual flexor–extensor muscle, which can avoid dealing with the difficult problem of the polyarticular muscles. Thus, the shoulder’s power can be augmented by estimated virtual EMG signals for the people wearing an EMG-based power augmentation exoskeleton robot. The proposed method was verified experimentally, and the results indicate that the estimation of EMG signals based on EEG signals is feasible. Specifically, EEG signals can be used to control an EMG-based exoskeleton and achieve power augmentation. To the best of our knowledge, the current study is the first to investigate an EEG-based exoskeleton’s power augmentation for the shoulder joint.

Author Contributions

Data curation, H.L.; Formal analysis, H.L.; Investigation, H.L.; Methodology, H.L. and C.Z.; Project administration, C.Z.; Software, H.L.; Validation, H.L., C.Z., Y.Y., M.M., C.L., N.U. and P.L.; Writing—original draft, H.L.; Writing—review and editing, C.Z. All authors have read and agreed to the published version of the manuscript.

Funding

This work was partly supported by JSPS KAKENHI Grant Number JP15K00362 and JP24500240.

Conflicts of Interest

The authors declare no conflict of interest. The content is solely the responsibility of the authors.

Abbreviations

The following abbreviations are used in this manuscript:
BMIBrain-machine interface
EEGElectroencephalography
EMGElectromyography
HALHybrid Assistive Limb
fMRIfunctional magnetic resonance imaging
MEGmagnetoencephalography
ICAIndependent component analysis
STFTShort-time Fourier transform
PCAPrincipal component analysis
A/DAnalog/Digital
ICIndependent component
PCPrincipal component

References

  1. Herr, H. Exoskeletons and orthoses: Classification, design challenges and future directions. J. Neuroeng. Rehabil. 2009, 6, 1–9. [Google Scholar] [CrossRef] [Green Version]
  2. Sankai, Y. HAL: Hybrid assistive limb based on cybernics. In Robotics Research; Springer: Berlin/Heidelberg, Germany, 2010; pp. 25–34. [Google Scholar]
  3. Kiguchi, K.; Hayashi, Y. An EMG-based control for an upper-limb power-assist exoskeleton robot. IEEE Trans. Syst. Man Cybern. Part B Cybern. 2012, 42, 1064–1071. [Google Scholar] [CrossRef] [PubMed]
  4. Gopura, R.A.; Kiguchi, K.; Li, Y. SUEFUL-7: A 7DOF upper-limb exoskeleton robot with muscle-model-oriented EMG-based control. In Proceedings of the IEEE/RSJ International Conference on Intelligent Robots and Systems, St. Louis, MO, USA, 10–15 October 2009; pp. 1126–1131. [Google Scholar]
  5. Strausser, K.A.; Kazerooni, H. The development and testing of a human machine interface for a mobile medical exoskeleton. In Proceedings of the IEEE/RSJ International Conference on Intelligent Robots and Systems, San Francisco, CA, USA, 25–30 September 2011; pp. 4911–4916. [Google Scholar]
  6. Huo, W.; Huang, J.; Wang, Y.; Wu, J.; Cheng, L. Control of upper-limb power-assist exoskeleton based on motion intention recognition. In Proceedings of the 2011 IEEE International Conference on Robotics and Automation, Shanghai, China, 9–13 May 2011; pp. 2243–2248. [Google Scholar]
  7. Huang, J.; Huo, W.; Xu, W.; Mohammed, S.; Amirat, Y. Control of upper-limb power-assist exoskeleton using a human-robot interface based on motion intention recognition. IEEE Trans. Autom. Sci. Eng. 2015, 12, 1257–1270. [Google Scholar] [CrossRef]
  8. Gopura, R.A.R.C.; Kiguchi, K. Development of a 6DOF exoskeleton robot for human upper-limb motion assist. In Proceedings of the 2008 4th International Conference on Information and Automation for Sustainability, Colombo, Sri Lanka, 12–14 December 2008; pp. 13–18. [Google Scholar]
  9. Lenzi, T.; De Rossi, S.; Vitiello, N.; Carrozza, M. Proportional emg control for upper-limb powered exoskeletons. In Proceedings of the Engineering in Medicine and Biology Society, EMBC, 2011 Annual International Conference of the IEEE, Boston, MA, USA, 30 August–3 September 2011; pp. 628–631. [Google Scholar]
  10. Lenzi, T.; De Rossi, S.; Vitiello, N.; Chiri, A.; Roccella, S.; Giovacchini, F.; Vecchi, F.; Carrozza, M.C. The neuro-robotics paradigm: NEURARM, NEUROExos, HANDEXOS. In Proceedings of the 2009 Annual International Conference of the IEEE Engineering in Medicine and Biology Society, Minneapolis, MN, USA, 3–6 September 2009; pp. 2430–2433. [Google Scholar]
  11. Gopura, R.D.; Bandara, S.V.; Gunasekara, J.M.P.; Jayawardane, T.S.S. Recent trends in EMG-Based control methods for assistive robots. Electrodiag. New Front. Clin. Res. 2013, 237–268. [Google Scholar] [CrossRef] [Green Version]
  12. Kiguchi, K.; Tanaka, T.; Fukuda, T. Neuro-fuzzy control of a robotic exoskeleton with EMG signals. IEEE Trans. Fuzzy Syst. 2004, 12, 481–490. [Google Scholar] [CrossRef]
  13. Tariq, M.; Trivailo, P.M.; Simic, M. EEG-based BCI control schemes for lower-limb assistive-robots. Front. Hum. Neurosci. 2018, 12, 312. [Google Scholar] [CrossRef] [Green Version]
  14. Tucker, M.R.; Olivier, J.; Pagel, A.; Bleuler, H.; Bouri, M.; Lambercy, O.; del RMillan, J.; Riener, R.; Vallery, H.; Gassert, R. Control strategies for active lower extremity prosthetics and orthotics: A review. J. Neuroeng. Rehabil. 2015, 12, 1. [Google Scholar] [CrossRef] [Green Version]
  15. Liu, C.; Zhu, C.; Liang, H.; Yoshioka, M.; Murata, Y.; Yu, Y. Development of A Light Wearable Exoskeleton for Upper Extremity Augmentation. In Proceedings of the 2016 23rd International Conference on Mechatronics and Machine Vision in Practice (M2VIP 2016), Nanjing, China, 28–30 November 2016; Volume 11, pp. 1–6. [Google Scholar]
  16. Huang, H.; Kuiken, T.A.; Lipschutz, R.D. A Strategy for Identifying Locomotion Modes Using Surface Electromyography. IEEE Trans. Biomed. Eng. 2009, 56, 65–73. [Google Scholar] [CrossRef] [Green Version]
  17. Kuai, H.; Zhong, N. The extensible Data-Brain model: Architecture, applications and directions. J. Comput. Sci. 2020, 101103. [Google Scholar] [CrossRef]
  18. Lebedev, M.A.; Nicolelis, M.A.L. Brain-machine interfaces: From basic science to neuroprostheses and neurorehabilitation. Physiol. Rev. 2017, 97, 767–837. [Google Scholar] [CrossRef]
  19. Birbaumer, N. Breaking the silence: Brain–computer interfaces (BCI) for communication and motor control. Psychophysiology 2006, 43, 517–532. [Google Scholar] [CrossRef] [PubMed]
  20. Paek, A.Y.; Brown, J.D.; Gillespie, R.B.; O’Malley, M.K.; Shewokis, P.A.; Contreras-Vidal, J.L. Reconstructing surface emg from scalp eegs during myoelectric control of a closed looped prosthetic device. In Proceedings of the 2013 35th Annual International Conference of the IEEE Engineering in Medicine and Biology Society (EMBC), Osaka, Japan, 3–7 July 2013; pp. 5602–5605. [Google Scholar]
  21. Yoshimura, N.; Dasalla, C.S.; Hanakawa, T.; Sato, M.A.; Koike, Y. Reconstruction of flexor and extensor muscle activities from electroencephalography cortical currents. NeuroImage 2012, 59, 1324–1337. [Google Scholar] [CrossRef] [PubMed]
  22. Nakagome, S.; Luu, T.P.; Brantley, J.A.; Contreras-Vidal, J.L. Prediction of EMG envelopes of multiple terrains over-ground walking from EEG signals using an unscented Kalman filter. In Proceedings of the 2017 IEEE International Conference on Systems, Man, and Cybernetics (SMC), Banff, AB, Canada, 5–8 October 2017; pp. 3175–3178. [Google Scholar]
  23. Schünke, M.; Schulte, E.; Schumacher, U. Prometheus LernAtlas der Anatomie; Thieme: New York, NY, USA, 2012. [Google Scholar]
  24. Kiguchi, K.; Fukuda, T. A 3 DOF exoskeleton for upper limb motion assist: Consideration of the effect of bi-articular muscles. In Proceedings of the IEEE International Conference on Robotics and Automation, New Orleans, LA, USA, 26 April–1 May 2004; pp. 2424–2429. [Google Scholar]
  25. Junius, K.; Moltedo, M.; Cherelle, P.; Rodriguez-Guerrero, C.; Vanderborght, B.; Lefeber, D. Biarticular elements as a contributor to energy efficiency: Biomechanical review and application in bio-inspired robotics. Bioinspir. Biomimetics 2017, 12, 061001. [Google Scholar] [CrossRef] [PubMed] [Green Version]
  26. Beuchat, N.J.; Chavarriaga, R.; Degallier, S.; del R Millan, J. Offline decoding of upper limb muscle synergies from eeg slow cortical potentials. In Proceedings of the 2013 35th Annual International Conference of the IEEE Engineering in Medicine and Biology Society (EMBC), Osaka, Japan, 3–7 July 2013; pp. 3594–3597. [Google Scholar]
  27. Wattanaprakornkul, D.; Halaki, M.; Boettcher, C.; Cathers, I.; Ginn, K.A. A comprehensive analysis of muscle recruitment patterns during shoulder flexion: An electromyographic study. Clin. Anat. 2011, 24, 619–626. [Google Scholar] [CrossRef] [PubMed]
  28. Kronberg, M.; Németh, G.; Broström, L.A. Muscle activity and coordination in the normal shoulder. An electromyographic study. Clin. Orthop. Relat. Res. 1990, 257, 76–85. [Google Scholar]
  29. Wattanaprakornkul, D.; Cathers, I.; Halaki, M.; Ginn, K.A. The rotator cuff muscles have a direction specific recruitment pattern during shoulder flexion and extension exercises. J. Sci. Med. Sport 2011, 14, 376–382. [Google Scholar] [CrossRef]
  30. Kuechle, D.K.; Newman, S.R.; Itoi, E.; Morrey, B.F.; An, K.N. Shoulder muscle moment arms during horizontal flexion and elevation. J. Shoulder Elbow Surg. 1997, 6, 429–439. [Google Scholar] [CrossRef]
  31. Clancy, E.A.; Hogan, N. Relating agonist-antagonist electromyograms to joint torque during isometric, quasiisotonic, nonfatiguing contractions. IEEE Trans. Biomed. Eng. 1997, 41, 1024–1028. [Google Scholar] [CrossRef]
  32. Hof, A.L.; Van Den Berg, J.W. Linearity between the weighted sum of the EMGs of the human triceps surae and the total torque. J. Biomech. 1977, 10, 529–539. [Google Scholar] [CrossRef]
  33. Kutch, J.J.; Buchanan, T.S. Human elbow joint torque is linearly encoded in electromyographic signals from multiple muscles. Neurosci. Lett. 2001, 311, 97–100. [Google Scholar] [CrossRef]
  34. Kizuka, T.; Masuda, T.; Kiryu, T.; Sadoyama, T. Practical Usage of Surface Electromyogram (Biomechanism Library), 1st ed.; Tokyo Denki University Press: Tokyo, Japan, 2006. (In Japanese) [Google Scholar]
  35. Doležal, J.; Štastný, J.; Sovka, P. Recognition of direction of finger movement from EEG signal using markov models. In Proceedings of the IFMBE Proceedings (Prague), Prague, Czech Republic, 3–9 June 2018; pp. 1727–1983. [Google Scholar]
  36. Št’astnỳ, J.; Sovka, P.; Stančák, A. EEG signal classification: Introduction to the problem. Radioengineering 2003, 12, 51–55. [Google Scholar]
  37. Buzsaki, G. Rhythms of the Brain; Oxford University Press: New York, NY, USA, 2006; Available online: https://neurophysics.ucsd.edu/courses/physics_171/Buzsaki%20G.%20Rhythms%20of%20the%20brain.pdf (accessed on 7 October 2020).
  38. Klimesch, W. EEG alpha and theta oscillations reflect cognitive and memory performance: A review and analysis. Brain Res. Rev. 1999, 29, 169–195. [Google Scholar] [CrossRef]
  39. Sagara, K.; Tanaka, Y.; Takeichi, H.; Yamashita, S.; Hasegawa, R.; Okabe, T.; Maeda, T. Brain Communication—The Brain and Means of Society Communication; Electronics, Information and Communication Engineers: Tokyo, Japan, 2011. (In Japanese) [Google Scholar]
  40. Gratton, G.; Coles, M.G.; Donchin, E. A new method for off-line removal of ocular artifact. Electroencephalogr. Clin. Neurophysiol. 1983, 55, 468–484. [Google Scholar] [CrossRef]
  41. Hillyard, S.A.; Galambos, R. Eye-movement artifact in the CNV. Electroencephalogr. Clin. Neurophysiol. 1970, 28, 173–182. [Google Scholar] [CrossRef]
  42. Verleger, R.; Gasser, T.; Möcks, J. Correction of EOG artifacts in event-related potentials of EEG: Aspects of reliability and validity. Psychophysiology 1982, 19, 472–480. [Google Scholar] [CrossRef] [PubMed]
  43. Whitton, J.L.; Lue, F.; Moldofsky, H. A spectral method for removing eye-movement artifacts from the EEG. Electroencephalogr. Clin. Neurophysiol. 1978, 44, 735–741. [Google Scholar] [CrossRef]
  44. Woestenburg, J.C.; Verbaten, M.N.; Slangen, J.L. The removal of the eye-movement artifact from the EEG by regression analysis in the frequency domain. Biol. Psychol. 1983, 16, 127–147. [Google Scholar] [CrossRef]
  45. Berg, P.; Scherg, M. Dipole models of eye activity and its application to the removal of eye artifacts from the EEG ad MEG. Clin. Phys. Physiol. Meas. 1991, 12 (Suppl. A), 49–54. [Google Scholar] [CrossRef]
  46. Berg, P.; Scherg, M. Dipole models of eye movements and blinks. Electroencephalogr. Clin. Neurophysiol. 1991, 79, 36–44. [Google Scholar] [CrossRef]
  47. Lagerlund, T.D.; Sharbrough, F.W.; Busacker, N.E. Spatial filtering of multichannel electroencephalographic recordings through principal component analysis by singular value decomposition. J. Clin. Neurophysiol. 1997, 14, 73–82. [Google Scholar] [CrossRef]
  48. Jung, T.P.; Makeig, S.; Humphries, C.; Lee, T.W.; Mckeown, M.J.; Iragui, V.; Sejnowski, T.J. Removing electroencephalographic artifacts by blind source separation. Psychophysiology 2000, 37, 163–178. [Google Scholar] [CrossRef] [PubMed]
  49. Song, D.; Hendrickson, P.; Marmarelis, V.Z.; Aguayo, J.; He, J.; Loeb, G.E.; Berger, T.W. Predicting EMG with generalized Volterra kernel model. In Proceedings of the 2008 30th Annual International Conference of the IEEE Engineering in Medicine and Biology Society, Vancouver, BC, Canada, 20–25 August 2008; pp. 201–204. [Google Scholar]
  50. Rivera-Alvidrez, Z.; Kalmar, R.S.; Ryu, S.I.; Shenoy, K.V. Low-dimensional neural features predict muscle EMG signals. In Proceedings of the 2010 Annual International Conference of the IEEE Engineering in Medicine and Biology, Buenos Aires, Argentina, 31 August–4 September 2010; pp. 6027–6033. [Google Scholar]
  51. Zhang, H.; Ma, C.; He, J. Predicting lower limb muscular activity during standing and squatting using spikes of primary motor cortical neurons in monkeys. In Proceedings of the 2010 Annual International Conference of the IEEE Engineering in Medicine and Biology, Buenos Aires, Argentina, 31 August–4 September 2010; pp. 4124–4127. [Google Scholar]
  52. Flint, R.D.; Ethier, C.; Oby, E.R.; Miller, L.E.; Slutzky, M.W. Local field potentials allow accurate decoding of muscle activity. Neurophysiol 2012, 108, 18–24. [Google Scholar] [CrossRef] [PubMed]
  53. Ganesh, G.; Burdet, E.; Haruno, M.; Kawato, M. Sparse linear regression for reconstructing muscle activity from human cortical fMRI. NeuroImage 2008, 42, 1463–1472. [Google Scholar] [CrossRef] [PubMed]
Figure 1. (a) Experimental setup. A subject, sitting in a chair with eyes open, was instructed to execute flexion and extension of the shoulder joint at his own pace. (b) Task. To begin, the subject, wearing an exoskeleton robot and in a relaxed state, flexed his arm to a 90-degree position to execute flexion, holding the posture for about 2 s. Then, the subject began to extend the arm from the 90-degree position back to the resting position, before returning to rest.
Symmetry 12 01851 g001
Figure 2. Processing Diagram. The black line represents the process of the electroencephalogram– electromyography (EEG–EMG) model construction, and the red line represents the process of EMG estimation from EEG signals.
Symmetry 12 01851 g002
Figure 3. Decomposed similar independent components for one representative trial. This figure presents the topographies of the components with similar scalp distributions observed in all the subjects. The components whose signals were mainly concentrated at CP1, CP2, O1, and O2 were thus selected as the components associated with the flexion and extension of the shoulder joint for further analysis and feature extraction.
Symmetry 12 01851 g003
Figure 4. Results of Short-time Fourier Transform (STFT) at seven measurement points. The top figures in the subfigure show the three-dimensional STFT results. The middle figures are spectrograms of STFT results. The bottom figures are the results of the EMG signals. The green parts are the results of full-wave rectification of the measured raw EMG signals, and the red curve is the EMG signals after signal pre-processing.
Symmetry 12 01851 g004
Figure 5. Results before and after Principal Component Analysis (PCA). The left figure shows the STFT results of each measurement point. The horizontal axis is time, and the vertical axis is the integral value of the power spectra of 0.1–45 Hz after STFT. The right figure shows the results of the left figure after PCA, which includes seven principal components (PCs).
Symmetry 12 01851 g005
Figure 6. The results of EMG estimation from the EEG signals. (a), (b), and (c) represent the results of subjects A, B, and C, respectively. The solid black line and the solid red line in the figure represent the measured and estimated EMG signals, respectively. The correlation coefficient between the estimated value and the measured value (R) was calculated and is shown in the upper right corner.
Symmetry 12 01851 g006
Table 1. Results of PCA of three subjects.
Contribution Ratio of PC1Contribution Ratio of PC2Cumulative Contribution Ratio (PC1 + PC2)
Subject AMax.91.225.097.6
Min.58.36.2382.0
Average73.7 ± 10.116.1 ± 6.0089.8 ± 5.26
Subject BMax.92.127.497.5
Min.50.62.9370.0
Average73.5 ± 11.213.9 ± 6.1587.4 ± 6.32
Subject CMax.82.727.695.2
Min.47.68.4166.0
Average64.0 ± 12.117.8 ± 5.4281.8 ± 9.01
Table 2. The results of the estimation accuracy of the models.
Correlation Coefficient (R)Standard Error
Subject A0.740.004
Subject B0.830.002
Subject C0.770.002
Table 3. Review of the EMG Estimation Studies.
ReferenceSubjectTaskMeasurementAccuracy
[49]MonkeysReach to graspM1 spike *r = 0.69
[50]MonkeysCenter out reachM1/PMd neuron spikes * R 2 = 0.65
[51]MonkeysStand and squatM1 Spike R 2 = 0.74
[52]MonkeysReach to grasp the wristM1 spike and LFP *VAF = 0.67
[53]HumansIsometric wrist movementsfMRI BOLD response * R 2 = 0.47
[21]HumansIsometric wrist
flexion/extensionScalp EEG R 2 = 0.55
[20]HumansProsthesis control
with biceps contractionScalp EEGr = 0.59
Current StudyHumansFlexion/extension r = 0.78
of shoulder jointScalp EEG( R 2 = 0.61)
* M1: Primary Motor Cortex, PMd: Premotor Cortex, LFP: Local Field Potentials, VAF: Variance Accounted For, BOLD: Blood Oxygenation Level Dependent.
Publisher’s Note: MDPI stays neutral with regard to jurisdictional claims in published maps and institutional affiliations.

