1. Introduction
While many algorithms and techniques were developed for sentiment analysis in the previous years, from classification into just positive and negative categories to a wide spectrum of emotions, less attention has been paid to the concept of indeterminacy. Early stages of work were inclined towards Boolean logic which meant an absolute classification into positive or negative classes, 1 for positive and 0 for negative. Fuzzy logic uses the memberships of positive and negative that can vary in the range 0 to 1. Neutrosophy is the study of indeterminacies, meaning that not every given argument can be distinguished as positive or negative, it emphasizes the need for a neutral category. Neutrosophy theory was introduced in 1998 by Smarandache [
1], and it is based on truth membership
T, indeterminate membership
I and false membership
F that satisfies
, and the memberships are independent of each other. In case of using neutrosophy in sentiment analysis, these memberships are relabelled as positive membership, neutral membership and negative membership.
Another interesting topic is the speech sentiment analysis, it involves processing audio. Audio files cannot be directly understood by models. Machine learning algorithms do not take raw audio files as input hence it is imperative to extract features from the audio files. An audio signal is a three-dimensional signal where the three axes represent amplitude, frequency and time. Previous work on detecting the sentiment of audio files is inclined towards emotion detection as the audio datasets are mostly labelled and created in a manner to include various emotions. Then using the dataset for training classifiers are built. Speech analysis is also largely associated with speech recognition. Speech analysis is the process of analyzing and extracting information from the audio files which are more efficient than the text translation itself. Features can be extracted from audio using Librosa package in python. A total of 193 features per audio file have been retrieved including Mel-Frequency Cepstral Coefficients (MFCC), Mel spectogram, chroma, contrast, and tonnetz. The goal of this project is to establish a relationship between sentiment detected in audio and sentiment detected from the translation of the same audio to text. Work done in the domain of speech sentiment analysis is largely focused on labelled datasets because the datasets are created using actors and not collected like it is done for text where we can scrape tweets, blogs or articles. Hence the datasets are labelled as various emotions such as the Ryerson Audio-Visual Database of Emotional Speech and Song (RAVDESS) dataset which contains angry, happy, sad, calm, fearful, disgusted, and surprised classes of emotions. These datasets have no text translation provided hence no comparison can be established. With unlabelled datasets such as VoxCeleb1/2 which have been randomly collected from random YouTube videos, again the translation problem arises leading to no meaningful comparison scale. We need audio data along with the text data for comparison, so a dataset with audio translation was required. Hence LibriSpeech dataset [
2] was chosen, it is a corpus of approximately 1000 h of 16 kHz read English speech.
The K-means clustering algorithm performs clustering of n values in K clusters, where each value belongs to a cluster. Since the dataset is unlabelled features extracted from the audio are clustered using the K-means clustering algorithm. Then the distance of each point from the centroid of each cluster is calculated. 1-distance implies the closeness of an audio file to every cluster. This closeness measure is used to generate Single Value Neutrosophic Sets (SVNS) for the audio. Since the data is unlabelled, we performed clustering of SVNS values using the K-means clustering.
Sentiment analysis of the text has various applications. It is used by businesses for analysing customer feedback of products and brands without having to go through all of them manually. An example of this real-life application could be social media monitoring where scraping and analysing tweets from Twitter on a certain topic or about a particular brand or personality and analysing them could very well indicate the general sentiment of the masses. Ever since internet technology started booming, data became abundant. While it is simpler to process and derive meaningful results from tabular data, it is the need for the hour to process unstructured data in the form of sentences, paragraphs or text files and PDFs. Hence NLP provides excellent sentiment analysis tools for the same. However, sentiment cannot be represented as a black and white picture with just positive and negative arguments alone. To factor in indeterminacy, we have the concept of neutrosophy which means the given argument may either be neutral or with no relation to the extremes. Work done previously related to neutrosophy will be explained in detail in the next section.
For the sentiment analysis of text part, the translation of the audio is provided as text files along with the dataset which mitigates the possibility of inefficient translation. In this paper, using Valence Aware Dictionary and Sentiment Reasoner (VADER), a lexicon and rule-based tool for sentiment analysis on the text files, SVNS values for text are generated. Then K-means clustering is applied to visualize the three clusters. The first step is the comparison of the two K-means plots indicating the formation of a cluster larger than the rest in audio SVNS implying the need for a neutral class. Then both the SVNS are combined by averaging out the two scores respectively for , and . Again K-means clustering and hierarchical agglomerative clustering is performed on these SVNS values to get the final clusters for each file.
Neutrosophic logic uses Single Valued Neutrosophic Sets (SVNS) to implement the concept of indeterminacy in sentiment analysis. For every sentence A, its representative SVNS is generated. SVNS looks like where ‘’ is the positive sentiment score, ‘’ is the indeterminacy or neutrality score and ‘’ is the negative sentiment score. Neutrosophy was introduced to detect the paradox proposition.
In this paper, a new innovative approach is carried out in which we use unlabelled audio dataset and then generate SVNS for audio to analyse audio files from the neutrosophic logic framework. The higher-level architecture is shown in
Figure 1.
Indeterminacy is a strong concept which has rightly indicated the importance of neutral or indeterminate class in text sentiment analysis. Coupling it with speech analysis is just an attempt to prove that not all audio can be segregated into positive and negative. There is a very good amount of neutrality present in the data that needs to be represented. We have used clustering to validate the presence of neutrality.
This paper is organized as follows:
Section 1 is introductory in nature, the literature survey is provided in
Section 2. In
Section 3, the basic concepts related to speech sentiment analysis, text sentiment analysis and neutrosophy are recalled. The model description of the proposed framework that makes uses of neutrosophy to handle speech and text sentiment analysis is given in
Section 4. In
Section 5 the experimental results in terms of K-clustering and agglomerative clustering are provided. Results and discussions about combined SVNS are carried out in
Section 6. The conclusions are provided in the last section.
2. Literature Survey
Emphasizing on the need and application of sentiment analysis in business and how it can play a crucial role in data monitoring on social media. The fuzzy logic model by Karen Howells and Ahmet Ertugan [
3] attempts to form a five class classifier—strongly positive, positive, neutral, negative and strongly negative for tweets. It is proposed to add fuzzy logic classifier to the social bots used for data mining. It will result in the analysis of the overall positive, neutral and negative sentiments which will facilitate the companies to develop strategies to improve the customer feedback and improve the reputation of their products and brand. A study on application of sentiment analysis in the tourism industry [
4] shows that most of the sentiment analysis methods perform better for positive class. One of the reasons for this could be the fact that human language is inclined towards positivity. It is even more difficult to detect neutral sentiment. Ribeiro and others have pointed out a similar observation in [
5] that twelve out of twenty-four methods are better in classifying positive sentiment and neutral sentiment is harder to identify. They also concluded from their experiments that VADER tool provides consistent results for three-classes (positive, neutral, negative) classification.
Similarly, Hutto and Gilbert in [
6] did an excellent job in comparing VADER tool eleven sentiment analysis techniques depending on Naïve Bayes, Support Vector Machine (SVM) and maximum entropy algorithms. They concluded that VADER is simple to understand and does not function like a black box where the internal structure of process cannot be understood as in complex machine learning and deep learning sentiment analysis techniques. VADER also performs in par with these benchmark models and is highly efficient as it only requires a fraction of second for analysis because it uses a lexicon rule-based approach, whereas its counterpart SVM can take much more time. VADER is also computationally economical as it does not need any special technical specifications such as a GPU for processing. The transparency of the tool attracts a larger audience as its users include professionals from businesses and marketing as well as it allows researchers to experiment more. Hutto and Gilbert’s analysis is applied in [
7] to rule out the neutral tweets. They built an election prediction model for 2016 USA elections. They used VADER to remove all the neutral tweets that were scraped to focus on positive and negative sentiments towards Donald Trump and Hilary Clinton.
Fuzzy logic gives the measure of positive and negative sentiment in decimal figures, not as absolute values 0 or 1 like Boolean logic. If truth measure is
T, then
F is falsehood according to the intuitionistic fuzzy set and
I is the degree of indeterminacy. Neutrosophy was proposed in [
1], it was taken as
. The neutrosophy theory was introduced in 1998 by Smarandache [
1]. Neutrality or indeterminacy was introduced in sentiment analysis to address uncertainties. The importance of neutrosophy in sentiment analysis for the benefit of its prime users such as NLP specialists was pointed out in [
8]. To mathematically apply neutrosophic logic in real world problems, Single Valued Neutrosophic Sets (SVNS) were introduced in [
9]. A SVNS for sentiment analysis represented by
where ‘
’ is the positive sentiment score, ‘
’ is the indeterminacy or neutrality score and ‘
’ is the negative sentiment score.
Refined Neutrosophic sets were introduced in [
10]. Furthermore, the concept of Double Valued Neutrosophic Sets (DVNS) was introduced in [
11]. DVNS are an improvisation of SVNS. The indeterminacy score was split into two: one indicating indeterminacy of positive sentiment or ‘
T’ the truth measure and the other one indicating indeterminacy of negative sentiment or ‘
F’ the falsehood measure. DVNS are more accurate than SVNS. A minimum spanning tree clustering model was also introduced for double valued neutrosophic sets. Multi objective non-linear optimization on four-valued refined neutrosophic set was carried out in [
12].
In [
13] a detailed comparison between fuzzy logic and neutrosophic logic was shown by analyzing the #metoo movement. The tweets relevant to the movement are collected from Twitter. After cleaning, the tweets are then input in the VADER tool which generates SVNSs for each tweet. These SVNS are then visualized using clustering algorithms such as K-means and K-NN. Neutrosophic refined sets [
10,
14,
15,
16] have been developed and applied in various fields, including in sentiment analysis recently. However no one has till now attempted to do speech sentiment analysis using neutrosophy and combine it with text sentiment analysis.
A classifier with SVM in multi class mode was developed to classify a six class dataset by extracting linear prediction coefficients, derived cepstrum coefficients and mel frequency cepstral coefficients [
17]. The model shows a considerable improvement and results are 91.7% accurate. After various experiments it was concluded in [
18] that for emotion recognition convolutional neural networks capture rich features of the dataset when a large sized dataset is used. They also have higher accuracy compared to SVM. SVMs have certain limitations even though they can fit data with non-linearities. It was concluded that machine learning is a better solution for analysing audio. In [
19] a multiple classifier system was developed for speech emotion recognition. A multimodal system was developed in [
20] to analyze audio, text and visual data together. Features such as MFCC, spectral centroid, spectral flux, beat sum, and beat histogram are extracted from the audio. For text, concepts were extracted based on various rules. For visual data, facial features were incorporated. All these features were then concatenated into a single vector and classified. A similar approach was presented in [
21] to build multimodal classifier using audio, textual and visual features and comparing it to its bimodal subsets (audio+text, text+visual, audio+visual). The same set of features were extracted from audio using openSMILE software whereas for text convolutional neural networks were deployed. These features were then combined using decision level fusion. From these studies it can be very well inferred that using both audio and textual features for classification will yield better or sensitive results.
3. Basic Concepts
3.1. Neutrosophy
Neutrosophy is essentially a branch of philosophy. It is based on understanding the scope and dimensions of indeterminacy. Neutrosophy forms the basis of various related fields in statistical analysis, probability, set theory, etc. In some cases, indeterminacy may require more information or in others, it may not have any linking towards either positive or negative sentiment. To represent uncertain, imprecise, incomplete, inconsistent, and indeterminate information that is present in the real world, the concept of a neutrosophic set from the philosophical point of view has been proposed.
Single Valued Neutrosophic Sets (SVNS) is an instance of a Neutrosophic set. The concept of a neutrosophic set is as follows:
Definition 1. Consider X to be a space of points (data-points), with an element in X represented by x. A neutrosophic set A in X is denoted by a truth membership function , an indeterminacy membership function , and a falsity membership function . The functions , , and are real standard or non-standard subsets of ; that is, with the condition .
This definition of a neutrosophic set is difficult to apply in the real world in scientific and engineering fields. Therefore, the concept of SVNS, which is an instance of a neutrosophic set, has been introduced.
Definition 2. Consider X be a space of points (data-points) with element in X denoted by x. An SVNS A in X is characterized by truth membership function , indeterminacy membership function , and falsity membership function . For each point , there are , and 0 3. Therefore, an SVNS A can be represented by The various distance measures and clustering algorithms defined over neutrosophic sets are given in [
2,
11,
14].
3.2. Sentiment Analysis of Text and VADER Package
Sentiment analysis is a very efficient tool in judging the popular sentiment revolving around any particular product, services or brand. Sentiment analysis is also known as opinion mining. It is, in all conclusive trails, a process of determining the tone behind a line of text and to get an understanding of the attitude or polarity behind that opinion. Sentiment analysis is very helpful in social media understanding, as it enables us to pick up a review of the more extensive general assessment behind specific subjects. Most of the existing sentiment analysis tools classify the arguments into positive or negative sentiment based on a set of predefined rules or ‘lexicons’. This enables the tool to calculate the overall leaning polarity of the text and thus makes a decision on the overall tone of the subject.
VADER is an easy-to-use, highly accurate and consistent tool for sentiment analysis. It is fully open source with the MIT License. It has a lexicon rule-based method to detect sentiment score for three classes: positive, neutral, and negative. It provides a compound score that lies in the range . This compound score is used to calculate the overall sentiment of the input text. If the compound score ≥0.05, then it is tagged as positive. If the compound score is ≤−0.05 then it tagged as negative. The arguments with the compound score between is tagged as neutral. VADER uses Amazon’s Mechanical Turk to acquire their ratings, which is an extremely efficient process. VADER has a built in dictionary with a list of positive and negative words. It then calculates the individual score by summing the pre-defined score for the positive and negative words present in the dictionary. VADER forms a particularly strong basis for social media texts since the tweets or comments posted on social media are often informal, with grammatical errors and contain a lot of other displays of strong emotion, such as emojis, more than one exclamation point, etc. As an example, the sentence, ‘This is good!!!’ will be rated as being ‘more positive’ than ‘This is good!’ by VADER. VADER was observed to be very fruitful when managing social media writings, motion picture reviews, and product reviews. This is on the grounds that VADER not just tells about the positivity and negativity score yet in addition tells us how positive or negative a text is.
VADER has a great deal of advantages over conventional strategies for sentiment analysis, including:
It works very well with social media content, yet promptly sums up to different areas.
Although it contains a human curated sentiment dictionary for analysis, it does not specifically require any training data.
It can be used with real time data due to its speed and efficiency.
The VADER package for Python analysis presents the negative, positive and indeterminate values for every single tweet. Every single tweet is represented as , where x belongs to the dataset.
3.3. Speech Analysis
An important component of this paper is speech analysis which involves processing audio. Audio files cannot be directly understood by models. Machine learning algorithms do not take raw audio files as input hence it is imperative to extract features from the audio files. An audio signal is a three-dimensional signal where the three axes represent amplitude, frequency and time. Extracting features from audio files helps in building classifiers for prediction and recommendation.
Python provides a package called librosa for the analysis of audio and music. In this work, librosa has been used to extract a total 193 features per audio file. To display an audio file as spectrogram, wave plot or colormap librosa.display is used.
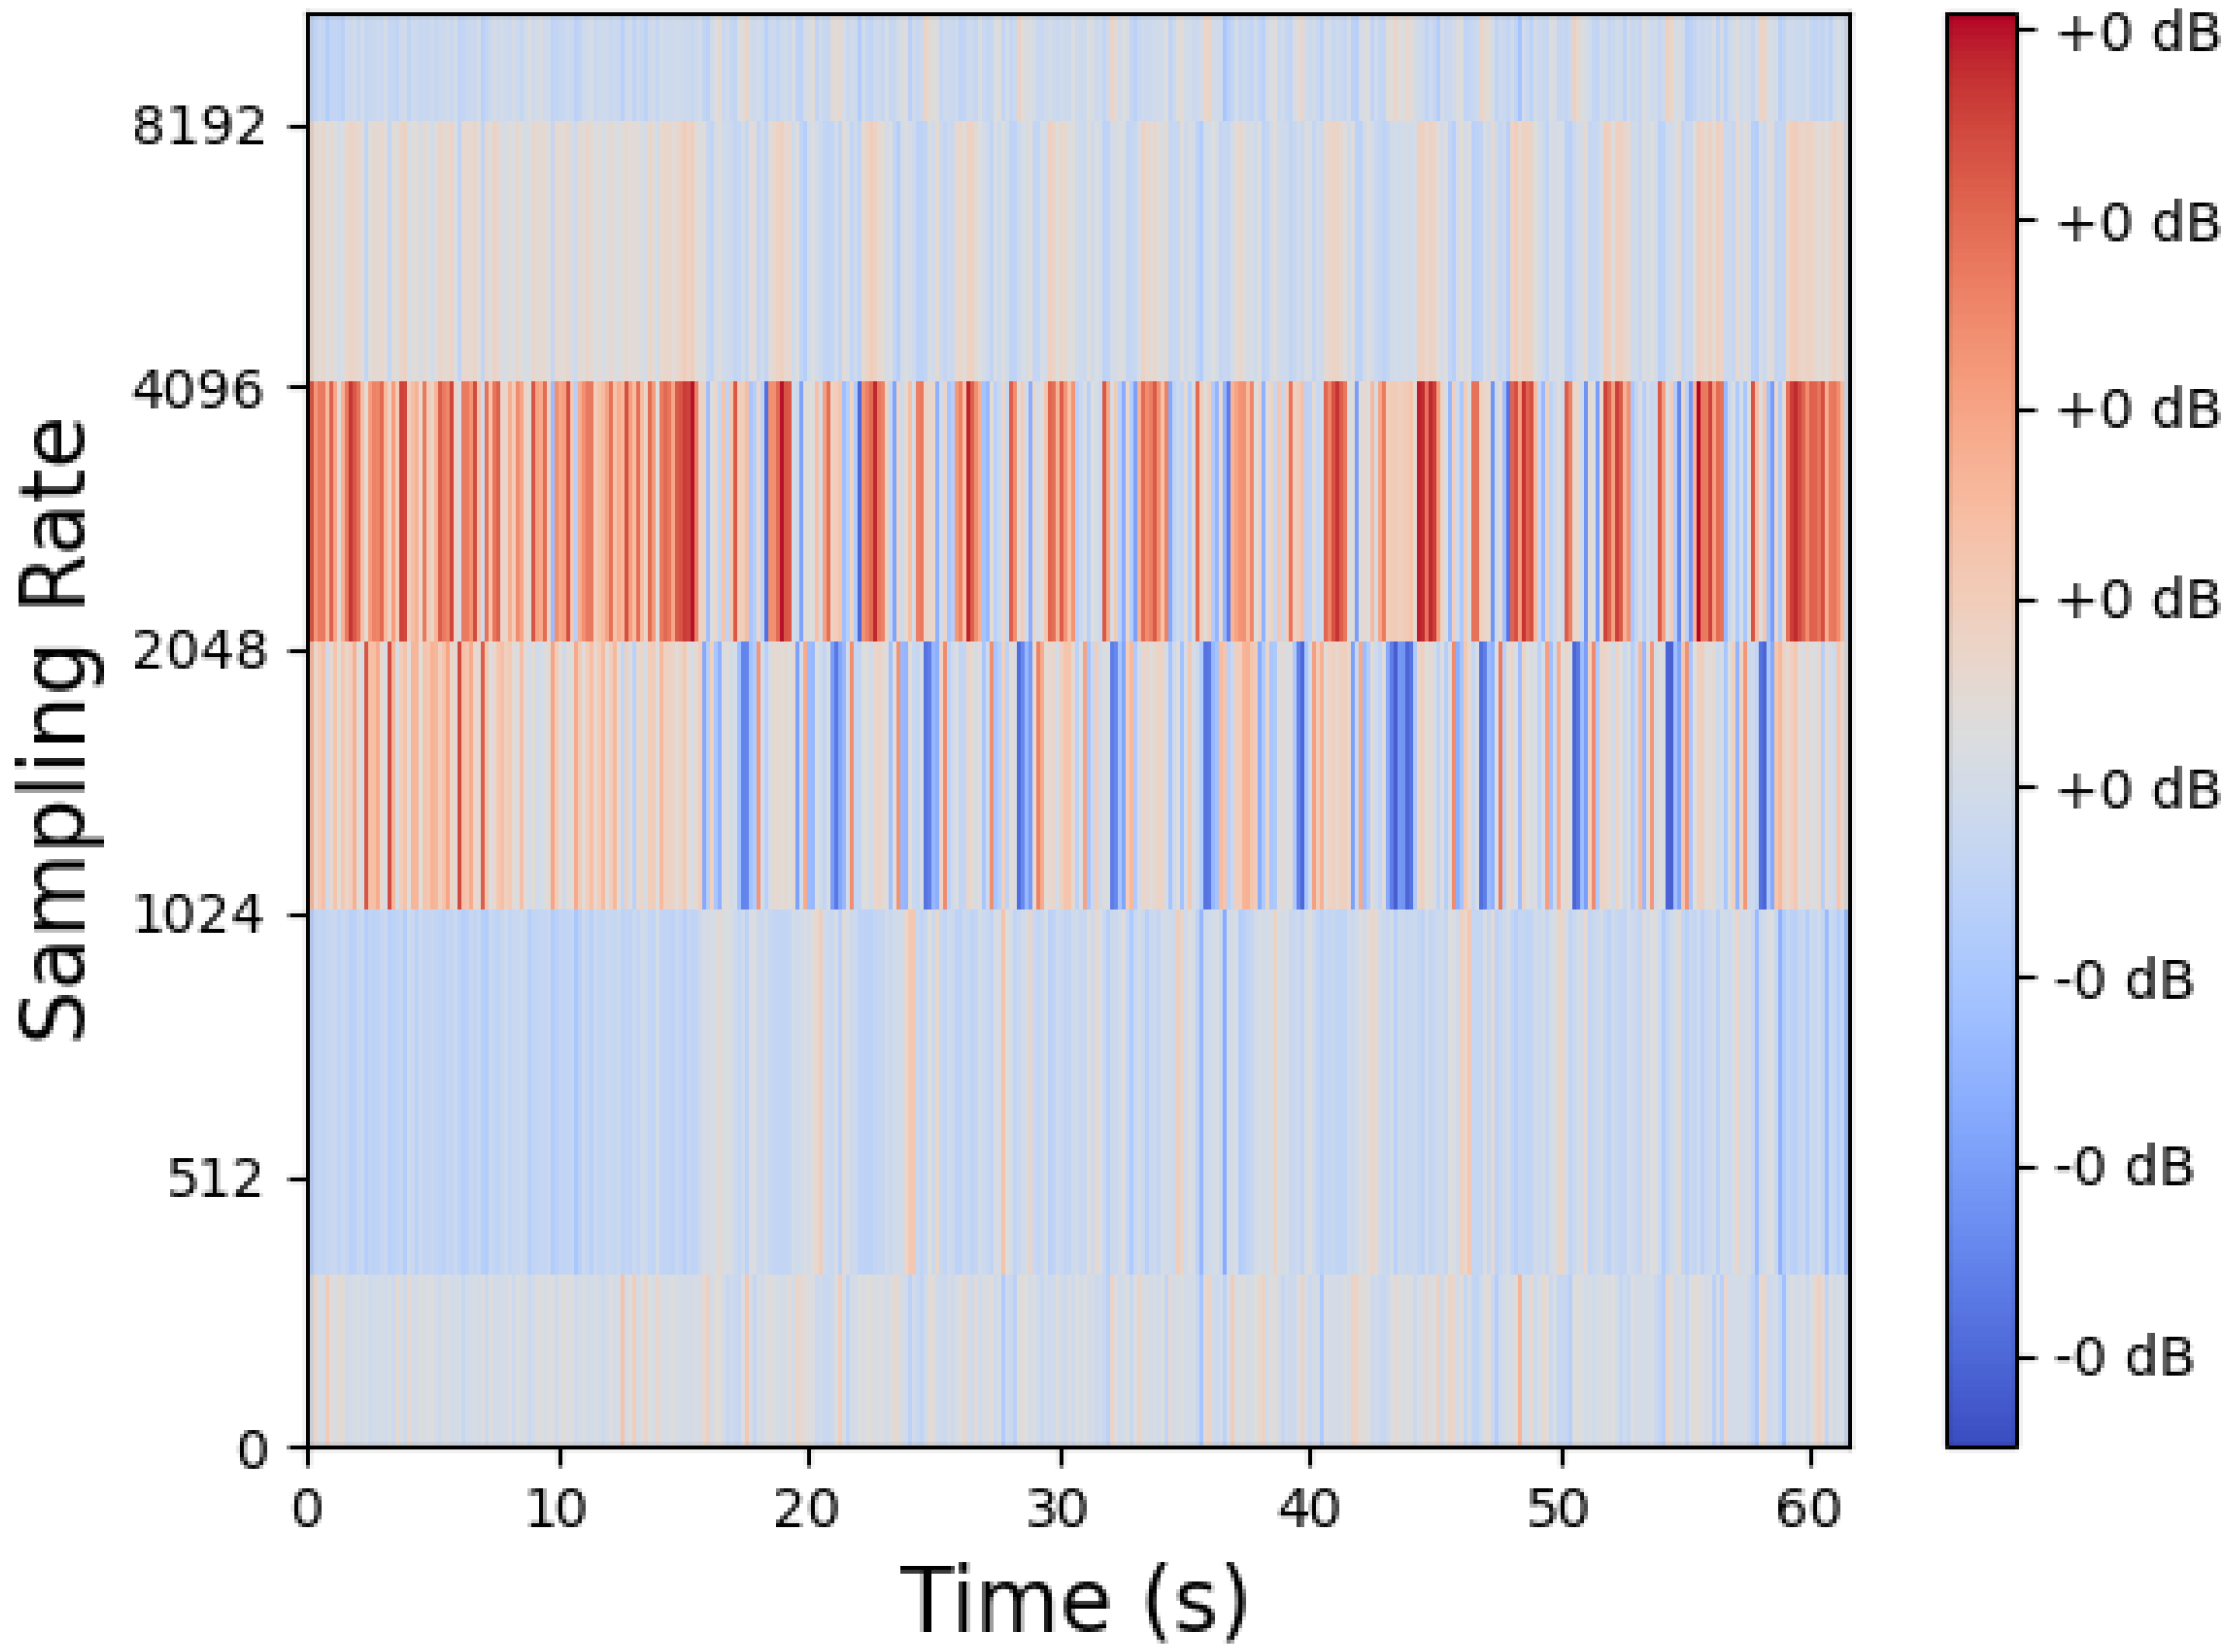
Figure 2 is a wave plot of an audio file. The loudness (amplitude) of an audio file can be shown in wave plot.
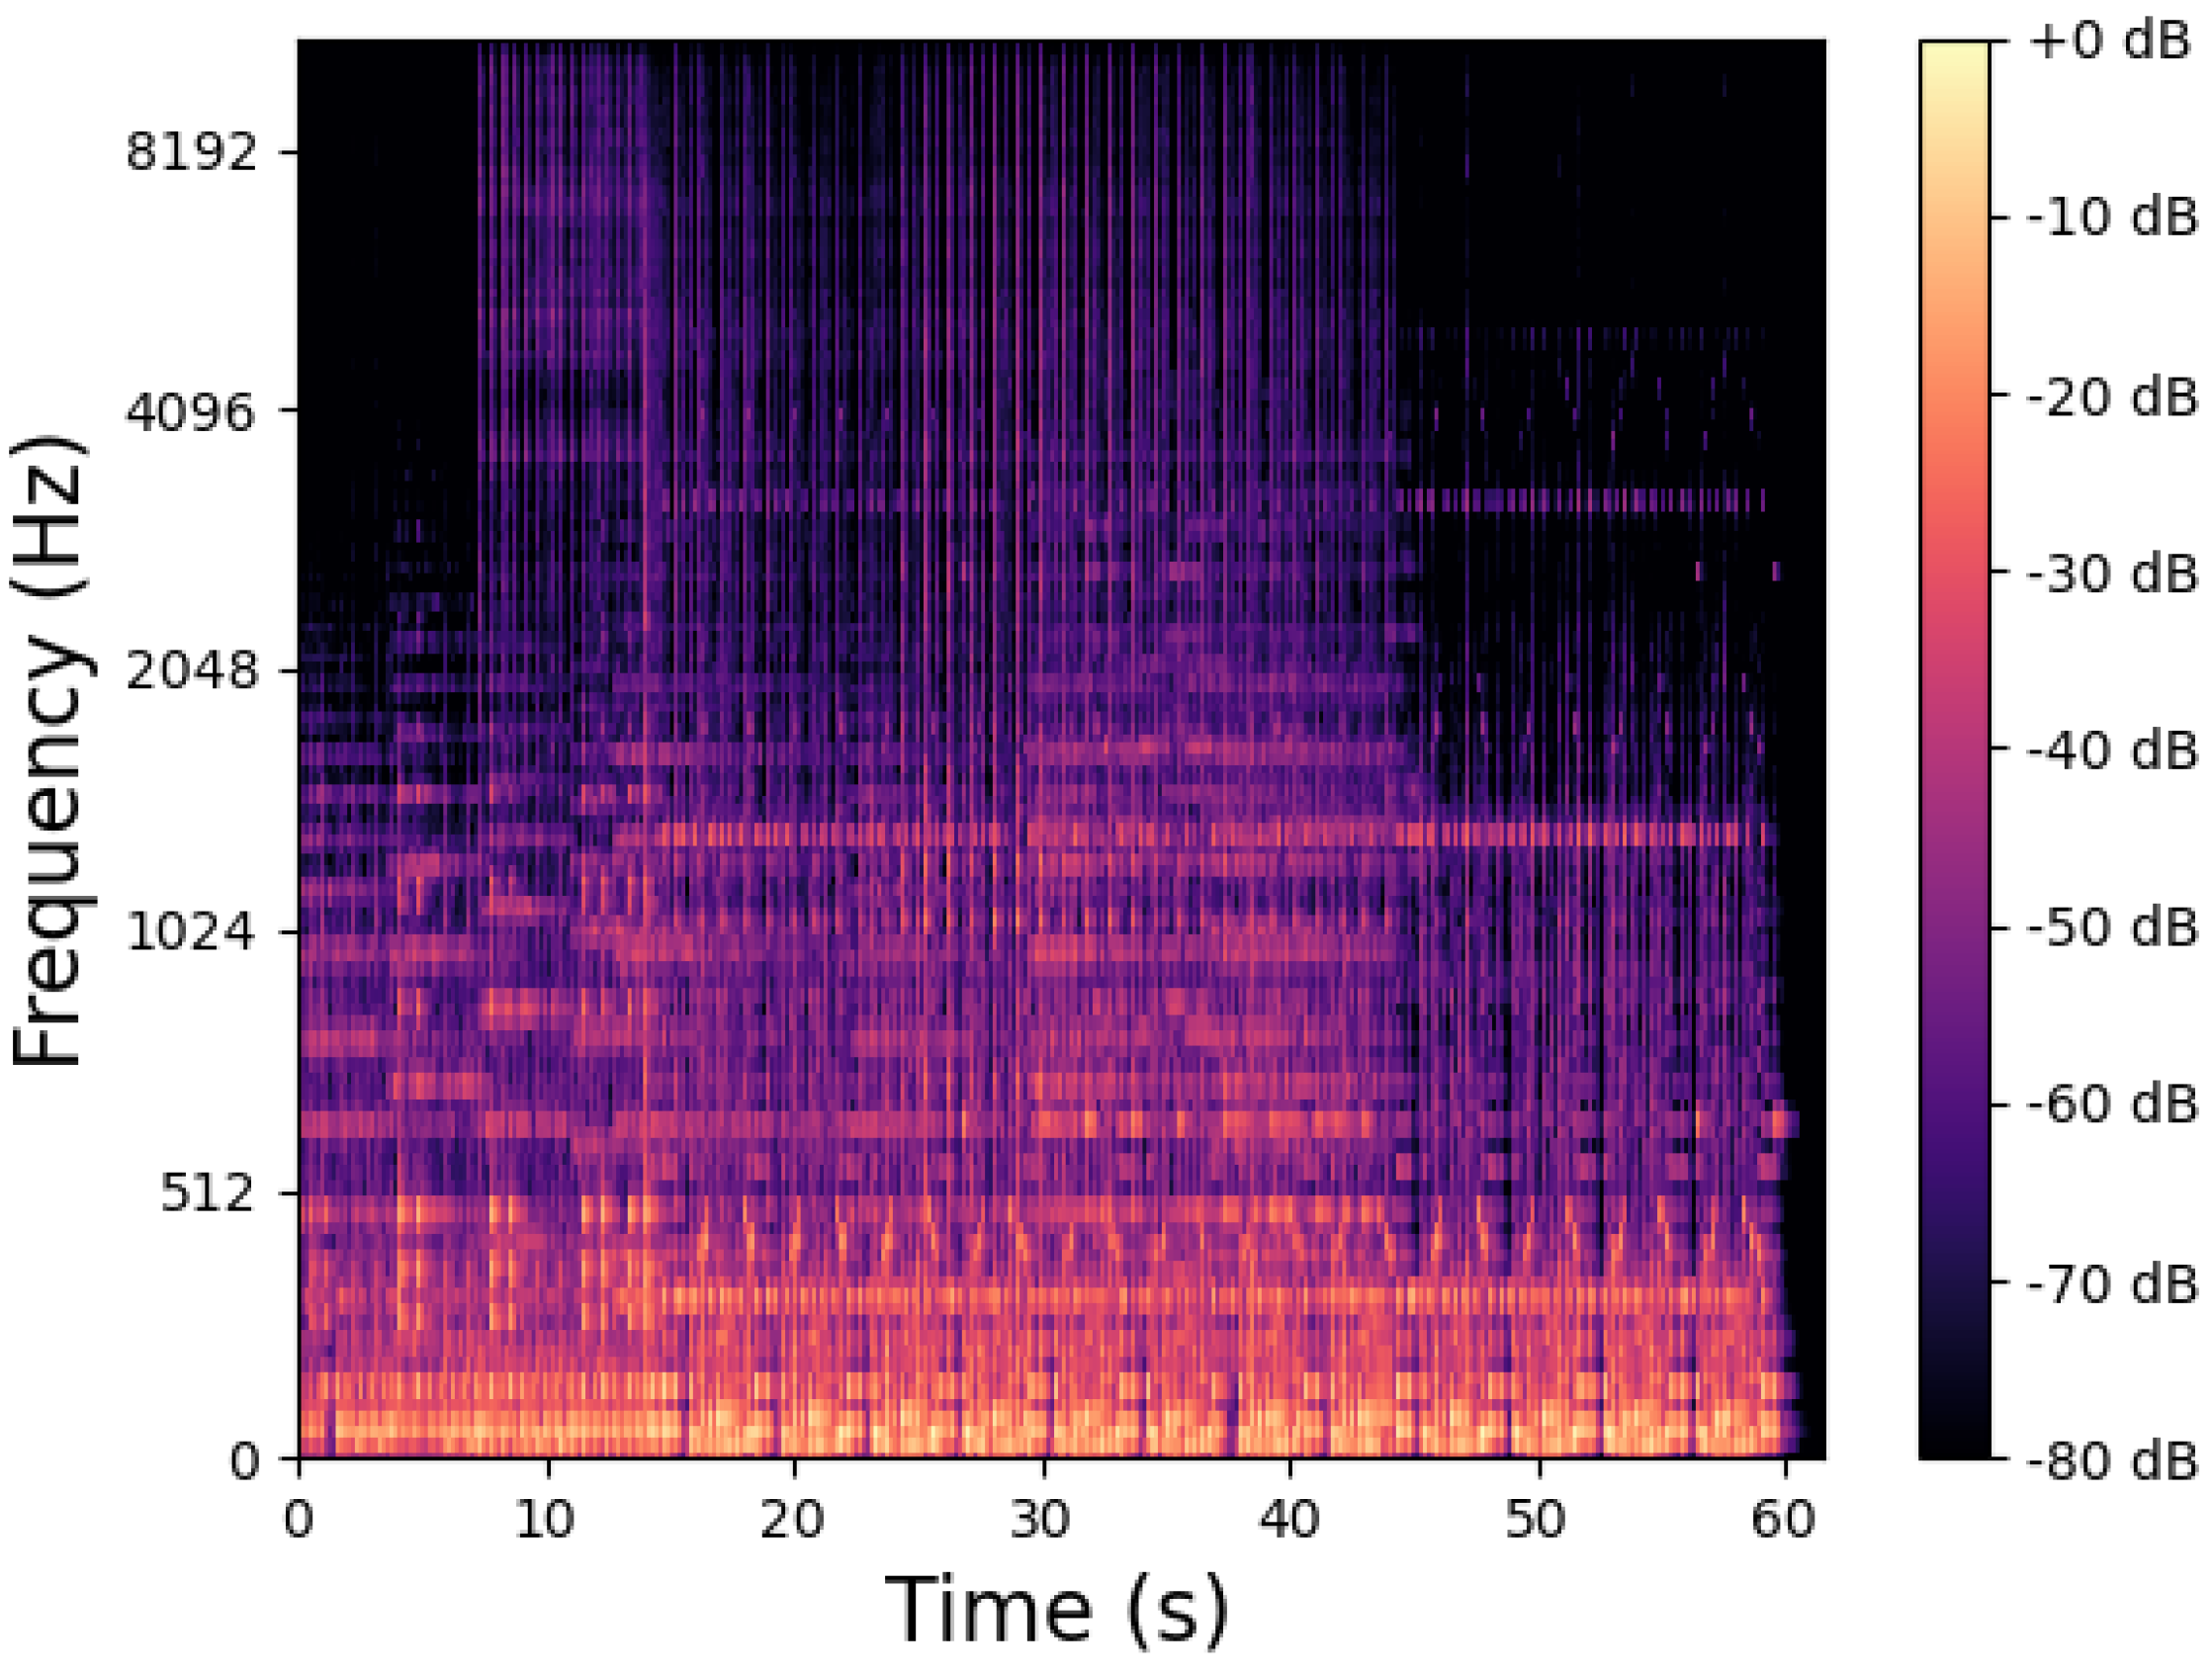
Figure 3 shows the spectrogram of the sample audio. Spectrogram is used to map different frequencies at a given point of time to its amplitude. It is a visual representation of the spectrum of frequencies of a sound.
The MFCC features of an audio file is shown in
Figure 4. The MFCCs of a signal are a small set of features which concisely describe the overall shape of a spectral envelope. Sounds generated by a human are filtered by the shape of the vocal tract including the tongue, teeth etc. MFCCs represent the shape of the envelope that the vocal tract manifests on the short time power spectrum.
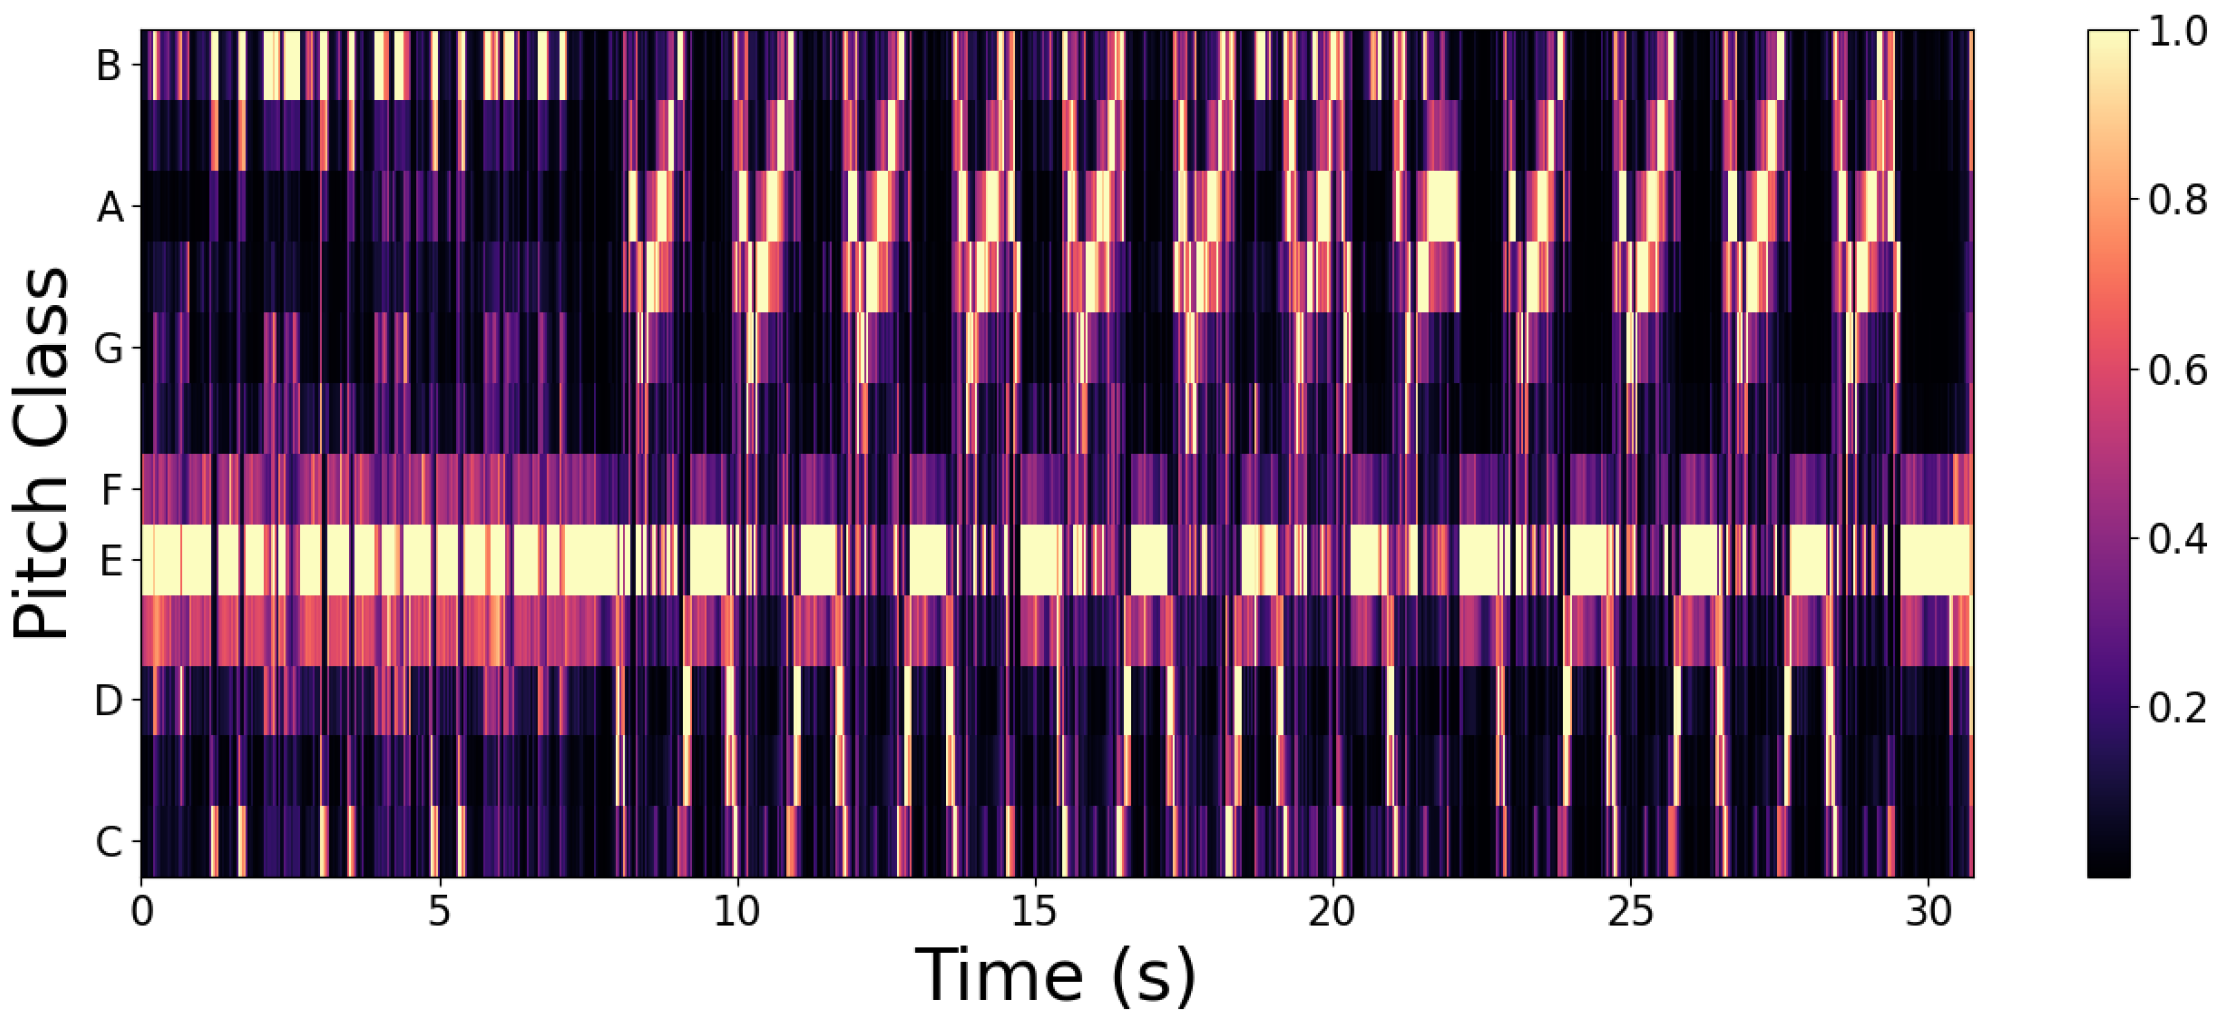
The chroma features of the sample audio file is represented in
Figure 5. These represent the tonal content of audio files, that is the representation of pitch within the time window spread over the twelve chroma bands.
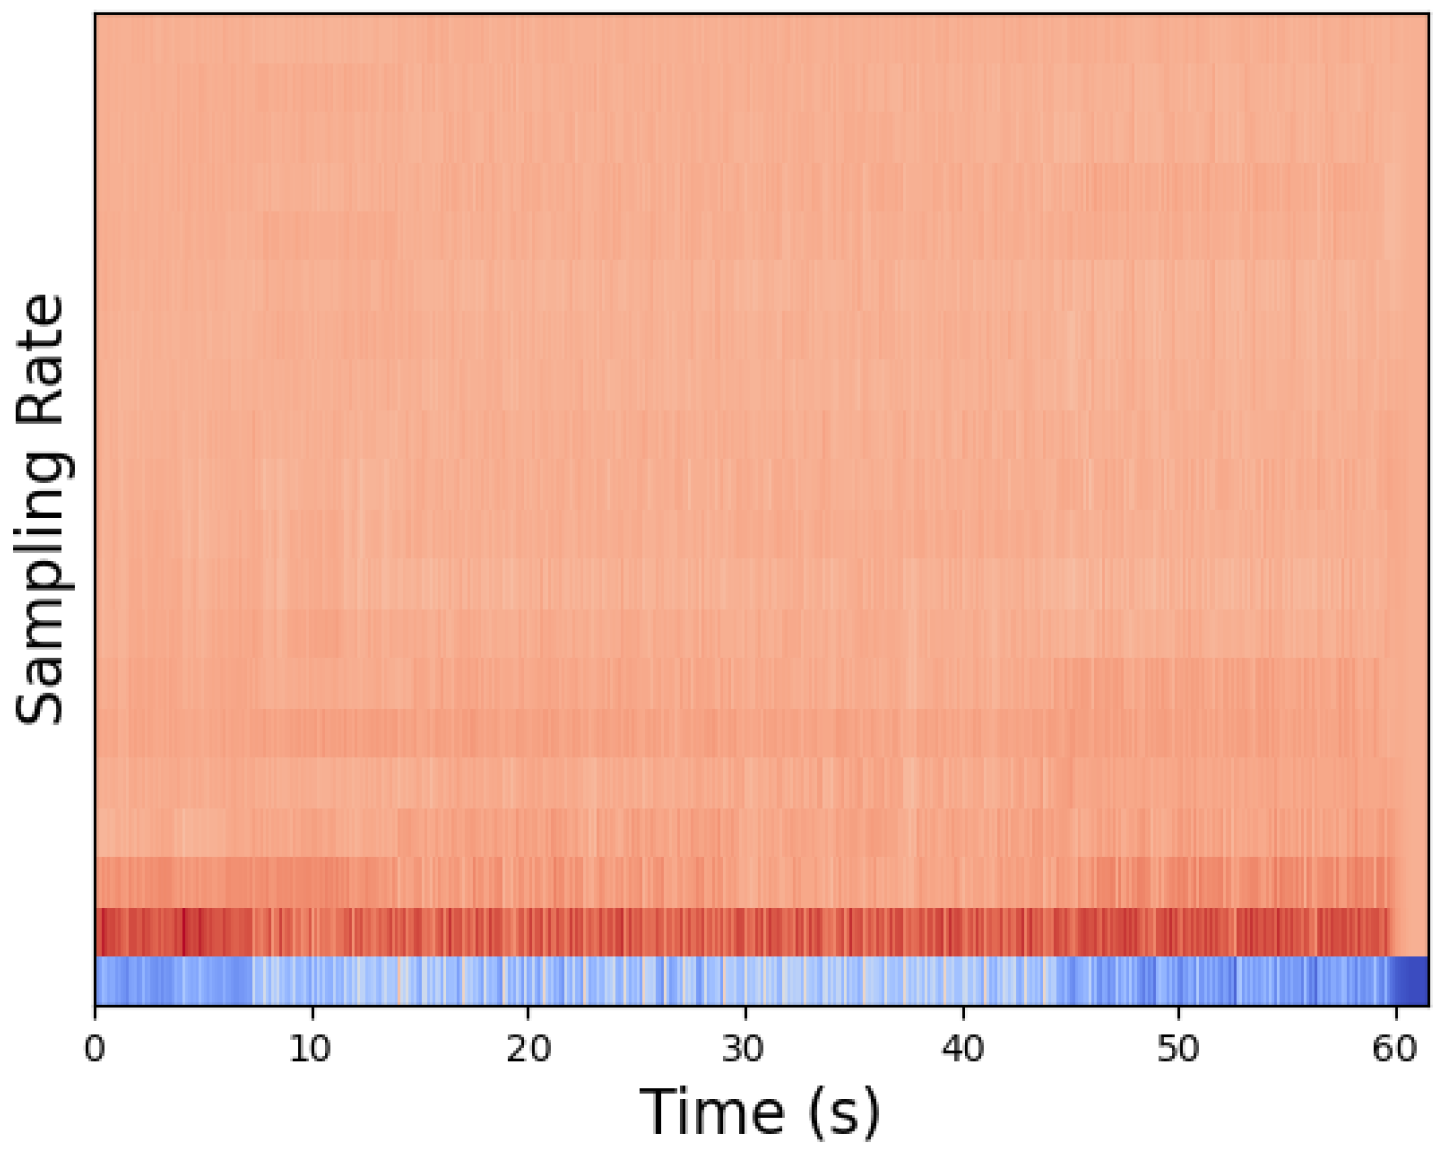
Figure 6 represents the mel spectrogram of the sample audio file. Mathematically, mel scale is the result of some non-linear transformation of the frequency scale. The purpose of the mel scale is that the difference in the frequencies as perceived by humans should be different for all ranges. For example, humans can easily identify the difference between 500 Hz and 1000 Hz but not between 8500 Hz and 9000 Hz.
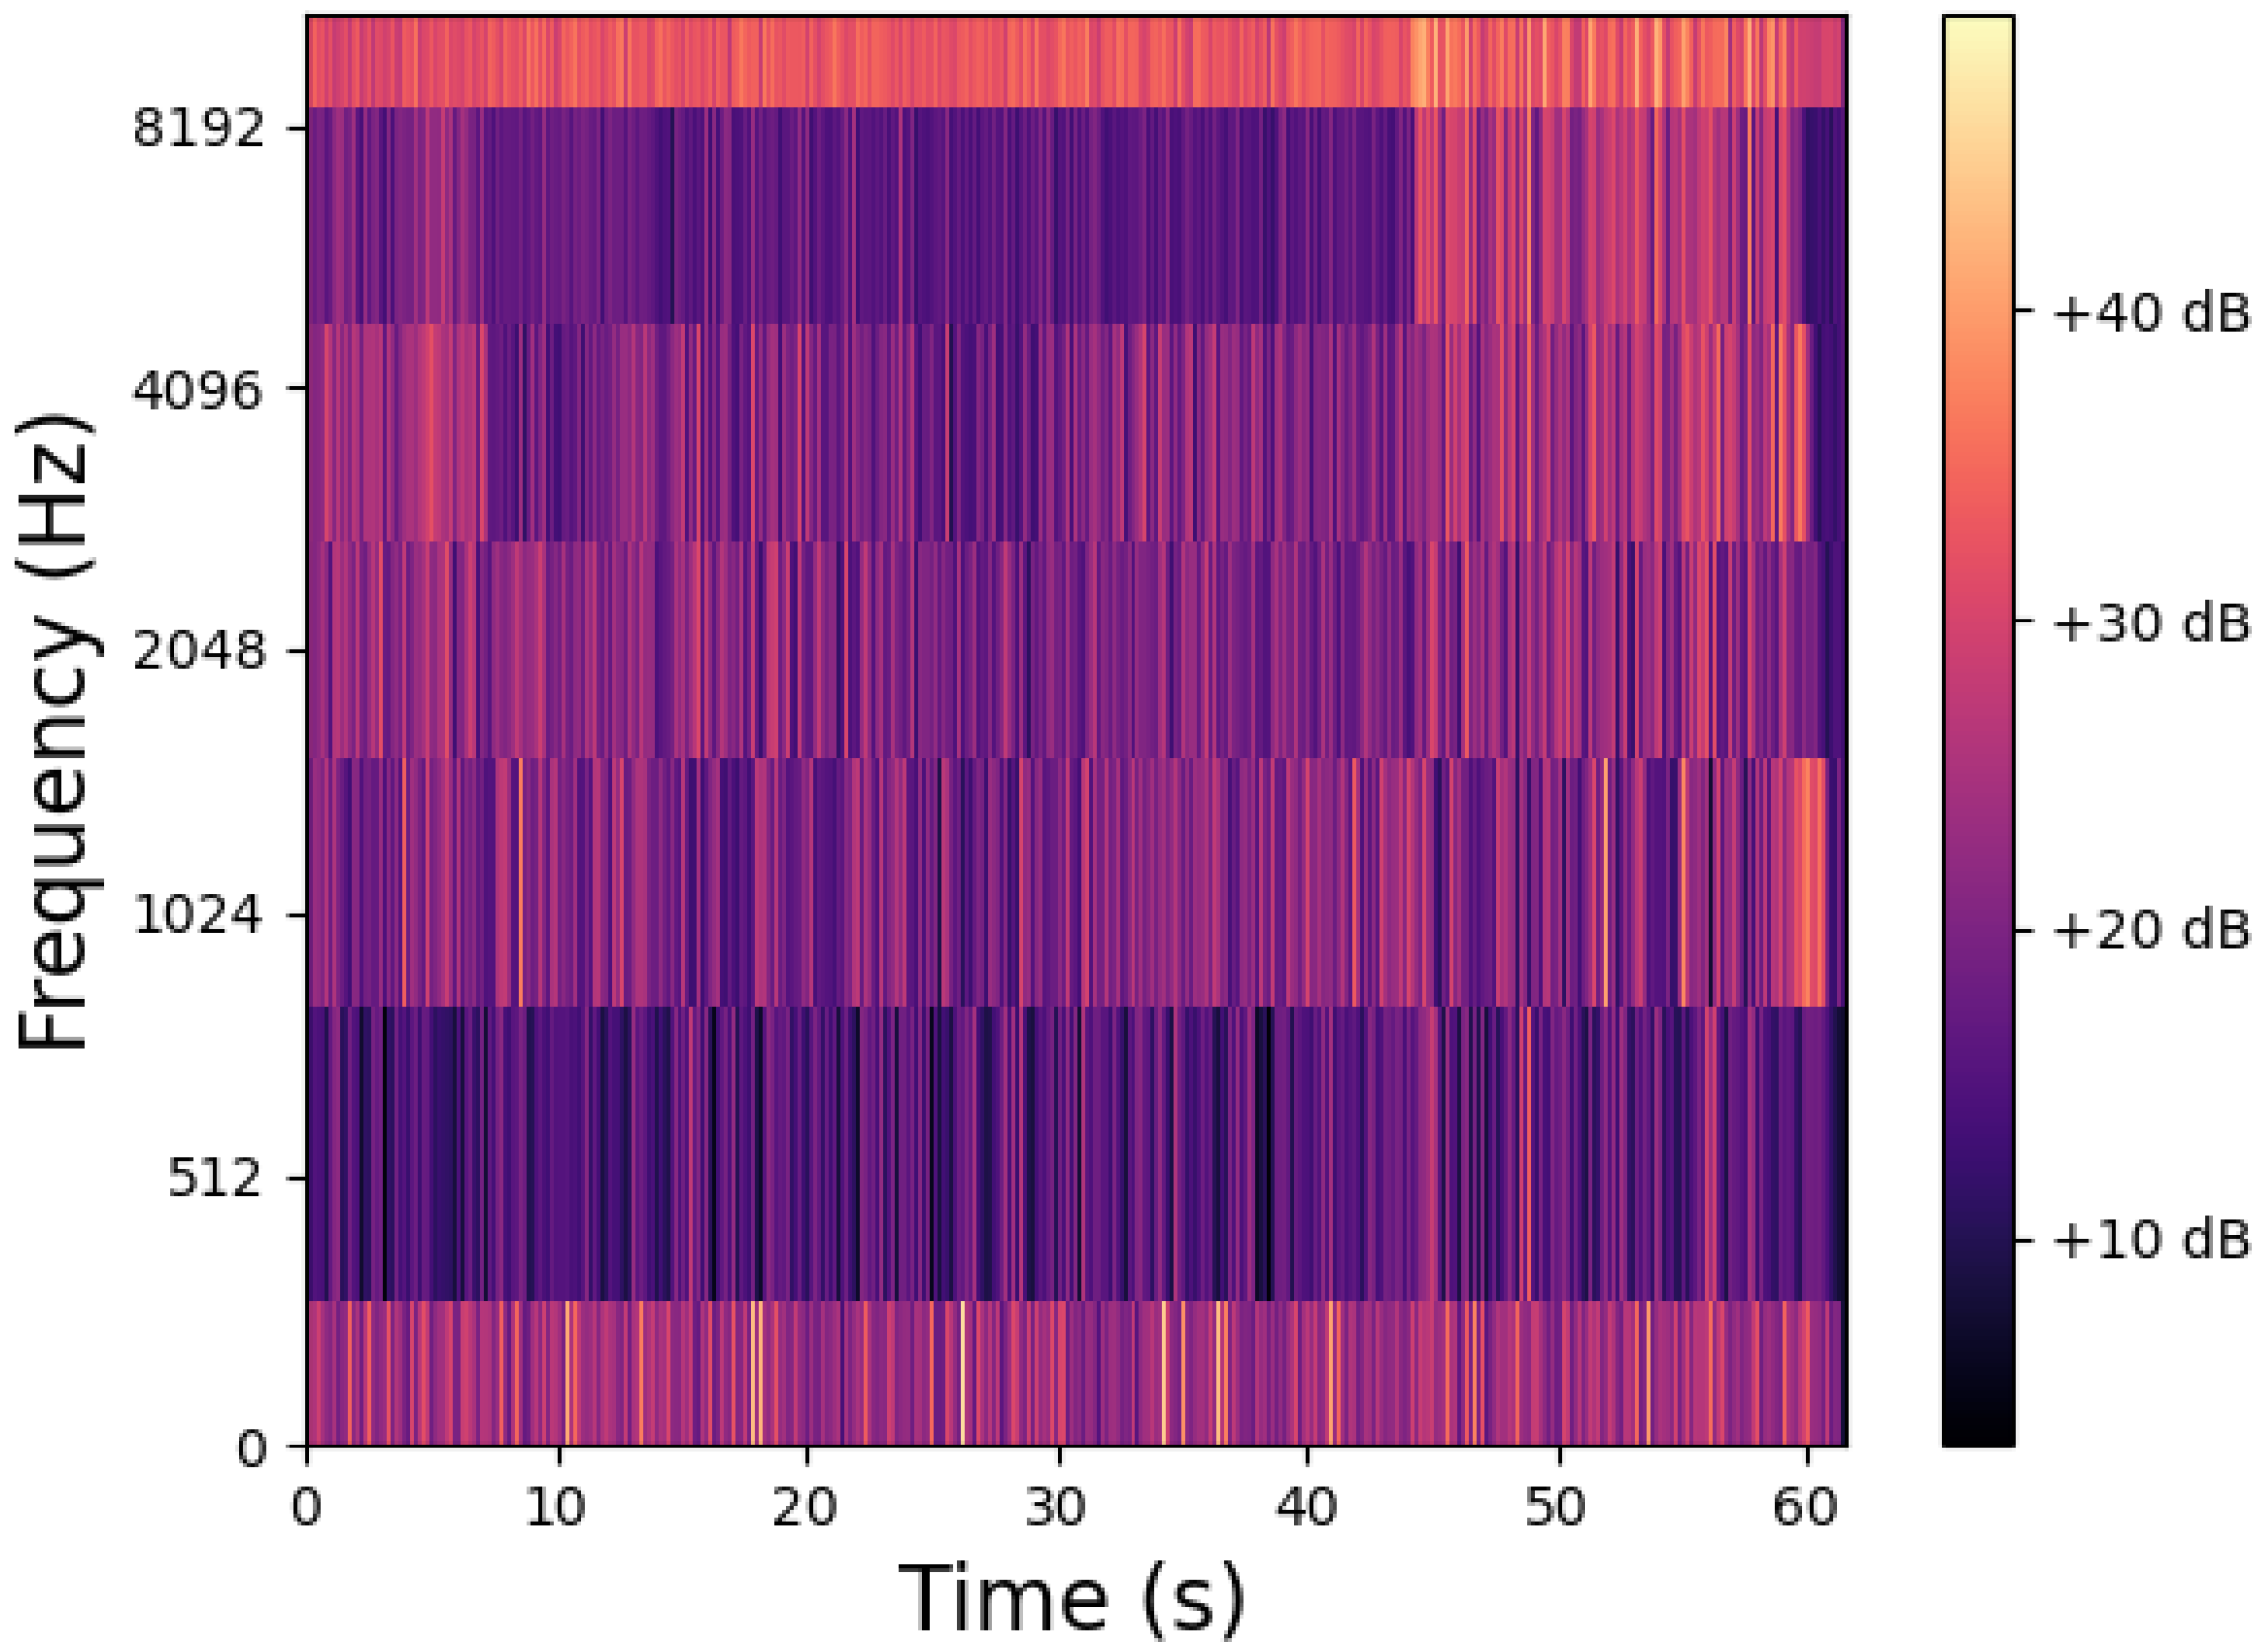
The spectral contrast of the sample audio file is represented in
Figure 7. Spectral contrast extracts the spectral peaks, valleys, and their differences in each sub-band. The spectral contrast features represent the relative spectral characteristics.
Figure 8 shows the tonnetz features of the sample audio file. The tonnetz is a pitch space defined by the network of relationships between musical pitches in just intonation. It estimates tonal centroids as coordinates in a six-dimensional interval space.
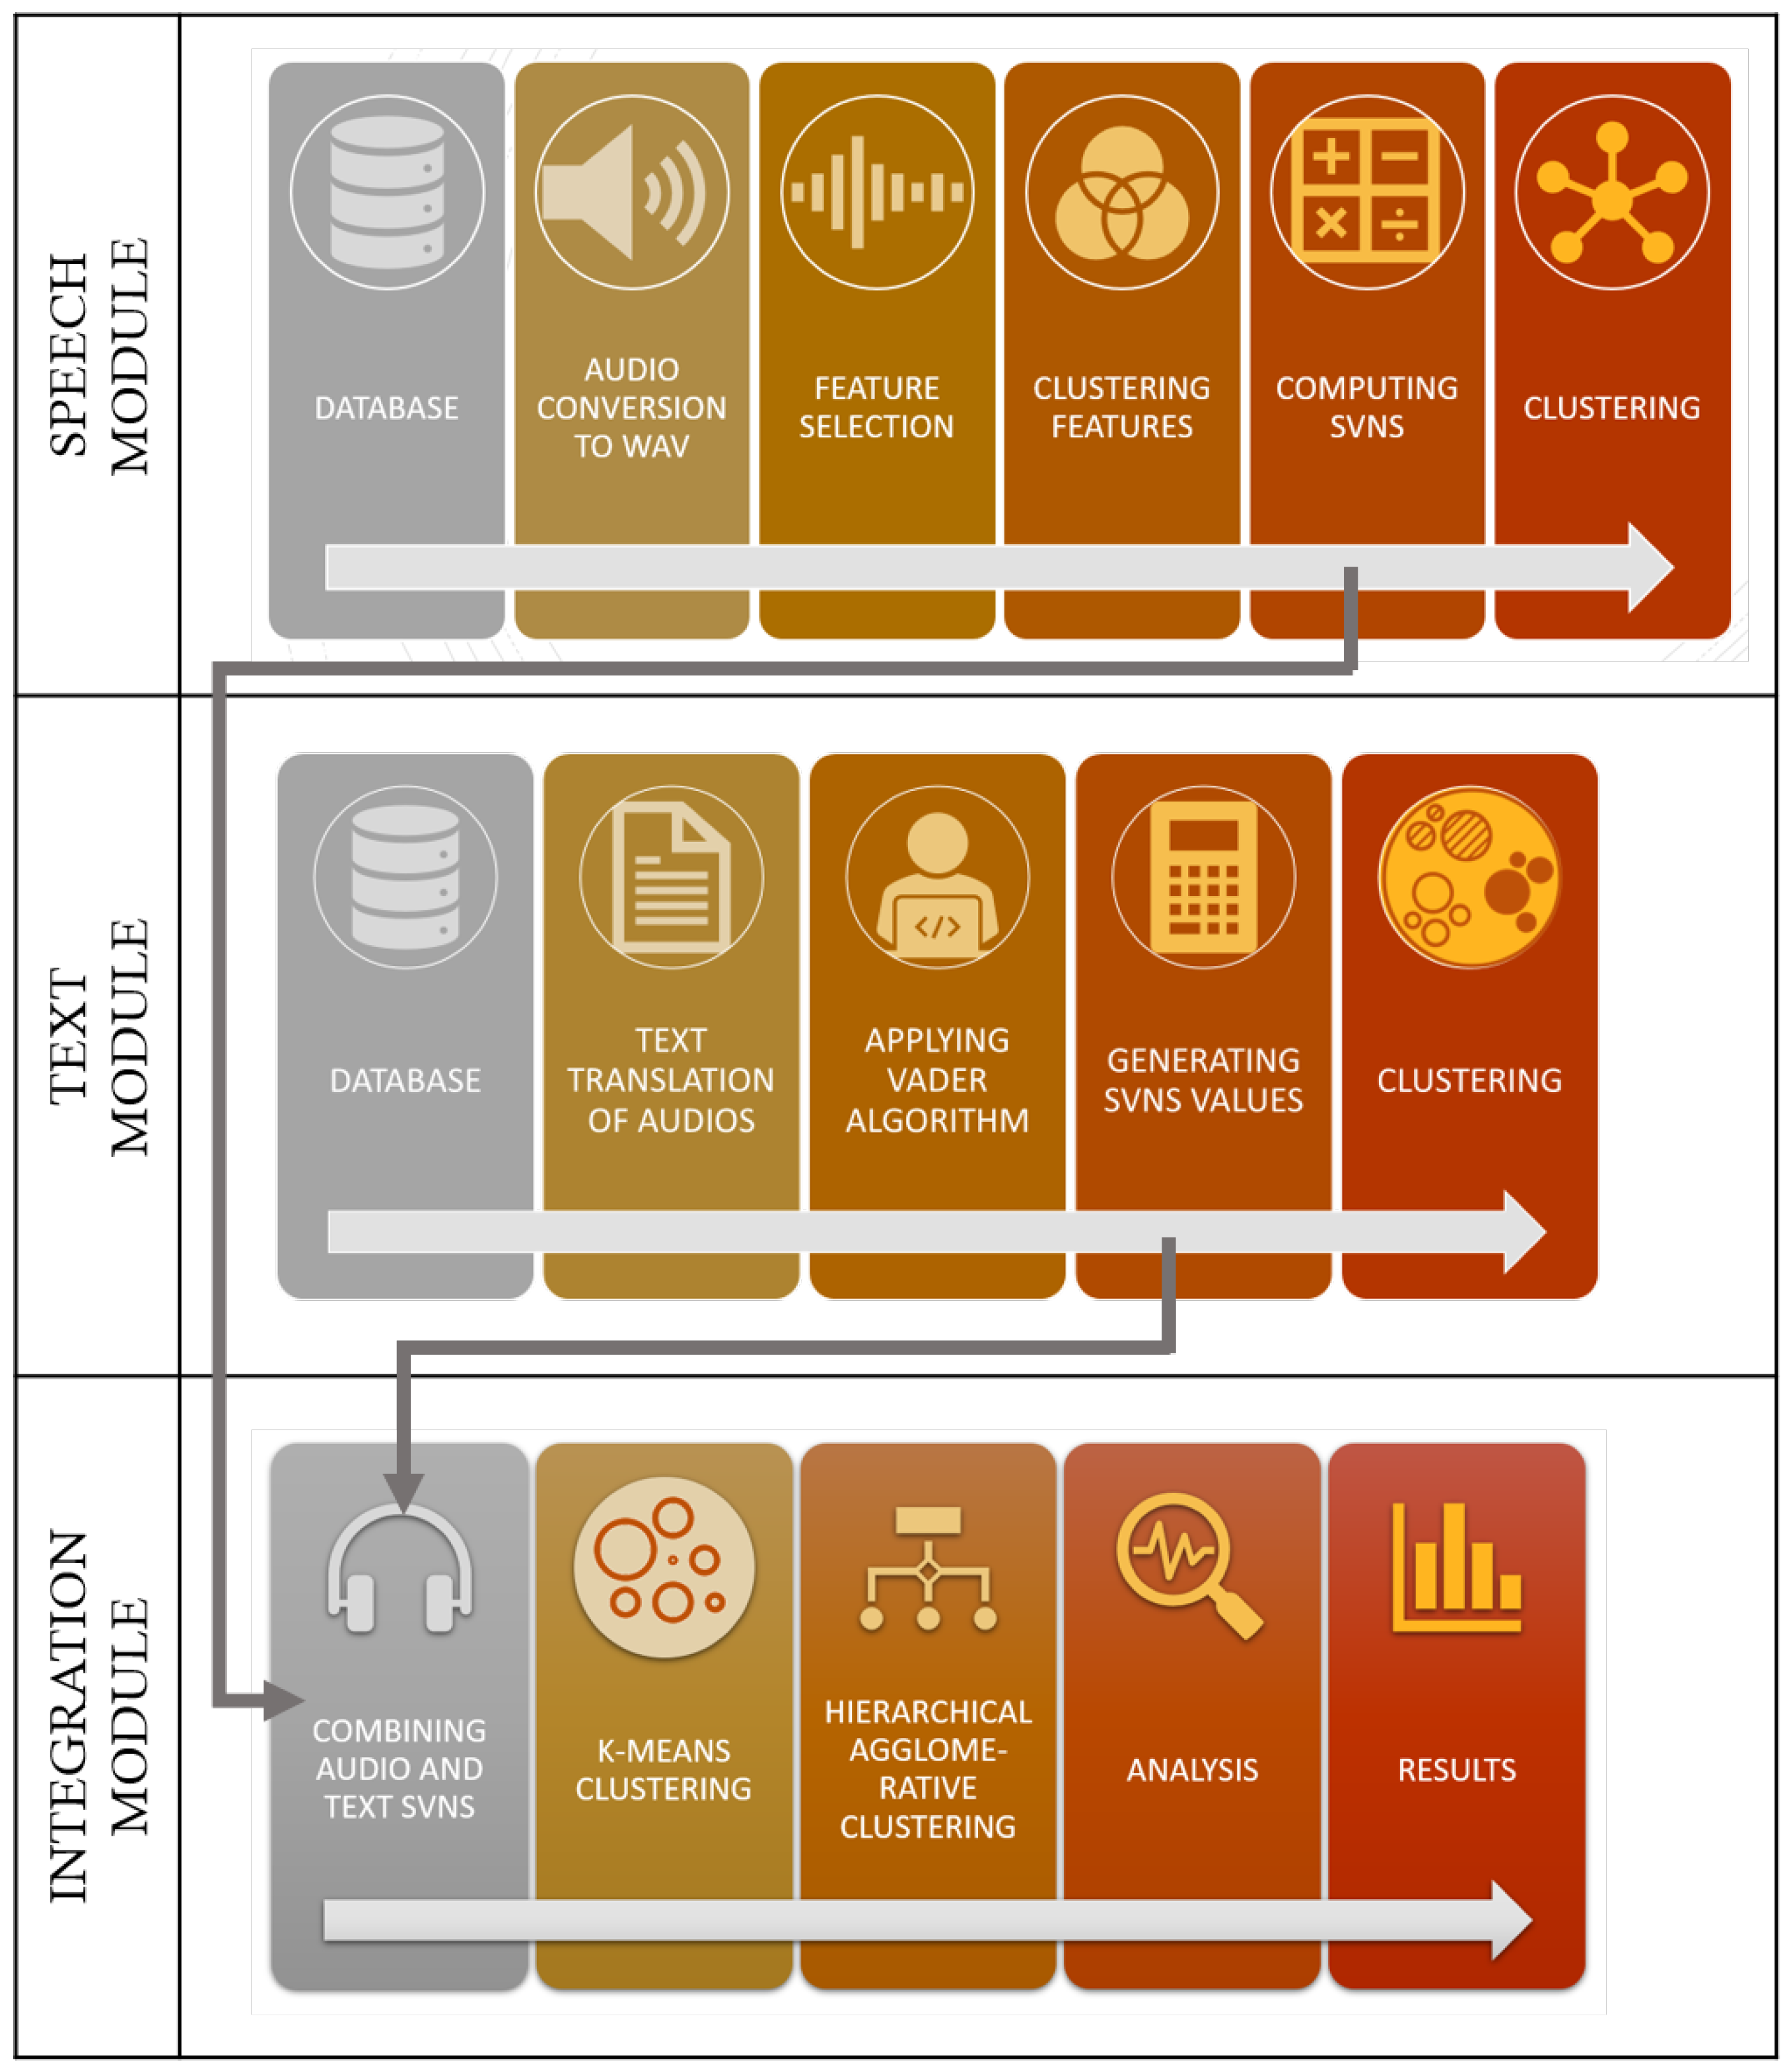
4. Model Description
4.1. Model Architecture
The research work follows a semi-hierarchical model where one step is followed by another but it is bifurcated into two wings one for audio and other for text and later on the SVNS are combined together in the integration module.
The overall architecture of the work is provided in
Figure 9. The process begins with selecting an appropriate dataset with audio to text translations. For the audio section, convert the audio files into .wav format and extract features for further processing. Since the dataset is unlabelled the only suitable choice in the machine learning algorithms are clustering algorithms. For this module, K-means clustering was chosen. Then the Euclidean distance(x) of each point from the centre of each cluster is calculated and
is used as the measure of that specific class, SVNS values were obtained. Clustering was performed again to visualise the SVNS as clusters.
For the text module, the text translations were considered and VADER tool was used to generate SVNS. After the generation of SVNS, it was clustered and visualized.
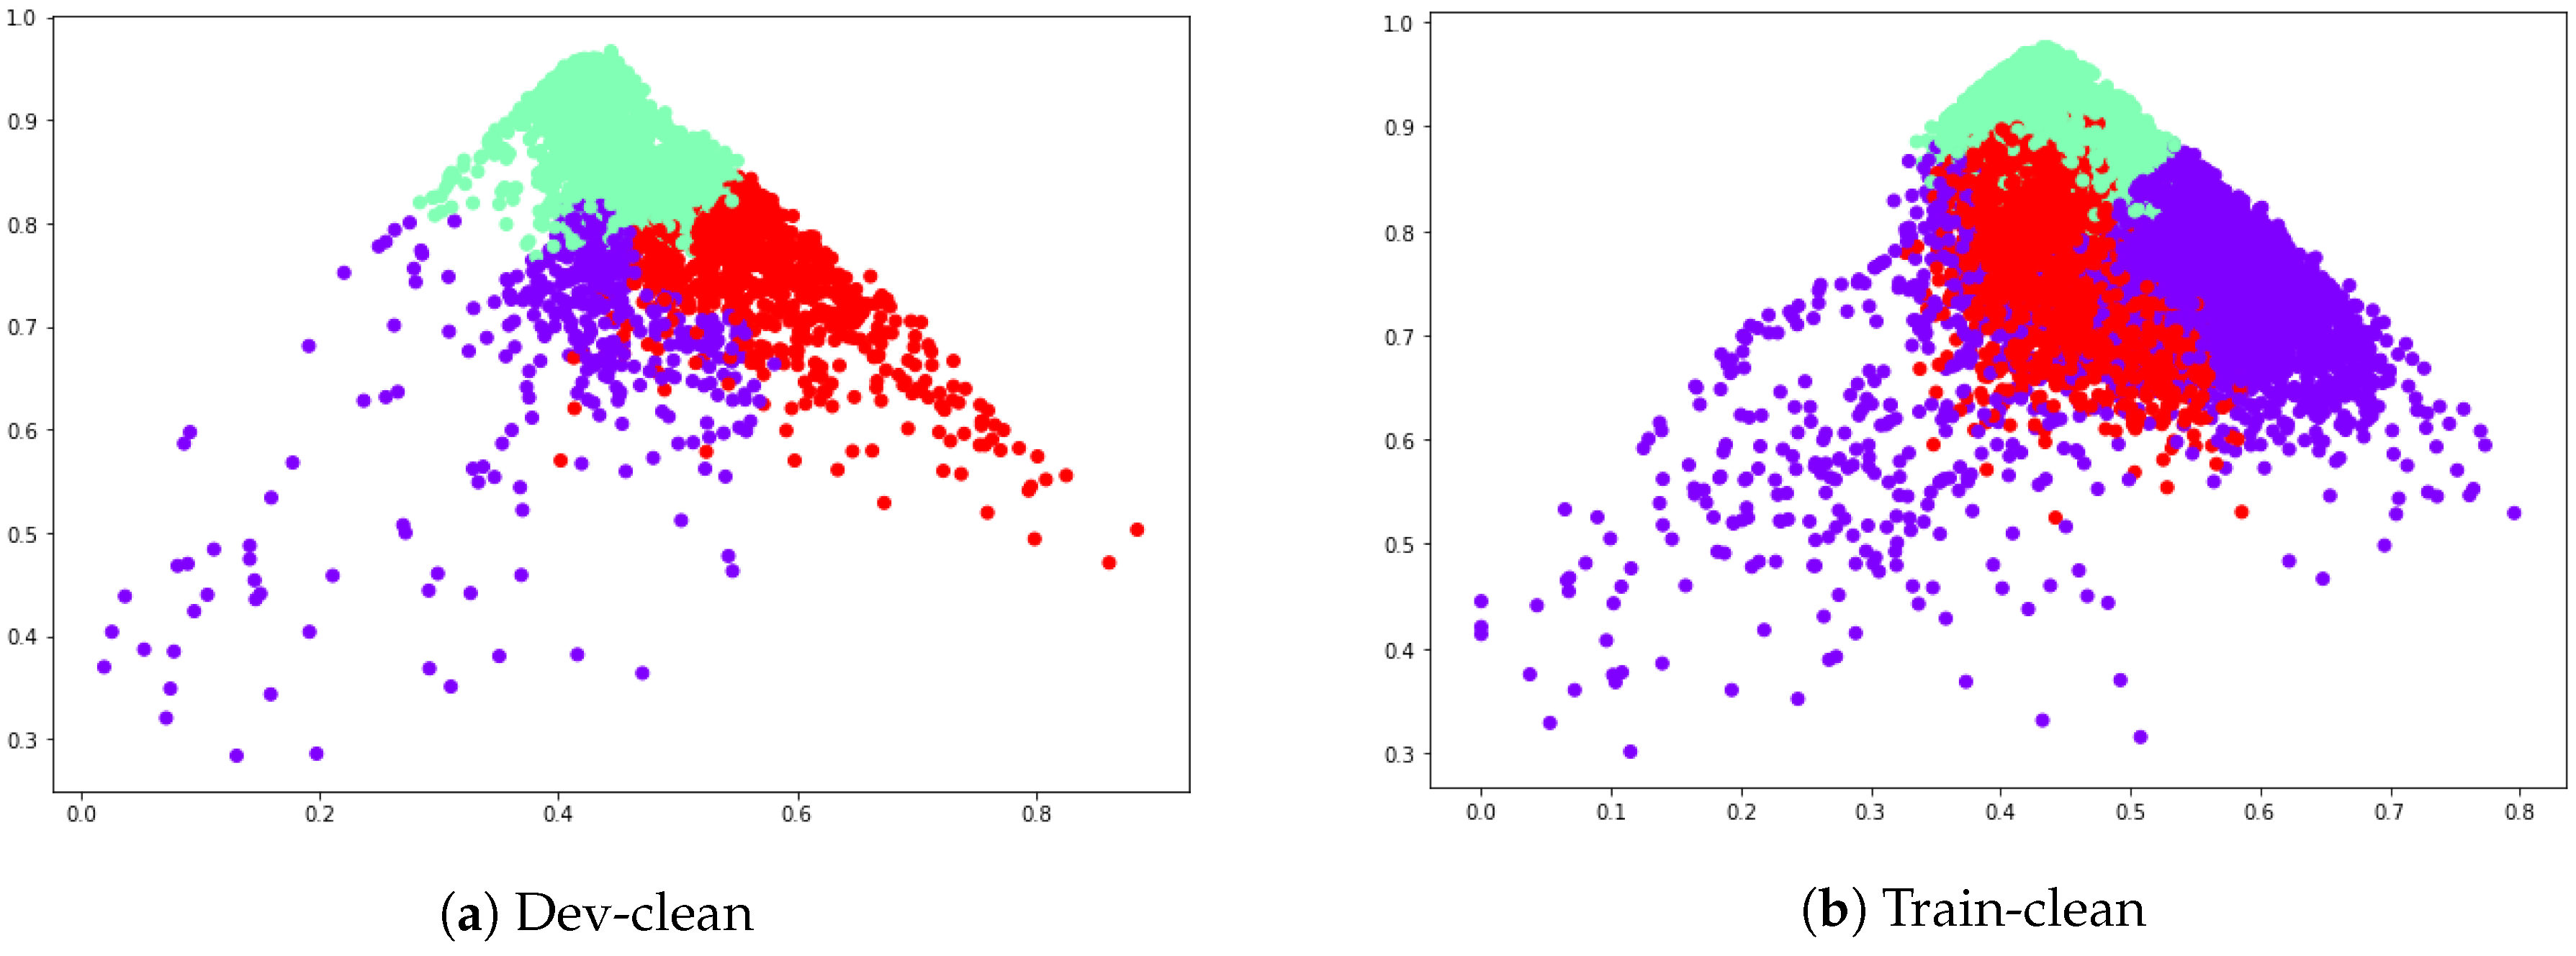
In the integration module the SVNS values obtained from speech module and text module was combined together, there by combining both the branches. The final SVNS are calculated by averaging the audio and text SVNS which are again clustered and visualized for comparison.
4.2. Data Processing
Dataset played a crucial role in this research work. The reason being we wanted to map audio SVNS to text SVNS for comparison so a dataset with audio translation was required. Hence LibriSpeech dataset [
2] was chosen. LibriSpeech is a corpus of approximately 1000 h of 16kHz read English speech. The data is derived from read audiobooks from the LibriVox project, and has been carefully segmented and aligned. For this purpose the following folders have been used:
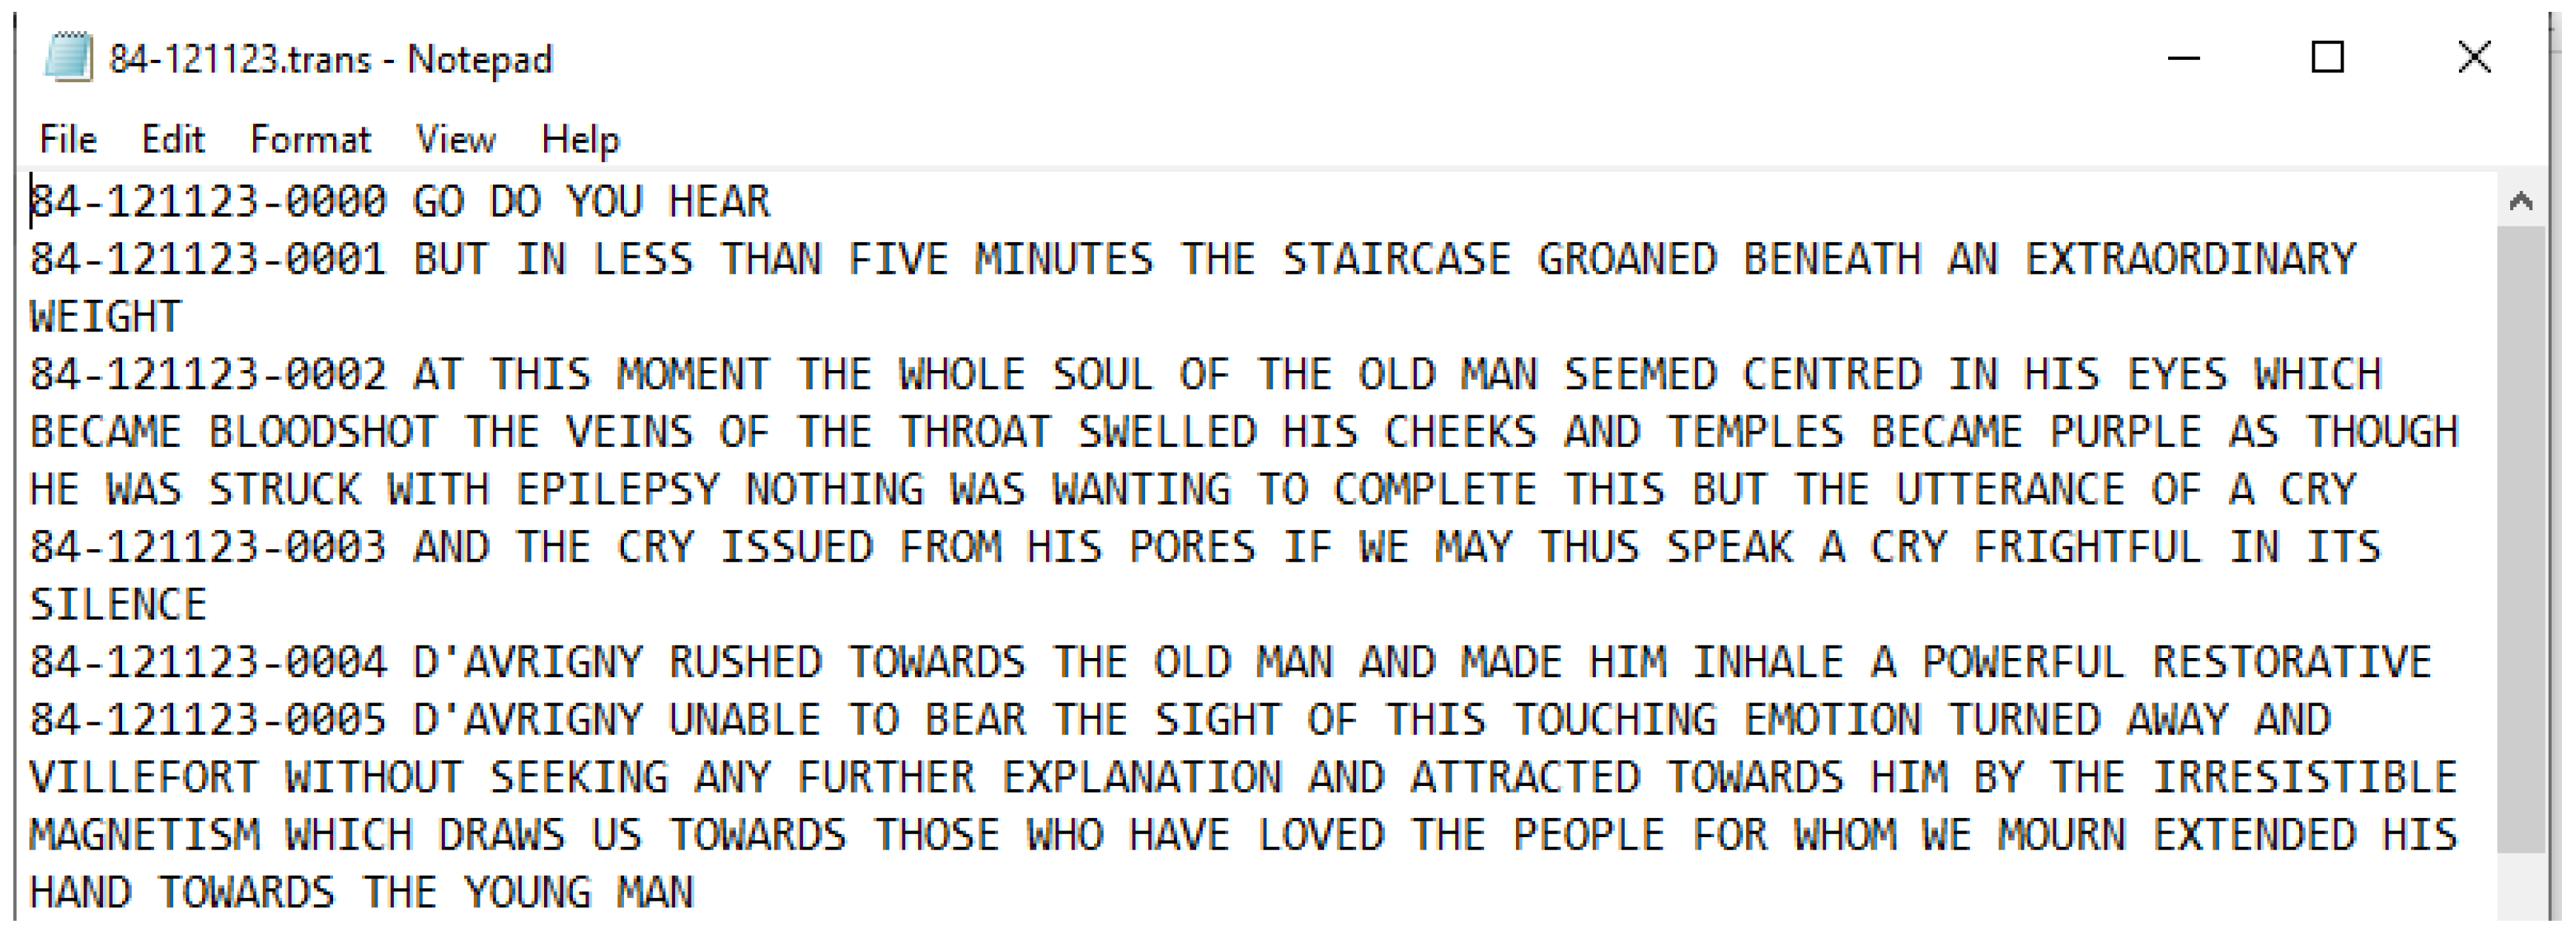
We used the dev clean (337MB) folder to test algorithms in the initial phase and then scaled up to train clean-100 (6.3 GB) to get the final results. We did not scale further due to hardware limitations. The reason for selecting the “clean” speech sets was to eliminate the more challenging audio and focus more on speech analysis. Since these are audio books, the dataset is structured in the following format. For example, 84-121123-0001.flac is present in the sub directory 121123 of directory 84, it implies that the reader ID for this audio file is 84 and the chapter is 121123. There is a separate chapters.txt which is provided along with the dataset that provides the details of the chapter. For example, 121123 is the chapter ‘Maximilian’ in the book ‘The Count of Monte Cristo’. In the same sub directory 121123 a text file is present, 84-121123.trans.txt which contains the audio to text translation of the audio files in that directory. The reason for choosing this dataset over others is that it provides audio to text translations of the audio files.
The processing of audio file from .flac format to .wav format was carried out. The dataset was available in .flac format. It was necessary to convert these files into .wav format for further processing and extracting features. For this ffmpeg was used in shell script with bash. Ffmpeg is a free and open-source project consisting of a vast software suite of libraries and programs for handling video, audio, and other multimedia files and streams.
4.3. Feature Extraction
The audio files were then fed into the python feature extraction script which extracted 193 features per audio file. Using the Librosa package in python following features were extracted
MFCC (40)
Chroma (12)
Mel (128)
Contrast (7)
Tonnetz (6)
The following npy files were generated as result:
Then these files were normalized using sklearn. The screenshot of the normalized audio features is given in
Figure 10.
4.4. Clustering and Visualization
4.4.1. K-Means
The K-means algorithms used for clustering SVNS values for sentiment analysis was proposed in [
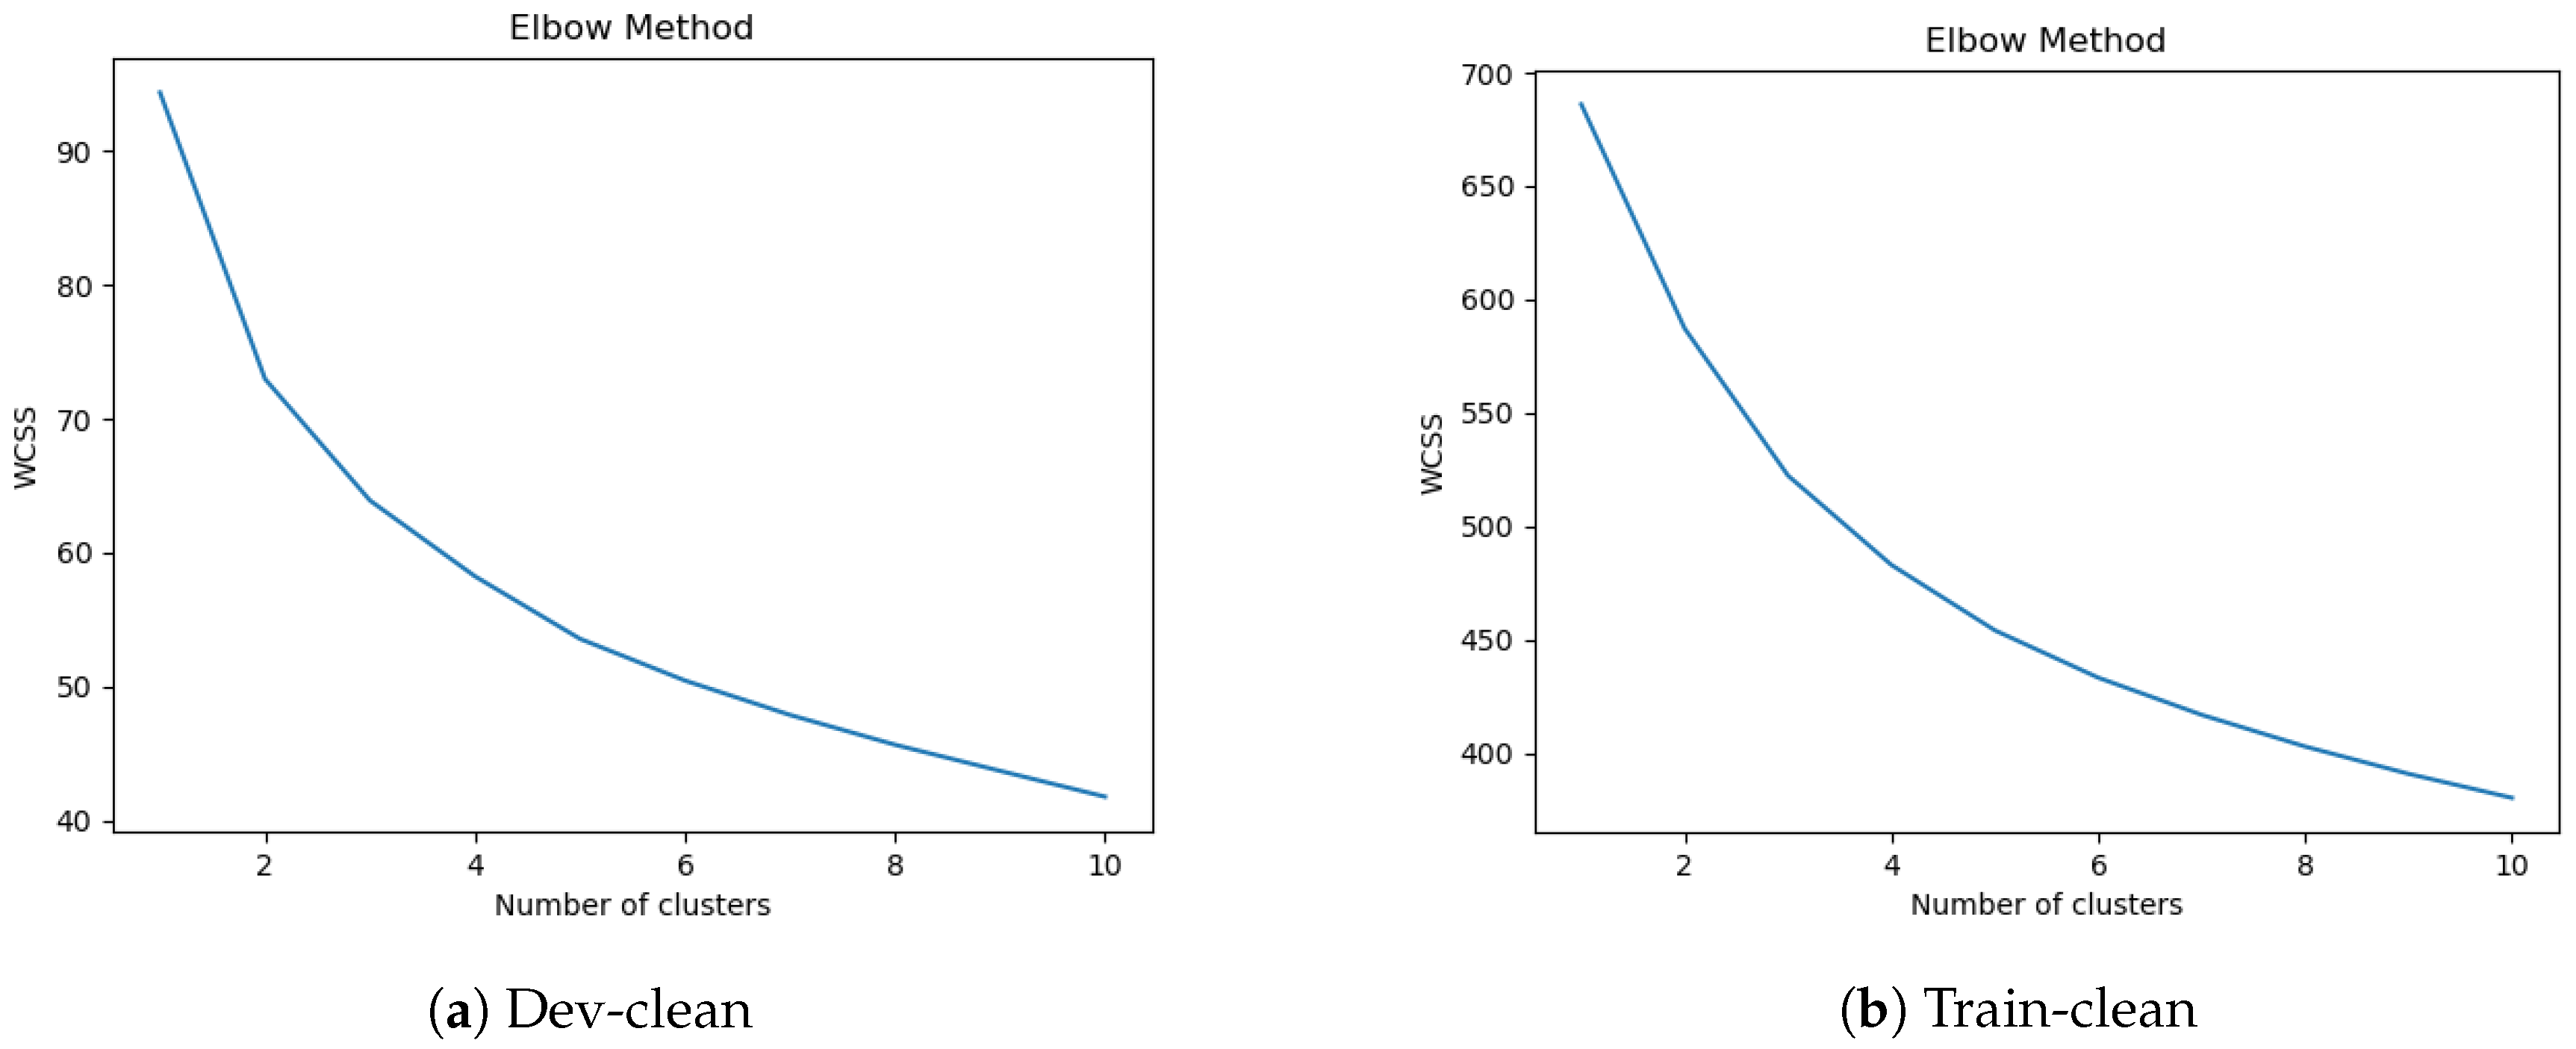
13]. It is a simple algorithm which produces the same results irrespective of the order of the dataset. The input is the SVNS values as dataset and the number of clusters (K) required. The algorithm then picks K SVNS values from the dataset randomly and assigns them as centroid. Then repeatedly the distance between other SVNS values and centroids are calculated and they are assigned to one cluster. This process continues till the centroid stops changing. Elbow method specifies what a good K (number of clusters) would be based on the sum of squared distance (SSE) between data points and their assigned clusters’ centroids.
4.4.2. Hierarchical Agglomerative Clustering and Visualization
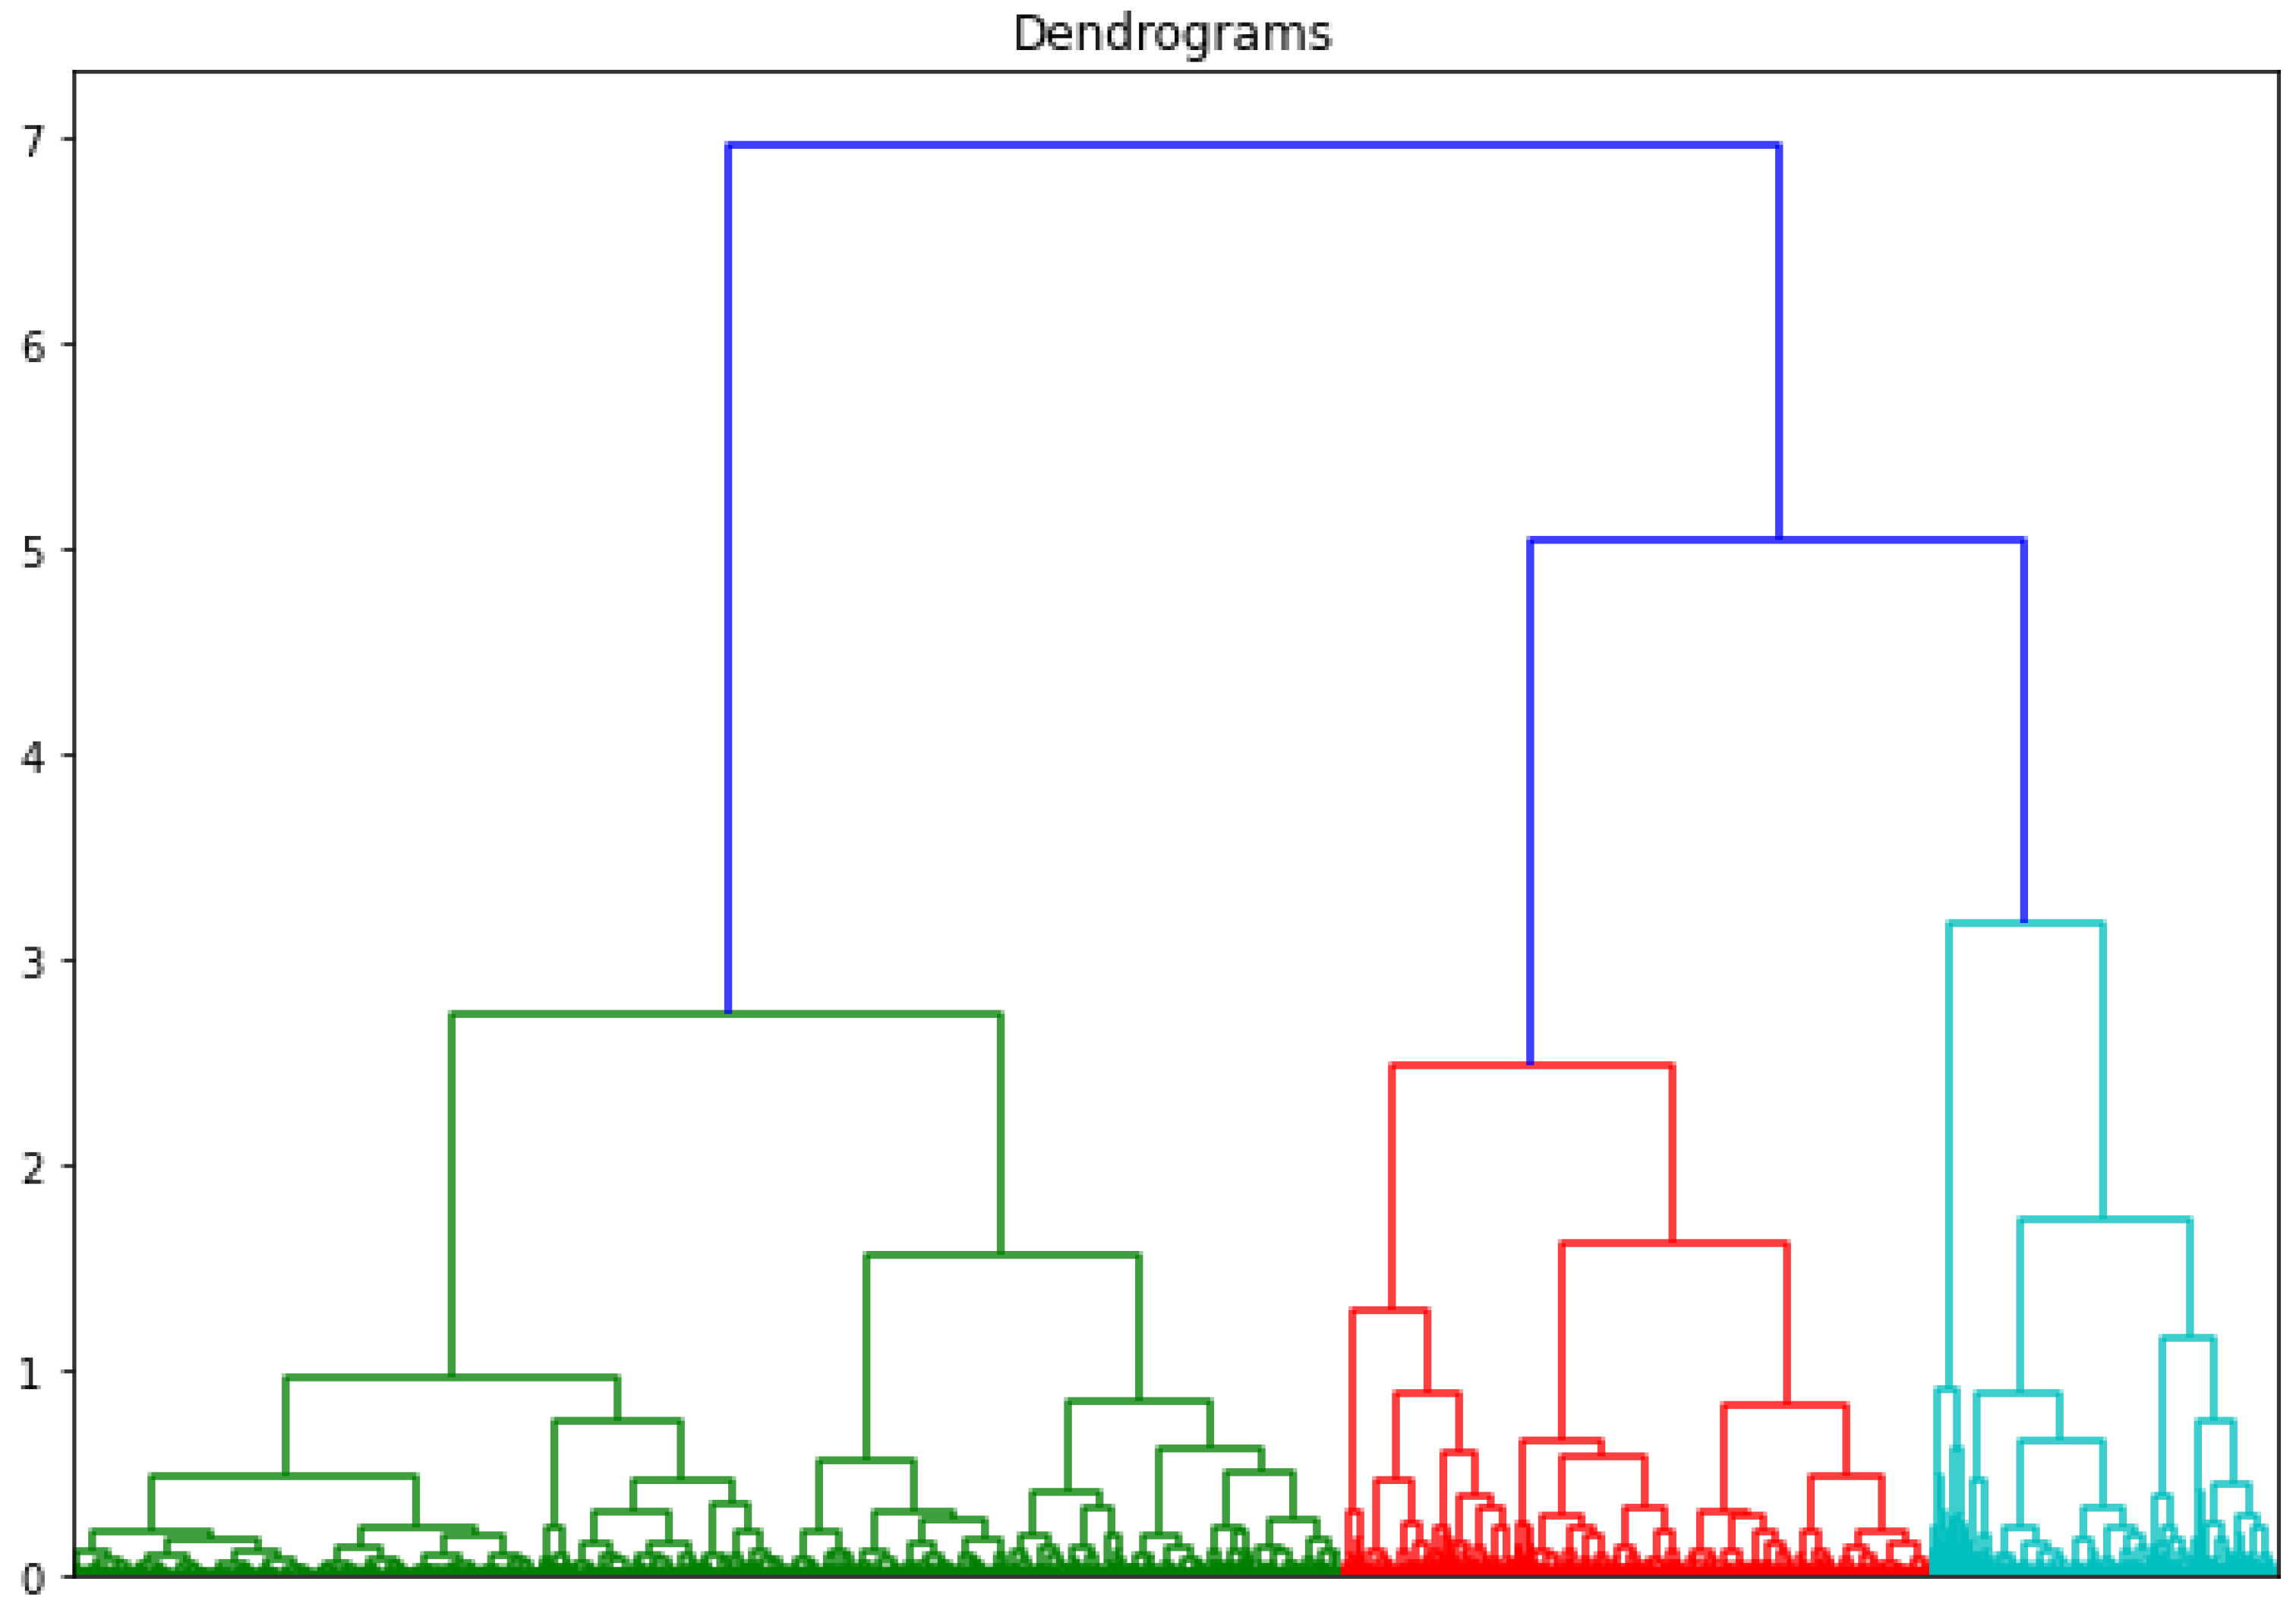
Hierarchical clustering is a machine learning algorithm used to group similar data together based on a similarity measure or the Euclidean distance between the data points. It is generally used for unlabelled data. There are two types of hierarchical clustering approaches: divisive and agglomerative. Hierarchical divisive clustering refers to top to down approach where all the data is assigned to one cluster and then partitioned further into clusters. In hierarchical agglomerative clustering all the data points are treated as individual clusters and then with every step data points closest to each other are identified and grouped together. This process is continued until all the data points are grouped into one cluster, creating a dendogram. The algorithm for hierarchical agglomerative clustering of SVNS values is given in Algorithm 1.
| Algorithm 1: Hierarchical agglomerative clustering. |
 |
4.5. Generating SVNS Values
4.5.1. Speech Module
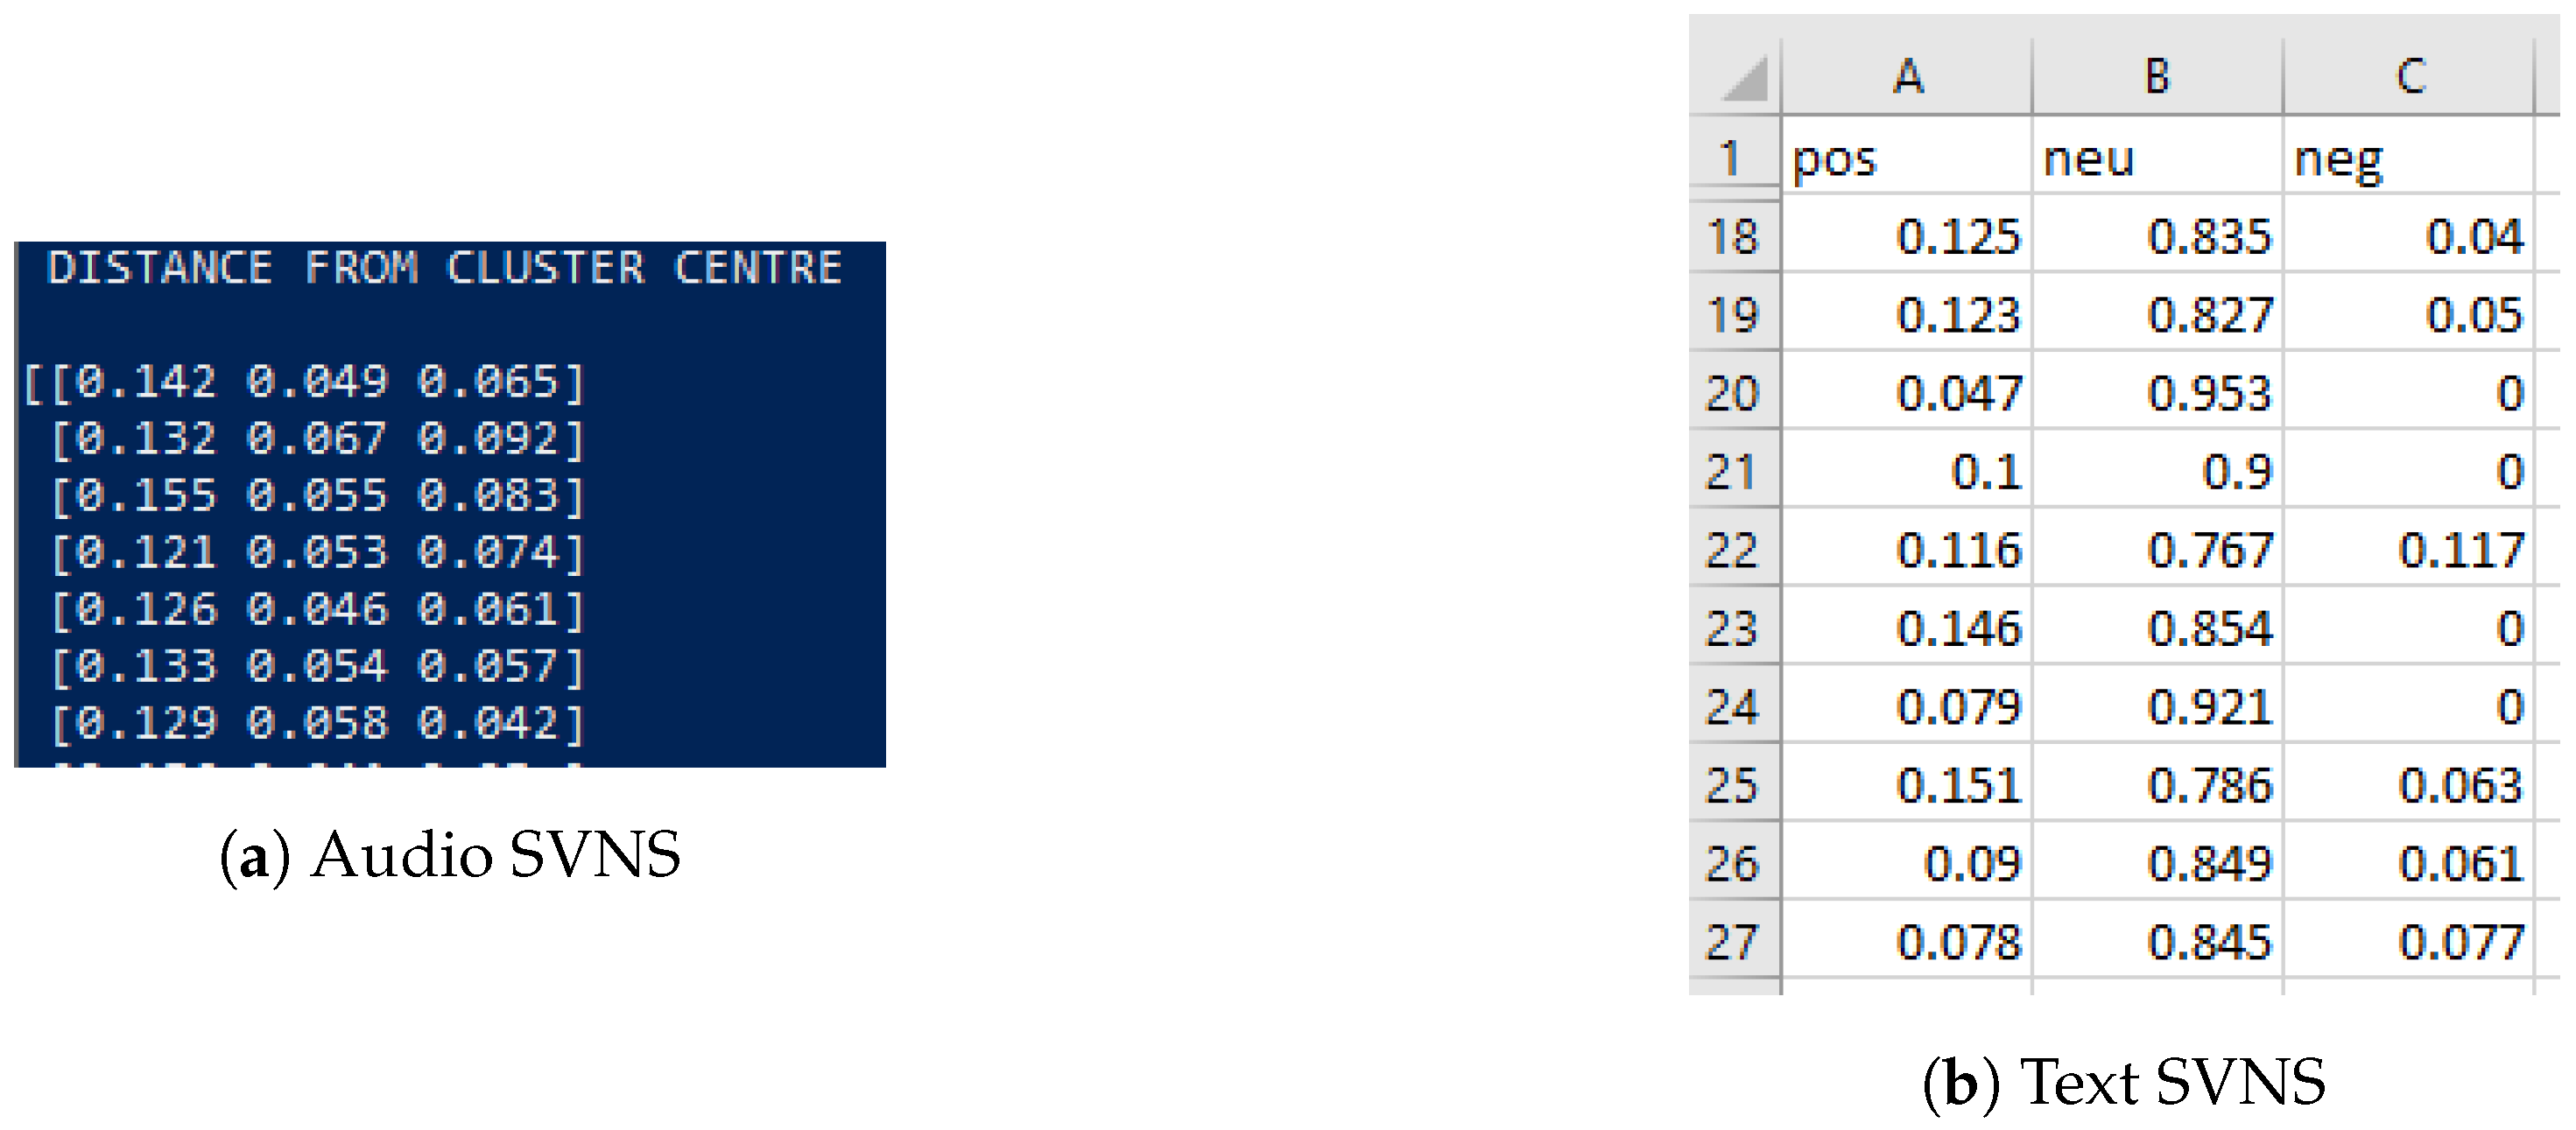
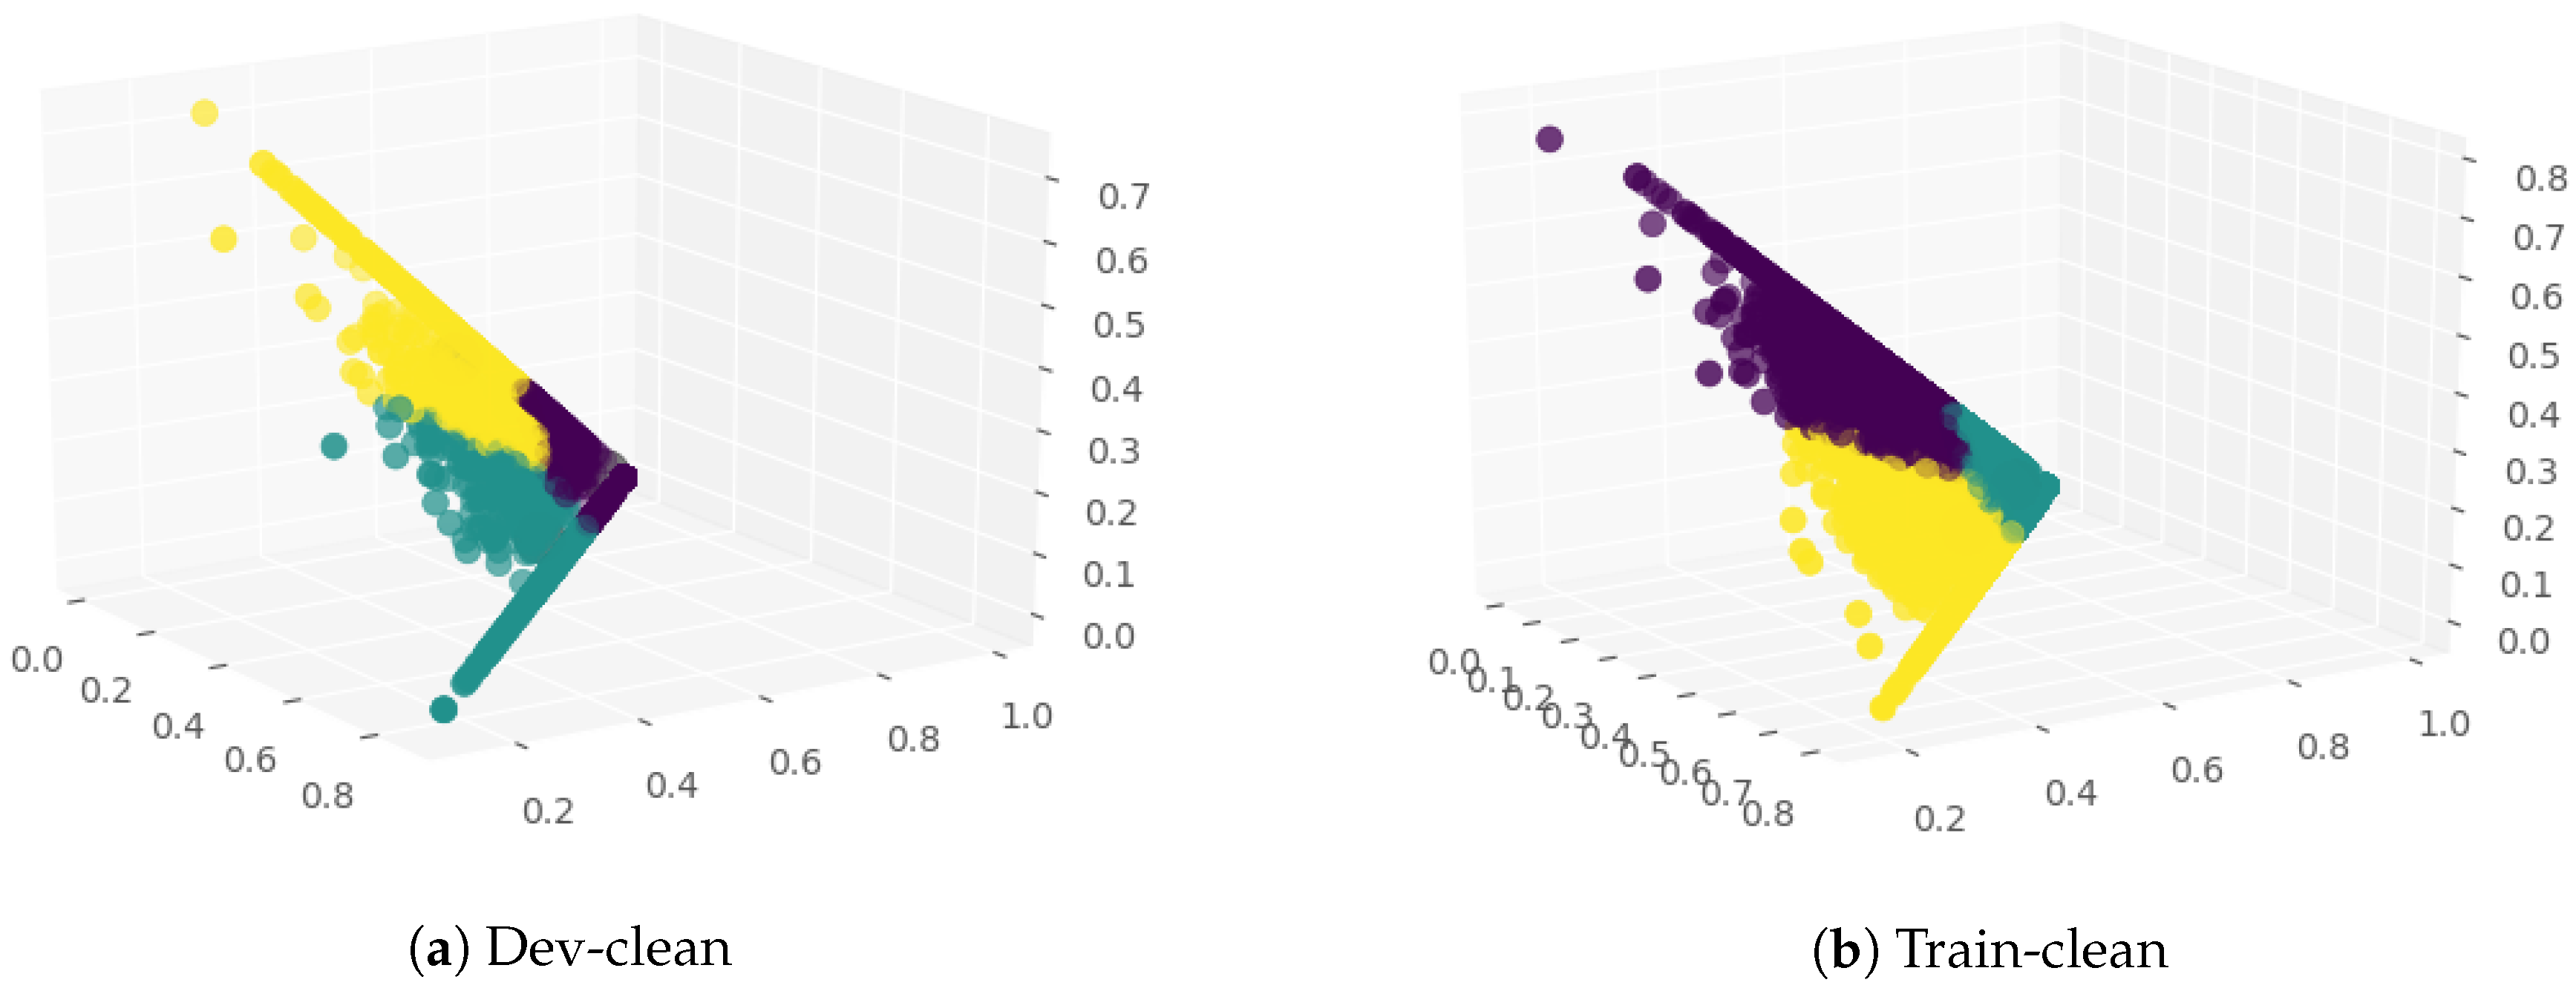
Since the dataset was unlabelled, K-means algorithm was used for clustering. With K being set to 3, the clusters were obtained. Let the cluster centres be and . and were mapped as positive, neutral, and negative clusters, respectively. We randomly selected 30 samples from each cluster and mapped the maximum sentiment of the sample as the sentiment of the cluster. For every data point P, in the dataset distance was calculated to the centres of each cluster. 1-distance implied the closeness measure to each cluster or class (positive, neutral or negative). SVNS for audio were created using 1-distance and stored in a .csv file as .
4.5.2. Text Module
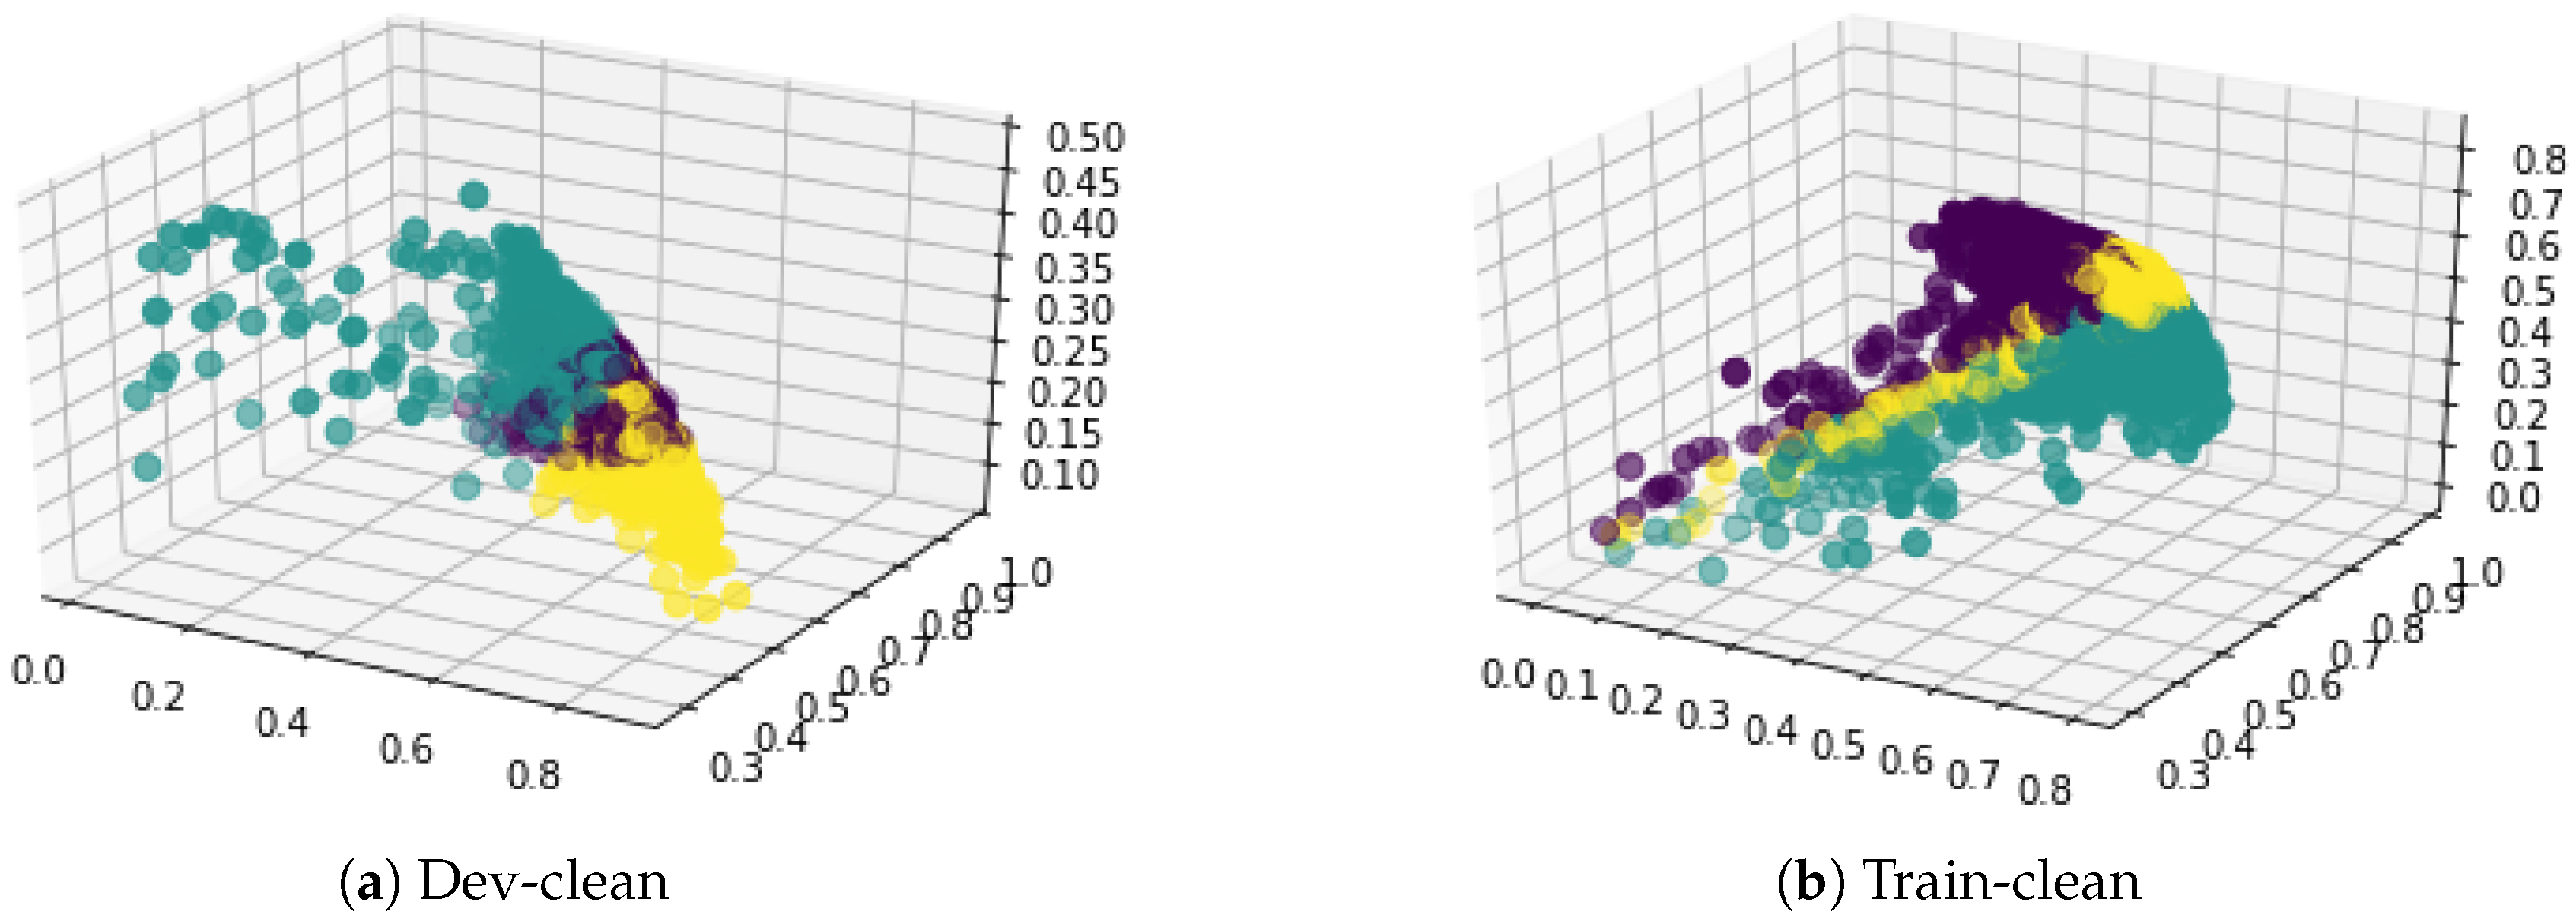
The next task is sentiment analysis of text translation using VADER. VADER is a tool used for sentiment analysis which provides a measure for positive, neutral and negative classes for each input sentence. Using VADER text translation for each audio was analysed and SVNS were generated and stored in .csv file as . Taking the csv file of text SVNS as input, K-means cluster with K, taken as 3, was performed.
4.5.3. Integration Module
Next, we proceed on to combine the SVNS, the audio SVNS values are represented by
and the text SVNS values are represented by
and the combined SVNS are represented by
, where the component values are calculated as
Combined SVNS values were generated using equations given in Equation (
1). The visualization of combined SVNS is carried out next. Using K-means clustering and hierarchical agglomerative clustering algorithms, the SVNS of audio, text and combined modules were visualized into 3 clusters.
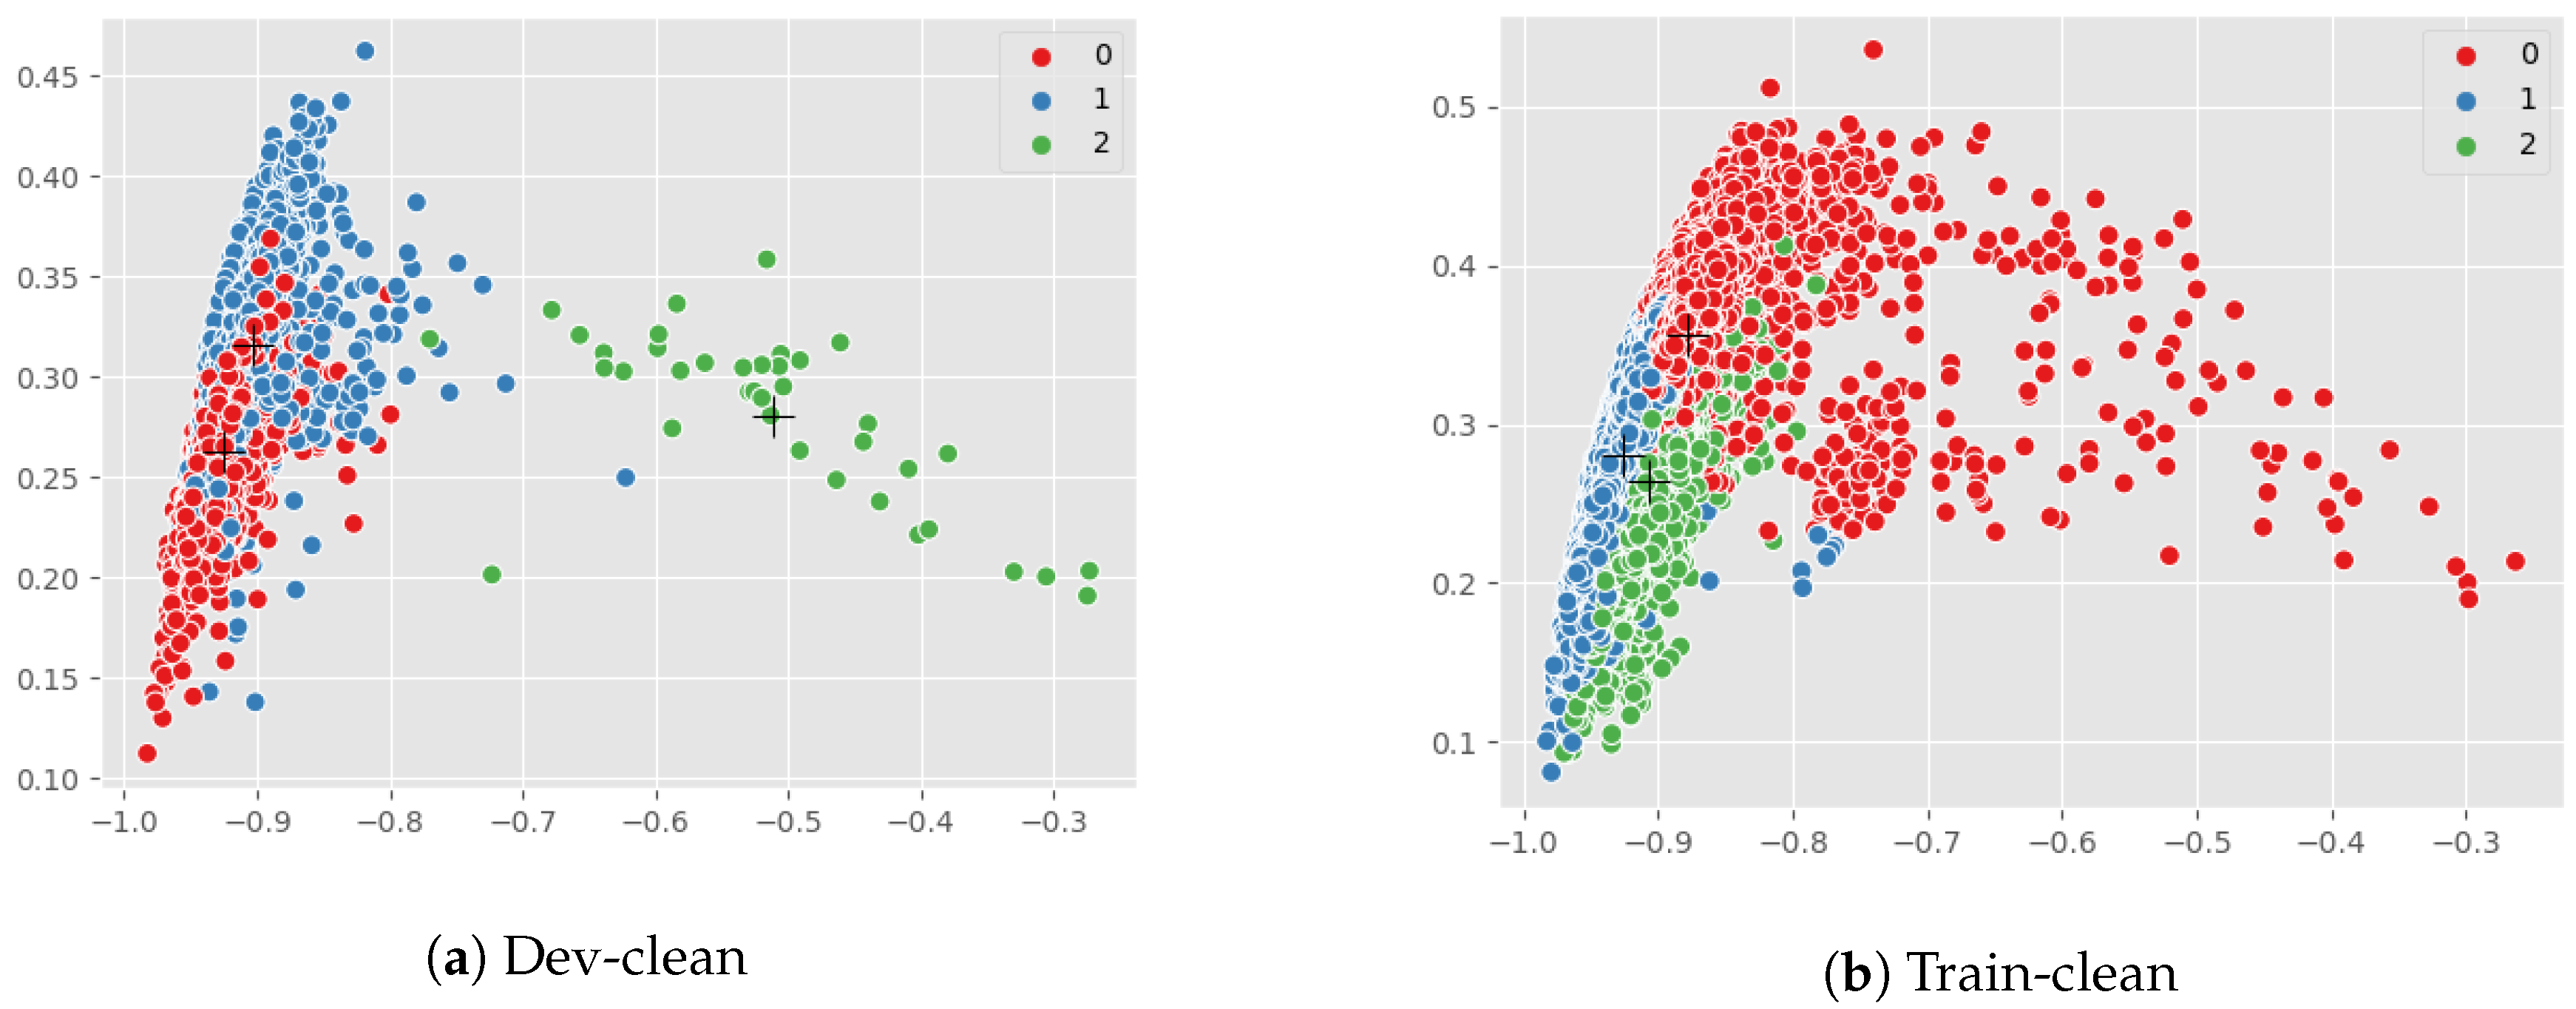
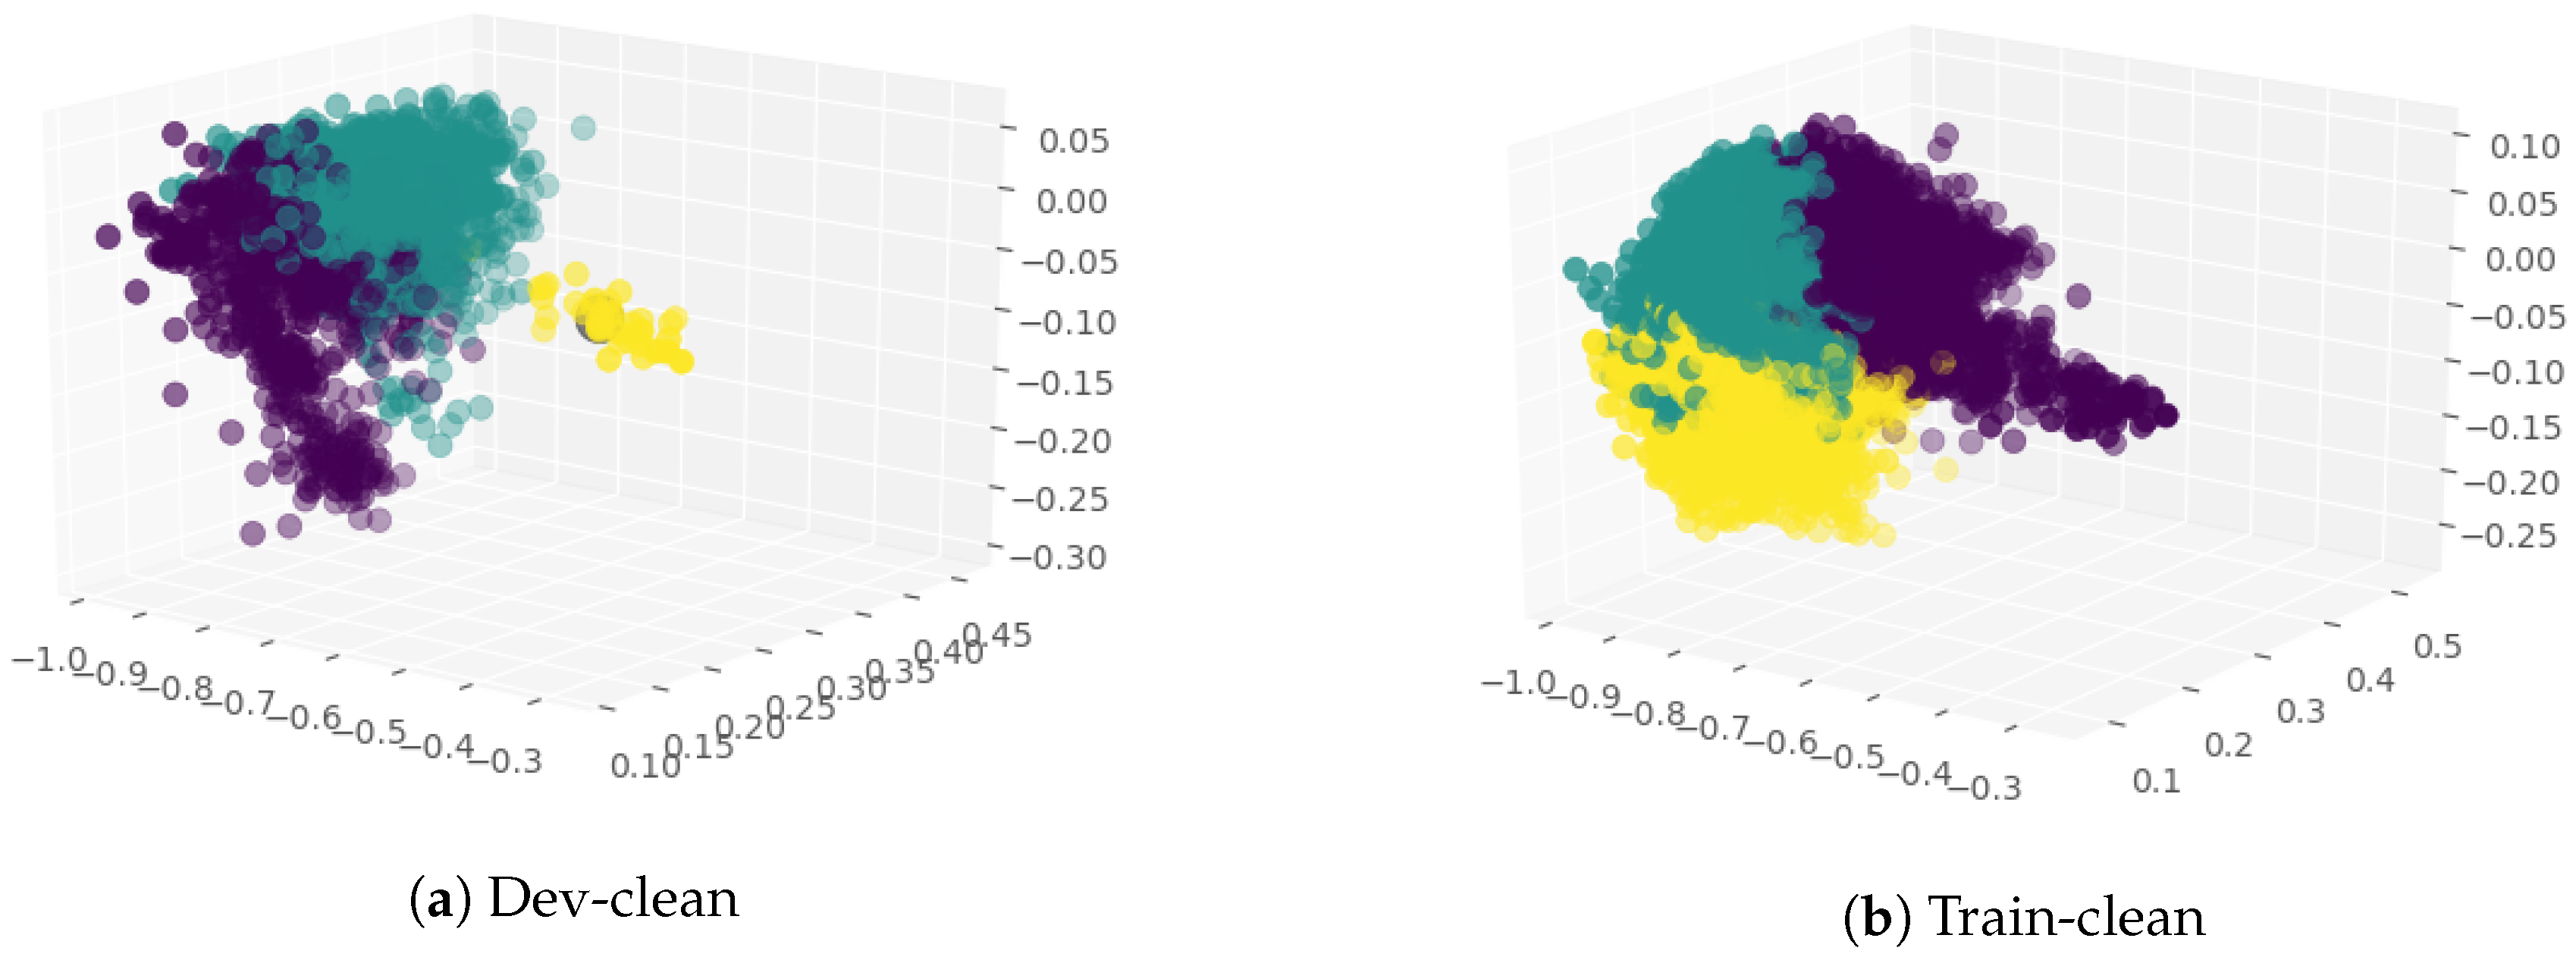
6. Result and Discussion
The visualization of clustering results and the dendogram clearly reveal the presence of neutrality in the data, which is validated by the existence of the third cluster. It is pertinent to note that, in case of sentiment analysis, data cannot be divided into positive and negative alone, the existence of neutrality needs to be acknowledged. After analysing the results of all the clustering algorithms, significant conclusions have been made. The concept of indeterminacy or neutrality has not yet been dealt with in normal or conventional and fuzzy sentiment analysis. SVNS provides a score for neutral sentiment along with positive and negative sentiments. Speech sentiment analysis using neutrosophic sets has not been done to date, whereas it can provide excellent results. The logic behind combining SVNS is to include both features related to the audio files derived from amplitude and frequency and pairing it with the analysis of text for better results. This is a much more wholesome approach than just picking either of the two.
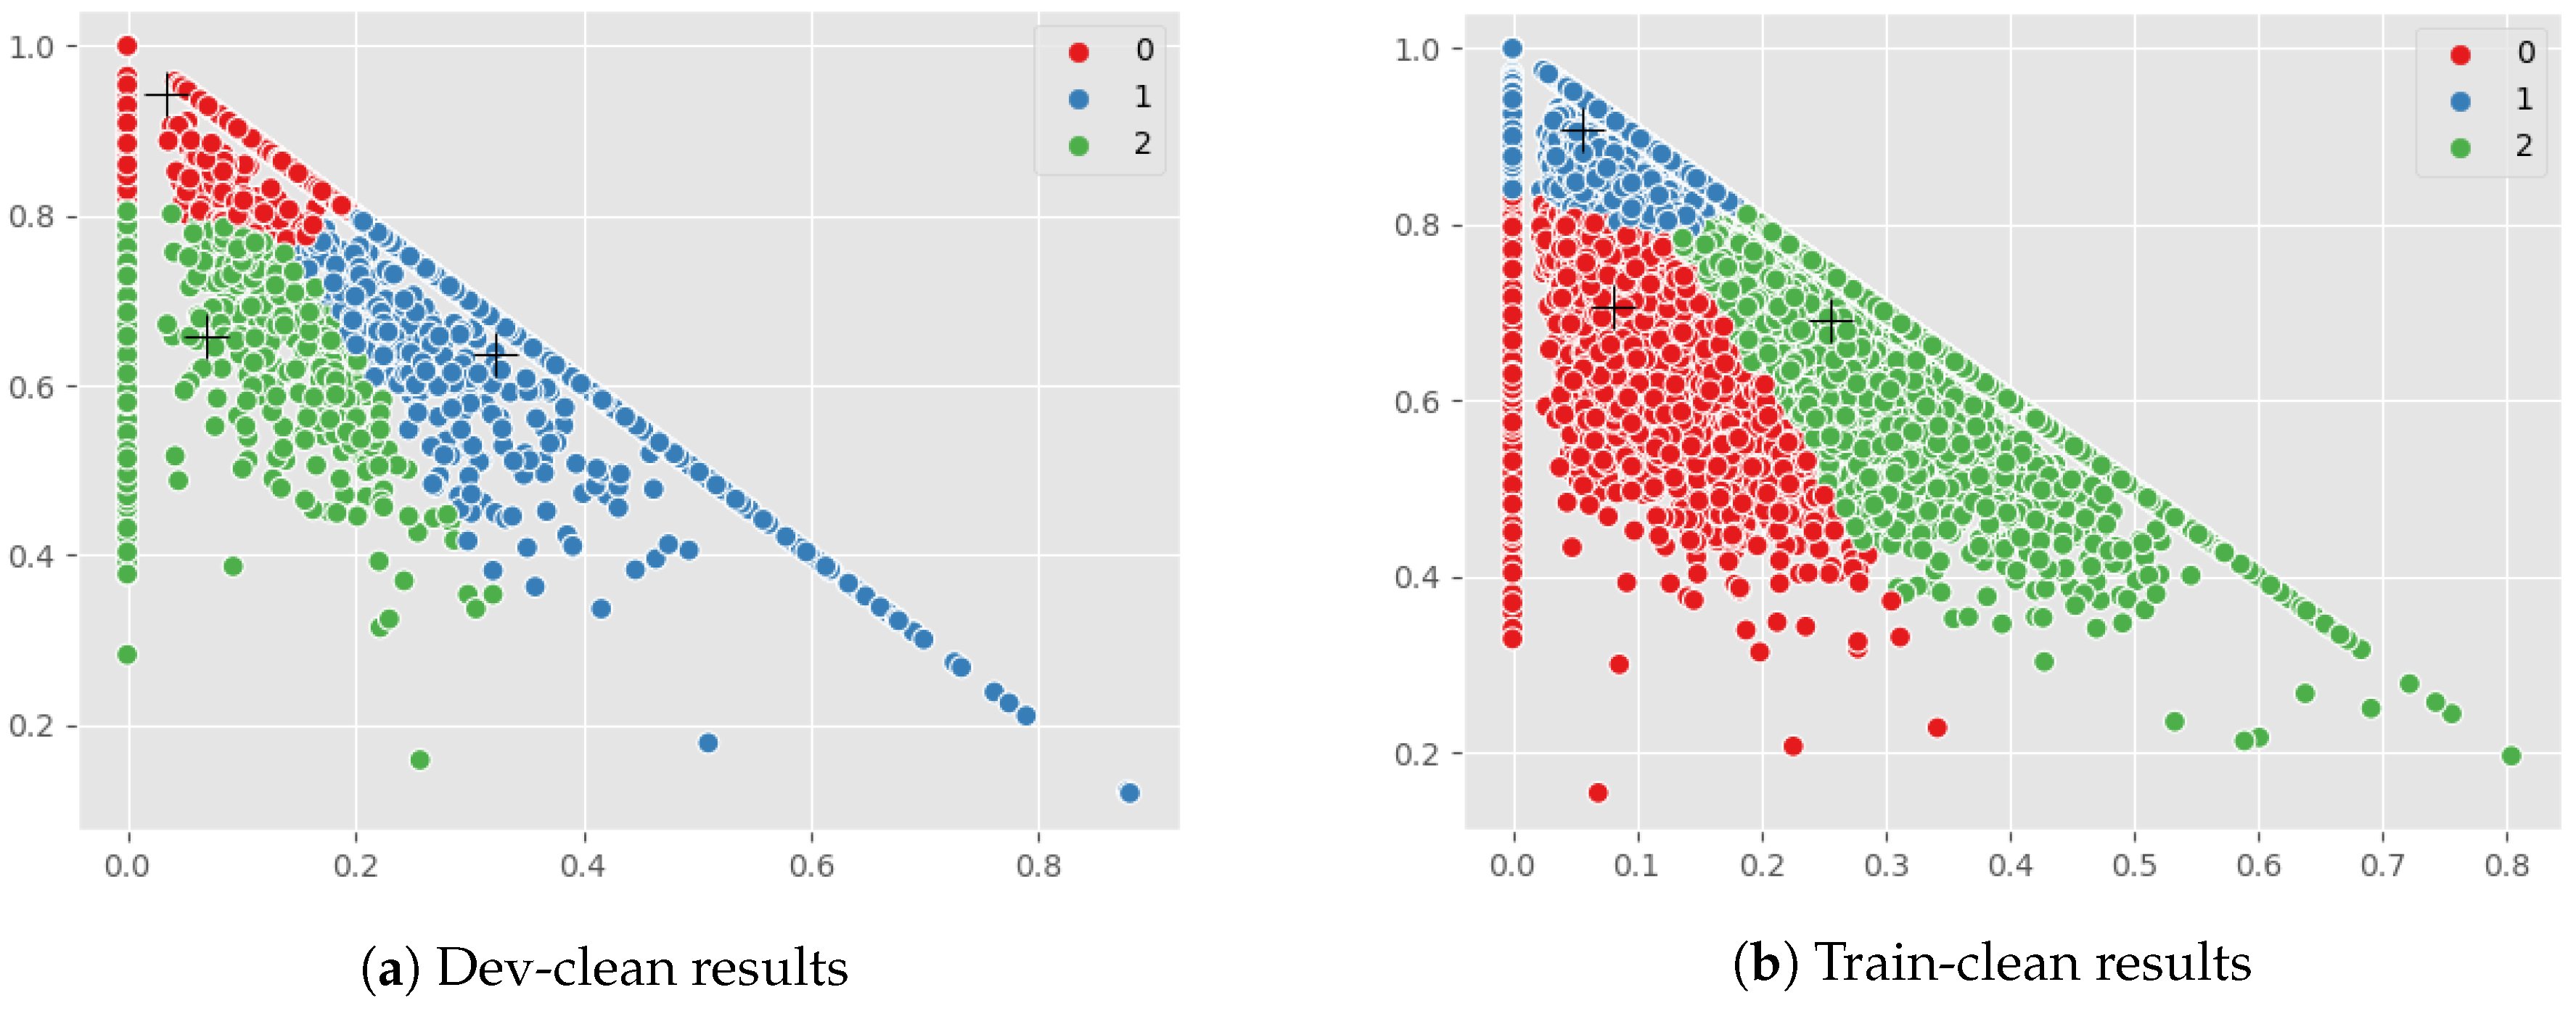
In
Table 1, the number of audio classified as cluster 1 (C1), cluster 2 (C2) and cluster 3 (C3) are shown for SVNS from audio features, text SVNS and the combined SVNS for dev-clean LibriSpeech folder which is 337 MB with 2703 audio. There is a considerable overlap in the values that are present in the cluster C1 and C2 and C3, for the three values from speech module, text module and combined module, respectively.
In
Table 2, the number of audio classified as cluster 1 (C1), cluster 2 (C2) and cluster 3 (C3) are shown for SVNS from audio features, text SVNS and the combined SVNS for train-clean-100 LibriSpeech folder which is 6.3 GB with 28539 audio. Since the dataset was unlabelled there was no other choice but to cluster the features, hence the output which was received was clusters without class tags, hence it cannot be identified with these given results which cluster represents positive class, neutral class or negative class. Class tags can be obtained from VADER composite score, but since our aim was to show the presence of neutrality in the data, we did not do the mapping of the clusters to a particular class using the VADER tool provided labels.
Instead, if we used the max of the SVNS values present in the cluster to map the cluster to a class tag. Accordingly we obtained C1 cluster was positive class, C2 cluster was neutral and C3 cluster was the negative class. Though it can be inferred from the changing number of data points in the clusters and their ratios to one another that analysis of audio separately and text separately, and then combining the two together with neutrosophic sets is effective to address the indeterminacy and uncertainty of data.

 ,
, 


