Article

Relationship between the Shear Strength and Microscopic Pore Parameters of Saline Soil with Different Freeze-Thaw Cycles and Salinities

1
College of Construction Engineering, Jilin University, Changchun 130026, China
2
Water Conservancy and Hydropower Survey and Design Institute of Jilin Province, Changchun 130021, China
*
Author to whom correspondence should be addressed.
Symmetry 2020, 12(10), 1709; https://doi.org/10.3390/sym12101709
Submission received: 20 September 2020 / Revised: 12 October 2020 / Accepted: 14 October 2020 / Published: 16 October 2020

Abstract

:
Saline soil is a widely distributed special soil with poor engineering properties. In seasonally frozen regions, the poor properties of saline soil will cause many types of engineering damage such as road boiling, melt sinking, and subgrade instability. These engineering failures are closely related to the shear strength of saline soil. However, there are relatively few studies on saline soil in cold regions. The strength of the soil is always determined by its microstructure; therefore, the study aims to investigate the relationship between the shear strength and microscopic pore structure of saline soil with different freeze–thaw cycles and salinities. The shear strength characteristics of saline soil with different salinities subjected to different freeze–thaw cycles were obtained by triaxial tests. In addition, the microstructure of the soil samples was investigated by scanning electron microscopy (SEM) tests, and the microscopic pore parameters of the soil samples, including porosity ( N ), average pore diameter ( D ¯ ), average shape coefficient ( K ), surface fluctuation fractal dimension ( F ), and orienting probability entropy ( H m ), were obtained by image processing software quantitatively. Based on the experimental results, the influence of freeze–thaw cycles and salinity on the shear strength characteristics and microstructure of the soil samples were analyzed. Besides that, in order to effectively eliminate the collinearity between independent variables and obtain a stable and reasonable regression model, principal component regression (PCR) analysis was adopted to establish the relationship between the microscopic pore parameters and the failure strength of the soil samples. The fitting results demonstrated that the failure strength of saline soil is mainly related to the size and direction of the pores in the soil, and it has little correlation with pore shape. The failure strength of the soil was negatively correlated with the average pore diameter ( D ¯ ) and porosity ( N ), and it was positively correlated with the orienting probability entropy of the pores ( H m ). This study may provide a quantitative basis for explaining the variation mechanism of the mechanical properties of saline soil from a microscopic perspective and provide references for the symmetry between the changes of the macroscopic properties and microscopic pore structure of the saline soil in cold regions.

1. Introduction

Shear strength is one of the important mechanical properties of soil, which determines the stability and normal use of engineering buildings. Studies have shown that the shear strength of soil is not only related to its own properties, such as material composition, water content, and dry density [1,2,3], but also related to the environment’s effect [4,5]. In seasonally frozen regions, the temperature difference caused by climate change will lead to repeated freezing and thawing of pore water in the soil, which will decrease the soil strength and result in engineering damages [6,7]. Therefore, the influence of freeze–thaw cycles on the shear strength of soil has always been an important research topic in seasonally frozen regions.
The Songnen Plain in northeast China distributes a large area of seasonally frozen soil with a high soluble salt content (greater than 0.3%), which belongs to saline soil [8]. Because of the presence of salt in the pore water, the change of the structure and strength of saline soil in seasonally frozen area is more complex [9]. On the one hand, the saline soil undergoes repeated freeze–thaw cycles under the great temperature difference. On the other hand, the salt in the soil will migrate with the change of temperature, which will lead to a change of the salt content in the soil [10]. Under the influence of these two factors, the mechanical properties of the saline soil in seasonally frozen areas are usually poor and cause many types of engineering damage, such as road boiling, melt sinking, and the reduction of stability of the subgrade and slope. Therefore, in order to keep the sustainability of engineering construction in seasonally frozen regions, it is of great engineering significance to investigate the influence of salt content and freeze–thaw cycles on the shear strength of saline soil.
Previous studies have shown that freeze–thaw cycles will change the grain size distribution of soil, which will result in changes of the particle content in different particle groups [11,12]. In addition, the salt in the soil has an agglomeration effect on the soil particles, thus changing the microstructure type of the soil [13,14]. These factors will change the size, shape, and arrangement characteristics of the pores in the soil [15,16]. Hu et al. [17] studied the shear strength and microstructure characteristics of loess under dynamic impact load through a triaxial test and SEM test, and the relationship between them was analyzed. Qi et al. [18] studied the shear strength and microstructure of silty clay and loess before and after freeze–thaw cycles through mechanical and SEM tests, and pointed out that the study of soil microstructure is an important method to explain its mechanical properties. Jiang et al. [19] performed triaxial tests along different stress paths on undisturbed and remolded loess and observed the microstructure of soil samples before and after the mechanical tests through microscopic tests. The changing mechanism of the mechanical properties was explained through the changes in microstructure. Xu et al. [20] conducted direct shear tests and microscopic tests on the loess samples under different dry densities, water contents, and freeze–thaw cycles, and the variations of the shear strength parameters and microstructure parameters were discussed. These studies showed that the shear strength of soil is closely related to its microstructure. By analyzing the changes in the soil microstructure, the changing mechanism of soil shear strength under different conditions can be well explained.
In recent years, researchers have conducted extensive research on the microstructure and strength of different types of soil, such as loess, laterite, silty clay, and improved soil [21,22,23,24,25,26,27]. Some researchers also studied the effect of salt content on the microstructure and shear strength of soil [14,28]. However, there are still few studies on saline soils distributed in seasonally frozen areas. Han et al. [29] studied the influence of salt content and freeze–thaw cycles on the shear strength of soil and analyzed the microstructure of soil samples after freeze–thaw cycles by SEM tests qualitatively. Wang et al. [30] investigated the variation law of the unconfined compressive strength of saline soil with salt content, water content, and the number of freeze–thaw cycles. Liu et al. [12] studied the physical properties, mechanical properties, and microstructure of lime-improved saline soil under different freeze–thaw cycles. However, for the saline soil in seasonally frozen areas, the quantitative change of the microstructural parameters with salinities, freeze–thaw cycles, and the relationship between the microstructural parameters and shear strength is still unclear, so it is necessary to study their relationship, which can provide a quantitative basis for explaining the variation mechanism of the mechanical properties of saline soil from a microscopic perspective, and provide references for the symmetry between the changes of the macroscopic properties and microstructure of the saline soil in cold regions.
In this study, remolded soil samples with different salinities (0–3%) were prepared to experience different freeze–thaw cycles (0, 10, 60, 120). The unconsolidated undrained triaxial compression tests were carried out on the soil samples after freeze–thaw cycles under different confining pressures to obtain their failure strength and shear strength parameters. In addition, the microstructures of soil samples under different experimental conditions were investigated by scanning electron microscopy (SEM) tests, and the microscopic pore parameters of soil samples were extracted by Image-Pro Plus (IPP) software quantitatively. The influence of freeze–thaw cycles and salt content on the shear strength characteristics and microscopic pore parameters of the soil were discussed. Finally, the relationship between the microscopic pore parameters and failure strength of tested soil samples was fitted by principal component regression analysis.

2. Materials and Methods

2.1. Soil Properties and Sample Preparation

The saline soils in Nong’an County of northeastern China were collected to prepare remodeled soil samples with different salt contents in this study. The study area is a typical seasonally frozen soil region. The annual maximum temperature difference can reach above 60 °C, and the minimum temperature in winter can reach below −30 °C. In addition, the soil salinization is serious in this area. Long-term monitoring results showed that the total soluble salt content in the soil was the highest at a depth of 40 cm. Therefore, the saline soil at this depth was selected as the soil sample used for testing in this study. First, the collected saline soil was dried by air, and then the basic properties were tested according to the test steps in GB/T50123-1999 [31]. The basic properties of the soil samples were determined through a parallel experiment, and the test results are summarized in Table 1. Table 1 shows that silt and clay were the main components of the soil, and the main ions in the tested saline soil included Na+, HCO3, and SO42−. Table 2 lists the mineralogical composition, tested by X-ray diffraction, which indicates that the primary mineral was the main mineral in the soil. In addition, the maximum dry density and optimum water content of the tested saline soil, obtained by a compaction test, were 1.63 g/cm3 and 21.3%, respectively. The soil was named as lean clay according to the Unified Soil Classification System (USCS) [32].
In order to study the influence of salt content and the number of freeze–thaw cycles on the shear strength and microstructure of soil, remolded soil samples with different salt contents were prepared to experience different numbers of freeze–thaw tests. The fluctuation range of the total soluble salt at the sampling depth was 0.74–1.42%, and the largest salt content ever reached was 2.6% [33]. Therefore, the salt contents scheduled to prepare soil samples were set to 0%, 0.5%, 1%, 2%, and 3% in this study. Table 1 shows that the ratio of HCO3 and SO42− content in the collected saline soil was approximately 1:1. Therefore, anhydrous NaHCO3 and anhydrous Na2SO4 were mixed at a ratio of 1:1 to prepare remolded soil samples with different salt contents. In addition, the water content of all remolded soil samples was set to the optimum water content. Before preparing the remolded soil samples, the collected saline soil was desalinized with distilled water first, and then dried in an oven. Next, the dried soil was crushed and sieved through a 2 mm sifter. After that, the calculated amount of salt powder and distilled water was added into the dried soil and mixed evenly. The soil samples were wrapped with airtight bags and sealed for 24 h to let the water and salt distribute uniformly. Then, the soil samples were compacted into three layers in a cylindrical mold at a 90% compaction degree, according to the maximum dry density. The target dry density of the compacted soil samples was 1.467 g/cm3. Finally, the remolded soil samples were sealed with fresh-keeping films and put them in a moisturizing container to spare.

2.2. Freeze–Thaw Tests

In this study, a custom temperature-controllable freezer was used to conduct freeze–thaw tests, and the lowest temperature able to be simulated by this device was −35 °C. A complete freeze–thaw cycle test included the following steps. First, the temperature was set to −20 °C, and the sealed soil samples were placed into the freezing chamber for 12 h of freezing. After that, the soil samples were removed from the chamber and thawed for 12 h at 20 °C. The number of freeze–thaw cycles selected in this study was 0, 10, 60, and 120. In all of the freeze–thaw tests, the soil samples were sealed in fresh-keeping film without water evaporation or external water supplements.

2.3. Triaxial Tests

The permeability of the saline soil was low in the study area, and the soil would be destroyed before it was consolidated during the loading process. Therefore, unconsolidated undrained triaxial compression tests were performed on cylindrical soil samples (Φ39.1 mm × 80 mm) to obtain their shear strength by a strain-controlled triaxial apparatus (TSZ-3, Nanjing Soil Instrument Factory Co., Ltd., Nanjing, China). The confining pressures applied to the soil samples were 100, 200, and 300 kPa, and the shear strain velocity was controlled at 0.6 mm min−1. GB/T50123-1999 [31] indicates that if there is a peak value existent in the stress–strain curve, the value is the failure strength of the soil sample; otherwise, the failure strength of the soil sample is considered as the principal stress difference corresponding to a 15% axial strain. Based on the triaxial test results, the cohesion and internal friction angle of the soil samples could be obtained by the Mohr–Coulomb criterion.

2.4. SEM Tests

The surface microstructure of soil can be observed by an SEM test directly, and it can be analyzed quantitatively when combined with image processing software [34]. Therefore, SEM tests were performed to observe the microstructure characteristics of the soil samples subjected to different numbers of freeze–thaw cycles by a scanning electron microscope (JSM-6700F, produced by JEOL Ltd., Tokyo, Japan) in this study. Before the test, several strips of about 10 mm × 10 mm × 20 mm were cut carefully from the center of each soil sample, and then a freeze-drying method was used to obtain the dried soil samples with the original structure invariant. Each freeze-dried strip was fractured carefully to expose a fresh surface, and the flat surface was stuck with a conductive adhesive on a special metal plate for the SEM test. Then, we put the metal plate in a sputtering machine and coated the soil sample with gold to make it fully conductive and prevent discharge during the SEM tests. Next, the soil samples were placed in the scanning electron microscopy for microstructural observation.

2.5. Acquisition of Microscopic Parameters

In this study, IPP software was used to extract microscopic pore parameters from the micrographs of soil samples under different conditions. The processing of the micrographs was divided into three steps: image preprocessing, image binarization, and image parameter measurement. In this process, the selection of thresholds and magnifications was an important factor which would affect the processing results of the SEM images. The threshold for processing the SEM images of the soil samples was set by manual adjustment. During the adjustment process, the appropriate threshold which can best reflect the morphology of soil particles and pores was selected through comparing the binary images and the original images. Multiple observations were performed on a same image, and the average value of multiple observations was selected as the final threshold for image binarization. Previous studies indicated that the appropriate magnification of SEM images selected for the microstructure analysis of clay is 2000 [35,36]. Therefore, the micrographs with 2000× magnification were selected for analysis in this study. Before the image analysis, the contrast of the micrograph was adjusted to an appropriate state first, and then the median filtering was selected for noise reduction. Next, the micrograph was binarized with the selected threshold to distinguish the soil particles and pores in the image. Finally, the parameters needed were selected for measurement. The IPP software can obtain the basic microscopic pore parameters, including the perimeter, area, diameter, angle and so on. In this study, the following parameters were selected to characterize the size, morphology, and directionality of the pores in the soil samples. The specific meanings and calculation methods of each parameter are as follows.
1.
Porosity
The porosity N represents the ratio of the pore area in the binarized SEM image to the total area of the micrograph. It can be expressed as follows:
N = S 0 S   × 100 % ,
where S and S 0 denote the total areas of the micrograph and the pores, respectively. The porosity can reflect the pore content in the soil samples to some extent.
2.
Average pore diameter
The mean diameter ( D ) of each pore in the SEM images can be calculated by the IPP software directly. It refers to the average length of the line segments connecting two points on the outline of the measurement object and passing through the centroid of the measurement object (the interval between each line segment is 2°), which can reflect the size of each pore in the soil sample. For each SEM image, the average value of the mean diameters of all the pores were taken as the average pore diameter ( D ¯ ) of the soil sample.
3.
Average shape coefficient
The shape of the pores in the soil samples can be reflected by its average shape coefficient, and the calculation formula is as follows:
K = 1 n i = 1 n 2 π A i / π P i ,
where A i is the actual area of each pore; P i is the perimeter of each pore; and n is the number of pores in each SEM image. The value of K is between 0 and 1. A larger value of K means that the shape of the pore is more regular and closer to a circle.
4.
Surface fluctuation fractal dimension
Previous research showed that the pores in soils have fractal characteristics and are suitable to be analyzed by fractal theory [37,38,39]. The surface fluctuation fractal dimension ( F ) of pores can reflect the roughness and complexity of the outline of the pores, and its calculation formula is as follows [17]:
F = lim ε 0 ln N ( ε ) ln ε ,
where ε denotes the length of scale and N ( ε ) denotes the step length corresponding to ε . The larger value of F means that the fluctuation and complexity of the outline of the pore is larger. The F of each pore can be calculated by IPP software directly, and the final value of F is the average fractal dimension of all the pores in the SEM image.
5.
Orienting probability entropy
Shi [40] introduced orienting probability entropy H m into soil microstructure analysis to describe the orientation degree of pore arrangement. The expression of H m is as follows:
H m = i = 1 n P i log n P i ,
where n is the number of ranges divided by a certain angle interval and P i is the directional frequency of pores in the i th range. In this study, the range of 0–180° was divided into 18 angular ranges at 10° intervals, (i.e., n = 18). The value of H m is between 0 and 1. A larger value of H m means a more disordered arrangement and a worse orientation of the pores in the soil samples.
For each soil sample, several microscopic images were selected for quantitative analysis to obtain the value of each microscopic pore parameter, and the mean values were used for analysis in this study.

3. Results and Discussion

3.1. Shear Strength Characteristic

3.1.1. Failure Strength

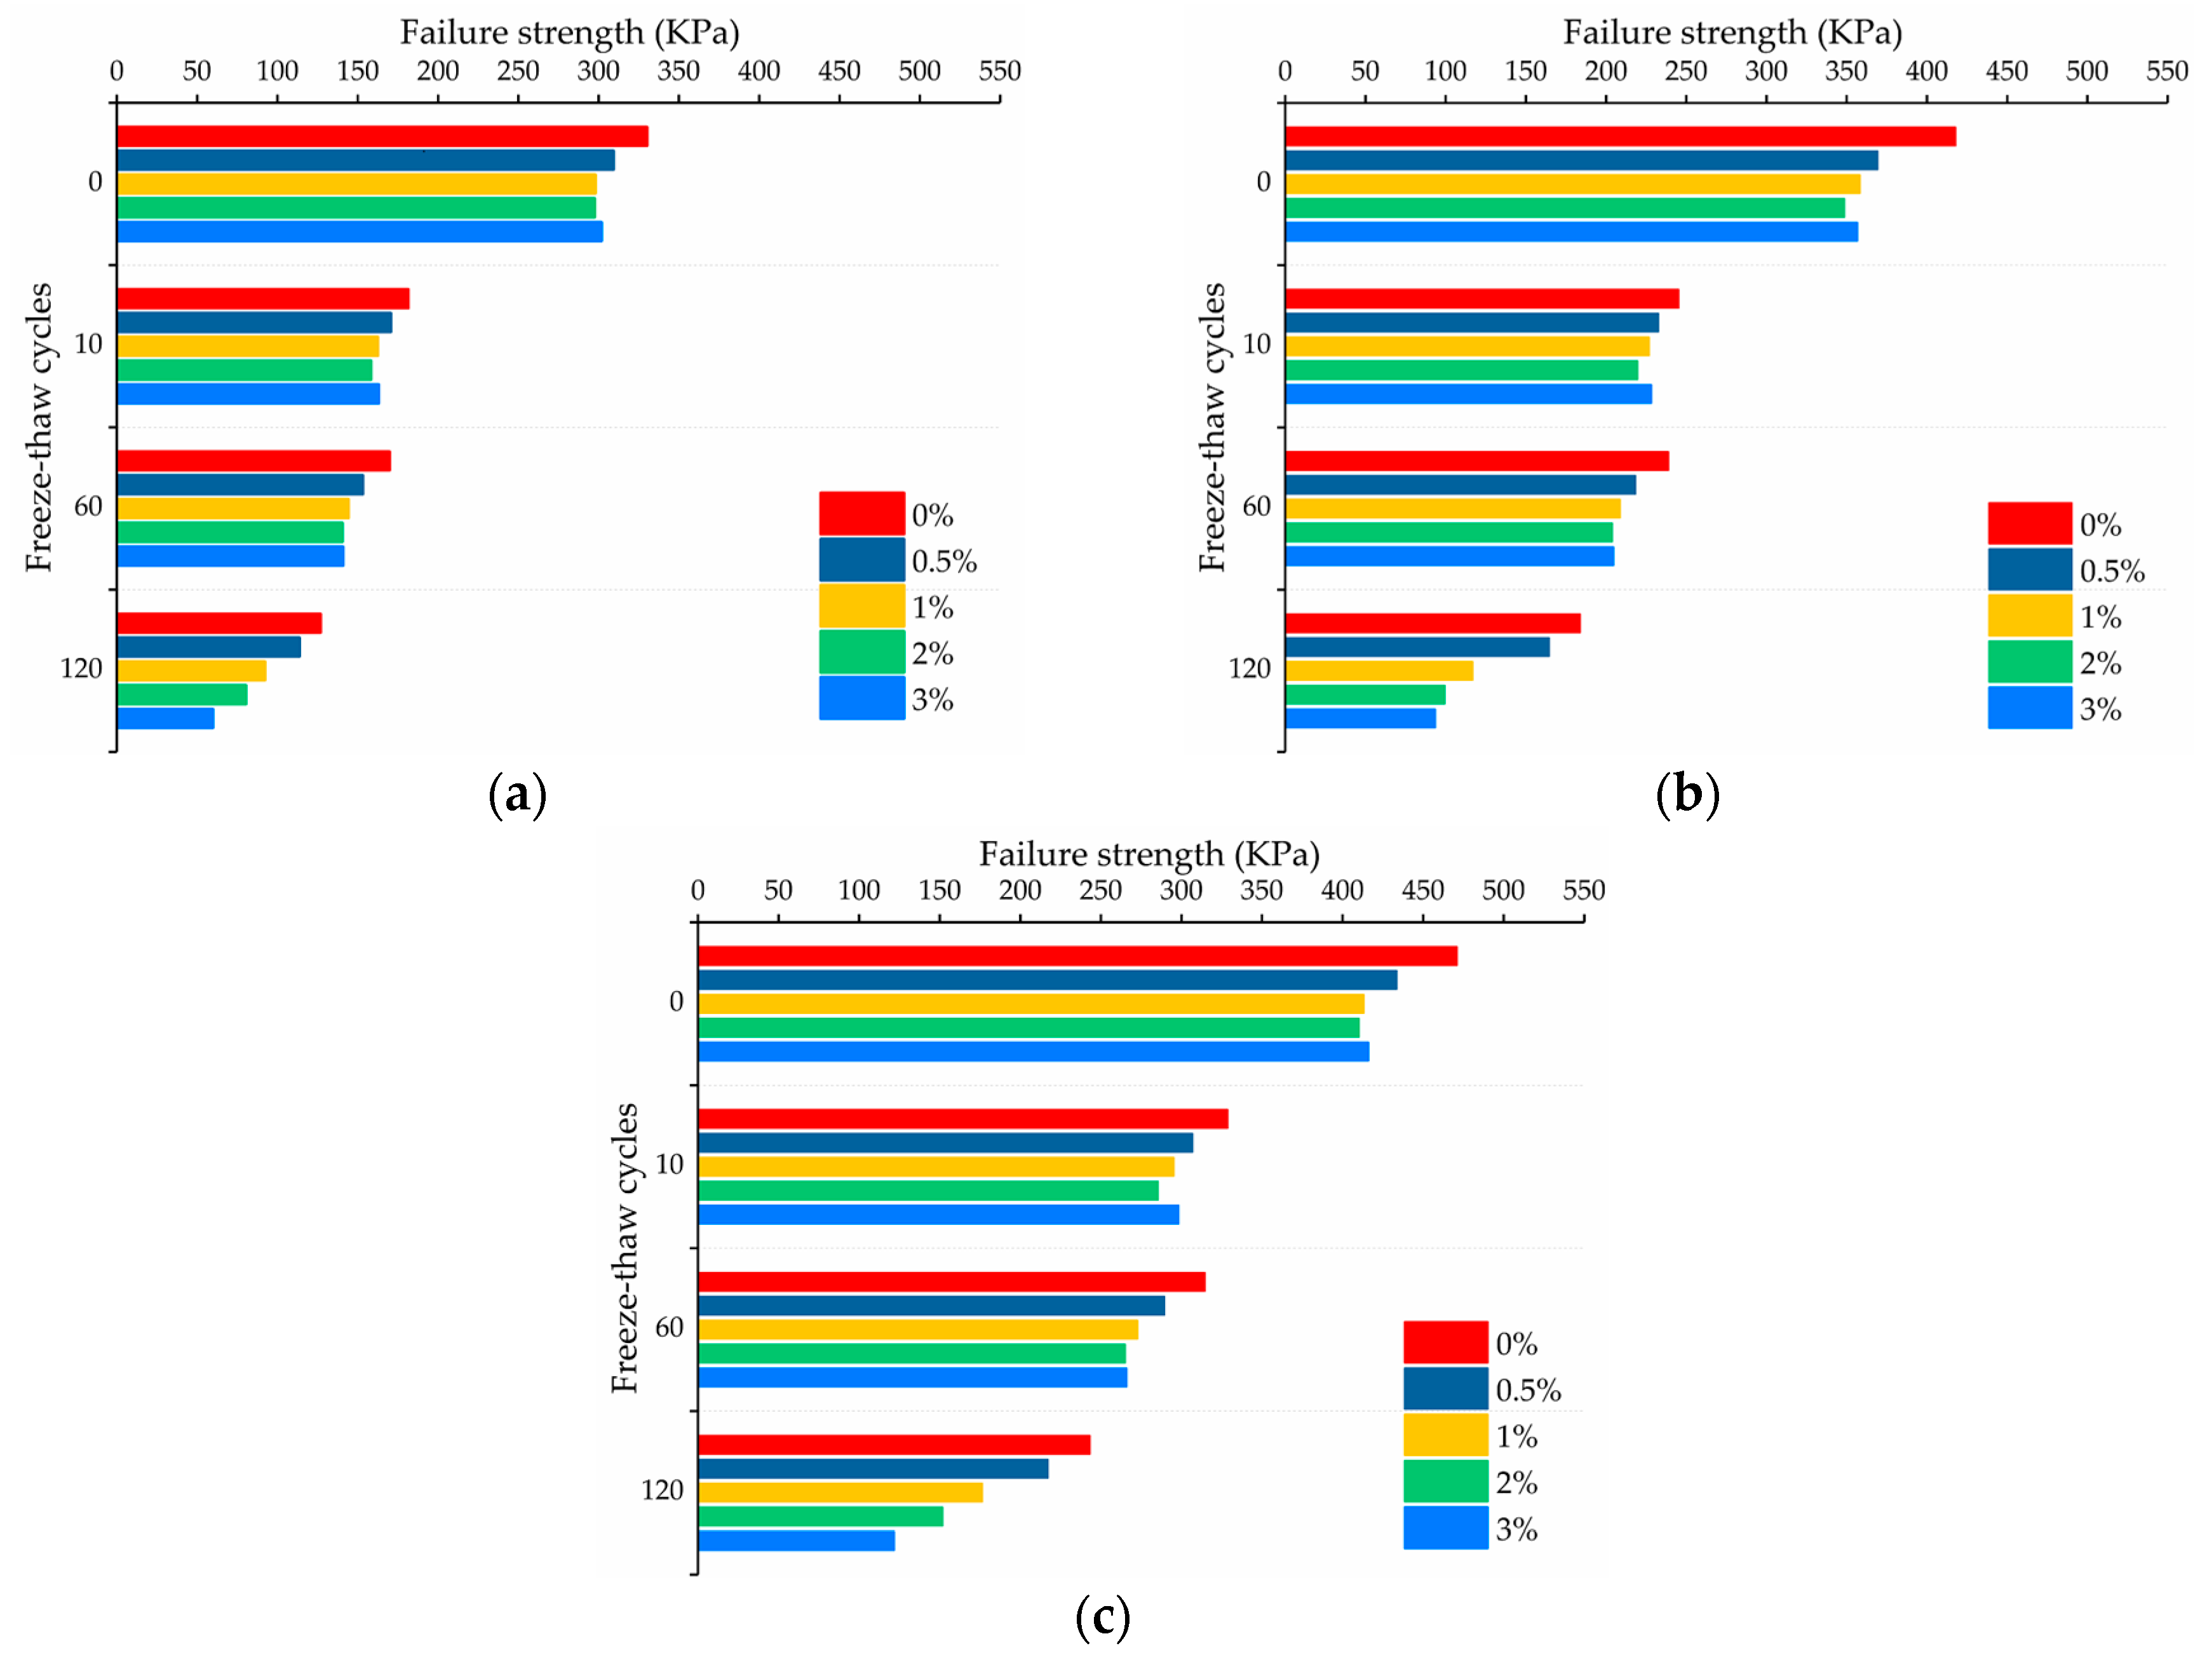
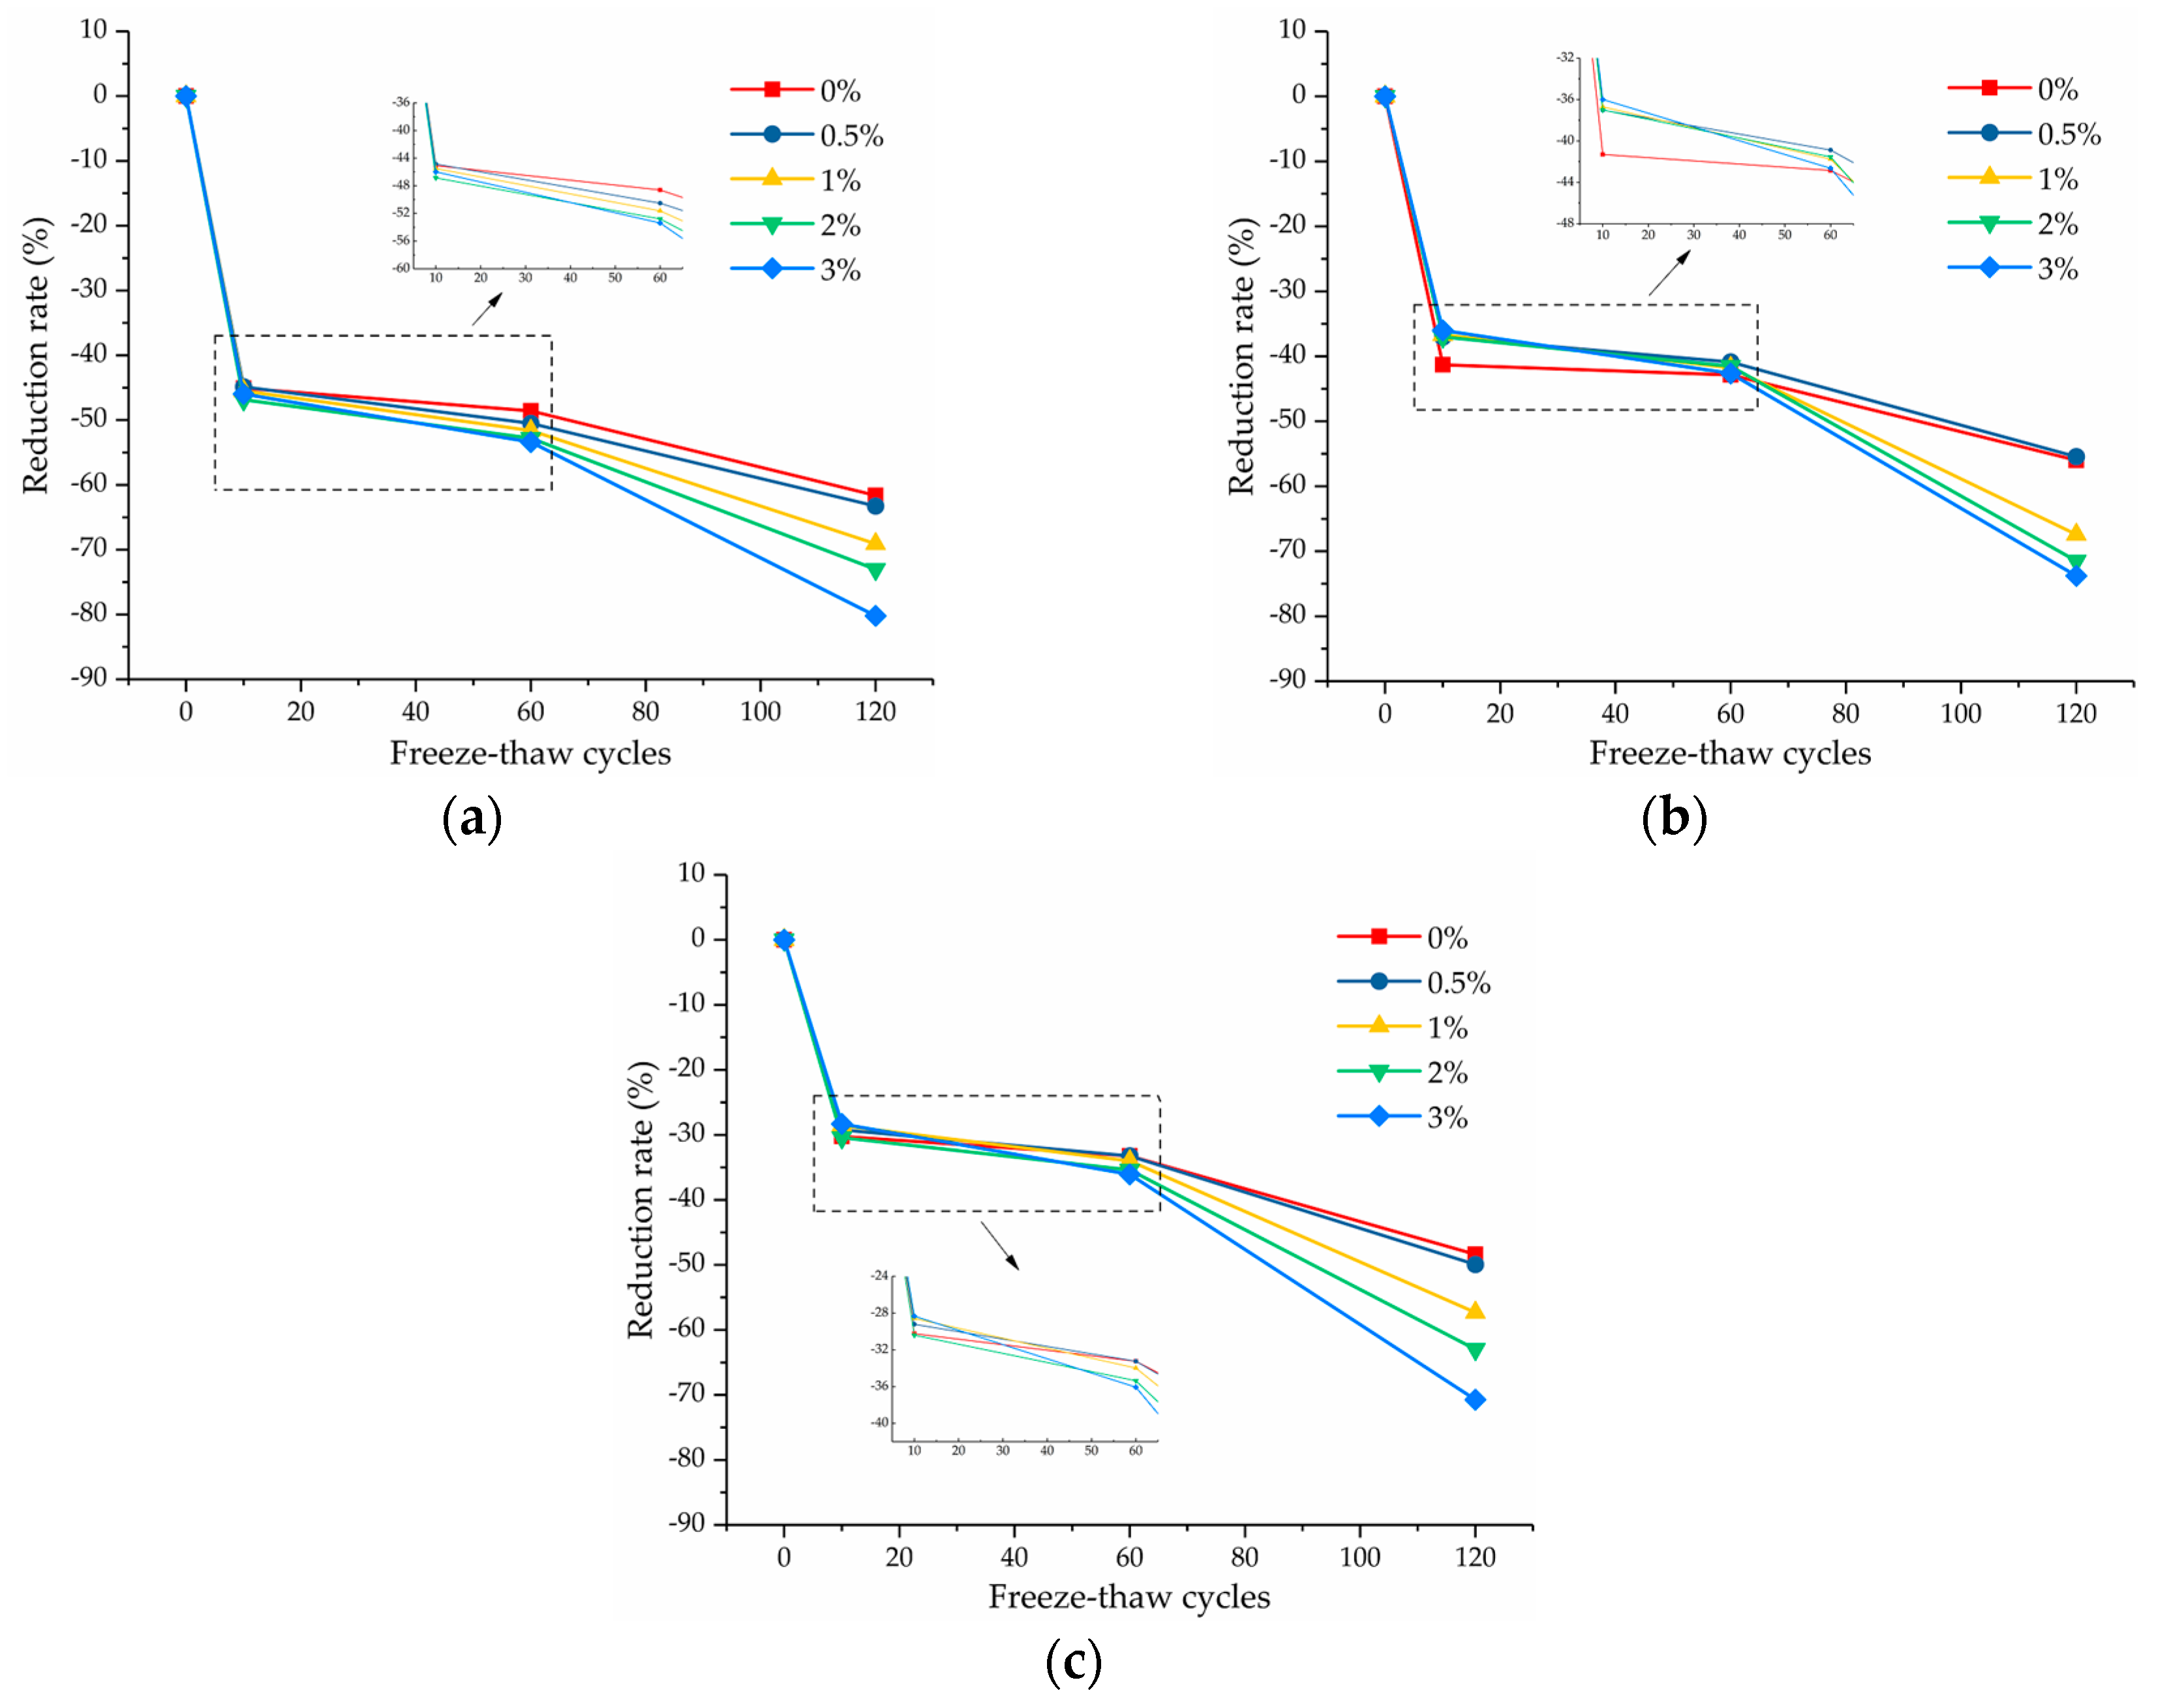
The stress–strain curves of soil samples under different experimental conditions were obtained by unconsolidated undrained triaxial compression tests. The test results showed that the shape and change trend of the stress–strain curve of soil samples under different freeze–thaw cycles, salt contents, and confining pressures were all similar. Therefore, the stress–strain curves under 200 kPa of confining pressure were taken as an example to describe the stress–strain behavior of soil samples with different salt contents and freeze–thaw cycles, as shown in Figure 1. It can be seen from Figure 1 that all the stress–strain curves have no obvious peaks, which belong to the strain–hardening type. Based on the statement in Section 2.3, the principal stress difference corresponding to 15% axial strain was taken as the failure strength of the soil sample, and the failure strength of each soil sample is shown in Figure 2. In addition, the reduction rates of the failure strengths of soil samples with freeze–thaw cycles were calculated and shown in Figure 3.
Figure 2 shows that the failure strength of the soil samples increased with increasing confining pressure. This is because the compactness of the soil sample varied with different confining pressures. The larger the confining pressure is, the closer the distance between the soil particles, and the stronger the ability of the soil sample to resist destruction, resulting in a larger failure strength of the soil sample. Figure 2 and Figure 3 show that the changing rule of the failure strength of the soil samples with salt content and freeze–thaw cycles was the same under different confining pressures. Freeze–thaw cycles decreased the failure strength of the soil samples, and the decreasing rate was the largest after the first 10 freeze–thaw cycles, tending to be slow in the range of 10–60 freeze–thaw cycles, while the decreasing rate increased again after 120 freeze–thaw cycles. However, the influence of the salt content on the failure strength of the soil samples was relatively small compared with the freeze–thaw cycles. When the number of freeze–thaw cycles was no larger than 60, the failure strength of the soil samples decreased first, then increased with the increasing salt content, and the failure strength increased slightly as the salt content became larger than 2%. When the number of freeze–thaw cycles was 120, the failure strength decreased continuously with the increasing salt content, and the rate of decrease became larger. It can be seen from the test results that the variation of the soil strength was complex under the combined action of salt and freeze–thaw cycles.

3.1.2. Shear Strength Parameters

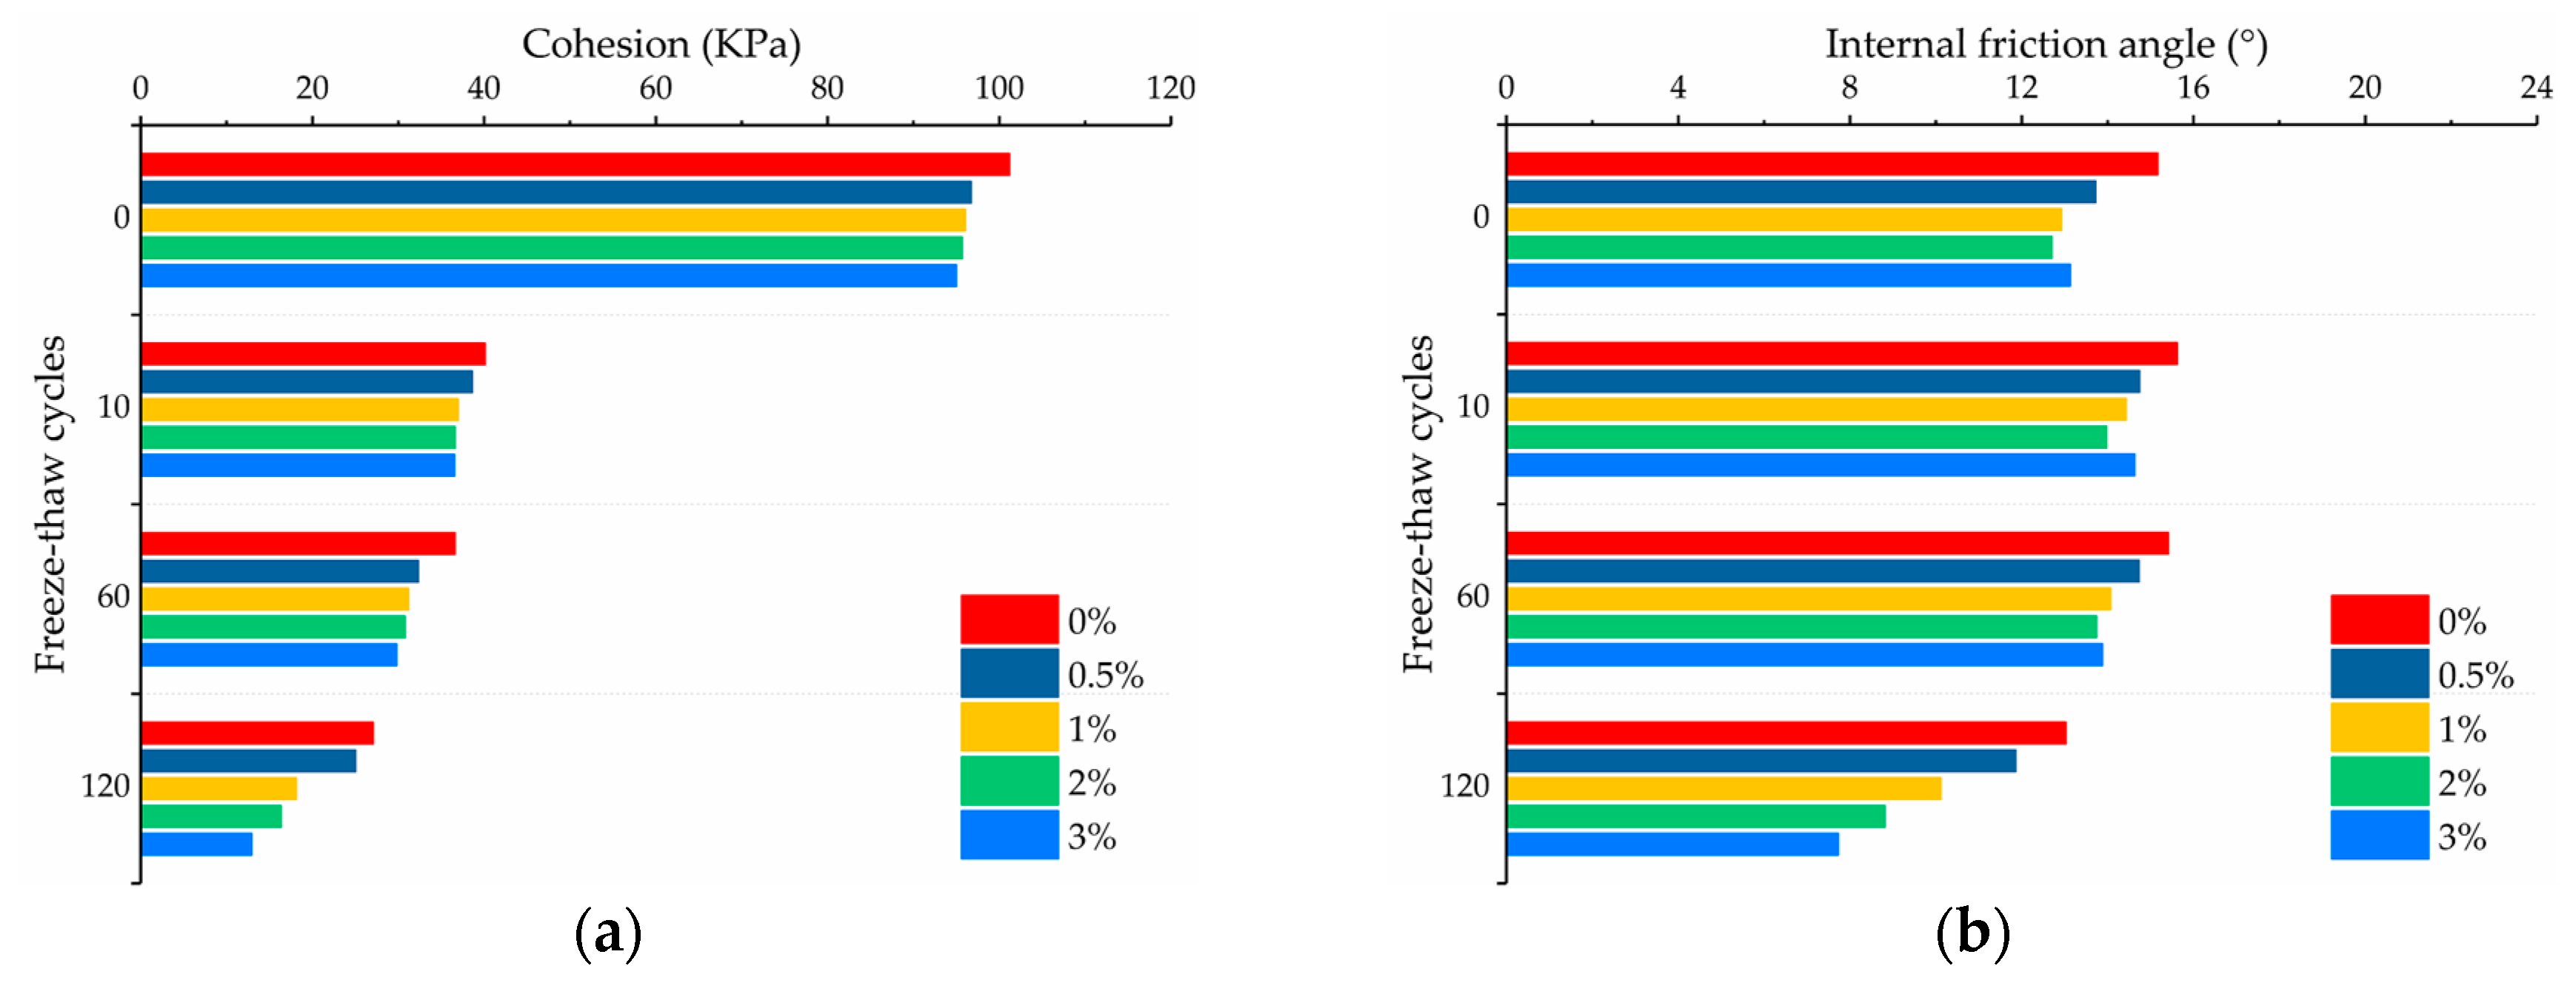
Cohesion and the internal friction angle are important parameters that determine the shear strength of soil. Figure 4 shows the shear strength parameters of soil samples with different salt contents and freeze–thaw cycles, obtained by the Mohr–Coulomb criterion. It can be seen that the freeze–thaw cycles had a greater effect on cohesion than the internal friction angle. The influence degree of the salt content on the shear strength parameters was related to the number of freeze–thaw cycles.
Figure 4a shows that the increase of freeze–thaw cycles or salt content will lead to a decrease in the cohesion of the soil samples; however, the influence degree of them was different. Freeze–thaw cycles have a significant effect on the cohesion of the soil samples, and the cohesion decreased significantly after 10 freeze–thaw cycles. When the number of freeze–thaw cycles exceeded 10, the variation rate tended to be slow, while the decreasing rate increased slightly after the soil samples experienced 120 freeze–thaw cycles, which was similar to the variation tendency of the failure strength with freeze–thaw cycles. Similarly, when the number of freeze–thaw cycles was between 0 and 60, the cohesion exhibited a slight decreasing tendency with the increasing salt content. After experiencing 120 freeze–thaw cycles, the decreasing trend was more significant.
Figure 4b shows that when the salt content was the same, the change of the internal friction angle with the number of freeze–thaw cycles was not significant overall, which was different from the variation of the cohesion with freeze–thaw cycles. When the number of freeze–thaw cycles was in the range of 0–60, the variation of the internal friction angle was very small, and the variation range was approximately 1°. After experiencing 120 freeze–thaw cycles, the internal friction angle showed a decreasing trend compared with 60 freeze–thaw cycles, and the variation range was between 2.38° and 6.16°. The variation trend of the internal friction angle with salt content can be divided into two cases. When the number of freeze–thaw cycles was 0–60, the internal friction angle of soil samples decreased first, then increased with the increasing salt content, and the inflection point was 2% salt content. While the internal friction angle decreased significantly with increasing salt content after 120 freeze–thaw cycles, the decreasing rate became larger.
The variation in the shear strength parameters of soil is closely related to its structural change. Cohesion reflects various physical and chemical forces between soil particles, which will be affected by the distance between soil particles [1,41]. The internal friction angle mainly reflects the friction and bite force between the soil particles, which is related to the shape and arrangement of the particles and pores [20]. Under the influence of freeze–thaw cycles, the salt and pore water in saline soil will undergo a phase change with the variation of temperature, which will result in the separation or agglomeration of soil particles, then lead to changes in the pore structure characteristics of the soil. Therefore, in the next section, qualitative and quantitative analysis of the microstructure characteristics of each soil sample was carried out to further explain the variation mechanism of the soil strength with freeze–thaw cycles and salt content.

3.2. Microstructure Characteristics

3.2.1. General Description of Microstructure of Soil Samples

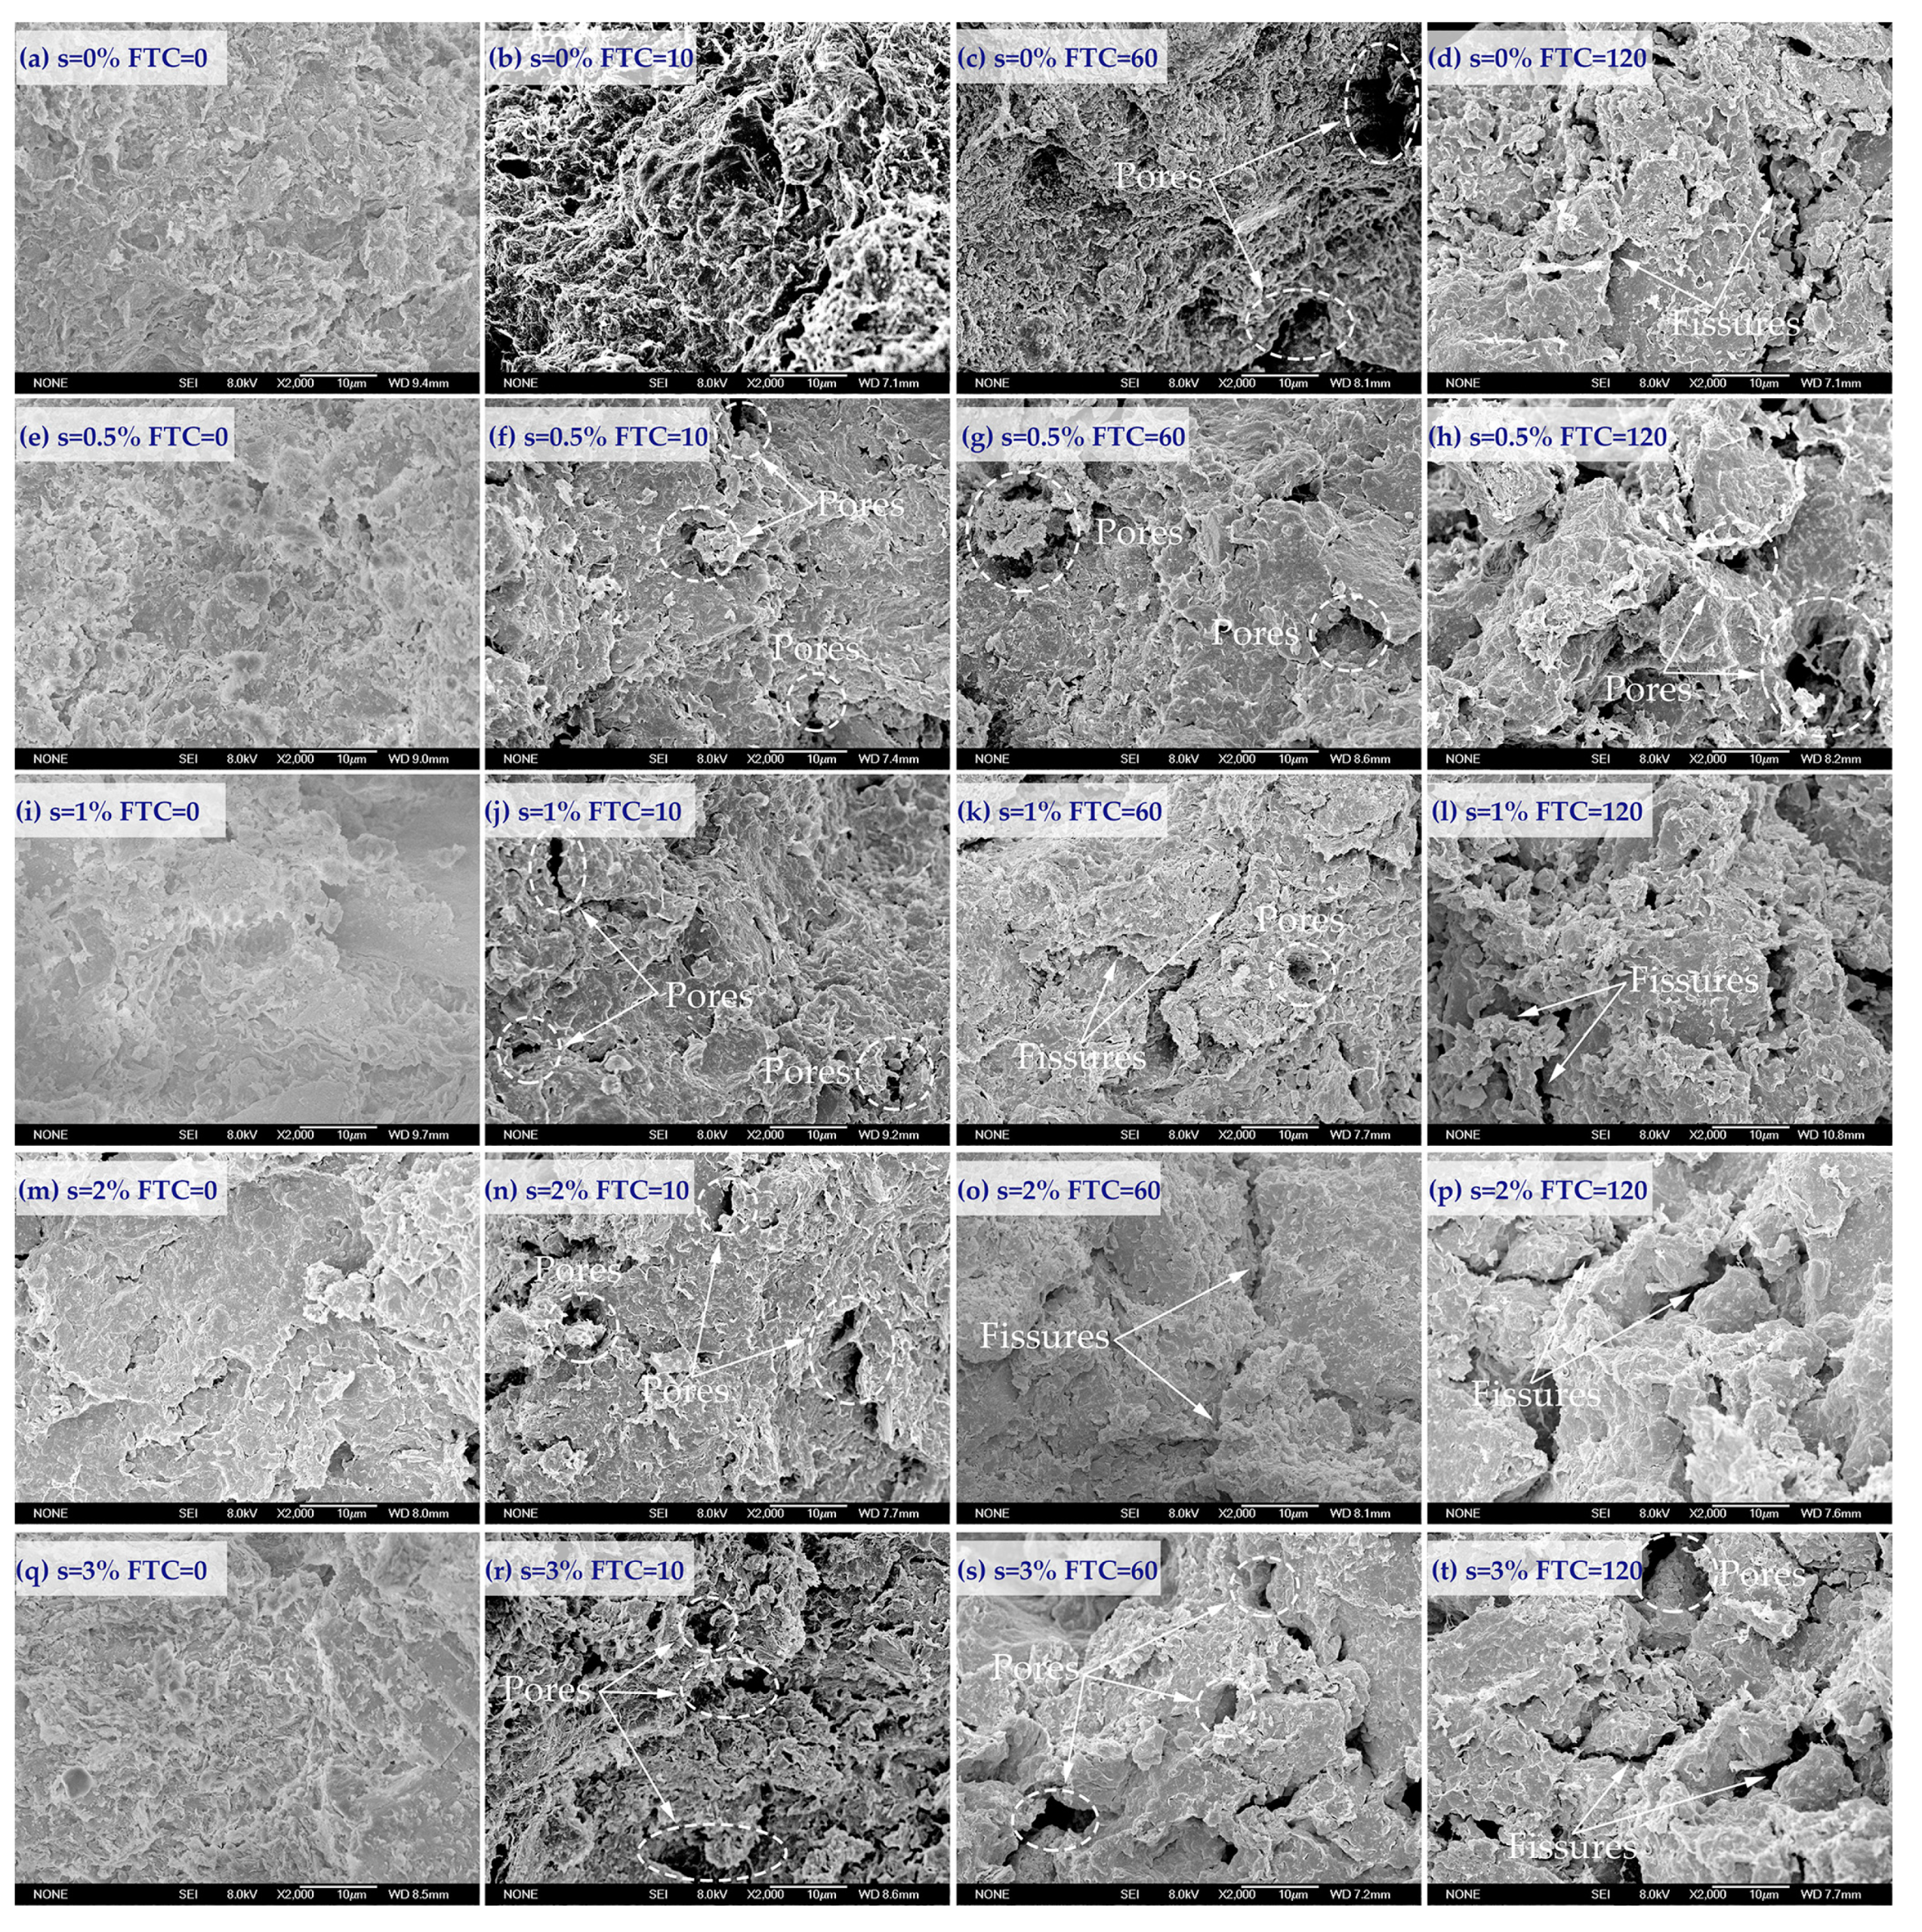
Figure 5 shows some micrographs of soil samples with different salt contents and freeze–thaw cycles, obtained by SEM tests. The horizontal direction of Figure 5 presents the surface microstructure morphology of soil samples after experiencing different freeze–thaw cycles when the salt content was the same. With the increase of freeze–thaw cycles, the microstructure type of soil samples gradually transitioned from a flocculated structure to an agglomerated structure. It can be seen from Figure 5a,e,i,m,q that the surface of the soil sample that didn’t experience freeze–thaw cycles was flat and dense, and the structure was relatively complete on the whole. After 10 freeze–thaw cycles, the compactness of the soil samples reduced significantly, the proportion of pores increased, and the structure became loose. The increase in the pore content increased the distance between the soil particles, resulting in a weakening of the connection between the soil particles and making the soil samples easier to be destroyed. Therefore, the failure strength and cohesion of the soil samples decreased significantly after 10 freeze–thaw cycles. After 60 freeze–thaw cycles, the microstructure of the soil samples was similar to that of the soil samples that experienced 10 freeze–thaw cycles. The pore content in the soil increased slightly, and variation in the structure was not obvious. After 120 freeze–thaw cycles, numerous fissures were generated between the aggregates of soil particles, the fragmentation degree of the soil particles increased, and the structure of the soil samples became looser, leading to further weakening of the connection between the soil particles. Therefore, the failure strength and shear strength parameters showed a decreasing tendency after 120 freeze–thaw cycles.
The vertical direction of Figure 5 shows the variation of the microstructure of soil samples with increasing salt content when the number of freeze–thaw cycles was the same. It can be seen that the agglomeration degree of the soil particles increased with increasing salt content. This is because the presence of salt will agglomerate the soil particles in saline soil samples, which will make the small particles in the soil samples agglomerate into larger particles. The larger the salt content is, the larger the agglomeration effect of the salt. Therefore, the content of pores in the soil increased with the increasing salt content [28,39]. However, the variation in the microstructure of the soil samples with salt content was not obvious overall. Therefore, the influence of salt content on the shear strength characteristics of the soil samples was relatively small.

3.2.2. Porosity

Figure 6 shows the porosity ( N ) of soil samples with different salt contents and freeze–thaw cycles. It can be seen that the porosity of the soil samples showed an increasing tendency with increasing freeze–thaw cycles, and the rate of increase was the largest in the first ten freeze–thaw cycles. The average rate of increase of the porosity of the soil samples after 10 freeze–thaw cycles was approximately 1.2 times that of the soil samples without freeze–thaw cycles. However, the average rate of increase of the porosity decreased when the number of freeze–thaw cycles was in the range of 10–60 and 60–120. This is because the salt and water in the soil migrate under the action of the temperature gradient during the process of freeze–thaw cycles. The pore water in the soil will freeze into ice and result in the increase of the pore volume in the soil samples in the freezing process; however, this structural variation cannot restore the initial state in the thawing process, thus leading to a significant increase in porosity. However, the influence of freeze–thaw cycles on the soil structure was limited. With the continuous increase of freeze–thaw cycles, the variation of the soil structure tends to be slow. After 7–10 freeze–thaw cycles, the structure of the soil will reach a new balance [4]. Therefore, the rate of increase of the porosity decreased to 18.4% when the number of freeze–thaw cycles exceeded 10 times. When the number of freeze–thaw cycles was the same, the change of the salt content also had a certain influence on the porosity, while the variation was not significant overall, and the variation range was approximately 2–4%. It is worth noting that when the number of freeze–thaw cycles was in the range of 0–60, the porosity increased first, then decreased with the increasing salt content. When the salt content was 3%, the porosity showed a slight decreasing trend. This may because, when the salt content was 3%, the salt content exceeded its solubility in the pore water, and the excess salt precipitated from the pore water and filled in the pores, which resulted in a decrease of the porosity in the soil samples. Comparing Figure 2 and Figure 6, it can be seen that the porosity was negatively related to the strength of the soil samples on the whole. The larger the porosity was, the lower the failure strength of the soil samples. This is consistent with the conclusions of some previous studies [20,42].

3.2.3. Average Pore Diameter

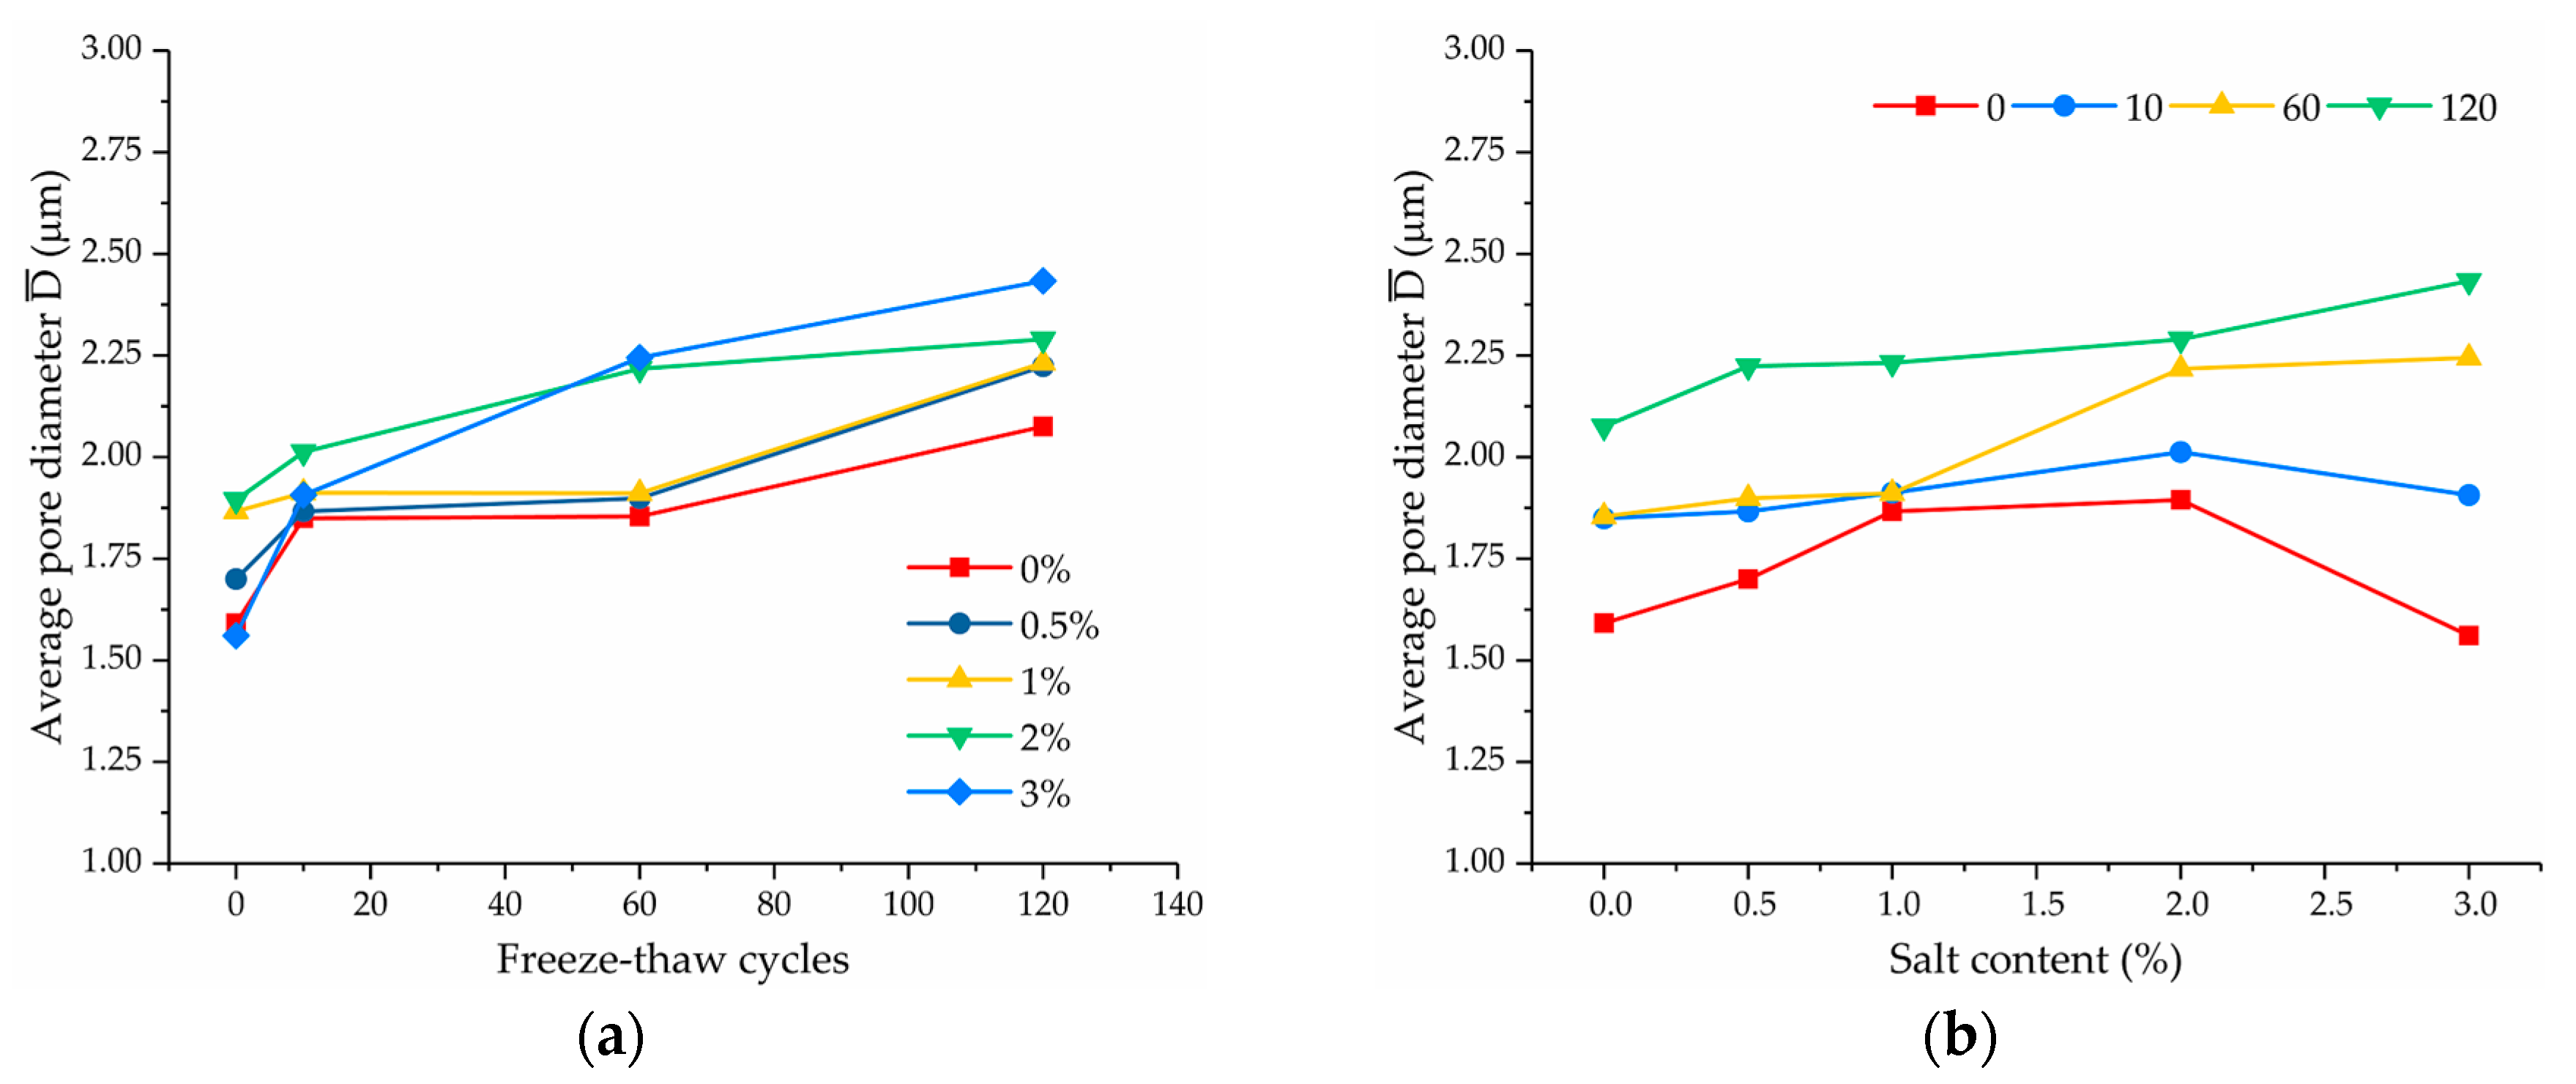
Figure 7 shows the average pore diameter ( D ¯ ) of soil samples with different salt contents and freeze–thaw cycles. It can be seen that the variation trend of the average pore diameter of the soil samples with salt content and freeze–thaw cycles was similar to that of the porosity. With the increase in freeze–thaw cycles, the average pore diameter showed an increasing trend on the whole. During the process of repeated freeze–thaw cycles, the volume expansion caused by the freezing of pore water will lead the pores with smaller diameters to merge into larger pores in the soil samples, and the proportion of the larger pores to increase, resulting in an increase in the average pore diameter of the soil. The variation mechanism of the average pore diameter with salt content was the same as that illustrated in the previous section; that is, the agglomeration effect of salt altered the particle size distribution of the soil samples, which resulted in the change of the pore size distribution in the soil samples.

3.2.4. Average Shape Coefficient of Pores

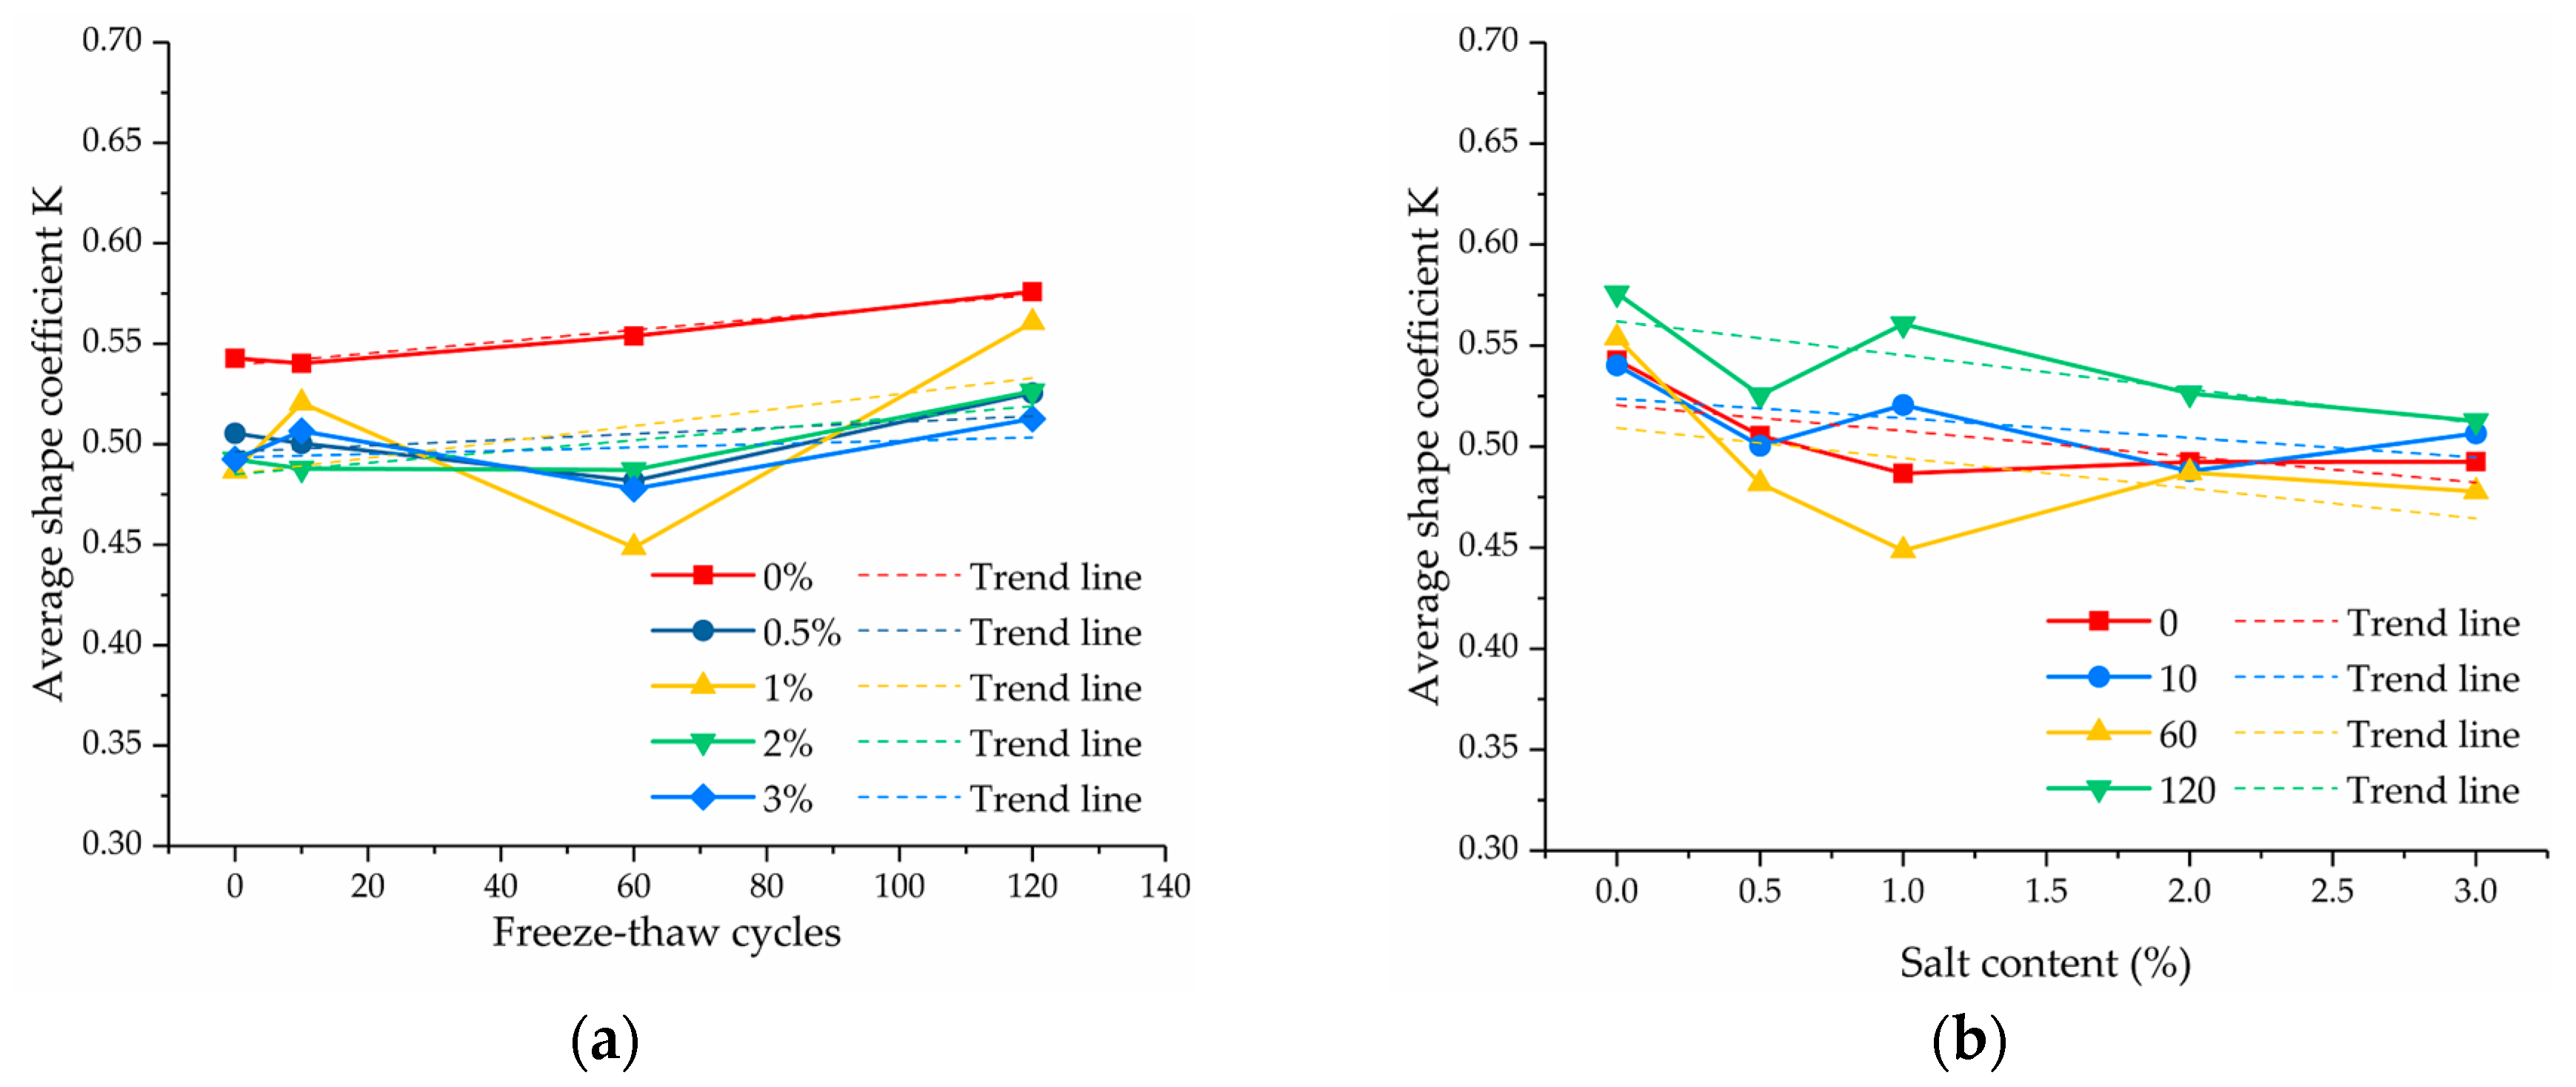
Figure 8 shows the average shape coefficient ( K ) of the pores of soil samples with different salt contents and freeze–thaw cycles. It can be seen that the change of K with the salt content and freeze–thaw cycles was not obvious, and the overall change range was not significant. As the number of freeze–thaw cycles increased, K showed a slightly increasing trend on the whole, indicating that the pore shape became more regular and closer to a circle after undergoing freeze–thaw cycles. This may be because the irregular boundary of soil particles will be rounded gradually under repeated freeze–thaw cycles, which will lead to corresponding changes in the morphology of the pores between the soil particles. When the number of freeze–thaw cycles was the same, K showed a decreasing trend overall as the salt content increased, indicating that the increase in salt content led the pore morphology to become more irregular. This is because the agglomeration between the fine particles, enhanced with increasing salt content, and the small particles with regular shapes continuously agglomerated into large aggregates with irregular shapes, resulting in more irregular pore shapes between the soil particles.

3.2.5. Surface Fluctuation Fractal Dimension of Pores

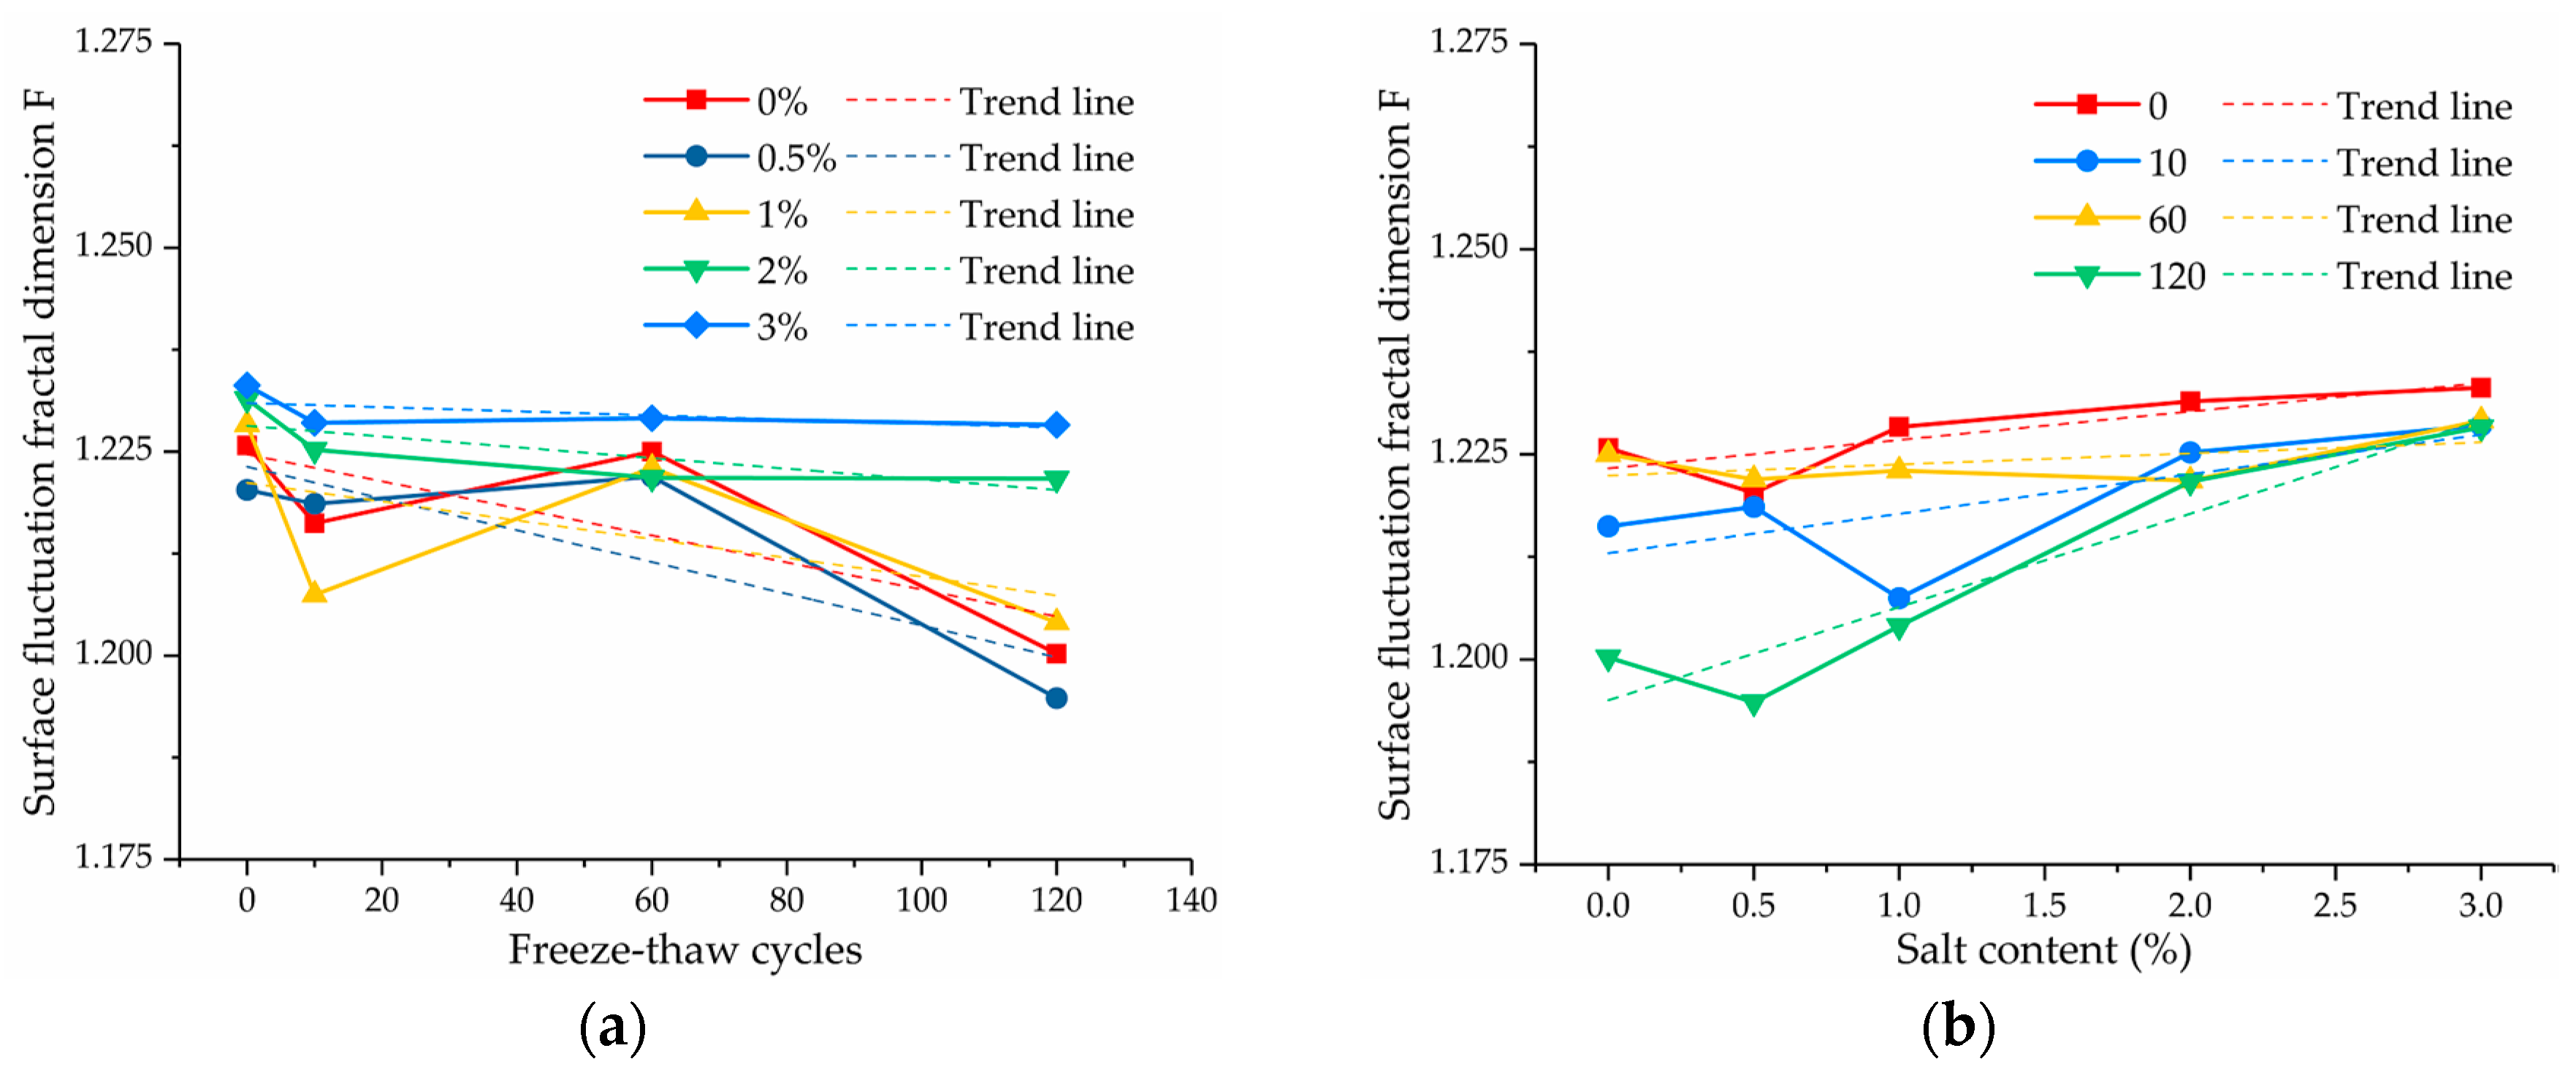
Figure 9 shows the surface fluctuation fractal dimension of the pores ( F ) of soil samples with different salt contents and freeze–thaw cycles. It can be seen that F fluctuated between 1.2–1.23 with the variation in salt contents and freeze–thaw cycles. The overall variation range was small, and the regularity was not obvious. The F showed a slightly decreasing trend with increasing freeze–thaw cycles and showed a slightly increasing trend with increasing salt contents on the whole. This indicated that the complexity and roughness of the pore outline decreased with increasing freeze–thaw cycles, and it increased with increasing salt contents overall, which was consistent with the variation of the average pore shape coefficient in the previous section. Figure 8 and Figure 9 show that the shapes of the pores in the soil changed slightly with the variation of salt contents and freeze–thaw cycles, which was consistent with the conclusions obtained by other previous studies [24,43]. Since the internal friction angle is closely related to the shape of the particles and pores in the soil, the small variations in pore morphology led to relatively small changes in the internal friction angle under different experimental conditions.

3.2.6. Orienting Probability Entropy of Pores

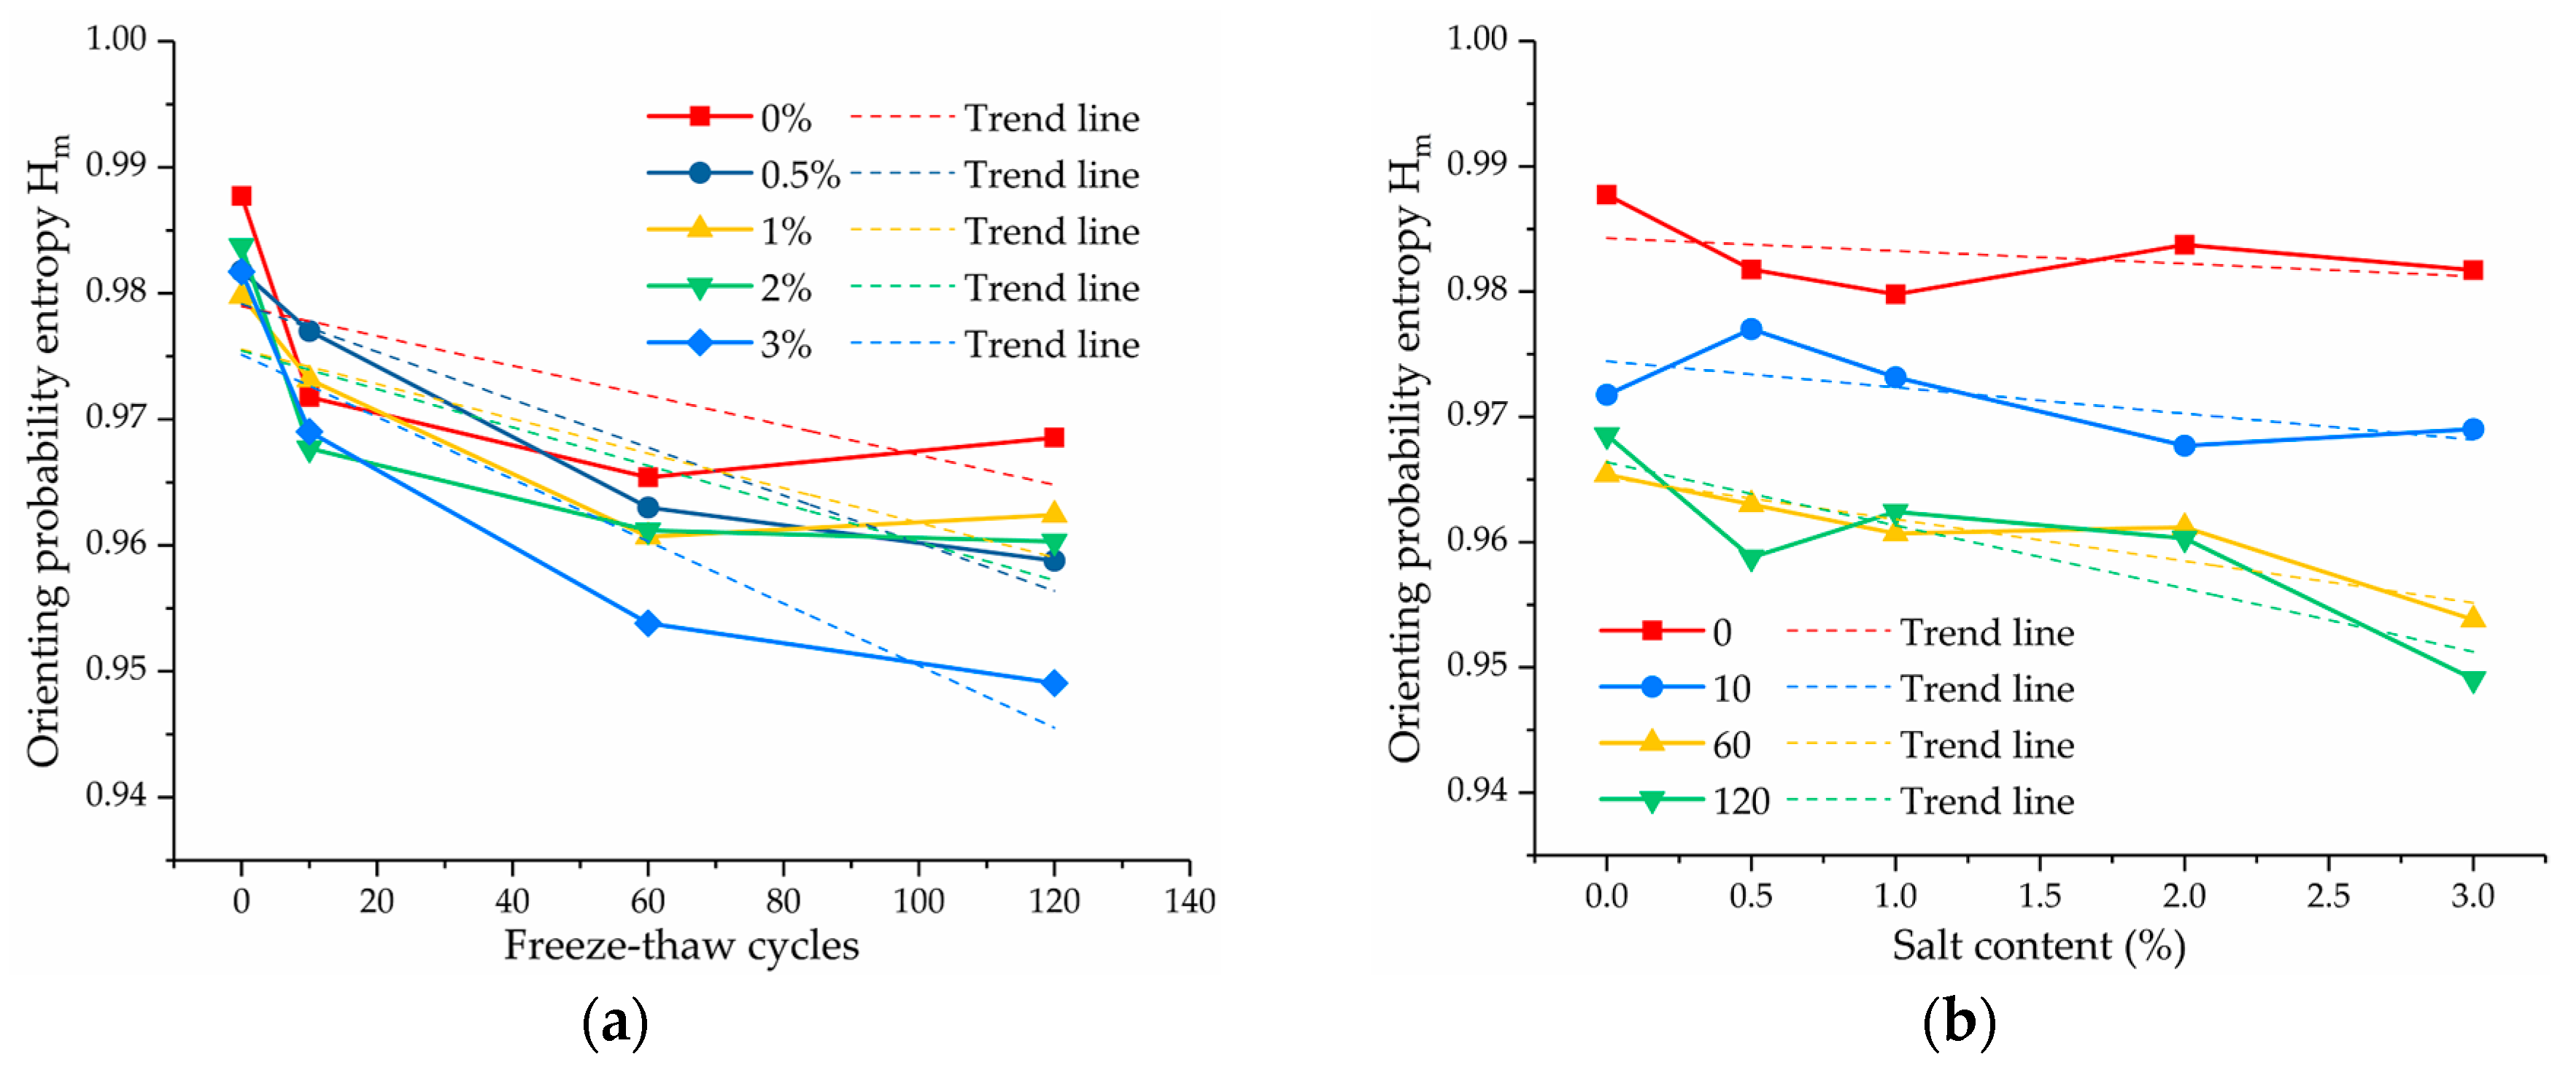
Figure 10 shows the orienting probability entropy of the pores ( H m ) of soil samples with different salt contents and freeze–thaw cycles. It can be seen that the H m showed a decreasing trend with increasing freeze–thaw cycles overall, indicating that the orientation of the pores tended to be improved with the increase in freeze–thaw cycles. This is because the remolded soil sample was fully crushed and mixed evenly during the sample preparation, and the internal structure of the soil sample was uniformly distributed and basically had no specific orientation. During the freeze–thaw cycles, the frost heave force generated by the freezing of the pore water in the soil squeezes the soil particles, which results in the directional arrangement of the soil particles [16]. Therefore, the orientation of the pores in the soil samples became better after the freeze–thaw cycles. When the number of the freeze–thaw cycles was the same, the H m showed a decreasing trend overall as the salt content increased, indicating that the increase in salt content also led to the orderly arrangement of pores in the soil samples. The more ordered the arrangement of particles and pores in the soil, the easier the soil particles will move and form a directional surface, and the more likely it is that the soil samples will be damaged. Therefore, as the salt content and freeze–thaw cycles increased, the orientation of the particles and pores in the soil gradually improved, which is an internal reason for the overall decreasing tendency in the failure strength and shear strength parameters of the soil samples.

3.3. Relationship between Failure Strength and Microscopic Pore Parameters

In order to quantitatively analyze the relationship between the shear strength and microstructure of the soil samples, SPSS software was used to analyze the correlation between the failure strength and the microscopic pore parameters of the soil samples with different salt contents and freeze–thaw cycles under different confining pressures, and the results are shown in Table 3. It can be seen from Table 3 that the failure strength of the soil samples had a significant linear correlation with the average pore diameter ( D ¯ ), the orienting probability entropy of the pores ( H m ), and the porosity ( N ) of the soil samples, and the correlation coefficients are all above 0.8, while the correlation between the average shape coefficient ( K ) and the surface fluctuation fractal dimension the of pores ( F ) was relatively weak. Therefore, D ¯ , H m , and N were selected as independent variables, and the failure strength was chosen as a dependent variable to fit the relationship between them.
When performing multiple linear regression analysis, there might be an approximately linear relationship between independent variables, which is called collinearity. When the collinearity is serious, the regression equation will become unstable, and the regression equation and regression coefficient cannot pass the significance test, which will make the model meaningless. Principal component regression (PCR) analysis is a modeling method that combines principal component analysis and regression analysis, and the principal component is a linear combination of the original independent variables, which can retain most of the information in the original independent variables. Using the extracted principal components for regression modeling can effectively eliminate the collinearity between independent variables and obtain a stable and reasonable regression model [44,45]. In order to investigate whether there is a collinearity relationship between D ¯ , H m , and N , the collinearity diagnosis of the three variables was performed by SPSS software, and the Pearson correlation matrix is shown in Table 4.
It can be seen that the correlation between the parameters is high, indicating that there is a collinear relationship between them, which is suitable for principal component regression analysis. Before principal component regression, the original data were standardized first to eliminate the influence of the dimension, and the standardized failure strength ( τ ), average pore diameter ( D ¯ ), orienting probability entropy of the pores ( H m ), and the porosity ( N ) were recorded as Z τ , Z D ¯ , Z H m , and Z N , respectively. Then, the principal component was extracted through the factor analysis module of the SPSS software, and one principal component, F 1 , was obtained through the principal component extraction, and the expression is as follows:
F 1 =   0.568 Z D ¯     0.585 Z H m   +   0.579 Z N
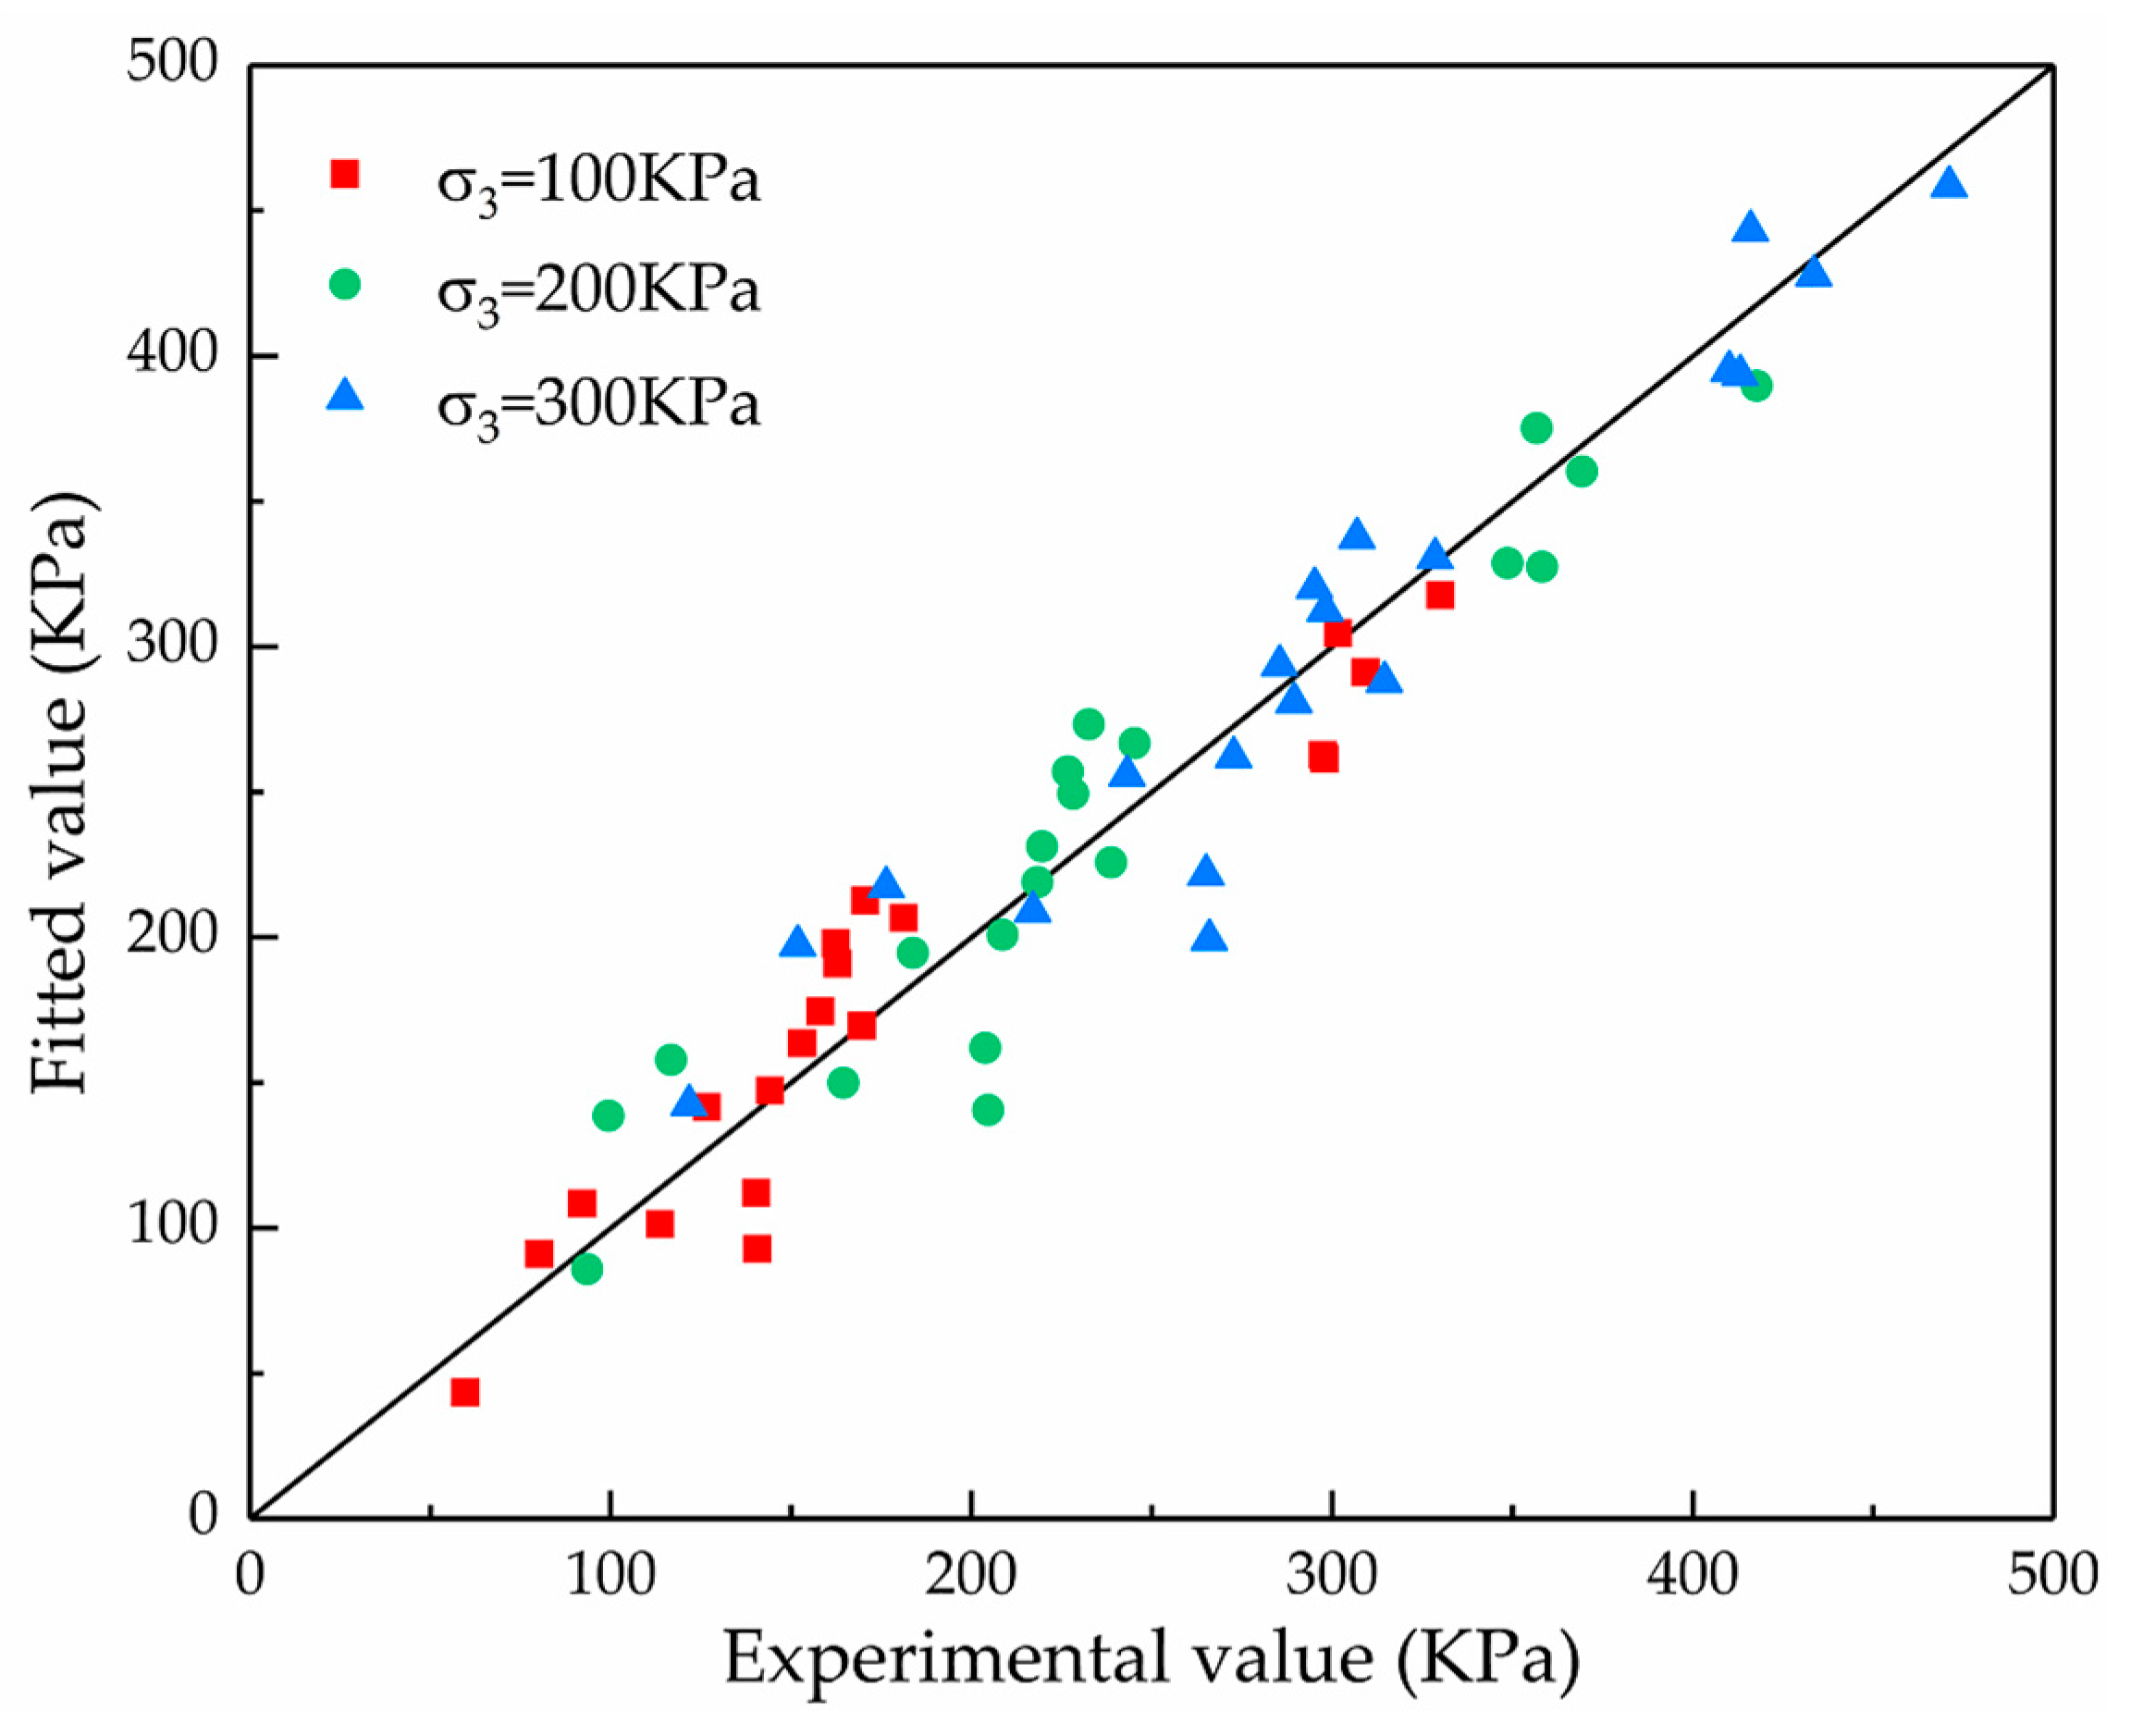
Next, linear regression analysis was performed on Z τ and F 1 . Finally, the regression model was restored according to the relationship between the standardized data and the original data, and the final fitting results are shown in Table 5. The entire process described above was completed by SPSS software. It can be seen from Table 5 that the adjusted R 2 values of the regression equations were all around 0.9, indicating that the regression equations were well fitted. Figure 11 shows the relationship between the failure strength, obtained by the experiments, and the failure strength, calculated by the regression equations. The fitting coefficients at the confining pressures of 100 kPa, 200 kPa, and 300 kPa were 0.906, 0.899, and 0.911, respectively, indicating that the correlation between the fitted value and the experimental value was high, and the fitting equations, obtained by principal component regression, were relatively reliable.
According to the results of the correlation analysis and principal component regression, it can be seen that under different experimental conditions, the failure strength of the soil samples was mainly affected by the size and direction of the pores in the soil, while it was affected little by the shapes of pores in the soil. The regression coefficients in the fitting formulas in Table 5 showed that the failure strength of the soil was negatively correlated with the average pore diameter and porosity and positively correlated with the orienting probability entropy of the pores. This is because the larger the porosity and the average pore diameter in the soil sample, the larger the distance between the soil particles and the smaller the bonding force between the soil particles. As a result, the failure strength of the soil samples was smaller, and the soil samples could be damaged easier. The smaller the orientation probability entropy of the pores, the better the orientation of the soil particles and the pores, and the easier the shear plane will form between the soil particles, which will result in the failure of the soil samples. Conversely, the larger the orientation probability entropy of pores, the worse the orientation of the soil particles and the pores, and the greater the frictional force between the soil particles. Thus, the failure strength of the soil samples was larger, and the soil samples were more difficult to be damaged. Therefore, it can be seen that the variation in the microstructure of the soil is the internal reason for the change of its failure strength. That is, with the variation of the salt content and the number of freeze–thaw cycles, the microstructural parameters in the saline soil samples changed, which led to the change in the failure strength of the soil samples.

4. Conclusions

In this paper, the shear strength and microstructure characteristics of soil samples with different salinities and freeze–thaw cycles were studied qualitatively and quantitatively by triaxial and SEM tests. In addition, the correlation between the shear strength and microscopic pore parameters was analyzed. The main conclusions that can be drawn are as follows:
  • The stress–strain characteristics of soil samples with different salinities and freeze–thaw cycles all belong to the strain–hardening type. The failure strength of the soil samples increased with increasing confining pressure under different experimental conditions. Compared with the salt content, the number of freeze–thaw cycles had a greater influence on the failure strength of the soil samples. As the number of freeze–thaw cycles increased, the failure strength of the soil samples showed a decreasing trend. The decreasing rate was the largest after the first 10 freeze–thaw cycles and tended to be slow in the range of 10–60 freeze–thaw cycles, while the decreasing rate increased again after 120 freeze–thaw cycles. When the number of freeze–thaw cycles was no larger than 60, the failure strength of the soil samples decreased first, then increased with the increasing salt content, but when the number of freeze–thaw cycles was 60–120, the failure strength decreased continuously with the increasing salt content.
  • The cohesion of the soil samples decreased with the increase in freeze–thaw cycles, and the decreasing rate was the largest in the first 10 freeze–thaw cycles, which was similar to the variation trend of the failure strength, while the variation of the internal friction angle of the soil samples was relatively small with an increase in freeze–thaw cycles. When the number of freeze–thaw cycles was the same, the variation of the shear strength parameter of the soil samples with salt content was relatively small, the cohesion of the soil samples decreased with the increasing salt content, and the variation trend of the internal friction angle was similar to the failure strength.
  • The SEM tests showed that the surface of the soil samples not experiencing freeze–thaw cycles was flat and dense, while after experiencing freeze–thaw cycles, the proportion of pores and fissures in the soil increased, the structure became loose, and the structural change of the soil samples was most obvious in the first 10 freeze–thaw cycles. When the number of freeze–thaw cycles was the same, the agglomeration degree of the soil particles increased as the salt content increased.
  • The quantitative analysis results of the microstructure showed that, with the increase in salt content and freeze–thaw cycles, the failure strength of the soil samples was generally negatively correlated with the porosity and average pore diameter, and the orienting probability entropy of the pores showed a decreasing trend overall. The orientation of the pore arrangement became better. However, the variation of the average shape coefficient and surface fluctuation fractal dimension of the pores under different experimental conditions was relatively small.
  • A reasonable regression model was established to express the relationship between the microscopic pore parameters and failure strengths of the soil samples based on principal component regression analysis. The results showed that the failure strength of the saline soil was mainly affected by the size and orientation of the pores in the soil, while it was affected little by the pore morphology. The failure strength of the soil was negatively correlated with the size of the pores and positively correlated with the orienting probability entropy of the pores.
This study may provide a quantitative basis for explaining the variation mechanism of the mechanical properties of saline soil in cold regions from a microscopic perspective.

Author Contributions

Conceptualization, J.W., Q.W., S.L., Y.H., S.C., and N.W.; methodology, J.W., Q.W., S.L., Y.H., S.C., and N.W.; formal analysis, J.W.; investigation, N.W., J.W., Y.H., and S.C.; writing—original draft preparation, J.W.; writing—review and editing, J.W. and Q.W.; project administration, Q.W.; funding acquisition, Q.W. All authors have read and agreed to the published version of the manuscript.

Funding

This research was funded by the Key Project of International (Regional) Cooperation and Communication of the National Natural Science Foundation of China (No. 41820104001), the Special Fund for Major Scientific Instruments of the National Natural Science Foundation of China (No. 41627801), and the Jilin Provincial Water Resources Department (No. 126002-2020-0001).

Acknowledgments

Sincere thanks are expressed to the editors and all anonymous reviewers for their insightful comments upon this manuscript.

Conflicts of Interest

The authors declare no conflict of interest.

References

  1. Wei, J.; Shi, B.; Li, J.; Li, S.; He, X. Shear strength of purple soil bunds under different soil water contents and dry densities: A case study in the Three Gorges Reservoir Area, China. Catena 2018, 166, 124–133. [Google Scholar] [CrossRef]
  2. Wang, J.-J.; Zhang, H.-P.; Tang, S.-C.; Liang, Y. Effects of Particle Size Distribution on Shear Strength of Accumulation Soil. J. Geotech. Geoenvironmental Eng. 2013, 139, 1994–1997. [Google Scholar] [CrossRef]
  3. Malizia, J.P.; Shakoor, A. Effect of water content and density on strength and deformation behavior of clay soils. Eng. Geol. 2018, 244, 125–131. [Google Scholar] [CrossRef] [Green Version]
  4. Wang, D.-y.; Ma, W.; Niu, Y.-h.; Chang, X.-x.; Wen, Z. Effects of cyclic freezing and thawing on mechanical properties of Qinghai-Tibet clay. Cold Reg. Sci. Technol. 2007, 48, 34–43. [Google Scholar] [CrossRef]
  5. Zheng, Y.; Ma, W.; Li, G.; Mu, Y.; Peng, H. Laboratory study on quantitative parameter of structural characteristics of soils considering effect of freeze-thaw cycles. Chin. J. Geotech. Eng. 2016, 38, 1339–1344. [Google Scholar]
  6. Qi, J.; Vermeer, P.A.; Cheng, G. A review of the influence of freeze-thaw cycles on soil geotechnical properties. Permafr. Periglac. Process. 2006, 17, 245–252. [Google Scholar] [CrossRef]
  7. Lu, J.; Zhang, M.; Zhang, X.; Pei, W.; Bi, J. Experimental study on the freezing–thawing deformation of a silty clay. Cold Reg. Sci. Technol. 2018, 151, 19–27. [Google Scholar] [CrossRef]
  8. Han, Y.; Wang, Q.; Kong, Y.; Cheng, S.; Wang, J.; Zhang, X.; Wang, N. Experiments on the initial freezing point of dispersive saline soil. Catena 2018, 171, 681–690. [Google Scholar] [CrossRef]
  9. Bing, H.; He, P. Experimental investigations on the influence of cyclical freezing and thawing on physical and mechanical properties of saline soil. Environ. Earth Sci. 2011, 64, 431–436. [Google Scholar] [CrossRef]
  10. Zhang, X.; Wang, Q.; Yu, T.; Wang, G.; Wang, W. Numerical Study on the Multifield Mathematical Coupled Model of Hydraulic-Thermal-Salt-Mechanical in Saturated Freezing Saline Soil. Int. J. Geomech. 2018, 18, 04018064. [Google Scholar] [CrossRef]
  11. Viran, P.A.G.; Binal, A. Effects of repeated freeze-thaw cycles on physico-mechanical properties of cohesive soils. Arab. J. Geosci. 2018, 11, 250. [Google Scholar] [CrossRef]
  12. Liu, Y.; Wang, Q.; Liu, S.; Shangguan, Y.; Fu, H.; Ma, B.; Chen, H.; Yuan, X. Experimental investigation of the geotechnical properties and microstructure of lime-stabilized saline soils under freeze-thaw cycling. Cold Reg. Sci. Technol. 2019, 161, 32–42. [Google Scholar] [CrossRef]
  13. Liu, J.; Zhang, L. The Microstructure Characters of Saline Soil in Qarhan Salt Lake Area and Its Behaviors of Mechanics and Compressive Strength. Arab. J. Sci. Eng. 2014, 39, 8649–8658. [Google Scholar] [CrossRef]
  14. Li, M.; Chai, S.; Du, H.; Wang, C. Effect of chlorine salt on the physical and mechanical properties of inshore saline soil treated with lime. Soils Found. 2016, 56, 327–335. [Google Scholar] [CrossRef]
  15. Yan, C.; Zhang, Z.; Jing, Y. Characteristics of strength and pore distribution of lime-flyash loess under freeze-thaw cycles and dry-wet cycles. Arab. J. Geosci. 2017, 10, 544. [Google Scholar] [CrossRef]
  16. Tang, Y.-q.; Yan, J.-j. Effect of freeze–thaw on hydraulic conductivity and microstructure of soft soil in Shanghai area. Environ. Earth Sci. 2015, 73, 7679–7690. [Google Scholar] [CrossRef]
  17. Hu, R.L.; Yeung, M.R.; Lee, C.F.; Wang, S.J. Mechanical behavior and microstructural variation of loess under dynamic compaction. Eng. Geol. 2001, 59, 203–217. [Google Scholar] [CrossRef]
  18. Qi, J.; Zhang, J.; Zhu, Y. Influence of freezing-thawing on soil structure and its soil mechanics significance. Chin. J. Rock Mech. Eng. 2003, 39, 2690–2694. [Google Scholar]
  19. Jiang, M.; Zhang, F.; Hu, H.; Cui, Y.; Peng, J. Structural characterization of natural loess and remolded loess under triaxial tests. Eng. Geol. 2014, 181, 249–260. [Google Scholar] [CrossRef]
  20. Xu, J.; Ren, J.; Wang, Z.; Wang, S.; Yuan, J. Strength behaviors and meso-structural characters of loess after freeze-thaw. Cold Reg. Sci. Technol. 2018, 148, 104–120. [Google Scholar] [CrossRef]
  21. Wen, B.-P.; Yan, Y.-J. Influence of structure on shear characteristics of the unsaturated loess in Lanzhou, China. Eng. Geol. 2014, 168, 46–58. [Google Scholar] [CrossRef]
  22. Zhang, Z.; Liang, J.; Huang, Y.; Qiu, G.; Yuan, Q. A study of the relationship between shear strength and microstructure of laterite under drying and wetting cycles. Hydrogeol. Eng. Geol. 2018, 45, 78–85. [Google Scholar]
  23. Cui, Z.-D.; He, P.-P.; Yang, W.-H. Mechanical properties of a silty clay subjected to freezing–thawing. Cold Reg. Sci. Technol. 2014, 98, 26–34. [Google Scholar] [CrossRef]
  24. You, Z.; Lai, Y.; Zhang, M.; Liu, E. Quantitative analysis for the effect of microstructure on the mechanical strength of frozen silty clay with different contents of sodium sulfate. Environ. Earth Sci. 2017, 76, 143. [Google Scholar] [CrossRef]
  25. Aldaood, A.; Bouasker, M.; Al-Mukhtar, M. Impact of freeze–thaw cycles on mechanical behaviour of lime stabilized gypseous soils. Cold Reg. Sci. Technol. 2014, 99, 38–45. [Google Scholar] [CrossRef]
  26. Roustaei, M.; Eslami, A.; Ghazavi, M. Effects of freeze–thaw cycles on a fiber reinforced fine grained soil in relation to geotechnical parameters. Cold Reg. Sci. Technol. 2015, 120, 127–137. [Google Scholar] [CrossRef]
  27. Kamei, T.; Ahmed, A.; Shibi, T. Effect of freeze–thaw cycles on durability and strength of very soft clay soil stabilised with recycled Bassanite. Cold Reg. Sci. Technol. 2012, 82, 124–129. [Google Scholar] [CrossRef]
  28. Zhang, F.; Wang, G.; Kamai, T.; Chen, W.; Zhang, D.; Yang, J. Undrained shear behavior of loess saturated with different concentrations of sodium chloride solution. Eng. Geol. 2013, 155, 69–79. [Google Scholar] [CrossRef] [Green Version]
  29. Han, Y.; Wang, Q.; Wang, N.; Wang, J.; Zhang, X.; Cheng, S.; Kong, Y. Effect of freeze-thaw cycles on shear strength of saline soil. Cold Reg. Sci. Technol. 2018, 154, 42–53. [Google Scholar] [CrossRef]
  30. Wang, Q.; Li, C.; Liu, Y.; Sun, D.; Zhang, X.; Ma, B. Mechanical properties of saline soil under the influence of different factors. Fresenius Environ. Bull. 2019, 28, 1366–1373. [Google Scholar]
  31. Chinese Standard. GB/T50123-1999. Standard for Soil Test Methods; China Planning Press: Beijing, China, 1999. [Google Scholar]
  32. ASTM. Standard Practice for Classification of Soils for Engineering Purposes (Unified Soil Classification System), D2487-11; ASTM International: West Conshohocken, PA, USA, 2011. [Google Scholar]
  33. Wang, N.; Wang, Q.; Huo, Z.; Ma, B.; Chen, Y. Influence of salt and compaction on critical water content of frost heaving of saline soil. J. Eng. Geol. 2016, 24, 951–958. [Google Scholar]
  34. Wang, J.-D.; Li, P.; Ma, Y.; Vanapalli, S.K. Evolution of pore-size distribution of intact loess and remolded loess due to consolidation. J. Soils Sediments 2019, 19, 1226–1238. [Google Scholar] [CrossRef]
  35. Tang, C.; Shi, B.; Wang, B. Factors affecting analysis of soil microstructure using SEM. Chin. J. Geotech. Eng. 2008, 30, 560–565. [Google Scholar]
  36. Wang, Q.; Wang, F.; Xiao, S. A quantitative study of the microstructure characteristics of soil and its application to the engineering. J. Chengdu Univ. Technol. 2001, 162, 148–153. [Google Scholar]
  37. Tarquis, A.M.; McInnes, K.J.; Key, J.R.; Saa, A.; Garcia, M.R.; Diaz, M.C. Multiscaling analysis in a structured clay soil using 2D images. J. Hydrol. 2006, 322, 236–246. [Google Scholar] [CrossRef]
  38. Chen, H.; Zhang, J.; Yan, H. Quantitative evaluation of microstructure characteristics of cement consolidated soil. Bull. Eng. Geol. Environ. 2013, 72, 233–236. [Google Scholar] [CrossRef]
  39. Wang, J.; Wang, Q.; Kong, Y.; Han, Y.; Cheng, S. Analysis of the pore structure characteristics of freeze-thawed saline soil with different salinities based on mercury intrusion porosimetry. Environ. Earth Sci. 2020, 79, 161. [Google Scholar] [CrossRef]
  40. Shi, B. Quantitative Assessment of Changes of Microstructure for Clayey Soil in the Process of Compaction. Chin. J. Geotech. Eng. 1996, 42, 60–65. [Google Scholar]
  41. Fang, L.; Qi, J.; Ma, W. Freeze-thaw induced changes in soil structure and its relationship with variations in strength. J. Glaciol. Geocryol. 2012, 34, 435–440. [Google Scholar]
  42. Zhang, Y.; Bing, H.; Yang, C. Influences of freeze-thaw cycles on mechanical properties of silty clay based on SEM and MIP test. Chin. J. Rock Mech. Eng. 2015, 34, 3597–3603. [Google Scholar]
  43. Zhang, Z.-L.; Cui, Z.-D. Analysis of microscopic pore structures of the silty clay before and after freezing–thawing under the subway vibration loading. Environ. Earth Sci. 2017, 76, 528. [Google Scholar] [CrossRef]
  44. Liu, R.X.; Kuang, J.; Gong, Q.; Hou, X.L. Principal component regression analysis with spss. Comput. Methods Programs Biomed. 2003, 71, 141–147. [Google Scholar] [CrossRef]
  45. Alver, A.; Kazan, Z. Prediction of full-scale filtration plant performance using artificial neural networks based on principal component analysis. Sep. Purif. Technol. 2020, 230, 115868. [Google Scholar] [CrossRef]
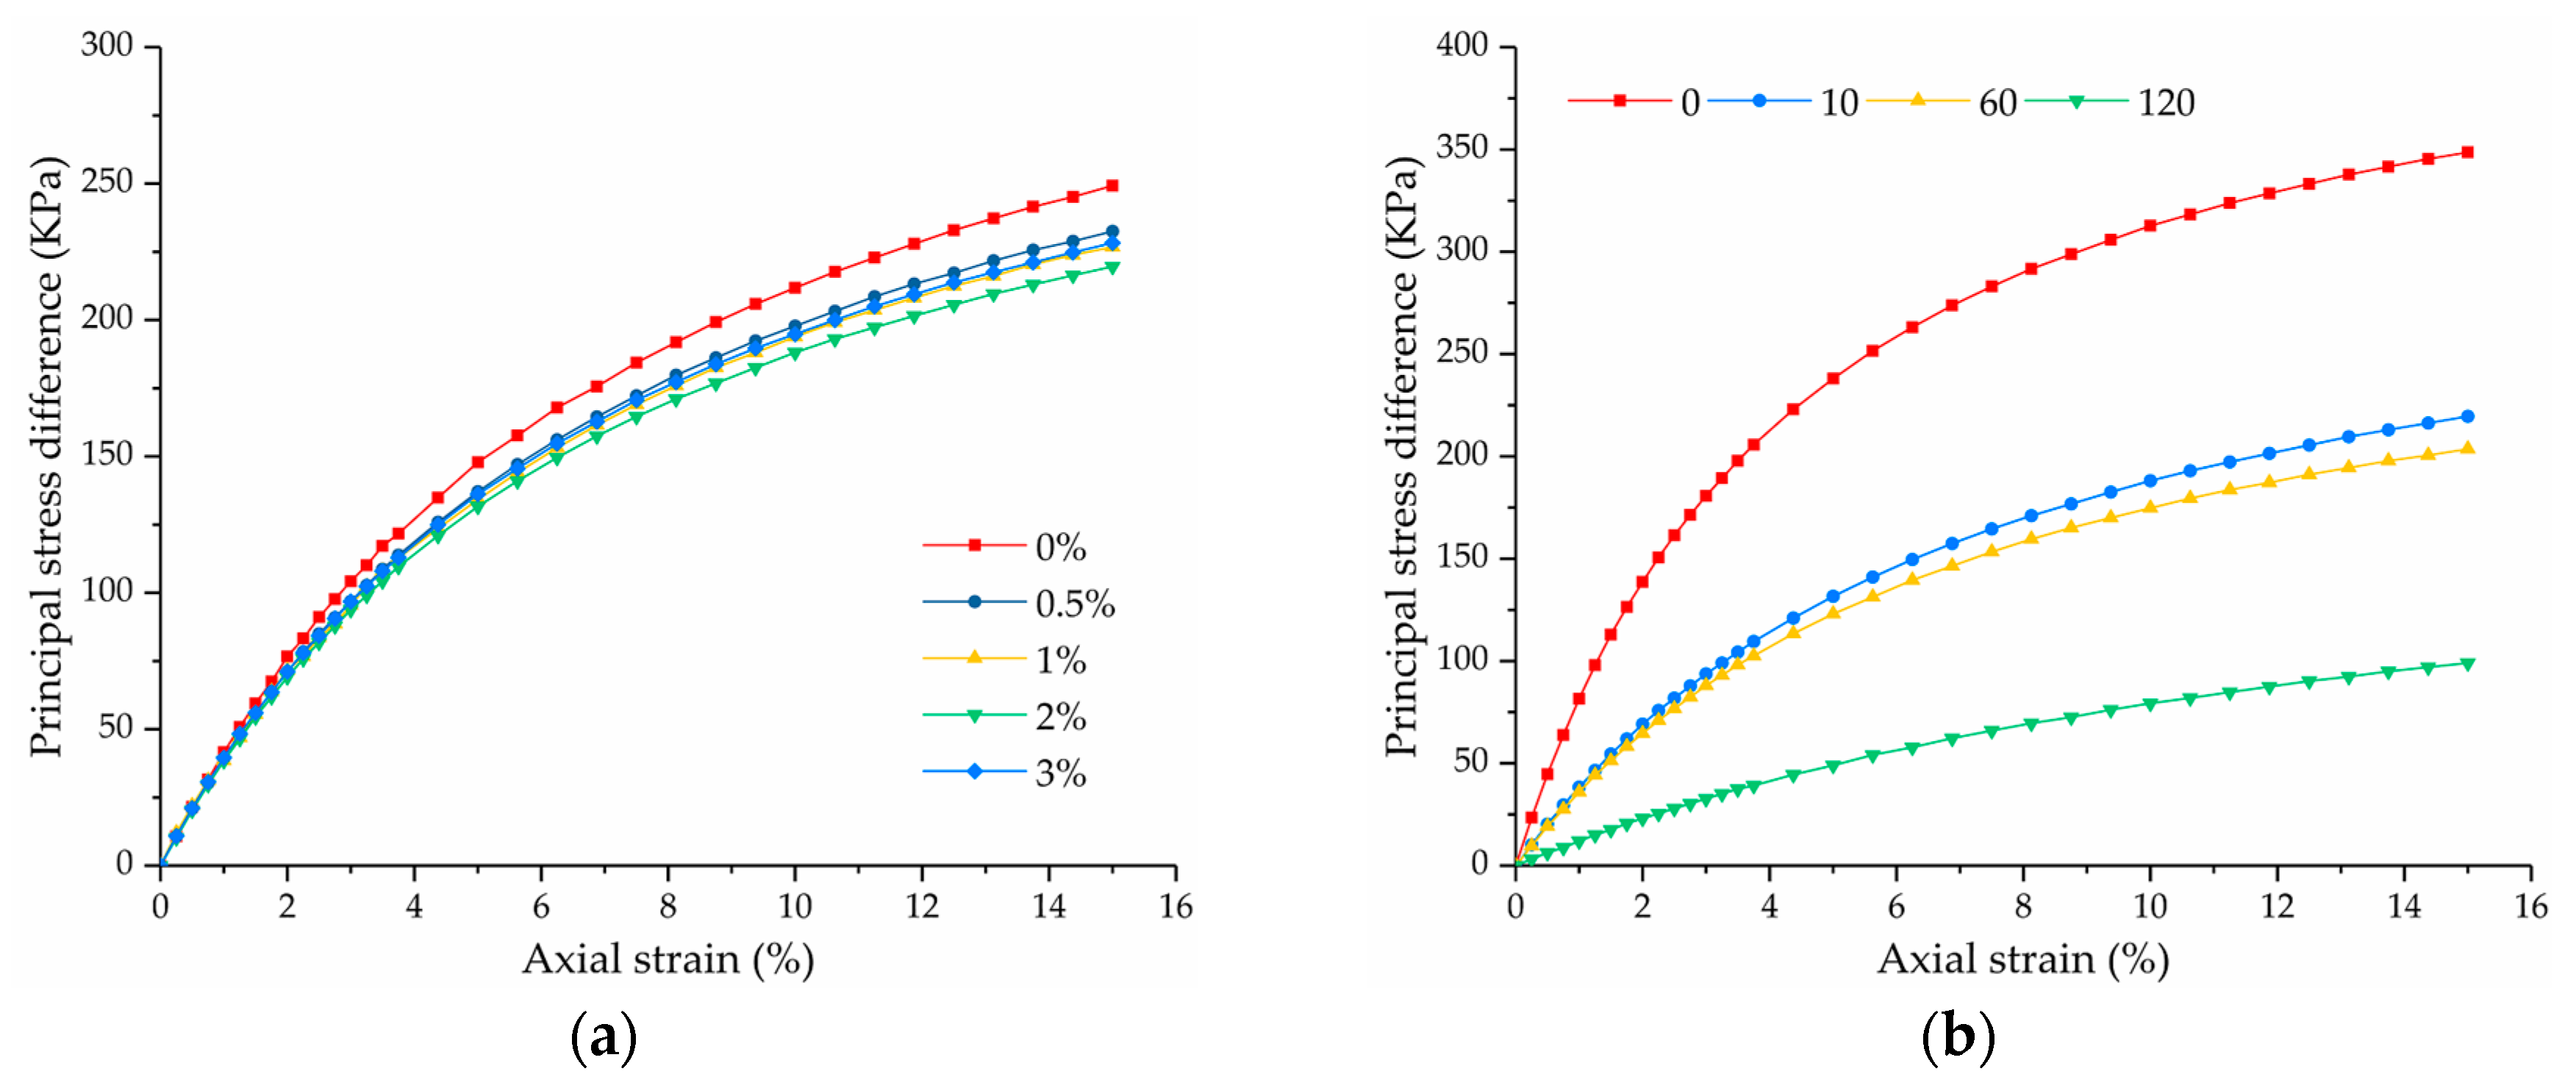
Figure 1. Stress–strain curves of soil samples with different salt contents and freeze–thaw cycles at a confining pressure of 200 kPa, with (a) freeze–thaw cycles (FTC) = 10 and (b) salt content (s) = 2%.
Symmetry 12 01709 g001
Figure 2. Failure strength of soil samples with different salt contents and freeze–thaw cycles at a confining pressure of (a) 100 kPa; (b) 200 kPa; and (c) 300 kPa.
Symmetry 12 01709 g002
Figure 3. Reduction rate of the failure strength of soil samples with freeze–thaw cycles at a confining pressure of (a) 100 kPa; (b) 200 kPa; and (c) 300 kPa.
Symmetry 12 01709 g003
Figure 4. Shear strength parameters of soil samples with different salt contents and freeze–thaw cycles for (a) cohesion and (b) the internal friction angle.
Symmetry 12 01709 g004
Figure 5. Micrographs of soil samples under different salinities and freeze–thaw cycles.
Symmetry 12 01709 g005
Figure 6. Porosity of soil samples with different (a) freeze-thaw cycles and (b) salt contents.
Symmetry 12 01709 g006
Figure 7. Average pore diameter ( D ¯ ) of soil samples with different (a) freeze-thaw cycles and (b) salt contents.
Symmetry 12 01709 g007
Figure 8. Average shape coefficient of pores ( K ) of soil samples with different (a) freeze-thaw cycles and (b) salt contents.
Symmetry 12 01709 g008
Figure 9. Surface fluctuation fractal dimension of pores ( F ) of soil samples with different (a) freeze-thaw cycles and (b) salt contents.
Symmetry 12 01709 g009
Figure 10. Orienting probability entropy of pores ( H m ) of soil samples with different (a) freeze-thaw cycles and (b) salt contents.
Symmetry 12 01709 g010
Figure 11. Relationship between fitted value and experimental value of failure strength.
Symmetry 12 01709 g011
Table 1. Basic properties of the collected saline soil.
PropertyValueTesting Method
Natural water content (%)26.6Oven-drying method
Natural density (g/cm3)1.92Cutting ring method
Dry density (g/cm3)1.517
Particle size distribution (%) Combined densimeter and sieve method
Sand (2–0.075 mm)2.20
Silt (0.075–0.005 mm)79.55
Clay (<0.005 mm)18.25
Liquid limit (%)43.0Liquid-plastic limit joint determination method
Plastic limit (%)22.0
Soluble salt content
Total (%)1.42Water-bath evaporation
Na+ (mmol/100 g)3.48Flame photometer
HCO3 (mmol/100 g)1.87Neutralization titration
SO42− (mmol/100 g)1.72EDTA complexometry titration
Table 2. Mineral composition of the collected saline soil.
MineralQuartzAlkali FeldsparPlagioclaseCalciteIlliteKaolinite
Content (%)431229475
Table 3. Correlation coefficient between the failure strength and microscopic pore parameters of soil samples.
D ¯ K F H m N
100 kPa−0.843−0.1690.4300.901−0.976
200 kPa−0.870−0.1840.4230.885−0.955
300 kPa−0.899−0.1780.4010.891−0.939
Table 4. Pearson correlation matrix of microstructural parameters of soil samples.
D ¯ H m N
D ¯ 1.000−0.8560.827
H m −0.8561.000−0.902
N 0.827−0.9021.000
Table 5. Principal component regression results.
Confining PressurePrincipal Component Regression Equation Adjusted   R 2
100 kPa τ = −144.10 D ¯ + 2612.03 H m − 276.76 N − 2049.380.901
200 kPa τ = −126.40 D ¯ + 2893.71 H m − 306.61 N − 2232.600.894
300 kPa τ = −131.64 D ¯ + 3013.52 H m − 317.64 N − 2272.780.906
Publisher’s Note: MDPI stays neutral with regard to jurisdictional claims in published maps and institutional affiliations.