Article

An Alternate Unsupervised Technique Based on Distance Correlation and Shannon Entropy to Estimate λ0-Fuzzy Measure

1
Labuan Faculty of International Finance, Universiti Malaysia Sabah, Labuan 87000, Malaysia
2
School of Quantitative Sciences, Universiti Utara Malaysia, Kedah 06000, Malaysia
*
Author to whom correspondence should be addressed.
Symmetry 2020, 12(10), 1708; https://doi.org/10.3390/sym12101708
Submission received: 10 September 2020 / Revised: 13 October 2020 / Accepted: 14 October 2020 / Published: 16 October 2020
(This article belongs to the Section Computer)

Abstract

:
λ 0 -measure is a special type of fuzzy measure. In the context of multi-attribute decision making (MADM), the measure can be used together with Choquet integral to model the interdependencies that usually present between the decision attributes. Unfortunately, the range of techniques available to estimate λ 0 -measure values is too limited i.e., only four techniques are available to this date. Besides, the review on literature shows that each of these existing techniques either requires some initial data from the decision-makers or misrepresents the actual interdependencies held by the attributes. Thus, an alternate unsupervised technique is needed for the estimation of λ 0 -measure values. This study has developed such a technique by integrating the idea of distance correlation and Shannon entropy. In this technique, the two inputs required to estimate λ 0 -measure values, namely, the interdependence degrees and fuzzy densities are determined by utilizing the distance correlation measures and entropy weights, respectively. An evaluation to rank the websites owned by five different hospitals located in Sabah, Malaysia, was conducted to illustrate the usage of the technique. A similar evaluation was also performed with a few selected MADM techniques for comparison purposes, where the proposed technique is found to have produced the most consistent ranking. From the literature perspective, this study has contributed an alternate unsupervised technique that can estimate λ 0 -measure values without necessitating any additional data from the decision-makers, and at the same time can better capture the interdependencies held by the attributes.

1. Introduction

The evaluation on a finite set of alternatives based on a predetermined set of attributes is known as a multi-attribute decision making (MADM) problem [1]. When dealing with any standard MADM problem, the decision-makers aim to systematically rank the available alternatives and select the alternative that is most suitable for their goals. The ranking is usually done by calculating the aggregated score of each alternative [2], where the higher aggregated score indicates the more preferred alternative for the existing problem.
Let x i 1 , x i 2 , …, x i n represent the performance scores of an alternative ( i ) with respect to the number of evaluation attributes (n). Aggregation can then be described as a procedure of synthesizing the scores into a single global score using a specific mathematical function known as aggregation operator [3]. The available aggregation operators can be divided into two main categories, which are linear and non-linear operators [4].
The linear operators such as simple weighted mean and ordered weighted average aggregate the scores with the assumption that there are no significant interdependencies between the evaluation attributes [5]. The assumption appeared to be false in many real situations as the attributes are usually tied to some degree of interdependencies [6]. In other words, using linear operators in a problem involving interactive attributes may lead to incorrect aggregated scores and ranking of alternatives, which usually results in misleading decisions. Fortunately, non-linear operators are not affected by this aspect.
Unlike linear operators, the non-linear operators can aggregate the scores by modelling the presence of interdependencies among the attributes. A few non-linear operators and the extended versions have been introduced recently. For example, the Bonferroni mean [7], weighted Pythagorean fuzzy interaction power Bonferroni mean [8], Zhenyuan integral [9], and Atanassov intuitionistic fuzzy Zhenyuan averaging operator [10]. However, the focus of this paper is narrowed on the Choquet integral [11], which remains as a popular non-linear operator that has been utilized widely in various areas of research spanning business management, engineering, healthcare, and transportation. The ability of the integral to deal with interactive attributes which resulted from its association with a measure is called a fuzzy measure [12]. Specifically, the usage of Choquet requires a prior estimation of fuzzy measure values. From a MADM perspective, these values represent the importance of every possible subset of the decision attributes. In other words, the values not only denote the individual importance of every attribute, but also the importance of all possible attribute coalitions [13].
For instance, a decision-maker wishes to assess the performance of a group of teachers based on the following three attributes: Teaching ability ( c 1 ), communication skill ( c 2 ), and knowledge level ( c 3 ). In advance to computing the aggregated score of each teacher using the Choquet integral, the decision-maker will first need to estimate the values of the following subsets, g : {∅}, { c 1 }, { c 2 }, { c 3 }, { c 1 ,   c 2 }, { c 1 ,   c 3 }, { c 2 ,   c 3 }, { c 1 ,   c 2 ,   c 3 }.
In short, for any decision analysis involving n number of evaluation attributes, one will need to estimate the 2 n values of fuzzy measure [14]. Hence, the complexity involved in the procedure of fuzzy measure estimation grows exponentially with the increase of n [15]. Various forms of fuzzy measure such as λ 0 -measure have been developed to overcome this complexity [16]. This study is prompted by the limitations that are associated with the current λ 0 -measure estimation techniques. Further details on the motivation of this study are provided in the following subsection.

1.1. Motivation of the Study

In contrast to other forms of fuzzy measure, the values of λ 0 -measure can be estimated with an uncomplicated computational procedure. However, the review on past literature showed that the techniques for the estimation of λ 0 -measure values are too limited, in which only four techniques are available to this date. Three supervised techniques, namely the original technique [16], the DEMATEL-based technique [17], and the ISM-based technique [18] were introduced initially, but as the term “supervised” suggests, all the three techniques required some initial data from the decision-makers [19] for the estimation. To be precise, the decision-makers are required to subjectively provide some data on the relationships held by the decision attributes. However, the decision-makers who are unfamiliar or less-informed on the decision attributes may struggle to provide such initial data.
Besides that, it was found that the amount of initial data required by each of these supervised technique increases significantly with a higher number of decision attributes, n . In actuality, the original technique, the DEMATEL-based technique, and the ISM-based technique requires n ( n 1 ) / 2 , 3 n ( n 1 ) / 2 , and 2 n ( n 1 ) / 2 amount of initial data, respectively. In other words, the initial data requirement of the DEMATEL and ISM-based technique is three-fold and two-fold than that of the original technique respectively. Although the initial data requirement of all the three techniques is still at a manageable level when n is fairly small, it will grow exponentially with the addition of every new attribute. This situation indicates that even a fully-informed decision-maker may encounter some difficulty to provide the necessary initial data, especially when n is sufficiently large. As a result of these limitations, a Pearson correlation-based unsupervised (PCBU) technique was recently introduced by Krishnan et al. [20], which does not require any initial data from the decision-makers. The technique utilizes Pearson correlation coefficients as the main inputs for the estimation. However, scholars have proven that Pearson correlation coefficients do not always capture the real interdependencies between the attributes [21,22]. The outcome of this technique is therefore ambiguous.
All in all, the existing gaps in the literature can be summarized as follows. It appears that the range of techniques meant for estimating λ 0 -measure values is too limited. To worsen the situation, every existing technique is either associated with the issue of complicated initial data requirement or misrepresents of the actual interdependencies held by the attributes. These gaps are hinting that there is a necessity to further explore the possibility of developing an alternate estimation technique, which is free from the said two issues. In other words, this study is motivated by the need for an alternate unsupervised technique which is not only free from the initial data requirement, but can also effectively capture the interdependencies between attributes simultaneously.

1.2. Statement on Contributions

The key contribution of this study is two-fold. Firstly, from the literature perspective, this study has presented an alternate technique to estimate λ 0 -measure values. In contrast to the existing techniques, the proposed technique has the merit of performing the estimation without necessitating any additional data from the decision-makers, and at the same time can better-capture the interdependencies that present between the attributes. The technique was developed by integrating the idea of distance correlation and Shannon entropy weights, where such integration has not been reported in any of the previous MADM works. The technique can also be regarded as one important contribution to the existing literature since the choice of techniques available to estimate λ 0 -measure values is limited i.e., only four techniques available to this date. On the other hand, from the context of decision-making, the technique is worth considering (1) when the decision-makers are not well-informed about the decision problem at hand, or (2) when they are dealing with a large set of decision attributes that knotted through unclear, complex interdependencies.
The second contribution of the study is linked to the hospital website evaluation problem. In this study, to demonstrate the workability of the proposed technique, an evaluation on the quality (i.e., the degree of usefulness) of websites owned by five different private hospitals located in Sabah, Malaysia was carried out. As a result, this study has successfully measured the overall degree of usefulness of those websites by applying the proposed technique and its associated Choquet integral. The relative ranking of the websites has also been identified. To some extent, the results from this evaluation can aid the hospitals to understand better the actual perception held by the customers on their websites. The results can also help them to compare their website quality with respect to their competitors, and subsequently do the necessary changes for further improvement.
The remainder of this paper is organized as follows. Section 2 explores the overall procedure involved in the estimation of λ 0 -measure and also compares the available estimation methods mainly in the context of initial data requirement. Section 3 presents the detailed elucidation on the execution of the proposed technique. Meanwhile, Section 4 illustrates the usage and feasibility of the proposed technique by applying to a hospital website on the problem evaluation. Finally, Section 5 summarizes the contributions and limitations of the paper, with the suggestion of some indications for future investigation.

2. Related Works

The use of Choquet integral in MADM problems is sometimes hampered by its complex fuzzy measure estimation procedure despite being known as an advantageous aggregation operator [23]. The greater the set of decision attributes, n , the higher the complexity of the estimation procedure [24]. To be exact, a higher number of fuzzy measure values need to be estimated with the increasing of n [25]. The similar approach should be done to the amount of initial data that need to be provided by the decision-makers for estimation purpose [26]. As a result, several attempts were made in the past to deal with this complexity, mainly by introducing some special types of fuzzy measure.
For instance, Sugeno [27] introduced a simplified version of the general fuzzy measure, which is known as the λ -measure. The measure is limited by an interaction parameter, λ , that describes the degree of additivity between the attributes [28]. The complete estimation of λ -fuzzy measure values can merely be achieved by using certain equations, with the pre-determination of λ in advance.
Meanwhile, Grabisch [29] introduced the k -order measure which helps to limit the number of fuzzy measure values required for solving a MADM problem. This measure only considers the interactions among k out of n attributes and neglect the higher-order interactions [30]. On the other hand, Zhang et al. [31] combined the good features of both the λ -measure and k -order measure to propose the λ k -measure, with the aim of simplifying the overall estimation procedure. Likewise, Larbani et al. [16] also developed an alternative fuzzy measure that is more user-friendly, which is known as λ 0 -measure. The main advantage of this measure is that it requires less amount of inputs for the estimation purpose as compared to other measures.
Past studies have developed various techniques for the estimation of fuzzy measure, especially to estimate the λ-measure. Lee and Leekwang [32] introduced a λ-measure estimation technique using genetic algorithms. To further reduce the subjective data required for the estimation, Takahagi [33] proposed a technique that is based on two types of pair-wise comparison, where the decision-makers are required to provide the pair-wise comparison values to indicate the degree of interactions between attributes and weights of attributes. There are multiple λ-measure estimation techniques that have been introduced with the similar motive, such as the sampling design and genetic algorithm-based technique by Chen and Wang [34], a genetic algorithm and evolution strategy-based technique by Wang and Chen [35], a Markov chain-based technique by Feng et al. [36], and a factor analysis-based technique by Krishnan [37].
Nevertheless, most of the techniques proposed in the literature are only devoted to estimating λ-measure, but not λ 0 -measure. It was found that the techniques available to estimate λ 0 -measure is very limited, in which only four techniques are available to date. The focuses of this study have been narrowed to λ 0 -measure in order to extensively investigate the possibility of developing an additional estimation technique. The detailed explanation of the concept of λ 0 -measure and its available estimation techniques are as follows.
Suppose C = c j = { c 1 , c 2 , , c n } denotes a finite set of evaluation attributes that is considered in a MADM problem as illustrated by Larbani et al. [16], the λ 0 -measure value, g of a subset consists of two attributes, which are j and j , that can be determined using (1), whilst the value of a subset which comprised of more than two attributes can be computed using (2). In fact, it was proven that both Equations (1) and (2) enable λ 0 -measure to conform to the two key mathematical conditions that must be fulfilled by any fuzzy measures, which is the boundary and monotone condition [38,39]. Note that a fuzzy measure differs from that of the classical as it complies with these two conditions.
  • Boundary condition infers that the value of the empty set should be zero, whereas the value of the universal set, which has the presence of all attributes, should be one, i.e., g { } = 0 and g { C } = 1 .
  • Monotone condition refers to a situation where the addition of any new attribute to a subset will never decline the value of the subset [40], i.e., A , B P { C } , if A B , then g { A }   g { B } .
    g { c j ,   c j } = g j +   g j + λ j j where   j j ,   g j =   g { c j } ,   and   g j =   g { c j }
    g { A } = c j C g j + c j , c j C , j j λ j j where   A   is   any   subset   of   C   that   has   more   than   two   attributes
In general, the procedure of λ 0 -measure values estimation as suggested in the original work can be delineated as follows. At the first stage, the decision-makers, who are expected to be conversant with the occurring decision problem, are required to make subjective estimation on the interdependence degree ( λ j j ) for every possible pair of attributes, which are j and j . The decision-makers are also advised to express their evaluation by adhering to a 0–1 scale, where the closer the value is to 1, the higher the dependency between j and j .
In the second stage, a simple system of inequalities as expressed in (3) is constructed based on the λ j j values determined. This system is then solved to find the fuzzy density of every attributes, g j ,   j = 1 , , n . Note that fuzzy densities are also known as the values of singletons [41].
In the following stage, both the λ j j and g j values can be substituted accordingly into (1) and (2) to estimate the entire set of λ 0 -measure values. The estimated λ 0 -measure values and the available performance scores of each alternative can then be substituted into the Choquet integral model (4) [42] to calculate their final aggregated scores. With respect to (4), A i refers to any of the subsets of C for j = 1 , 2 , ,   n , and x j represents the performance score of the alternative with respect to attribute j . Additionally, the fact that the permutation of attributes in A n is parallel to the descending order of the performance scores should be kept in mind. For instance, if x ( 1 ) x ( 2 ) x ( n ) , then A n = c ( 1 ) , c ( 2 ) , , c ( n ) .
0 g j +   g j + λ j j 1   for   all   c j   and   c j   in   C   where   j j ,
g { C } = c j C g j + c j , c j C , j j λ j j = 1 ,
g j 0 ,   j = 1 , , n .
C h o q u e t g ( x 1 , x 2 , , x n ) = j = 1 n ( x j x j 1 )   g ( A n )
However, the original estimation technique does not provide clear indications of the actual causal relationships held by the attributes. With the knowledge on the applicability of such indications from the decision making perspective, Ref. [17,18] have proposed a DEMATEL and an ISM-based technique respectively. Unfortunately, all these available techniques are “supervised” in nature, which they required some quantity of initial data from the decision-makers for the estimation purpose. Table 1 summarizes the type and quantity of initial data required by each technique. In addition to that, Figure 1 presents the result of a simple experiment that shows how the initial data requirement of each technique changes with the increasing number of evaluation attributes, n .
The following limitations were observed based on Table 1 and Figure 1:
  • First limitation—All the techniques required the input of some initial data by the decision-makers, mainly concerning the interrelationships held by the decision attributes. Such data cannot be simply furnished by any decision-makers who have incomplete information, or exhibits ambiguity over the nature of the attributes. In short, only fully-informed decision-makers may benefit from these techniques.
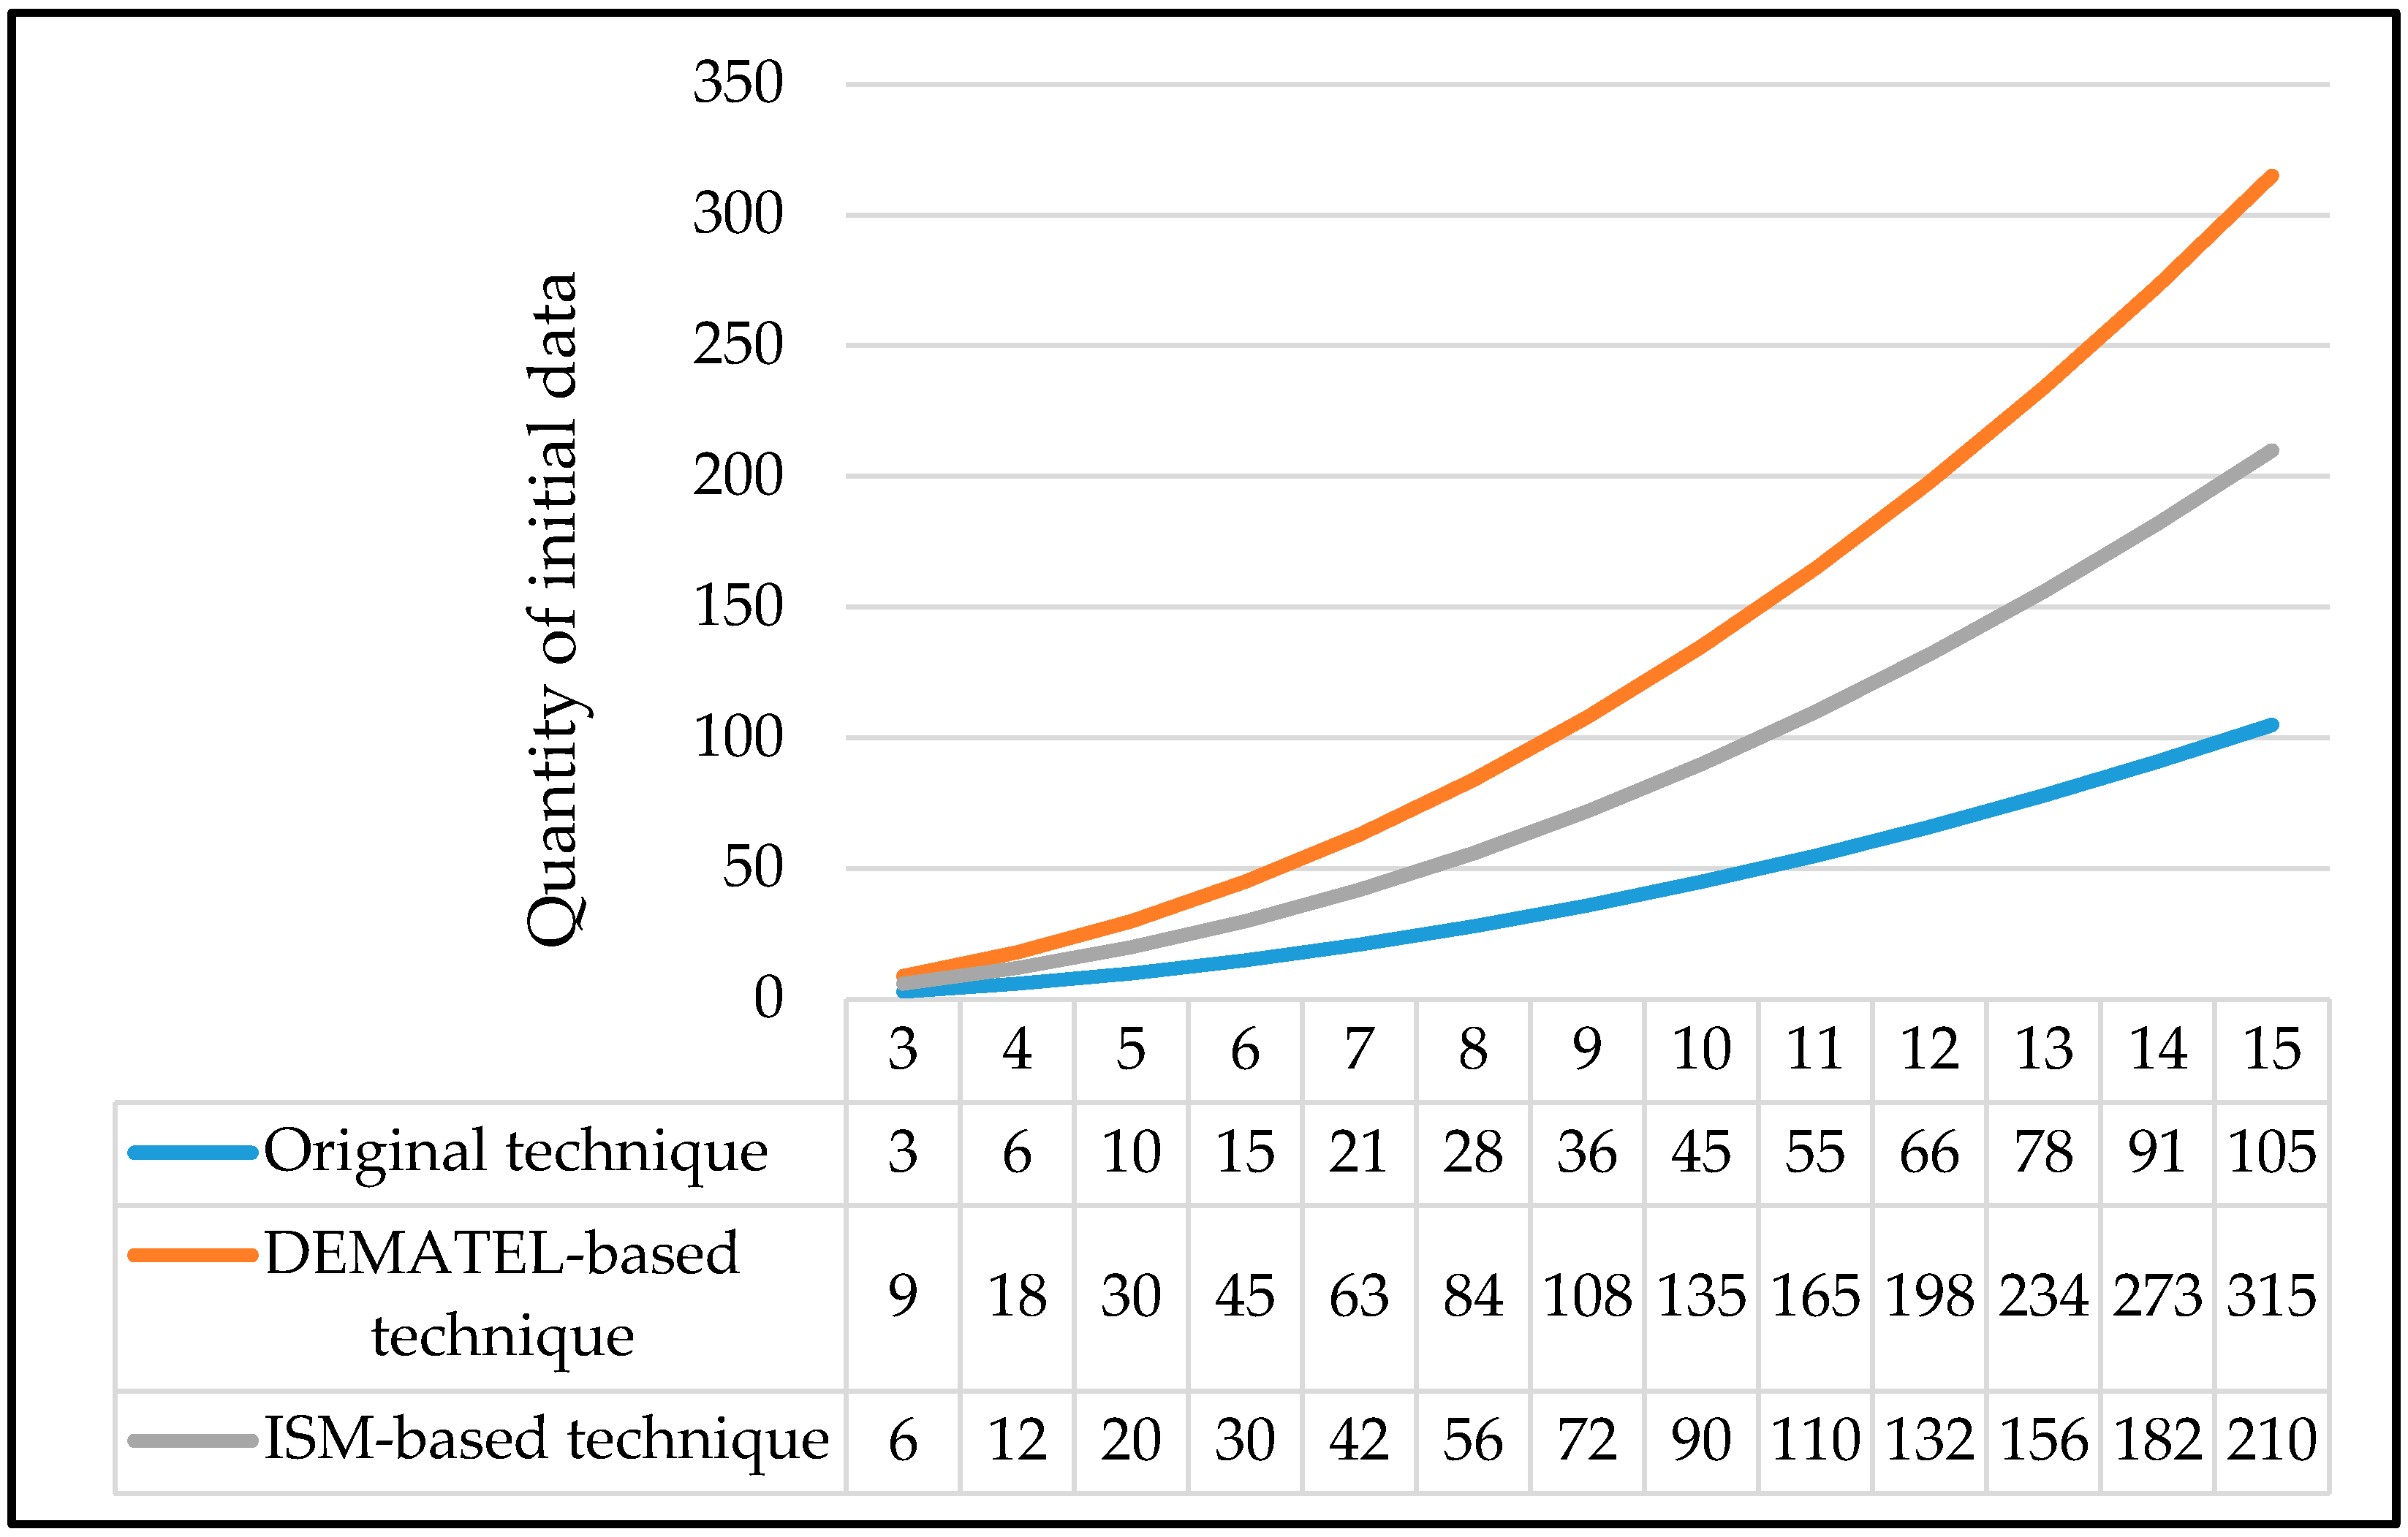
  • Second limitation—The initial data requirement of the DEMATEL and ISM-based technique is three-fold and two-fold than that of the original technique, respectively. Although the quantity of initial data required by all the three techniques is still manageable when n is relatively small, it will grow exponentially as n increases. This gives an indication that even a fully-informed decision-maker may struggle to provide the necessary initial data, especially when n is sufficiently large, in a consistent and precise manner. For instance, for a problem involving ten attributes, an amount of 45, 90, or 135 initial data is required by the decision-makers should they use the original technique, ISM-based technique, or DEMATEL-based technique, respectively.
In response to these limitations and as an effort to encourage decision-makers to consider the use of λ 0 -measure in real problems, Krishnan et al. [20] recently proposed the PCBU technique (a Pearson correlation based-technique), which does not require initial data requirement. However, the estimation achieved with this technique is ambiguous as Pearson correlation coefficients can misrepresent the existing interdependencies between attributes. Scholars have proven that the two attributes with zero Pearson coefficient may not completely be independent in reality [22,43]. Thus, an alternative unsupervised technique that is free from initial data requirement and possess the ability to quantify the interdependencies between attributes in a more reliable manner is highly needed.
The following section elaborates on the development and application of the alternative technique in the context of MADM.

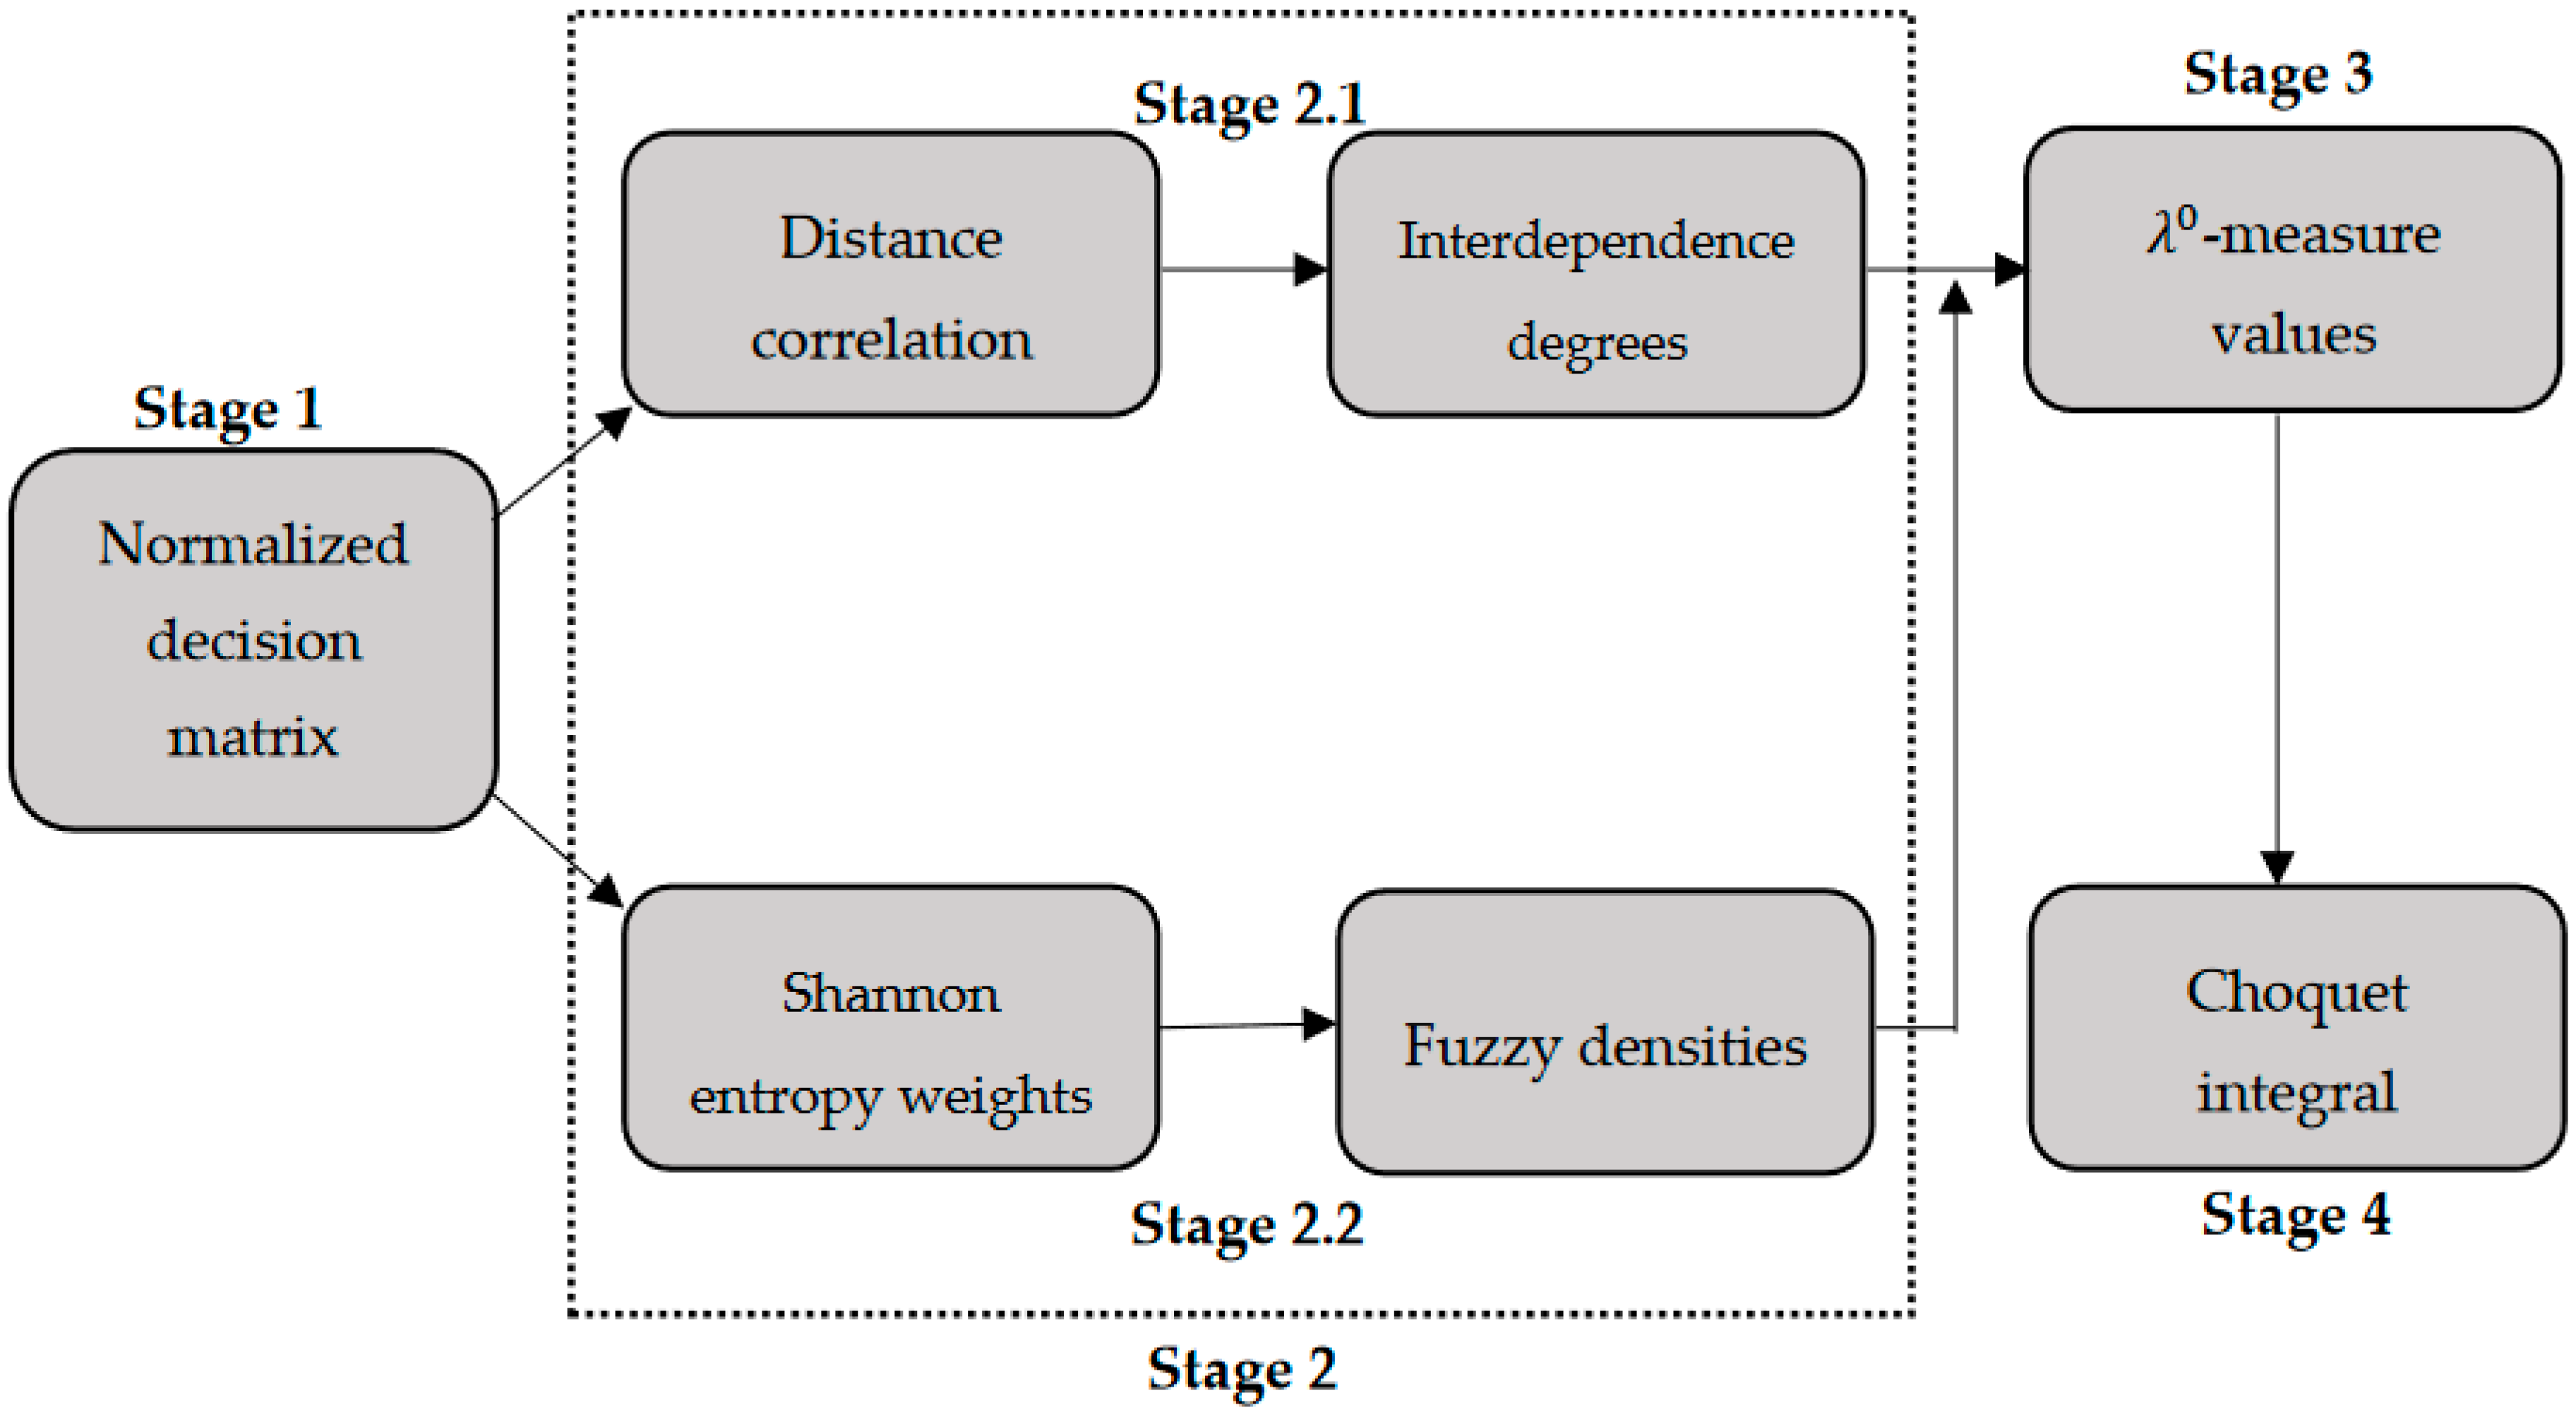
3. The Proposed Technique

The proposed technique was developed by embedding the concept of distance correlation and Shannon entropy weighting method into the original λ 0 -measure estimation technique. Generally, the implementation of the proposed technique entails the following stages:
  • Stage 1—Normalizing the decision matrix.
  • Stage 2—Determining the inputs required for estimation.
    Stage 2.1—Determining the interdependence degrees using distance correlation.
    Stage 2.2—Determining the fuzzy densities with the aid of Shannon entropy weighting method.
  • Stage 3—Estimating λ 0 -measure values.
  • Stage 4—Applying Choquet integral.
Figure 2 is the visual representation of the proposed technique. The detailed technical explanation of the steps involved in every stage is provided in the following subsections.

3.1. Normalizing Decision Matrix (Stage 1)

A decision matrix may involve the attributes that are measured in different units [44]. Therefore, the data in the decision matrix must be normalized into a standard numeric scale in order to allow valid aggregation. In Stage 1, the following normalization formula (5) was used to standardize the scores associated with each attribute, within the range of 0 and 1 [45].
x i j ¯ = x i j x j w o r s t x j b e s t   x j w o r s t

3.2. Determining the Inputs Required for Estimation (Stage 2)

The estimation of λ 0 -measure values required two types of input variables. The first, and probably the most vital input is the degree of interdependence, λ j j for every pair of attributes. The second input is the fuzzy density of each attribute. Although the authors in [16] claimed that these densities can be determined by solving Equation (3). It was reported that a more reliable set of fuzzy densities can be determined if the decision-makers can furnish extra information on the relative importance held by each decision attributes [17]. With that, the two respective inputs were determined with the help of distance correlation and Shannon entropy weighting method, respectively, in this proposed technique.

3.2.1. Determining the Interdependence Degrees using Distance Correlation (Stage 2.1)

The Pearson correlation coefficient is a statistical measure that is widely used to study the degree of relatedness or the dependency between two variables. For example, in the presence of two different random variables which are denoted as X and Y , the Pearson correlation coefficient between these variables, c o r ( X , Y ) , can take any value between −1 and 1, where c o r ( X ,   Y )   = 0 indicates complete independence between the variables [46].
However, the Pearson correlation has its limitation. In some situations, the two variables with zero coefficient value may not be independent of each other as the Pearson correlation only detects the linear relationship between two variables, but not the non-linear relationship [47]. Hence, Székely et al. [22] introduced a new correlation measure known as distance correlation, where it is zero if and only if the variables are independent. Similar to the Pearson correlation, the distance correlation between X and Y can be defined as follows (6):
d C o r ( X ,   Y ) = d C o v ( X , Y ) s q r t ( d V a r ( X ) d V a r ( Y ) )
The distance covariance between X and Y , d C o v ( X ,   Y ) , in (6) can be identified using (7). The distance covariance is computed by double centering the pairwise Euclidean distance matrix of each data, followed by summing over the entry-wise product of the two centered distance matrices. Additionally, take note on the distance variance of X , d V a r ( X )   =   d C o v ( X , X ) , and distance variance of Y ,   d V a r ( Y )   =   d C o v ( Y , Y ) [48].
d C o v ( X , Y ) = 1 n 2 i = 1 n j = 1 n D ( x i , x j ) . D ( y i , y j )
To reiterate based on the context of MADM, the steps involved in calculating the distance correlation of every two attributes, c j and c j are listed below [49].
  • Step 1—The Euclidean distance matrix of attribute c j was constructed based on the scores associated with all the alternatives under consideration. A similar matrix was constructed for c j .
  • Step 2—The following double-centering steps on each matrix were executed, where the row means, column means, and the overall mean of the elements in each matrix become zero. The row mean from each element was deducted, then the column mean from each element was deducted, and finally, the matrix mean was added to each element.
  • Step 3—Multiplication of the double-centered matrices elementwise was performed and the mean value of the elements from the resulted matrix was identified. Mean value is obtained by dividing the sum of elements with the total number of elements. The square root of the mean value is the distance covariance of c j and c j i.e., d C o v ( c j , c j ) .
  • Step 4—Since the distance variance of c j , d V a r ( c j )   =   d C o v ( c j , c j ) , and the distance variance of c j ,   d V a r ( c j )   =   d C o v ( c j , c j ) , then these two values can be calculated by repeating step 1-3 accordingly.
  • Step 5—The available d C o v ( c j , c j ) , d V a r ( c j ) , and d V a r ( c j ) were substituted into (6) to compute the distance correlation between c j and c j i.e., d C o r ( c j , c j ) respectively.
The distance correlation value ranges between 0 and 1, where 0 indicates complete independence between the two variables, whereas 1 indicates strong dependency [43,50]. It is evident that the value range and interpretation held by a distance correlation measure well-synchronize with the properties of an interdependence degree, λ j j . Therefore, decision-makers are encouraged to use the distance correlation measures as the exact estimation for the interdependence degrees, λ j j = d C o r ( c j , c j ) , in this stage.

3.2.2. Application of Shannon Entropy Method (Stage 2.2)

In this stage, the Shannon entropy [51] method was applied to compute the objective weight of every attribute. Although many weighting methods that exhibit similar purpose are available, the Shannon entropy is specifically chosen for this study as it is known for the merit of minimizing common biases that are associated with the subjective preferences of decision-makers, and increasing objectivity [52]. Entropy is one crucial idea in the field of information theory, which is generally used as a measure for uncertainty allied to a system [53]. In the context of MADM, the attribute with more uncertainty or varying data is assigned with higher entropy weight [54]. This can be explained in the situation as follows. For the performance scores of alternatives with respect to an attribute varied significantly from one to another, then this specific attribute may exhibit more interesting or meaningful information [55]. Thus, from the viewpoint of decision-making, more attention or weightage should be given to such attributes as compared to that with homogeneous data.
Let [   x i j ¯   ] be the normalized decision matrix, where A l t i   = { a 1 , a 2 , , a m } is a set of alternative that was evaluated based on a predetermined set of attributes, C = c j =   { c 1 , c 2 , , c n } . Then, the entropy of each attribute ( j ) can be computed using Equation (8), whereas the final entropy weight can be determined with Equation (9) [56].
e j = K i = 1 m x i j ¯ l n x i j ¯
where = 1 / l n m , and if x i j ¯ = 0 , then x i j ¯ l n x i j ¯ = 0
w j = 1 e j j = 1 n ( 1 e j )
The entropy weights values, w j and λ j j . that were determined prior were then used to construct and solve the following system of inequalities (10) to derive the fuzzy density of each attribute, g j .
0 g j +   g j + λ j j 1 ,   for   all   c j   and   c j in   C , g { C } = c j C g j + c j , c j C , j j λ j j = 1 , g j 0 ,   j = 1 , , n , g 1 : g 2 : : g n   =   w 1 : w 2 : :   w j .
It can be observed that the proposed system of inequalities (10) slightly varied from that of the original (3), in the presence of (*), where it will ensure the ratio of the densities, g j , to comply with that of the entropy weights, w j . For example, if w 1 = 0.15, w 2 = 0.25, and w 3 = 0.6, then (*) can be expressed as g 3 = 4 g 1 and g 3 = 2.4 g 2 .

3.3. Estimating λ 0 -Measure Values and Applying Choquet Integral (Stage 3 and 4)

In Stage 3, the identified inputs (i.e., λ j j and g j ) were substituted into (1) and (2) respectively to estimate the whole set of λ 0 -measure values. Based on the performance scores in the normalized decision matrix and the estimated λ 0 -measure values in Stage 4, the Choquet integral model was then applied to compute the aggregated score of each alternative under consideration.

4. An Application to Hospital Website Evaluation Problem

In modern society where the internet appears as a firm associate, customers usually visit the website of the business company prior to making the decision to purchase the products or services offered [57]. A similar scenario can be applied to healthcare industries. The potential local or international patients may first access a hospital’s website to (a) seek information on available treatments, specialists, facilities, and medical tourism packages, (b) survey the price of the services, (c) pose queries, or (d) even book an appointment with a doctor. In other words, hospital websites can be considered as the first point of contact between the hospital and its potential patients. If the patients had an unpleasant first experience after visiting the websites, the particular hospital may lose its potential patients [58] as a displeasing website experience can trigger negative perceptions of patients on the overall hospital services. For instance, if the potential customers failed to trace the desired details, they may not only leave the website with huge disappointment but it will also negatively affect their purchase decision [59]. In addition, the time taken for a website to load may also cause customers to switch to the website of other competitor, especially when it comes to customers that are impatient [60,61].
It is crucial for hospitals to periodically compare and rank their website with that of the competitors [62]. By doing so, necessary improvement can then be made to increase the possibility of gaining patients with the website. Unfortunately, most of the evaluation studies on the existing hospital websites apply the additive MADM techniques, which ignore the presence of interdependencies among the evaluation attributes, except for the recent study that was conducted by Percin [63]. Realizing the limitation, the demonstration on the feasibility of the proposed technique was conducted on the hospital website evaluation problem. Particularly, the websites of five private specialist hospitals that are located in the state of Sabah, Malaysia, were evaluated using the proposed technique.
The choice of the hospitals was made based on the potential of them in transforming into a well-established medical tourism hospital in near future. These are the only five hospitals in Sabah with services that are recognized by the Malaysia Healthcare Travel Council. Although Sabah hosted many famous tourist destinations and specialist hospitals with top-notch medical services and infrastructure, in the context of medical tourism, the state remains less developed as compared to other states in Malaysia [64]. Therefore, the outcome of this evaluation may be able to help the respective hospitals to improve their websites to a certain extent to attract more local and international patients.
The main interest of this paper was to evaluate the usefulness of the websites. According to Qi et al. [65], the usefulness of a website will determine the degree of functionality and serviceability of the website. The author recommended a total of seven attributes to measure the usefulness of a website, but only the following five attributes were retained in this study, which are navigability ( c 1 ), design ( c 2 ), ease of use ( c 3 ), content ( c 4 ), and accessibility ( c 5 ). The description for each attribute is provided in Table 2. The remaining two attributes, which are the flexibility [66] and playfulness [67], were discarded due to their irrelevancy to healthcare websites. They appeared to be more pertinent to e-retailing websites as playfulness refers to the fun elements of a website, whereas flexibility mainly refers to the options provided by the website for online payment, searching, and returning products functions.
The evaluation began with the establishment of a decision matrix showing the performance scores of every alternative with respect to the evaluation attributes as listed in Table 2. The necessary data required to estimate the performance scores were gathered with two instruments, which are survey questionnaires and a webpage testing tool.
Survey questionnaires were used to collect the data required for c 1 , c 2 , c 3 , and c 4 . To be precise, the questionnaire was structured into five sections, with the first section aimed to gather the demographic profiles of the respondents, and the remaining sections requested the respondents to rate the website of each hospital based on c 1 , c 2 , c 3 , and c 4 , with a 7-point Likert scale. The respondents involved were also requested to explore all the websites thoroughly for proper consideration before submitting the rating. Figure 3 shows a portion of the questionnaire, which was designed using Google Form.
The questionnaire was only distributed to a total sample size of 102 working adults and university students from Labuan, Malaysia, who have volunteered to participate in this survey as volunteers may review and rate the websites with greater interest and honesty. As expected, the volunteers were highly approachable, and their efforts and honesty were assured to be highly appreciated. Besides that, each respondent was given ample time to review the websites and submit the completed questionnaire to minimize potential biases. Additionally, to improve the survey response rate and as a token of appreciation to the respondents for their efforts, a form of incentive was promised to the volunteers, which will be distributed to the respondents after the relaxation of the Movement Control Order that was enforced by the Malaysian government due to the outbreak of COVID-19.
The response rate of the survey was 100%, in which no incompleteness or missing data were found in all the submitted questionnaires. In terms of gender, 57.84% of the respondents were females, and the remaining of that were males. The respondents were aged between 20 and 45 years old, with a mean age of 27 years old. As for the educational background of the respondents, a majority (i.e., 68.63%) of them were doing or had completed their bachelor’s degree. In the context of employment status, 50.98% of them were working adults, whereas the remaining were university students. Meanwhile, for the statement, “I normally visit the official website of the service provider before making my purchase decision”, 86.27% of the respondents responded with “Yes”, whereas the remaining responded with “Maybe”. This result indicates that all the respondents had some basic ideas on the criteria of a good website, thus making them eligible to participate in the survey.
The average Likert ratings from these respondents were calculated to obtain the final performance scores of each website with respect to c 1 , c 2 , c 3 , and c 4 . On the other hand, a specific webpage testing tool known as WebPageTest [72] was used to identify the accessibility (i.e., c 5 ) of each website by measuring their download speed (in seconds).
The compilation of data collected from the respondents can be accessed with the following link: https://doi.org/10.6084/m9.figshare.12998762.v1. Meanwhile, Figure 4 depicts the screenshots of the WebPageTest results. On the other hand, Table 3 presents the final decision matrix obtained for the hospital website evaluation problem. In order to maintain confidentiality, the websites were renamed as Website A , B , C , D , and E .
The performance scores listed in Table 3 were then normalized using (5). The normalization should be conducted carefully as the decision matrix may contain a mixture of beneficial and non-beneficial attributes. Higher values are preferred for beneficial attributes, whereas lower values are desired for non-beneficial attributes. By adhering to these definitions, all the attributes in this evaluation can then be regarded as beneficial attributes, except c 5 . Hence, the best value for c 5 was 3.5510, whereas 5.2451, 5.3824, 5.2353, and 5.3529 was identified as the best value for c 1 , c 2 , c 3 , and c 4 , respectively. Table 4 shows the normalized version of the decision matrix.
Table 5 summarizes the distance correlation measure or the interdependence degree of every pair of attributes determined using (6) and (7). To gain a profound understanding, the complete calculation of d C o r   ( c 1 , c 2 ) or λ 12 is presented in Appendix A. Meanwhile, Table 6 depicts the entropy, e j , and the final objective weight, w j , of each attribute calculated using (8) and (9), respectively.
Based on the interdependence degrees in Table 5 and the objective weights summarized in Table 6, the following system of inequalities was solved with EXCEL Solver to determine the fuzzy densities. The following densities were obtained: g 1 = 0.0103 ,   g 2 = 0.0118 ,   g 3 = 0.0087 ,   g 4 = 0.0093 , and g 5 = 0.0117 .
g 1 + g 2 + 0.8381   1 g 1 + g 3 + 0.9340 1 g 1 + g 4 + 0.9305 1 g 1 + g 5 + 0.5158 1 g 2 + g 3 + 0.9152 1 g 2 + g 4 + 0.9076 1 g 2 + g 5 + 0.3426 1 g 3 + g 4 + 0.9482 1 g 3 + g 5 + 0.5642 1 g 4 + g 5 + 0.5071 1 g 1 + g 2 + g 3 + g 4 + g 5 + 0.9482 = 1 g 1 , g 2 , g 3 , g 4 , g 5 0 g 2 = 1.1520 g 1 g 2 = 1.3658 g 3 g 2 = 1.2745 g 4 g 2 = 1.0137 g 5
The available interdependence degrees and the fuzzy densities were then applied to (1) and (2) to estimate the λ 0 -measure values for all the possible subsets of the attributes. Table 7 shows the complete list of λ 0 -measure values, where the estimated values were observed to comply with the boundary and monotonicity condition. The values were further verified with an online Fuzzy Measure-Choquet Integral Calculator (FM-CIC) system that was developed by Takahagi [73], which did not return any error messages, indicating the compliance of the values with the two conditions as discussed previously.
The estimated λ 0 -measure values along with the normalized performance scores in Table 4 can then be substituted into the Choquet integral operator (4) to compute the aggregated score of each website. However, in this study, the aggregated scores were identified using the FM-CIC system to minimize the computation burden. Based on the results in Table 8, A can be regarded as the website with the best degree of usefulness since it has the highest aggregated score of 0.9868. Meanwhile, Website C has garnered the second rank, followed by Website B . Interestingly, the aggregated scores of these websites are relatively close to each other, indicating a close-run situation. Conversely, the aggregated scores of the websites at the lowest two rankings with website D in the fourth rank and E in the fifth rank, are relatively far from the top three websites. It can be observed that Website E turned out to be the least favorable due to its poor performance with respect to c 2 , c 3 , and c 4 , as compared to that of other websites. Based on Equations (1) and (2), it can be concluded that the aggregated score of an alternative is mainly affected by the fuzzy densities and interdependence degrees. In this case, the maximum fuzzy density was held by c 2 (i.e., g 2 = 0.0118), whereas the highest interdependence degree belonged to the combination of c 3 and c 4 (i.e., λ 34 = 0.9482). These results indicated that each hospital should devote most of the resources to ensure the website has a proper layout design (relates to c 2 ), has complete updated content (relates to c 4 ), and should be user-friendly (relates to c 3 ). Interestingly, the results of the study agreed with that of [74]. Based on an evaluation involving the websites of a few Nigerian hospitals, Raji et al. [74] reported that the content quality, aesthetic design, and usability (i.e., ease of use) have great importance when it comes to hospital websites.

Comparison with Other Techniques

A similar evaluation was also performed by incorporating the additive weights resulted from the Shannon entropy method into a few selected MADM techniques, which are the weighted sum model (WSM) [75], weighted product model (WPM) [76], weighted aggregated sum product assessment (WASPAS) [77], technique for order preference by similarity to ideal solution (TOPSIS) [78], and also the existing unsupervised technique (PCBU). As expected, different sets of ranks were attained except for that of the PCBU technique. A slight difference in the aggregated scores was observed despite the ranks from the proposed technique and PCBU technique that are identical. For instance, the PCBU technique has underestimated the aggregated score of Website A (0.9736) as compared to that of the proposed technique (0.9876). This is because the technique utilized the Pearson correlation coefficients, which sometimes may inaccurately quantify the real interdependencies as the basis for estimating λ 0 -measure values. On the contrary, the proposed technique can overcome the issue by capturing the interdependencies with a more reliable correlation measure such as distance correlation.
The results depicted in Table 8 were further analyzed with the Spearman’s rank correlation coefficients. The coefficients stimulate a profound understanding of the degree of agreement [79,80] between the ranks generated by the proposed technique as compared to the other four techniques. The coefficients that are listed in Table 9 are higher than 0.7, which showed that the result of the proposed technique is approximately consistent with that of WSM, TOPSIS, and PCBU. It can also be concluded that the coefficients of the proposed technique are relatively inconsistent to that of the WPM and WASPAS as the computed coefficient values are lower than 0.7.
The proposed technique and PCBU have the highest mean of coefficients. The mean values provide an overall perception on the degree of agreement of the proposed technique or PCBU, as compared to other techniques, is relatively high. Thus, the ranks generated by the proposed technique or PCBU can be regarded as the conclusive ones. This condition can be attributed to the behavioral property of both techniques which managed to mathematically model the existing interdependencies between the attributes through the estimated fuzzy measure values. In contrast, WSM, WPM, WASPAS, and TOPSIS have failed to detect and capture the designated interdependencies while aggregating the scores.
The study was extended by comparing the advantages and disadvantages of the proposed unsupervised technique against the four existing estimation techniques, which were the original technique, DEMATEL-based technique, ISM-based technique, and PCBU technique. The comparison was made based on five crucial aspects that define the usability of the techniques, as shown in Table 10. The summary of the comparison is as follows.
  • As the term “supervised” suggests, all the existing supervised techniques, namely the original technique, the DEMATEL-based technique, and ISM-based technique required the input of additional data by the decision-makers for the estimation of λ 0 -measure values. On the contrary, the PCBU and the proposed unsupervised technique were completely free from such requirement. As such, both techniques may be able to minimize possible biases that are usually tied with the subjective evaluation made by individuals, and thus increases the objectivity of the estimation. However, possible errors in the estimation may present in PCBU due to the inaccurate interdependence degrees that are determined using Pearson correlation coefficients, which is supported by the difference in the aggregated scores derived with the proposed technique and PCBU (refer to Table 8).
  • The determination of fuzzy densities in the proposed technique was carried out systematically by considering the entropy weights of attributes. A similar approach was applied to other techniques except for the original technique. The original technique determines the densities by solving a system of inequalities in the absence of any additional inputs on the possible ratio of importance between the attributes.
  • Unlike the DEMATEL-based and ISM-based technique, the proposed technique, the original technique, and PCBU failed to express the actual causal relationships represented by the attributes. It was observed that the DEMATEL-based and ISM-based technique portrayed such information via digraphs, and having a better understanding of the causal relationships will be very useful in the perspective of decision-making. For instance, decision-makers can develop a more efficient strategy to improve alternative performance by shifting the focus on the causal attributes than on the effect attributes.
  • There were no arithmetic operations involved in the context of the determination of interdependence degrees for the original technique as it was achieved through direct and subjective evaluation by the decision-makers. Meanwhile, in the case of the other two supervised techniques, the interdependence degrees were determined with the help of DEMATEL or ISM method. Thus, complications arise for the calculation process with the increasing number of decision attributes. As for the proposed technique and PCBU, worse complications may even occur as these techniques determined the interdependence degree that was based on the distance correlation and Pearson correlation measures respectively. Therefore, the number of arithmetic operations required can grow rapidly even with a slight increase in both the number of decision alternatives and attributes (i.e., the size of the decision matrix) [81]. Nevertheless, the steps involved in the calculation of Pearson correlation was less complicated than that of the distance correlation. Therefore, it can be concluded that the proposed technique is computationally more demanding as compared to the other four techniques.

5. Conclusions

This paper has made two significant contributions. From the viewpoint of literature studies, this study has presented an improved unsupervised technique to estimate the complete set of λ 0 -measure values that does not require any initial data, and was able to effectively capture the interdependencies between the attributes simultaneously. The novelty of this study mainly lies in the introduction of an alternate unsupervised technique as the existing techniques either require some initial data from the decision-makers (i.e., the original technique, the DEMATEL-based technique, and the ISM-based technique), or misrepresent the actual interdependencies between the attributes (i.e., the PCBU technique). The proposed technique is certainly a crucial contribution to the existing literature as there are only four techniques to date that are available to estimate the λ 0 -measure values.
The technique was developed by integrating the concept of distance correlation and Shannon entropy weighting method into the original estimation technique. In the context of MADM, such integration was not considered in any of the past studies, including the estimation of λ 0 -measure values. In short, such integration provides a more effective alternative for decision-makers to estimate the λ 0 -measure values. The technique enables decision-makers to estimate the values with the sole utilization of the available decision matrix. It does not require any input of initial data from the decision-makers for the estimation purpose. Additionally, the technique is able to capture the exact interdependencies that are present between the attributes with the inclusion of distance correlation. The technique can be regarded as a better alternative for decision-makers that are dealing with too many decision attributes and the uncertainty that may arise on the exact interrelationships held by those attributes.
Meanwhile, from the application perspective, this paper has demonstrated the possibility of employing the proposed technique to a hospital website evaluation problem. Websites of five private specialist hospitals that are located in Sabah, Malaysia, were evaluated. With the aid of the proposed technique and Choquet integral operator, the degree of usefulness of each website were evaluated and ranked accordingly without disregarding the interdependencies that exist between the evaluation attributes. The outcome of the evaluation, may help the hospitals to implement the necessary actions to improve their websites in order to attract more local and international patients.
Nevertheless, there are few limitations on the study conducted. The first limitation is related to the proposed estimation technique. The proposed unsupervised technique failed to explicitly display the presence of causal relationships between the evaluation attributes as compared to the available supervised techniques (e.g., DEMATEL or ISM-based technique), which are able to portray such relationships through directed graphs. Therefore, future works may be required to tackle this limitation by formulating an unsupervised technique that can also deliver clear indications on the causal relationships as such indications will be very beneficial for decision-making. On the other hand, the overall fuzzy measure estimation process can become computationally demanding if the decision problem involves a large number of alternatives as the distance correlation is one of the crucial components for the developed technique. Thus, to minimize the complication associated with the calculation of distance correlation measures, interested users may utilize the related functions and packages available in RStudio or Python. In fact, future research may develop a decision-making program that is based on the proposed technique using any appropriate programming languages to enable easier and wider access. Moreover, interested researchers may investigate the possibility of integrating the idea of fuzzy signature into the proposed technique. This is because, similar to the proposed technique, the fuzzy signature is known for its ability in handling problems with interdependent features [82,83].
The second limitation of the paper relates to the hospital website evaluation problem. To be precise, the evaluation was only interested in measuring the performance of the websites based on the dimension of usefulness. There are many other dimensions, such as e-marketing strategies and reliability, that can also characterize the overall performance of a hospital website. Therefore, future work can re-evaluate the performance of the websites of the same five hospitals by adhering to a more comprehensive set of evaluation items or dimensions. As a result, a more realistic ranking of the websites can be expected, and the hospitals can make the decisions for improvement with a greater perspective. Additionally, future work can include the consideration of using different types of non-linear operators or MADM techniques such as Bonferroni mean, weighted Pythagorean fuzzy interaction power Bonferroni mean, Zhenyuan integral, interval AHP [84], AHP-ISM [85], Pythagorean fuzzy AHP [86], and spherical fuzzy TOPSIS method [87] to evaluate the websites and compare the results to obtain a definitive ranking.

Author Contributions

All authors have made significant contributions in the accomplishment of this research work: literature survey, A.R.K. and M.M.K.; development of the proposed technique, A.R.K. and M.M.K.; application of the proposed technique, A.R.K., M.M.K., and R.H.; further validation on the proposed technique, A.R.K. and M.M.K.; paper writing; A.R.K., M.M.K., and R.H. All authors have read and agreed to the published version of the manuscript.

Funding

This research was funded by the Ministry of Higher Education (Malaysia) via the FRGS-RACER grant scheme. The code of the project is RACER26-2019.

Acknowledgments

The authors would like to express his gratitude to Engku Muhammad Nazri from School of Quantitative Sciences, Universiti Utara Malaysia, who have furnished some constructive suggestions to improve this work.

Conflicts of Interest

The authors declare no conflict of interest.

Appendix A

Appendix A shows the complete calculation of the distance correlation between c 1 and c 2 . The calculation is presented according to the steps as described in Section 3. Microsoft Office EXCEL was used to enable fast computing.
Step 1—Construct the Euclidean distance matrix of attribute c 1 based on its scores associated with all the websites under consideration. Construct a similar matrix for c 2 .
  • Scores with respect to c 1 and c 2
Website/Attribute c 1 c 2
A 10.8730
B 0.33331
C 0.78430.6508
D 00
E 0.03920.0476
  • Euclidean distance matrix of c 1
Website A B C D E Row Mean
A 00.66670.21571.00000.96080.5686
B 0.666700.45100.33330.29410.3490
C 0.21570.451000.78430.74510.4392
D 1.00000.33330.784300.03920.4314
E 0.96080.29410.74510.039200.4078
Column mean0.56860.34900.43920.43140.4078Mean = 0.4392
  • Euclidean distance matrix of c 2
Website A B C D E Row Mean
A 00.12700.22220.87300.82540.4095
B 0.127000.34921.00000.95240.4857
C 0.22220.349200.65080.60320.3651
D 0.87301.00000.650800.04760.5143
E 0.82540.95240.60320.047600.4857
Column mean0.40950.48570.36510.51430.4857Mean = 0.4521
Step 2—Execute the following double-centering steps on each matrix, where at the end, the row means, column means, and overall mean of the elements in each matrix become zero: Deduct row mean from each element; in the result, deduct column mean from each element; in the result, add matrix mean to each element.
  • Double-centered matrix of c 1
Website A B C D E Row Mean
A −0.69800.1882−0.35290.43920.42350
B 0.1882−0.25880.1020−0.0078−0.02350
C −0.35290.1020−0.43920.35290.33730
D 0.4392−0.00780.3529−0.4235−0.36080
E 0.4235−0.02350.3373−0.3608−0.37650
Column mean00000Mean = 0
  • Double-centered matrix of c 2
Website A B C D E Row Mean
A −0.3670−0.3162−0.10030.40130.38220
B −0.3162−0.5194−0.04950.45210.43300
C −0.1003−0.0495−0.27810.22350.20440
D 0.40130.45210.2235−0.5765−0.50030
E 0.38220.43300.2044−0.5003−0.51940
Column mean00000Mean = 0
Step 3—Multiply the double-centered matrices elementwise and find the mean value of the elements from resulted matrix i.e., the sum of elements divided by the total number of elements. The square root of this mean value is the distance covariance of c 1 and c 2 i.e., d C o v ( c 1 , c 2 ) .
  • d C o v ( c 1 , c 2 ) = o v e r a l l   m e a n = 0.0880 = 0.2966
Website A B C D E
A 0.2562−0.05950.03540.17620.1619
B −0.05950.1344−0.0050−0.0035−0.0102
C 0.0354−0.00500.12210.07890.0689
D 0.1762−0.00350.07890.24420.1805
E 0.1619−0.01020.06890.18050.1955
Step 4—Since the distance variance of c 1 , d V a r ( c 1 )   =   d C o v ( c 1 , c 1 ) , and distance variance of c 2 ,   d V a r ( c 2 )   =   d C o v ( c 2 , c 2 ) , then these two values can be calculated by repeating step 1–3 accordingly.
  • d V a r ( c 1 ) = o v e r a l l   m e a n = 0.1157 = 0.3401
Website A B C D E
A 0.48730.03540.12460.19290.1794
B 0.03540.06700.01040.00010.0006
C 0.12460.01040.19290.12460.1137
D 0.19290.00010.12460.17940.1302
E 0.17940.00060.11370.13020.1417
  • d V a r ( c 2 ) = o v e r a l l   m e a n = 0.1356 = 0.3683
Website A B C D E
A 0.13470.10000.01010.16100.1461
B 0.10000.26970.00250.20440.1875
C 0.01010.00250.07730.04990.0418
D 0.16100.20440.04990.33240.2503
E 0.14610.18750.04180.25030.2697
Step 5—The available d C o v ( c 1 , c 2 ) , d V a r ( c 1 ) , and d V a r ( c 2 ) are appropriately substituted into (6) in order to compute d C o r ( c 1 , c 2 ) .
d C o r ( c 1 ,   c 2 ) = d C o v ( c 1 ,   c 2 ) d V a r ( c 1 ) d V a r ( c 2 ) =   0.2966 0.3401 ( 0.3683 )   = 0.8381

References

  1. Khameneh, A.Z.; Kılıçman, A.; Kilicman, A. Multi-attribute decision-making based on soft set theory: A systematic review. Soft Comput. 2018, 23, 6899–6920. [Google Scholar] [CrossRef]
  2. Mardani, A.; Nilashi, M.; Zavadskas, E.K.; Awang, S.R.; Zare, H.; Jamal, N.M. Decision Making Methods Based on Fuzzy Aggregation Operators: Three Decades Review from 1986 to 2017. Int. J. Inf. Technol. Decis. Mak. 2018, 17, 391–466. [Google Scholar] [CrossRef]
  3. Qin, Y.; Qi, Q.; Scott, P.J.; Jiang, X. Multiple criteria decision making based on weighted Archimedean power partitioned Bonferroni aggregation operators of generalised orthopair membership grades. Soft Comput. 2020, 24, 1–27. [Google Scholar] [CrossRef] [Green Version]
  4. Krishnan, A.R.; Kasim, M.M.; Abu Bakar, E.M.N.E. A Short Survey on the Usage of Choquet Integral and its Associated Fuzzy Measure in Multiple Attribute Analysis. Procedia Comput. Sci. 2015, 59, 427–434. [Google Scholar] [CrossRef] [Green Version]
  5. Marichal, J.-L. An axiomatic approach of the discrete Choquet integral as a tool to aggregate interacting criteria. IEEE Trans. Fuzzy Syst. 2000, 8, 800–807. [Google Scholar] [CrossRef] [Green Version]
  6. Hu, Y.-C.; Chen, H.-C. Choquet integral-based hierarchical networks for evaluating customer service perceptions on fast food stores. Expert Syst. Appl. 2010, 37, 7880–7887. [Google Scholar] [CrossRef]
  7. Bonferroni, C. Sulle medie multiple di potenze. Boll. dell’Unione Mat. Ital. 1950, 5, 267–270. [Google Scholar]
  8. Wang, L.; Li, N. Pythagorean fuzzy interaction power Bonferroni mean aggregation operators in multiple attribute decision making. Int. J. Intell. Syst. 2019, 35, 150–183. [Google Scholar] [CrossRef]
  9. Wang, Z.; Leung, K.-S.; Wong, M.-L.; Fang, J. A new type of nonlinear integrals and the computational algorithm. Fuzzy Sets Syst. 2000, 112, 223–231. [Google Scholar] [CrossRef]
  10. Mu, Z.; Zeng, S. Some novel intuitionistic fuzzy information fusion methods in decision making with interaction among attributes. Soft Comput. 2018, 23, 10439–10448. [Google Scholar] [CrossRef]
  11. Choquet, G. Theory of capacities. Ann. de l’Institut Fourier. 1954, 5, 131–295. [Google Scholar] [CrossRef] [Green Version]
  12. Abdullah, L.; Zulkifli, N.; Liao, H.; Herrera-Viedma, E.; Al-Barakati, A. An interval-valued intuitionistic fuzzy DEMATEL method combined with Choquet integral for sustainable solid waste management. Eng. Appl. Artif. Intell. 2019, 82, 207–215. [Google Scholar] [CrossRef]
  13. Corrente, S.; Greco, S.; Ishizaka, A. Combining analytical hierarchy process and Choquet integral within non-additive robust ordinal regression. Omega 2016, 61, 2–18. [Google Scholar] [CrossRef] [Green Version]
  14. Beliakov, G.; Divakov, D. On representation of fuzzy measures for learning Choquet and Sugeno integrals. Knowl. Based Syst. 2020, 189, 105134. [Google Scholar] [CrossRef]
  15. Pasi, G.; Viviani, M.; Carton, A. A Multi-Criteria Decision Making approach based on the Choquet integral for assessing the credibility of User-Generated Content. Inf. Sci. 2019, 503, 574–588. [Google Scholar] [CrossRef]
  16. Larbani, M.; Huang, C.Y.; Tzeng, G.H. A novel method for fuzzy measure identification. Int. J. Fuzzy Syst. 2011, 13, 24–34. [Google Scholar]
  17. Krishnan, A.R.; Aqilah, S.N.; Kasim, M.M.; Nazri, E.M.; Char, A.K. A revised procedure to identify λ 0-measure values for applying Choquet integral in solving multi-attribute decision problems. OPSEARCH 2017, 54, 637–650. [Google Scholar] [CrossRef]
  18. Krishnan, A.R.; Ab Wahab, S.N.A.; Kasim, M.M.; Abu Bakar, E.M.N.E. An alternate method to determine λ0-measure values prior to applying Choquet integral in a multi-attribute decision making environment. Decis. Sci. Lett. 2019, 8, 193–210. [Google Scholar] [CrossRef]
  19. Rowley, H.V.; Geschke, A.; Lenzen, M. A practical approach for estimating weights of interacting criteria from profile sets. Fuzzy Sets Syst. 2015, 272, 70–88. [Google Scholar] [CrossRef]
  20. Krishnan, A.R.; Hamid, R.; Kasim, M.M. An Unsupervised Technique to Estimate λ0-Fuzzy Measure Values and Its Application to Multi-criteria Decision Making. In Proceedings of the 2020 IEEE 7th International Conference on Industrial Engineering and Applications (ICIEA), Bangkok, Thailand, 16–21 April 2020. [Google Scholar]
  21. Kosorok, M.R. Discussion of: Brownian distance covariance. Ann. Appl. Stat. 2009, 3, 1270–1278. [Google Scholar] [CrossRef] [Green Version]
  22. Székely, G.J.; Rizzo, M.L.; Bakirov, N.K. Measuring and testing dependence by correlation of distances. Ann. Stat. 2007, 35, 2769–2794. [Google Scholar] [CrossRef]
  23. Krishnan, A.R.; Kasim, M.M.; Abu Bakar, E.M.N.E. Application of Choquet integral in solving multi-attribute decision making problems. In International Conference on Graphic and Image Processing (ICGIP 2011); SPIE: Bellingham, WA, USA, 2011; Volume 8285, p. 82853L. [Google Scholar]
  24. Mohd, W.R.W.; Abdullah, L. Choquet integral with respect to maximized L-measure and delta-measure. In AIP Conference Proceedings; American Institute of Physics: College Park, MD, USA, 2017; Volume 1870. [Google Scholar]
  25. Murillo, J.; Guillaume, S.; Bulacio, P. k-maxitive fuzzy measures: A scalable approach to model interactions. Fuzzy Sets Syst. 2017, 324, 33–48. [Google Scholar] [CrossRef] [Green Version]
  26. Kojadinovic, I. Estimation of the weights of interacting criteria from the set of profiles by means of information-theoretic functionals. Eur. J. Oper. Res. 2004, 155, 741–751. [Google Scholar] [CrossRef]
  27. Sugeno, M. Theory of Fuzzy Integrals and Its Applications; Tokyo Institute of Technology: Meguro City, Tokyo, Japan, 1974. [Google Scholar]
  28. Khan, M.S.A. The Pythagorean fuzzy Einstein Choquet integral operators and their application in group decision making. Comput. Appl. Math. 2019, 38, 128. [Google Scholar] [CrossRef]
  29. Grabisch, M. k-order additive discrete fuzzy measures and their representation. Fuzzy Sets Syst. 1997, 92, 167–189. [Google Scholar] [CrossRef]
  30. Wu, J.Z.; Zhang, Q. 2-Order Additive Fuzzy Measures Identification Method Based on Maximum Entropy Principle. Fuzzy Optim. Decis. Mak. 2010, 9, 435–453. [Google Scholar] [CrossRef]
  31. Zhang, L.; Zhou, P.; Zhou, D. A non-additive multiple criteria analysis method for evaluation of airline service quality. J. Air Transp. Manag. 2015, 47, 154–161. [Google Scholar] [CrossRef]
  32. Lee, K.M.; Leekwang, H. Identification of λ-fuzzy measure by genetic algorithms. Fuzzy Sets Syst. 1995, 75, 301–309. [Google Scholar] [CrossRef]
  33. Takahagi, E. On Identification Methods of λ-Fuzzy Measures using Weights and λ. J. Jpn. Soc. Fuzzy Theory Syst. 2000, 12, 665–676. [Google Scholar] [CrossRef] [Green Version]
  34. Chen, T.-Y.; Wang, J.-C. Identification of -fuzzy measures using sampling design and genetic algorithms. Fuzzy Sets Syst. 2001, 123, 321–341. [Google Scholar] [CrossRef]
  35. Wang, J.-C.; Chen, T.-Y. Experimental analysis of λ-fuzzy measure identification by evolutionary algorithms. Int. J. Fuzzy Syst. 2005, 7, 1–9. [Google Scholar]
  36. Feng, C.-M.; Wu, P.-J.; Chia, K.-C. A hybrid fuzzy integral decision-making model for locating manufacturing centers in China: A case study. Eur. J. Oper. Res. 2010, 200, 63–73. [Google Scholar] [CrossRef]
  37. Krishnan, A.R. A Multi-Attribute Decision Making Procedure Using Fuzzy Numbers and Hybrid Aggregators. Ph.D. Thesis, Universiti Utara Malaysia, Changlun, Malaysia, 2014. [Google Scholar]
  38. Murofushi, T.; Sugeno, M. A theory of fuzzy measures: Representations, the Choquet integral, and null sets. J. Math. Anal. Appl. 1991, 159, 532–549. [Google Scholar] [CrossRef] [Green Version]
  39. Jin, L.; Mesiar, R.; Yager, R.R. Derived fuzzy measures and derived Choquet integrals with some properties. IEEE Trans. Fuzzy Syst. 2020, 1. [Google Scholar] [CrossRef]
  40. Chang, J.-P.; Chen, Z.-S.; Xiong, S.-H.; Zhang, J.; Chin, K.-S. Intuitionistic Fuzzy Multiple Criteria Group Decision Making: A Consolidated Model With Application to Emergency Plan Selection. IEEE Access 2019, 7, 41958–41980. [Google Scholar] [CrossRef]
  41. Wang, X.-Z.; Wang, X.-J. A new methodology for determining fuzzy densities in the fusion model based on fuzzy integral. In Proceedings of the 2004 International Conference on Machine Learning and Cybernetics (IEEE Cat. No.04EX826), Shanghai, China, 26–29 August 2004; Volume 4, pp. 2028–2031. [Google Scholar]
  42. Grabisch, M. The application of fuzzy integrals in multicriteria decision making. Eur. J. Oper. Res. 1996, 89, 445–456. [Google Scholar] [CrossRef]
  43. Szekely, G.J.; Rizzo, M.L. On the uniqueness of distance covariance. Stat. Probab. Lett. 2012, 82, 2278–2282. [Google Scholar] [CrossRef]
  44. Jahan, A.; Edwards, K. A state-of-the-art survey on the influence of normalization techniques in ranking: Improving the materials selection process in engineering design. Mater. Des. 2015, 65, 335–342. [Google Scholar] [CrossRef]
  45. Vafaei, N.; Ribeiro, R.A.; Camarinha-Matos, L. Normalization Techniques for Multi-Criteria Decision Making: Analytical Hierarchy Process Case Study. In IFIP Advances in Information and Communication Technology; Springer Nature: Cham, Switzerland, 2016; Volume 470, pp. 261–269. [Google Scholar]
  46. Weaver, K.F.; Morales, V.; Dunn, S.L.; Godde, K.; Weaver, P.F. An Introduction to Statistical Analysis in Research. In An Introduction to Statistical Analysis in Research; Wiley: Hoboken, NJ, USA, 2017; pp. 435–471. [Google Scholar]
  47. Edelmann, D.; Fokianos, K.; Pitsillou, M. An Updated Literature Review of Distance Correlation and Its Applications to Time Series. Int. Stat. Rev. 2018, 87, 237–262. [Google Scholar] [CrossRef] [Green Version]
  48. Shen, C.; Priebe, C.E.; Vogelstein, J.T. From Distance Correlation to Multiscale Graph Correlation. J. Am. Stat. Assoc. 2019, 115, 280–291. [Google Scholar] [CrossRef]
  49. Understanding Distance Correlation Computations. Available online: https://stats.stackexchange.com/q/183930 (accessed on 20 January 2020).
  50. Chaudhuri, A.; Hu, W. A fast algorithm for computing distance correlation. Comput. Stat. Data Anal. 2019, 135, 15–24. [Google Scholar] [CrossRef] [Green Version]
  51. Shannon, C.E. A Mathematical Theory of Communication. Bell Syst. Tech. J. 1948, 27, 379–423. [Google Scholar] [CrossRef] [Green Version]
  52. Lee, H.-C.; Chang, C.-T. Comparative analysis of MCDM methods for ranking renewable energy sources in Taiwan. Renew. Sustain. Energy Rev. 2018, 92, 883–896. [Google Scholar] [CrossRef]
  53. Fu, Y.; Wang, M.; Lai, K.K. A Modified Nature Publishing Index via Shannon Entropy. Discret. Dyn. Nat. Soc. 2015. [Google Scholar] [CrossRef]
  54. Song, Y.; Peng, Y. A MCDM-Based Evaluation Approach for Imbalanced Classification Methods in Financial Risk Prediction. IEEE Access 2019, 7, 84897–84906. [Google Scholar] [CrossRef]
  55. Zhu, Y.; Tian, D.; Yan, F. Effectiveness of Entropy Weight Method in Decision-Making. Math. Probl. Eng. 2020. [Google Scholar] [CrossRef]
  56. Dehdasht, G.; Ferwati, M.S.; Zin, R.M.; Abidin, N.Z. A hybrid approach using entropy and TOPSIS to select key drivers for a successful and sustainable lean construction implementation. PLoS ONE 2020, 15, e0228746. [Google Scholar] [CrossRef]
  57. Huerta, T.R.; Hefner, J.L.; Ford, E.W.; McAlearney, A.S.; Menachemi, N.; Kazley, A.; Vagelatos, A. Hospital Website Rankings in the United States: Expanding Benchmarks and Standards for Effective Consumer Engagement. J. Med. Internet Res. 2014, 16, e64. [Google Scholar] [CrossRef] [Green Version]
  58. Dickinger, A.; Stangl, B. Website performance and behavioral consequences: A formative measurement approach. J. Bus. Res. 2013, 66, 771–777. [Google Scholar] [CrossRef]
  59. Abou-Shouk, M.A.; Khalifa, G.S. The influence of website quality dimensions on e-purchasing behaviour and e-loyalty: A comparative study of Egyptian travel agents and hotels. J. Travel Tour. Mark. 2016, 34, 608–623. [Google Scholar] [CrossRef]
  60. Stringam, B.B.; Gerdes, J. Service gap in hotel website load performance. Int. Hosp. Rev. 2019, 33, 16–29. [Google Scholar] [CrossRef]
  61. McKinney, V.; Yoon, K.; Zahedi, F. “Mariam” The Measurement of Web-Customer Satisfaction: An Expectation and Disconfirmation Approach. Inf. Syst. Res. 2002, 13, 296–315. [Google Scholar] [CrossRef]
  62. Wątróbski, J.; Karczmarczyk, A.; Jankowski, J.; Ziemba, P.; Wolski, W. Hierarchical Representation of Website Evaluation Model Using Survey and Perceptual Based Criteria. In Lecture Notes in Business Information Processing; Springer: Cham, Switzerland, 2018; Volume 311, pp. 229–248. [Google Scholar]
  63. Perçin, S. A combined fuzzy multicriteria decision-making approach for evaluating hospital website quality. J. Multi. Criteria Decis. Anal. 2019, 26, 129–144. [Google Scholar] [CrossRef]
  64. Lajiun, J. Sabah medical tourism ‘much cheaper’. Borneo Post Online, 14 July 2019. [Google Scholar]
  65. Qi, S.; Ip, C.; Leung, R.; Law, R.; Law, R. A New Framework on Website Evaluation. In Proceedings of the 2010 International Conference on E-Business and E-Government, Guangzhou, China, 7–9 May 2010; pp. 78–81. [Google Scholar]
  66. Kumar, A.; Dash, M.K. Using Fuzzy Delphi and Generalized Fuzzy TOPSIS to Evaluate Technological Service Flexibility Dimensions of Internet Malls. Glob. J. Flex. Syst. Manag. 2017, 18, 153–161. [Google Scholar] [CrossRef]
  67. Ahn, T.; Ryu, S.; Han, I. The impact of Web quality and playfulness on user acceptance of online retailing. Inf. Manag. 2007, 44, 263–275. [Google Scholar] [CrossRef]
  68. Pandey, D.; Nagpal, R.; Mehrotra, D. Navigational Complexity Metrics of a Website. In Advances in Intelligent Systems and Computing; Springer: Berlin, Germany, 2018; Volume 731, pp. 433–440. [Google Scholar]
  69. Teng, P.S.; Cai, D.; Walker, V.; Cassidy, T. A study of websites’ layout and user impressions from the perspective of college students. Bull. Jpn. Soc. Sci. Des. 2015, 61, 19–28. [Google Scholar]
  70. Thielsch, M.T.; Hirschfeld, G. Facets of Website Content. Hum. Comput. Interact. 2018, 34, 279–327. [Google Scholar] [CrossRef] [Green Version]
  71. Ismailova, R.; Inal, Y. Accessibility evaluation of top university websites: A comparative study of Kyrgyzstan, Azerbaijan, Kazakhstan and Turkey. Univers. Access Inf. Soc. 2017, 17, 437–445. [Google Scholar] [CrossRef]
  72. Viscomi, R.; Davies, A.; Duran, M. Using WebPageTest: Web Performance Testing for Novices and Power Users; O’Reilly Media, Inc.: Sebastopol, CA, USA, 2016. [Google Scholar]
  73. Analysis, S. Fuzzy Measure-Choquet Integral Calculation System (λ Fuzzy Measure and Sensitivity Analysis). Available online: http://www.isc.senshu-u.ac.jp/~thc0456/Efuzzyweb/mant2/mant2.html (accessed on 8 February 2020).
  74. Raji, S.O.; Mahmud, M.; Tap, A.O.M.; Abubakar, A. Usability Evaluation of Hospital Websites in Nigeria: What Affects End Users’ Preferences? In Communications in Computer and Information Science; Springer: Berlin, Germany, 2014; Volume 435, Part I; pp. 430–434. [Google Scholar]
  75. MacCrimmon, K.R. Decision Making Among Multiple–Attribute Alternatives: A Survey and Consolidated Approach. In Research Memoranda; RAND Corporation: Santa Monica, CA, USA, 1968; Volume 189. [Google Scholar]
  76. Sears, G.W.; Miller, D.W.; Starr, M.K. Executive decisions and operations research. J. Oper. Res. Soc. 1962, 13. [Google Scholar] [CrossRef]
  77. Zavadskas, E.K.; Turskis, Z.; Antucheviciene, J. Optimization of Weighted Aggregated Sum Product Assessment. Elektron. Ir Elektrotechnika 2012, 122, 3–6. [Google Scholar] [CrossRef]
  78. Hwang, C.-L.; Yoon, K. Multiple Attribute Decision Making: Methods and Applications; Springer: Berlin, Germany, 1981; Volume 186. [Google Scholar]
  79. Mathew, M.; Sahu, S.; Upadhyay, A.K. Effect of normalization techniques in robot selection using weighted aggregated sum product assessment. Int. J. Innov. Res. Adv. Stud. 2017, 4, 59–63. [Google Scholar]
  80. Yalçın, N.; Pehlivan, N.Y. Application of the Fuzzy CODAS Method Based on Fuzzy Envelopes for Hesitant Fuzzy Linguistic Term Sets: A Case Study on a Personnel Selection Problem. Symmetry 2019, 11, 493. [Google Scholar] [CrossRef] [Green Version]
  81. Huo, X.; Székely, G.J. Fast Computing for Distance Covariance. Technometrics 2016, 58, 435–447. [Google Scholar] [CrossRef] [Green Version]
  82. Yuhana, U.L.; Fanani, N.Z.; Yuniarno, E.M.; Rochimah, S.; Koczy, L.T.; Purnomo, M.H. Combining Fuzzy Signature and Rough Sets Approach for Predicting the Minimum Passing Level of Competency Achievement. Int. J. Artif. Intell. 2020, 18, 1. [Google Scholar]
  83. Wong, K.W.; Gedeon, T.; Kóczy, L.T. Fuzzy Signature and Cognitive Modelling for Complex Decision Model. Adv. Intell. Soft Comput. 2007, 42, 380–389. [Google Scholar] [CrossRef]
  84. Ghorbanzadeh, O.; Moslem, S.; Blaschke, T.; Duleba, S. Sustainable Urban Transport Planning Considering Different Stakeholder Groups by an Interval-AHP Decision Support Model. Sustainability 2018, 11, 9. [Google Scholar] [CrossRef] [Green Version]
  85. Duleba, S. An ahp-ism approach for considering public preferences in a public transport development decision. Transport 2019, 34, 662–671. [Google Scholar] [CrossRef] [Green Version]
  86. Ilbahar, E.; Karaşan, A.; Cebi, S.; Kahraman, C. A novel approach to risk assessment for occupational health and safety using Pythagorean fuzzy AHP & fuzzy inference system. Saf. Sci. 2018, 103, 124–136. [Google Scholar] [CrossRef]
  87. Gündoğdu, F.K.; Kahraman, C. Spherical fuzzy sets and spherical fuzzy TOPSIS method. J. Intell. Fuzzy Syst. 2019, 36, 337–352. [Google Scholar] [CrossRef]
Publisher’s Note: MDPI stays neutral with regard to jurisdictional claims in published maps and institutional affiliations.
Figure 1. Quantity of initial data required vs. no. of attributes.
Symmetry 12 01708 g001
Figure 2. Different stages of the development of the proposed technique.
Symmetry 12 01708 g002
Figure 3. A section of the questionnaire. The actual name of the hospitals and the website addresses in Figure 3 were altered due to the confidentiality issue.
Symmetry 12 01708 g003
Figure 4. The WebPageTest results for accessibility.
Symmetry 12 01708 g004
Table 1. Comparison of the existing supervised estimation techniques.
TechniqueOriginal TechniqueDEMATEL
Based-Technique
ISM
Based-Technique
Type of initial data requiredInterdependence degree of each pair of attributes-Direct influence between every two attributes
-Interdependence degree of each pair of attributes
-Contextual relationship between every two attributes
-Interdependence degree of each pair of attributes
Quantity of initial data required n ( n 1 ) / 2 3 n ( n 1 ) / 2 2 n ( n 1 ) / 2
Table 2. Evaluation attributes of website usefulness.
No.AttributeDescription
1Website navigability [68]The visitors of the website can surf and leave every different page of the website with minimal hassle. The website also provides a clear site map (i.e., list of pages on the website) and efficient keyword search engine that allows the visitors to conveniently search for the desired subject.
2Website layout design [69]The website has a simple but attractive and well-organized layout structure.
3Ease of use [58]Even a new visitor can effortlessly learn to use or operate the website.
4Website content [70]The website provides useful, accurate, up-to-date, and easy-to-understand information to visitors.
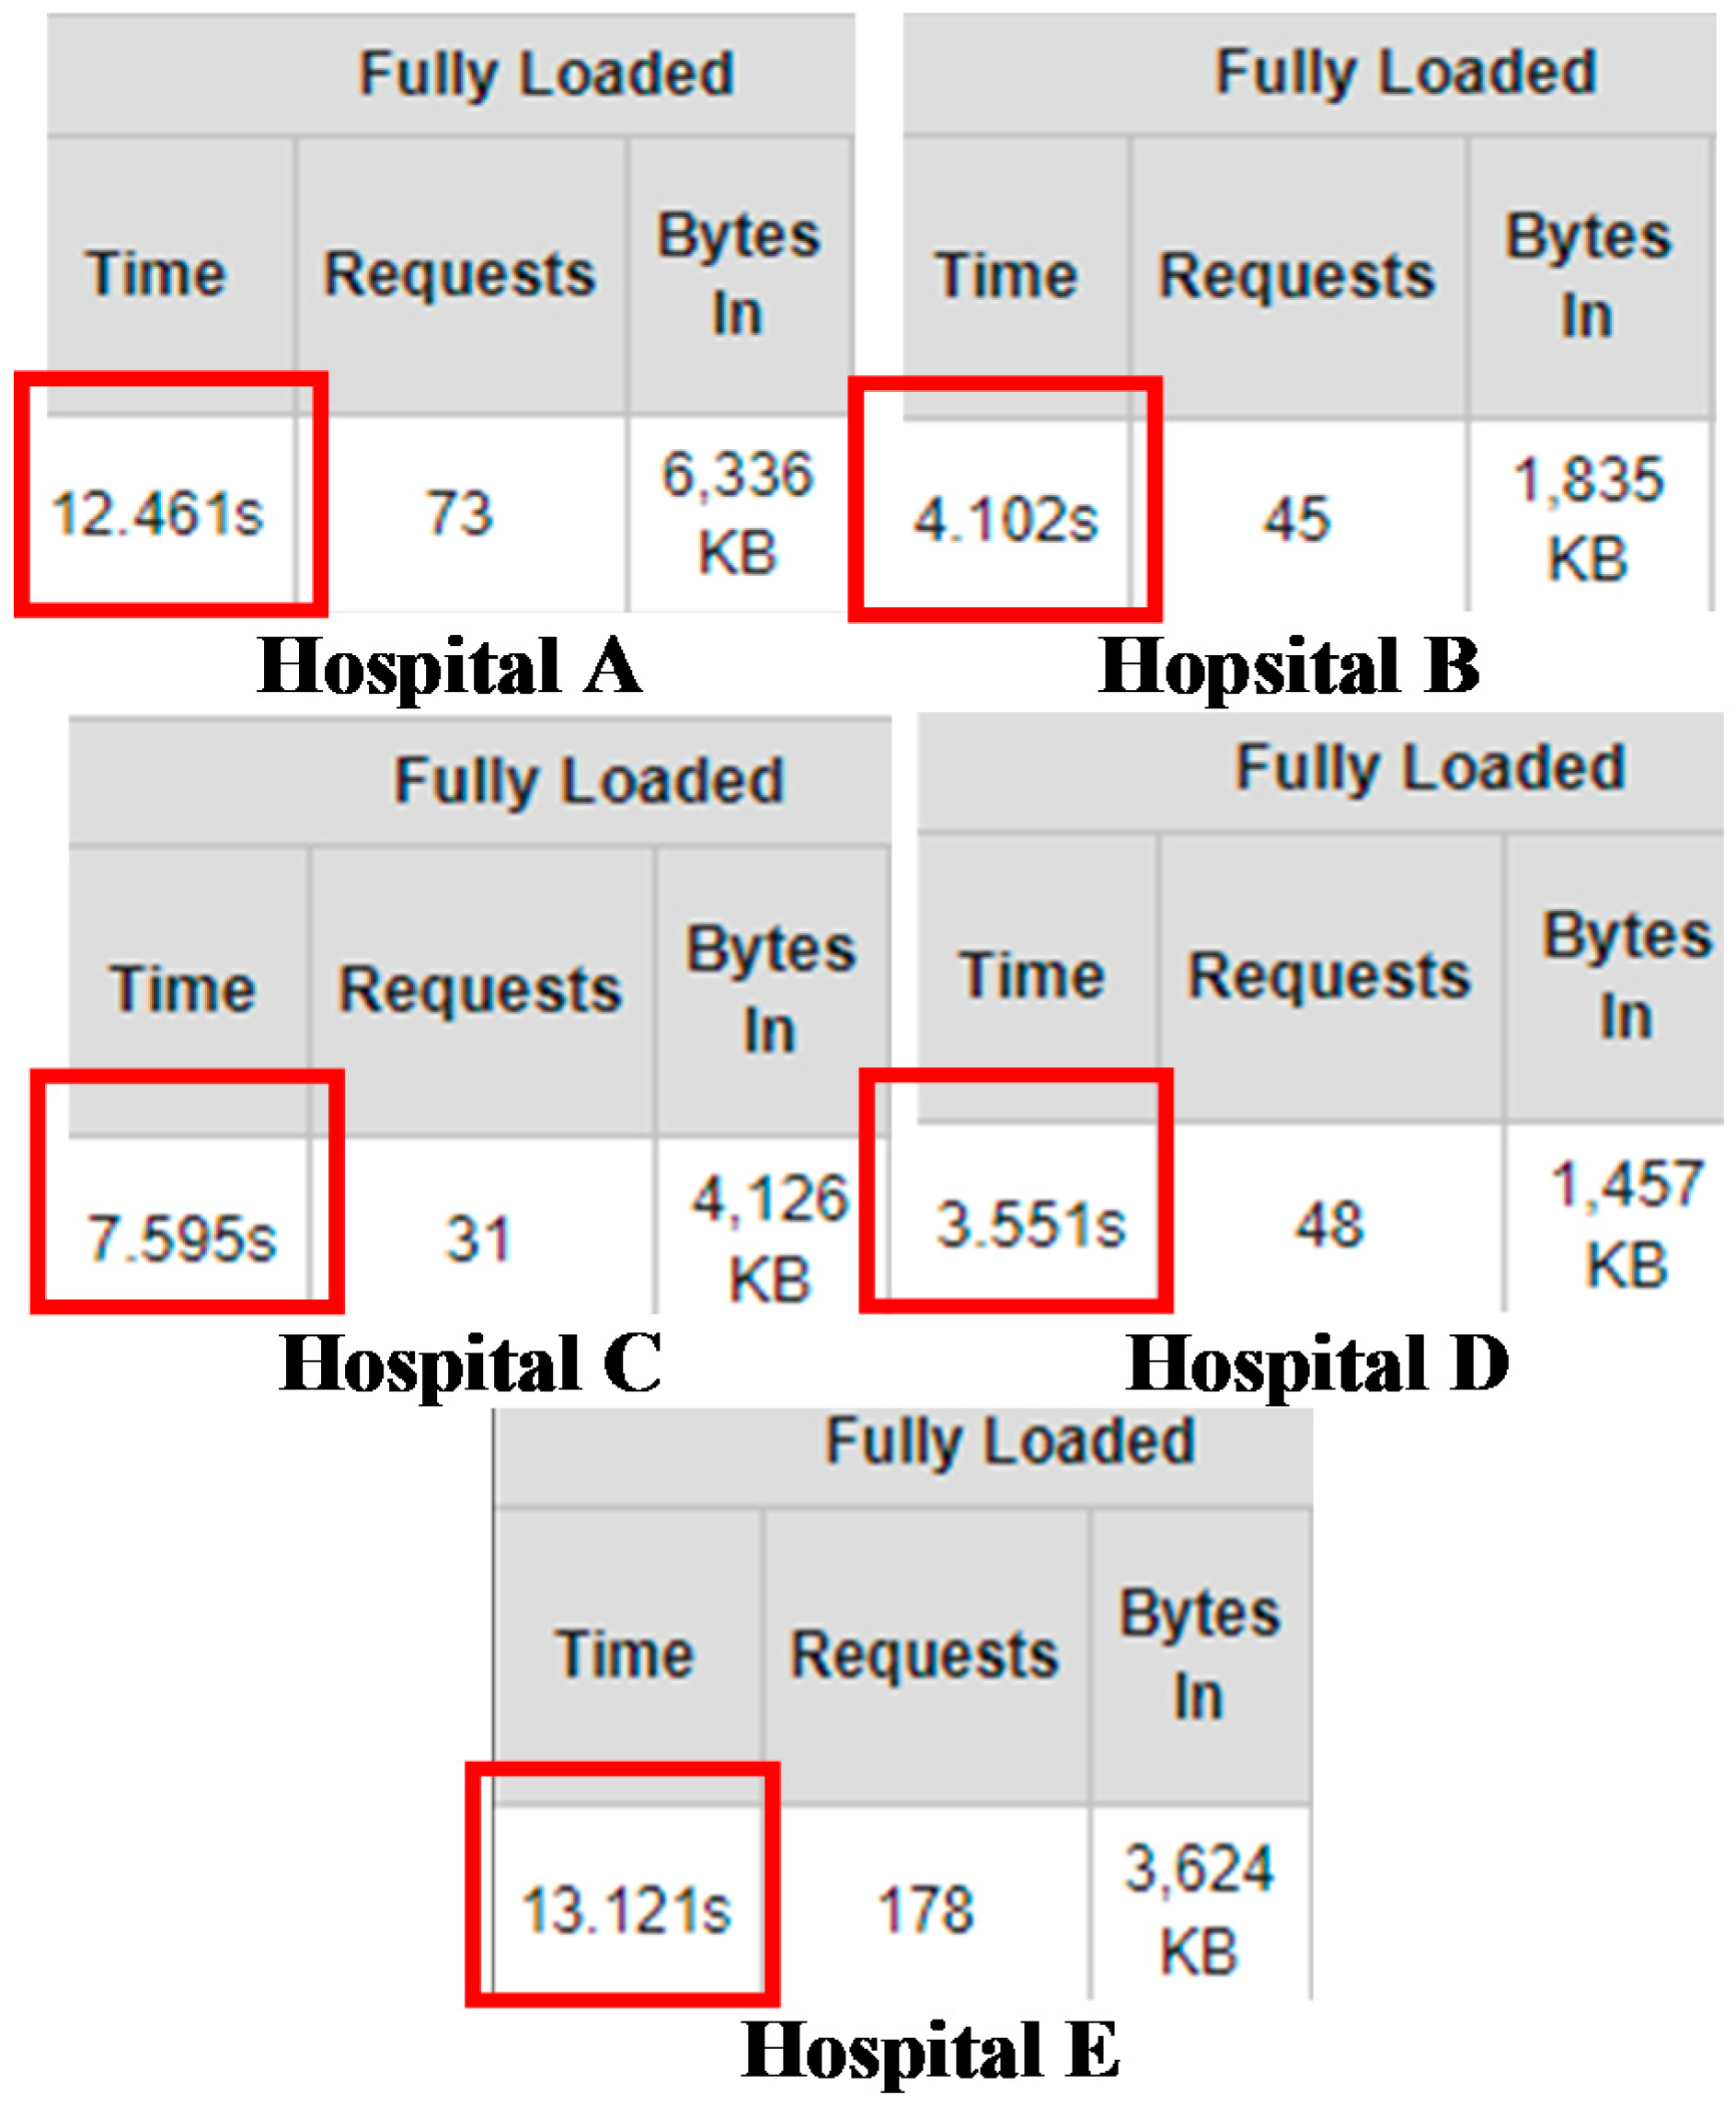
5Accessibility [71]There are few indicators for accessibility, but for this study, accessibility is measured based on the download speed of the web page.
Table 3. Decision matrix (websites vs. attributes).
Decision Matrix c 1 c 2 c 3 c 4 c 5
A 5.24515.30395.23535.352912.4610
B 4.91185.38245.02944.95104.1020
C 5.13735.16675.10784.98047.5950
D 4.74514.76474.82354.63733.5510
E 4.76474.79414.63734.647113.1210
Table 4. Normalized decision matrix.
Normalized Decision Matrix c 1 c 2 c 3 c 4 c 5
A 10.8730110.0690
B 0.333310.65570.43840.9424
C 0.78430.65080.78690.47950.5774
D 000.311501
E 0.03920.047600.01370
Table 5. Distance correlation measures and interdependence degrees.
Attributes   ( c j , c j ) d C o v ( c j , c j ) d V a r ( c j ) d V a r ( c j ) d C o r   ( c j , c j )     @   λ j j
c 1 , c 2 0.29660.34010.36830.8381
c 1 , c 3 0.28730.34010.27820.9340
c 1 , c 4 0.29540.34010.29640.9305
c 1 , c 5 0.18350.34010.37200.5158
c 2 , c 3 0.29290.36830.27820.9152
c 2 , c 4 0.29990.36830.29640.9076
c 2 , c 5 0.12680.36830.37200.3426
c 3 , c 4 0.27230.27820.29640.9482
c 3 , c 5 0.18150.27820.37200.5642
c 4 , c 5 0.16840.29640.37200.5071
Table 6. Entropy and objective weight of each attribute.
Attribute c 1 c 2 c 3 c 4 c 5
e j 0.42480.33740.51490.48010.3463
w j 0.19860.22880.16750.17950.2257
Table 7. The estimated λ 0 -measure values.
Subset
Value ,   g
Subset
Value ,   g
{Ø}0{ c 5 }0.0117
{ c 1 } 0.0103{ c 1 ,   c 5 }0.5378
{ c 2 }0.0118{ c 2 ,   c 5 }0.3661
* { c 1 ,   c 2 }0.8602{ c 1 ,   c 2 ,   c 5 }0.8719
{ c 3 }0.0087{ c 3 ,   c 5 }0.5846
{ c 1 ,   c 3 }0.9529{ c 1 ,     c 3 ,   c 5 }0.9646
{ c 2 ,   c 3 }0.9358{ c 2 ,     c 3 ,   c 5 }0.9474
** { c 1 ,   c 2 ,   c 3 }0.9648{ c 1 , c 2 ,     c 3 ,   c 5 }0.9765
{ c 4 }0.0093{ c 4 ,   c 5 }0.0210
{ c 1 ,   c 4 }0.9501{ c 1 ,   c 4 ,   c 5 }0.9618
{ c 2 ,   c 4 }0.9287{ c 2 ,   c 4 ,   c 5 }0.9404
{ c 1 ,   c 2 ,   c 4 }0.9619{ c 1 ,   c 2 ,   c 4 ,   c 5 }0.9736
{ c 3 ,   c 4 }0.9662{ c 3 ,   c 4 ,   c 5 }0.9779
{ c 1 ,   c 3 ,   c 4 }0.9765{ c 1 ,   c 3 ,   c 4 ,   c 5 }0.9882
{ c 2 ,   c 3 ,   c 4 }0.9780{ c 2 ,   c 3 ,   c 4 ,   c 5 }0.9897
{ c 1 ,   c 2 ,   c 3 ,   c 4 }0.9883{ c 1 ,   c 2 ,   c 3 ,   c 4 ,   c 5 }1
Sample calculations: * { c 1 ,   c 2 } = g 1 + g 2 + λ 12 = 0.0103 + 0.0118 + 0.8381 = 0.8602; ** { c 1 ,   c 2 ,   c 3 } = g 1 + g 2 + g 3 + max ( λ 12 , λ 13 , λ 23 ) = 0.0103 + 0.0118 + 0.0087 + max (0.8381, 0.9340, 0.9152) = 0.9648.
Table 8. The ranking of websites.
WebsiteProposed TechniqueWSMWPMWASPASTOPSISPCBU
A 1
(0.9876)
1
(0.7608)
3
(0.5302)
3
(0.6456)
1
(0.9286)
1
(0.9736)
B 3
(0.7489)
2
(0.6962)
2
(0.6374)
1
(0.6668)
3
(0.4982)
3
(0.6549)
C 2
(0.7732)
3
(0.6529)
1
(0.6424)
2
(0.6476)
2
(0.6017)
2
(0.7674)
D 4
(0.1901)
4
(0.2779)
4
(0)
4
(0.1389)
5
(0.1073)
4
(0.0403)
E 5
(0.0352)
5
(0.0211)
4
(0)
5
(0.0106)
4
(0.3740)
5
(0.0325)
Note: ( ) indicates the aggregated score of each website.
Table 9. Spearman’s rank correlation coefficients.
Proposed TechniqueWSMWPMWASPASTOPSISPCBU
Proposed technique10.90000.65000.60000.90001.0000
WSM0.900010.55000.70000.80000.9000
WPM0.65000.550010.85000.65000.6500
WASPAS0.60000.70000.850010.50000.6000
TOPSIS0.90000.80000.65000.500010.9000
PCBU1.00000.90000.65000.60.91
Mean0.84170.80830.72500.70830.79170.8417
Table 10. The ranking of websites.
Does the Technique Require Additional Data from the Decision-Makers?Possible Bias/Error in the Estimated ValuesAre the Fuzzy Densities Identified with Extra Inputs?Does the Technique Explicitly Portray the Causal Relationships Held by the Attributes?The Calculation Involved in Determining Interdependence Degrees
Original technique [16]Yes
(interdependence degree of each pair of attributes)
YesNoNoNo calculation involved, i.e., direct estimation by decision-makers
DEMATEL-based technique [17]Yes
(The direct influence between every two attributes and
interdependence degree of each pair of attributes)
YesYes (based on the prominence values determined via DEMATEL)Yes (via diagraphs)Influenced by no. of decision attributes
ISM-based technique [18]Yes
(Contextual relationship between every two attributes and interdependence degree of each pair of attributes)
YesYes (based on the driving and dependence power determined via ISM)Yes (via diagraphs)Influenced by no. of decision attributes
PCBUNoYes* Yes (based on the objective weights derived via CRITIC)NoInfluenced by both the decision alternatives and attributes (i.e., the size of decision matrix)
Proposed unsupervised technique* No* No* Yes (based on the objective weights derived via Shannon entropy)** No** Influenced by both the decision alternatives and attributes (i.e., the size of decision matrix)
Note: * and ** indicates the advantage and disadvantage of the proposed technique, respectively.

