1. Motivation
Curved bridges are widely applied in road constructions in dense city and mountainous areas, because they can adapt to the change of direction and provide smooth transition at turns and ramps. However, due to the influence of curvature, curved bridges display strong space effects and irregularity—in addition to the evenly distribution of mass and stiffness, the “regularity” that earthquake engineering emphasizes on is actually the independent transverse and longitudinal behaviors. The characteristics of the two directions of bridges are significantly different. Independent motion mode and symmetry are important to engineering structures because they result in linearity and balanced performance, such that structural response changes are commeasurable with load changes, and thus are predictable and controllable.
However, curved bridges do not have obvious transverse and longitudinal directions. They are not a closed loop either. Their responses are strongly coupled, internal forces and deformations change abruptly point by point, and are vulnerable to environment change. In addition to the bending moment and shear force, there are also the effect of larger torsion moment and warping moment. Minor change in geometry, physics, and excitations would break the regularity a lot, lead to large responses, result in unexpected damage, and make traditional seismic design procedures invalid.
Examining the eccentricity effects on the curved bridge based on unbiased standards is not easy, which requires engineering judgments, proper mathematical model, new indices, and strategic design, etc. This paper would study this civil engineering issue in view of control engineering.
2. Introduction
The seismic response of curved bridges is affected by different sources of eccentricities, including curvature (or radius), bearing stiffness, ground motion (GM) directions, etc. Seo and Linzell [
1] performed a parametric analysis on the nonlinear seismic response of horizontally curved steel I-girder bridges. They found that number of spans and radius affected response quantities of these bridges more than other parameters; Pahlavan et al. [
2] investigated seismic vulnerability of horizontally curved reinforced concrete box-girder bridges with seat-type abutments using a probabilistic approach and found that the curvature of the deck adversely affects seismic vulnerability of this type of bridge. Kou et al. [
3] studied the effects of warping, non-coincidence of the shear center and the centroid of the section, flexibility of piers, and radius of curvature on free vibration of curved thin-walled girder bridges. They found that, natural frequencies of curved bridges are affected significantly by the flexibility of piers and the radius (or curvature); Studies of Ijima et al. [
4] showed that high stiffness of rubber bearings and a small distance between stiffness and mass centers were effective in reducing the displacement of the deck due to seismic pounding. Zhao [
5] studied the response of curved bridges to the longitudinal and transversal GMs and found that though maximum displacements and internal forces of the curved bridges still occurred in parallel with the GM directions, different degrees of coupling were also generated, and peak responses did not necessarily coincide with the GM peak with some phase lags.
So, this study brought some new points and made some creativities, as in the following:
To learn the eccentricity influence on curved bridges, this study carefully designed six eccentricity cases based on a known practical bridge by fixing the curve length while changing radius and bearing conditions, and then excite them with varied ground motions: single earthquake, two earthquakes (perpendicular pair), and change from 0° to180°.
To account for different failure modes of curved bridges, it is found that, in either super-or sub-structure failures, the rigidity of the deck plays a critical role. As observed during earthquakes, with rigid deck, bridges are susceptible to global damages and deck’s local deformation is secondary [
6], deck’s unseating, piers’ bending, end pounding, and bearing failures, all more or less result from the excessive displacement of the deck. So, global response is essential to response evaluation and problem solving [
7]. With these recognitions, this study would adopt rigid-deck assumption.
The finite element model cannot accommodate so many eccentricity factors of the curved bridge, like radius, curve length, etc., to do parametric analyses. Williams and Godden [
8] pointed out that curved bridges are susceptible to damages from structural dynamics. So, studies based on analytical models have been attempted in historic research. Examples include Tseng and Penzien [
9,
10], who have used mathematical models to investigate nonlinear seismic behavior of long curved multi-span reinforced concrete bridges that collapsed during the 1971 San Fernando earthquake. Ijima et al. [
4] developed analytical models to investigate the prevention of collapse of the decks of skew and curved bridges due to seismic pounding. With the rigid-deck assumption, the analytical model would be easier to establish. Amjadian and Agrawal [
7] did this job and investigated the parameters affecting the seismic response quantities of curved bridges, especially pounding parameters. This study would perform analyses based on their model.
In this study, new indices based on controllability and observability would be adopted to disclose the impact of eccentricities on the seismic performance of curved bridges. These indices had been used in mechanical problems and were proved carrying useful information for structural testing and control [
11]. Gawronski [
12,
13] used them in the design of a truss hangar and further expound the excellent properties of the concepts and indices in modal coordinates. Wang [
14,
15] had used them on allocating bearings of an isolated building. The arc curve bridge and controllability matrices all show symmetric properties, and eccentricities are what break the symmetry. So, they seem to be the right indices for this problem.
3. Analytical Model of Curved Bridges Based in Rigid-Deck Assumption
Amjadian and Agrawal [
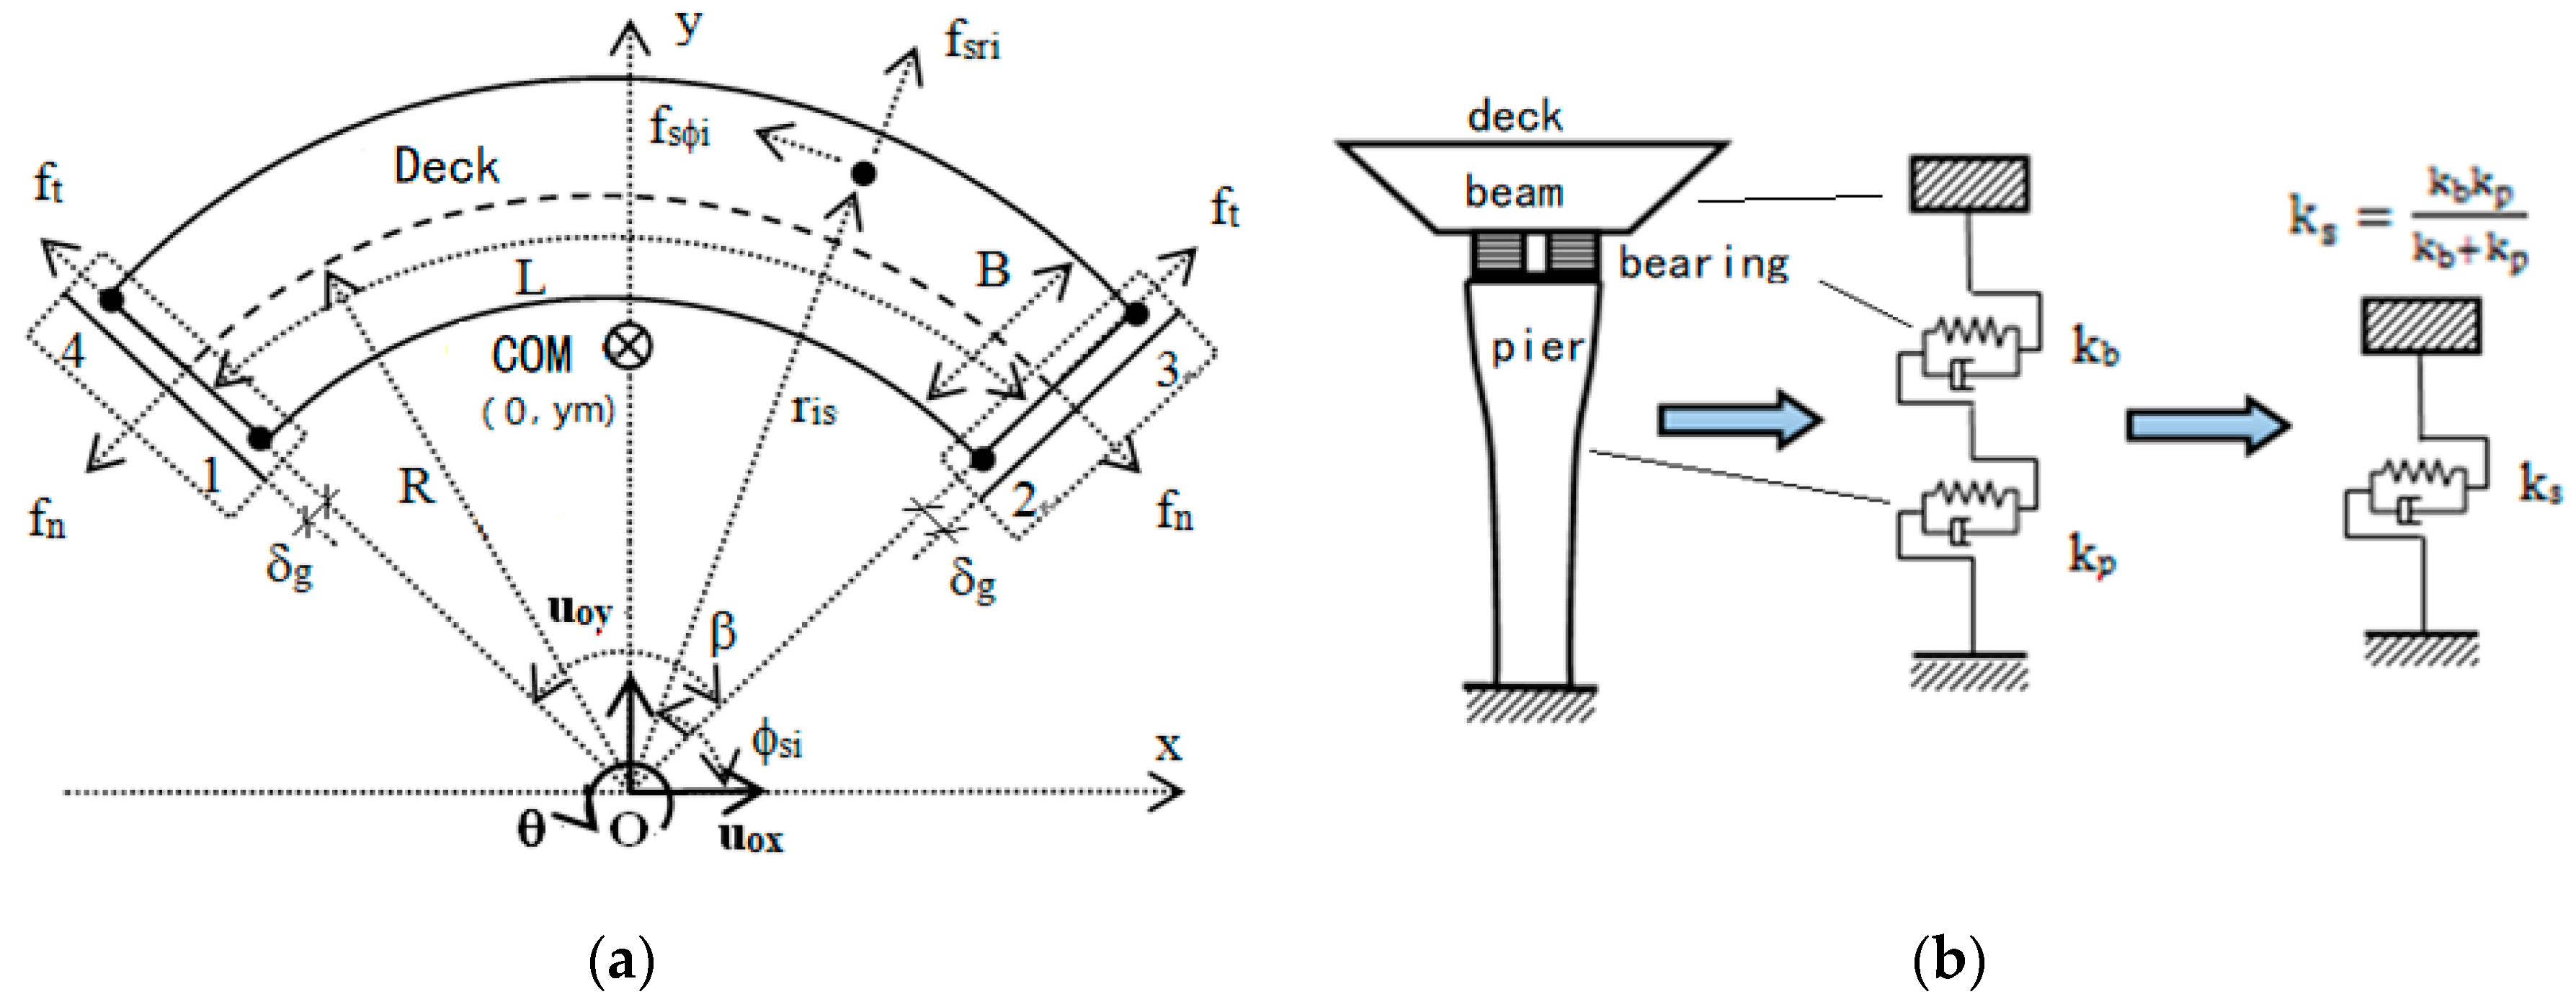
7] proposed a method to extract the equations of motion for curved bridges, assuming the deck is rigid. The curved bridge is simplified as an arc. The schematic of the bridge and related symbols are shown in
Figure 1.
Figure 1a is the schematic of the plane of a bridge, where deck and box beam (the research object) is resting on the bearings, and bearings are placed on the pier (
Figure 1b).
and
are normal and tangential recovery forces of the ith bearing, respectively, whose stiffness
are resulted from the series combination of bearing stiffness
and pier stiffness
(
Figure 1b). B is the deck width, R is the curve radius,
is the gap between the deck and abutment, φ
si is the azimuth angle of the i
th pier, and
is the intersection angle.
and
are friction and contact pounding forces, respectively.
Taking the circle center O as the origin point, and the axis of symmetry as
y-axis, the equations of motion of the bridge of point O, can then be written as Equation (1) (in Cartesian coordinates:
where
is the displacement vector of point O,
is the bi-directional earthquake input vector, and T represents transpose. With
, the transformation matrix from the polar coordinates at ith bearing to the Cartesian coordinates at point O (see reference [
9]), the recovery force vector of the ith pier
, where
is the hysteretic portion,
is the pounding force.
is the mass matrix,
is the stiffness matrix,
is the 2nd-order Rayleigh damping matrix,
is the earthquake influential matrix, θ is the input angle of the earthquake, and
In which
,
, and
are primary terms,
,
are coupling terms, and
where
,
are stiffness from the ith decking supports (see
Figure 1),
,
are post-yield stiffness ratios (when
,
),
and
(anti-clockwise) are polar(
) coordinates for the ith pier.
is the y-coordinate of the center of mass (CM),
and
are polar coordinates of the center of stiffness (CS). Their expressions can be easily solved [
6]. Their offset directly reflects the eccentricity. This study does not consider pounding forces in controllability analyses. So
is omitted here.
In order to establish Matlab and Simulink model for simulations, Equation (1) is changed into the form of Equation (4):
Define state vector
, the equation and outputs are written as Equations (5):
where
is state matrix,
is the input gain matrix,
is nonlinear recovery force and pounding force vector,
is output vector,
,
are output gain matrices,
and
depend on the nonlinear force and output type, and:
4. Controllability Measures
A structure is controllable if the installed actuators have the capability to excite all its structural modes. It is observable if the installed sensors have the ability to measure the motions of all its structural modes, i.e., controllability indicates how well the states can be “reached” by inputs and observability indicate how well the states can be “recovered” from outputs [
11]. For feedback control, uncontrollable eigenvalues cannot be modified by adding control no matter which gain is used for feedback, e.g., a mode’s nodes are uncontrollable points to that mode. Note that “actuator” is in general sense. There is no actuator in the curved bridge. Restraints, such as isolation bearings, can be taken as passive “actuators” that input the filtered ground motions to the bridge.
Generally, two criteria are used to determine the system’s controllability and observability properties. The first criterion is related to the rank of the controllability matrix
and observability matrix
, respectively. However, when the system includes many degree-of-freedoms (DOFs), dimensions of
and
would be very large. So, the other way is to calculate the controllability and observability “Grammians”,
and
, by Equations (7).
Matlab has functions to solve and directly. Equations (7) show that controllability, as the coupling between the inputs and the states, involves only the system state matrix and the input gain matrix ; and observability, as a coupling between the states and the outputs, involves only matrix and output gain matrix . is not involved. So and are internal properties of a system. Location and strength of actuator (bearing) and curve shape change matrix , and GM directions change matrix . So and would definitely change with eccentricities.
and
values are not unique, because they vary with coordinate systems, and a state that is more controllable is not necessarily more observable. This usually makes some trouble when feedback is needed. However, the eigenvalues of the product of
and
are invariant under linear transformations [
12]. These invariants are called Hankel singular values (HSV) of the system, denoted by
in Equation (8), where
denotes eigenvalue.
HSV can comprehensively and evenly reflect the magnitudes of the vector space of controllability and observability. It is an important index in structural control. Larger HSVs represent better and balancing controllability and observability.
HSVs and controllability Grammians could provide some insights into the DOF’s coupling as well. Grammins and HSVs are all symmetric matrices. Their diagonal terms can be taken as auto-correlations of the input impacts on a certain DOF, while the off-diagonal terms can be taken as cross-correlations, which indicates the input impacts on the mutual relation between the DOFs.
5. The Prototype Bridge
The study is based on the Xinkang overpass in Harbin, China. It finished construction in 2014 and is on an important expressway to the airport. It was designed for intensity 6 seismic fortification (by Chinese code); however, due to its importance, more research is necessary to examine its safety due to curvature. The plan scheme and pictures of the bridge are shown in
Figure 2. It has six spans: a 23 m simply supported up-approach outside piers #5, a 30 m simply supported down-approach outside piers #1, and a four-span (46 m + 74 m + 74 m + 46 m) continuous curved main bridge between piers #1 and #5 which is the object of this study. The beam of the curved section is a steel-box. The piers are in vase shape, sections changing from circle at bottom to square plus two half circles on the top. The mass of the four-span bridge is 1.07 × 10
6 kg and is evenly distributed along the line.
Align the bridge as in
Figure 1a, and the geometry parameters of the bridge are shown in
Table 1. Though the elevation of the bridge deck is not constant, plane rigid-deck assumption still applies, because vertical vibration does not couple with plane torsion. The focus of this eccentricity study is not 3D effects. High elevation just leads to a low horizontal stiffness for this problem.
Bearing parameters may change as a result of degradation [
16]. So instead of asking manufactures for a model number, this study just chose bearings with comparable stiffness and damping, LNR700 and LRB700-140, from available product list. Parameters are shown in
Table 2.
6. Eccentricity Conceptual Analysis
Eccentricity is inevitable for a curved bridge, because CM does not coincide with CS. This study examined following eccentricity cases: three geometry eccentricity cases that result in different CMs (radius R = 90 m, 100 m, 110 m, respectively); three physical eccentricity cases that result in different CSs (different bearing arrangements, case 1 (symmetric), case 2 (unsymmetric 1), case 3 (unsymmetric 2), respectively), and multiple GM cases(x-, y-, or x-and y-, from 0–180°) that result in different eccentricity moments. The cases were illustrated in
Figure 3. They have similar overall stiffness and damping except for case 2, whose damping in x-direction is a little smaller.
The coordinates (Cartesian) of CMs and CSs w.r.t point O of the six cases are computed and shown in
Table 3.
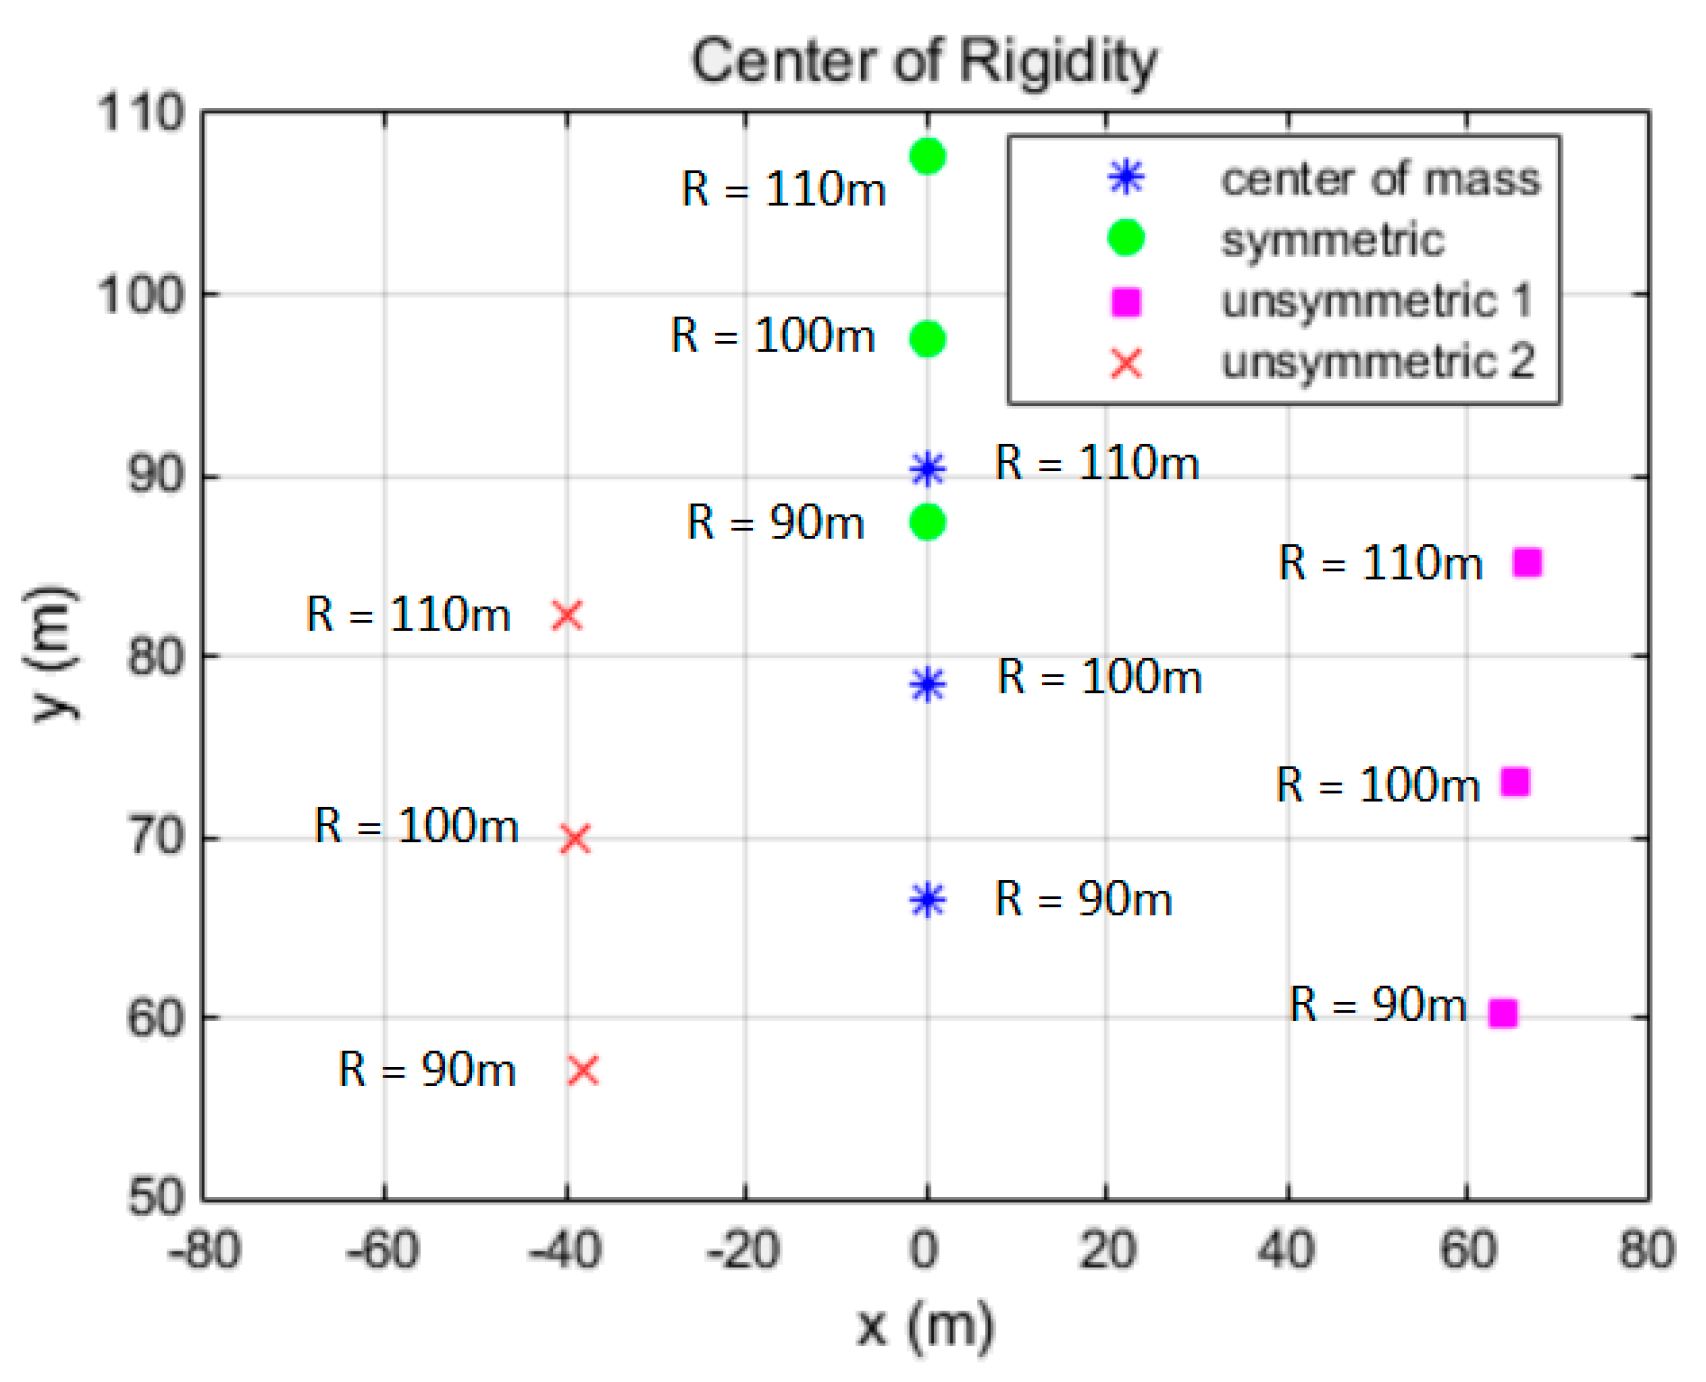
CM and CS coordinates are shown in
Figure 4. It can be seen that, in x-direction, the largest eccentricities occur in cases 2, while in y-direction, the largest eccentricities occur in cases 1. Cases 3 are in between the two cases. Furthermore, CSs of cases 2 and cases 3 are in opposite sign in x-and are in same sign in y-, which indicate that, if x-and y-GMs are in the same phase and input at greater angles than
, the GM induced moment would counteract each other for cases 3 and amplify each other for cases 2. So, in combined x- and y-(
), cases 3 have the smallest eccentricities and and cases 2 have the largest eccentricities.
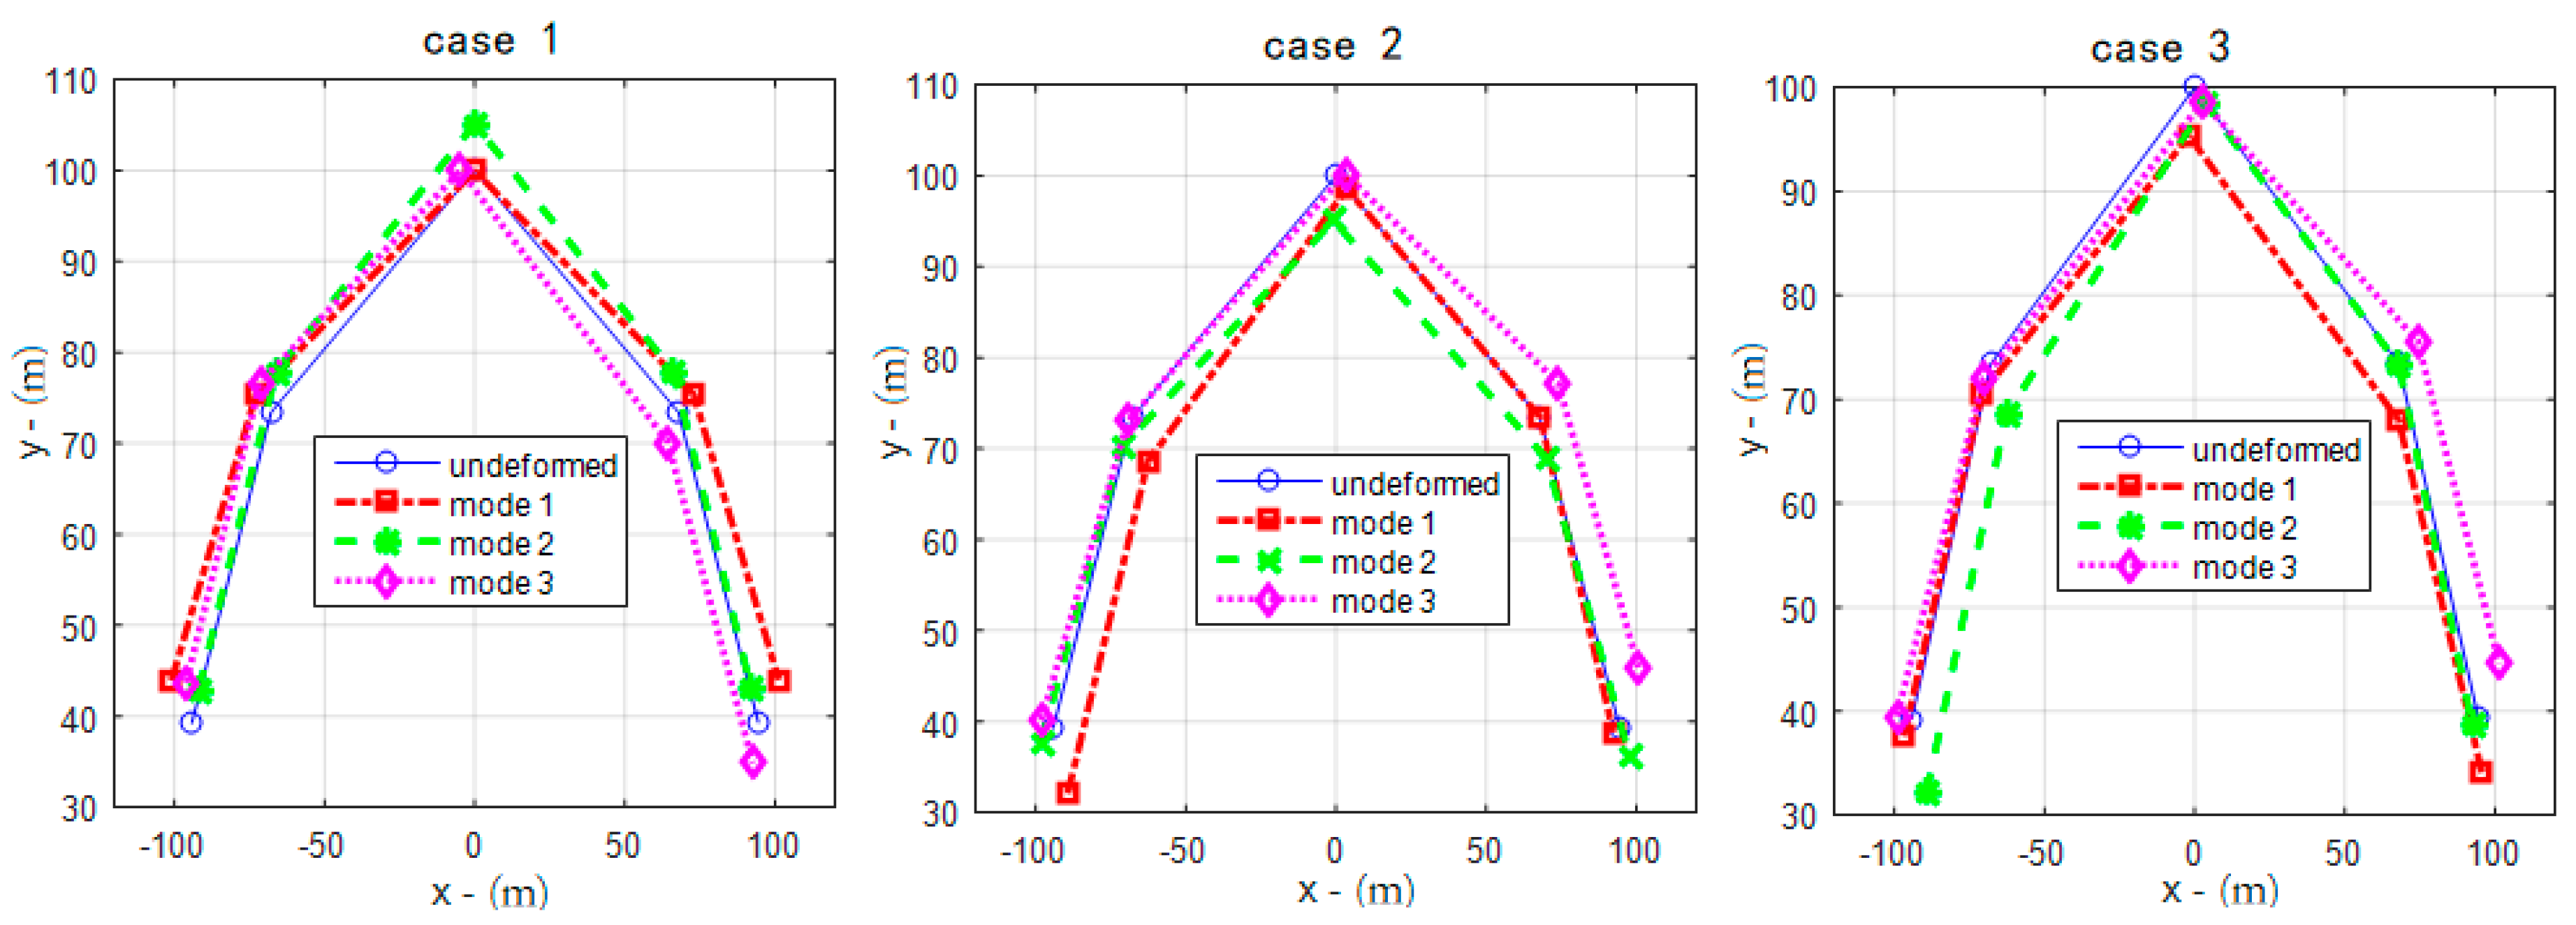
Mode shapes for the R = 100 m bridge are shown in
Figure 5. It can be seen that mode 1 and mode 3 are anti-symmetric w.r.t the
x-axis; mode 2 is in y-direction. In all cases, the two ends are where the responses are the greatest. So not to lose generality, Pt. #1 and Pt #5 would be taken to showcase the bridge’s responses in the following analyses.
7. Eccentricity Controllability Analysis
Analyses are made for the single GM input (See in Equation (2)).
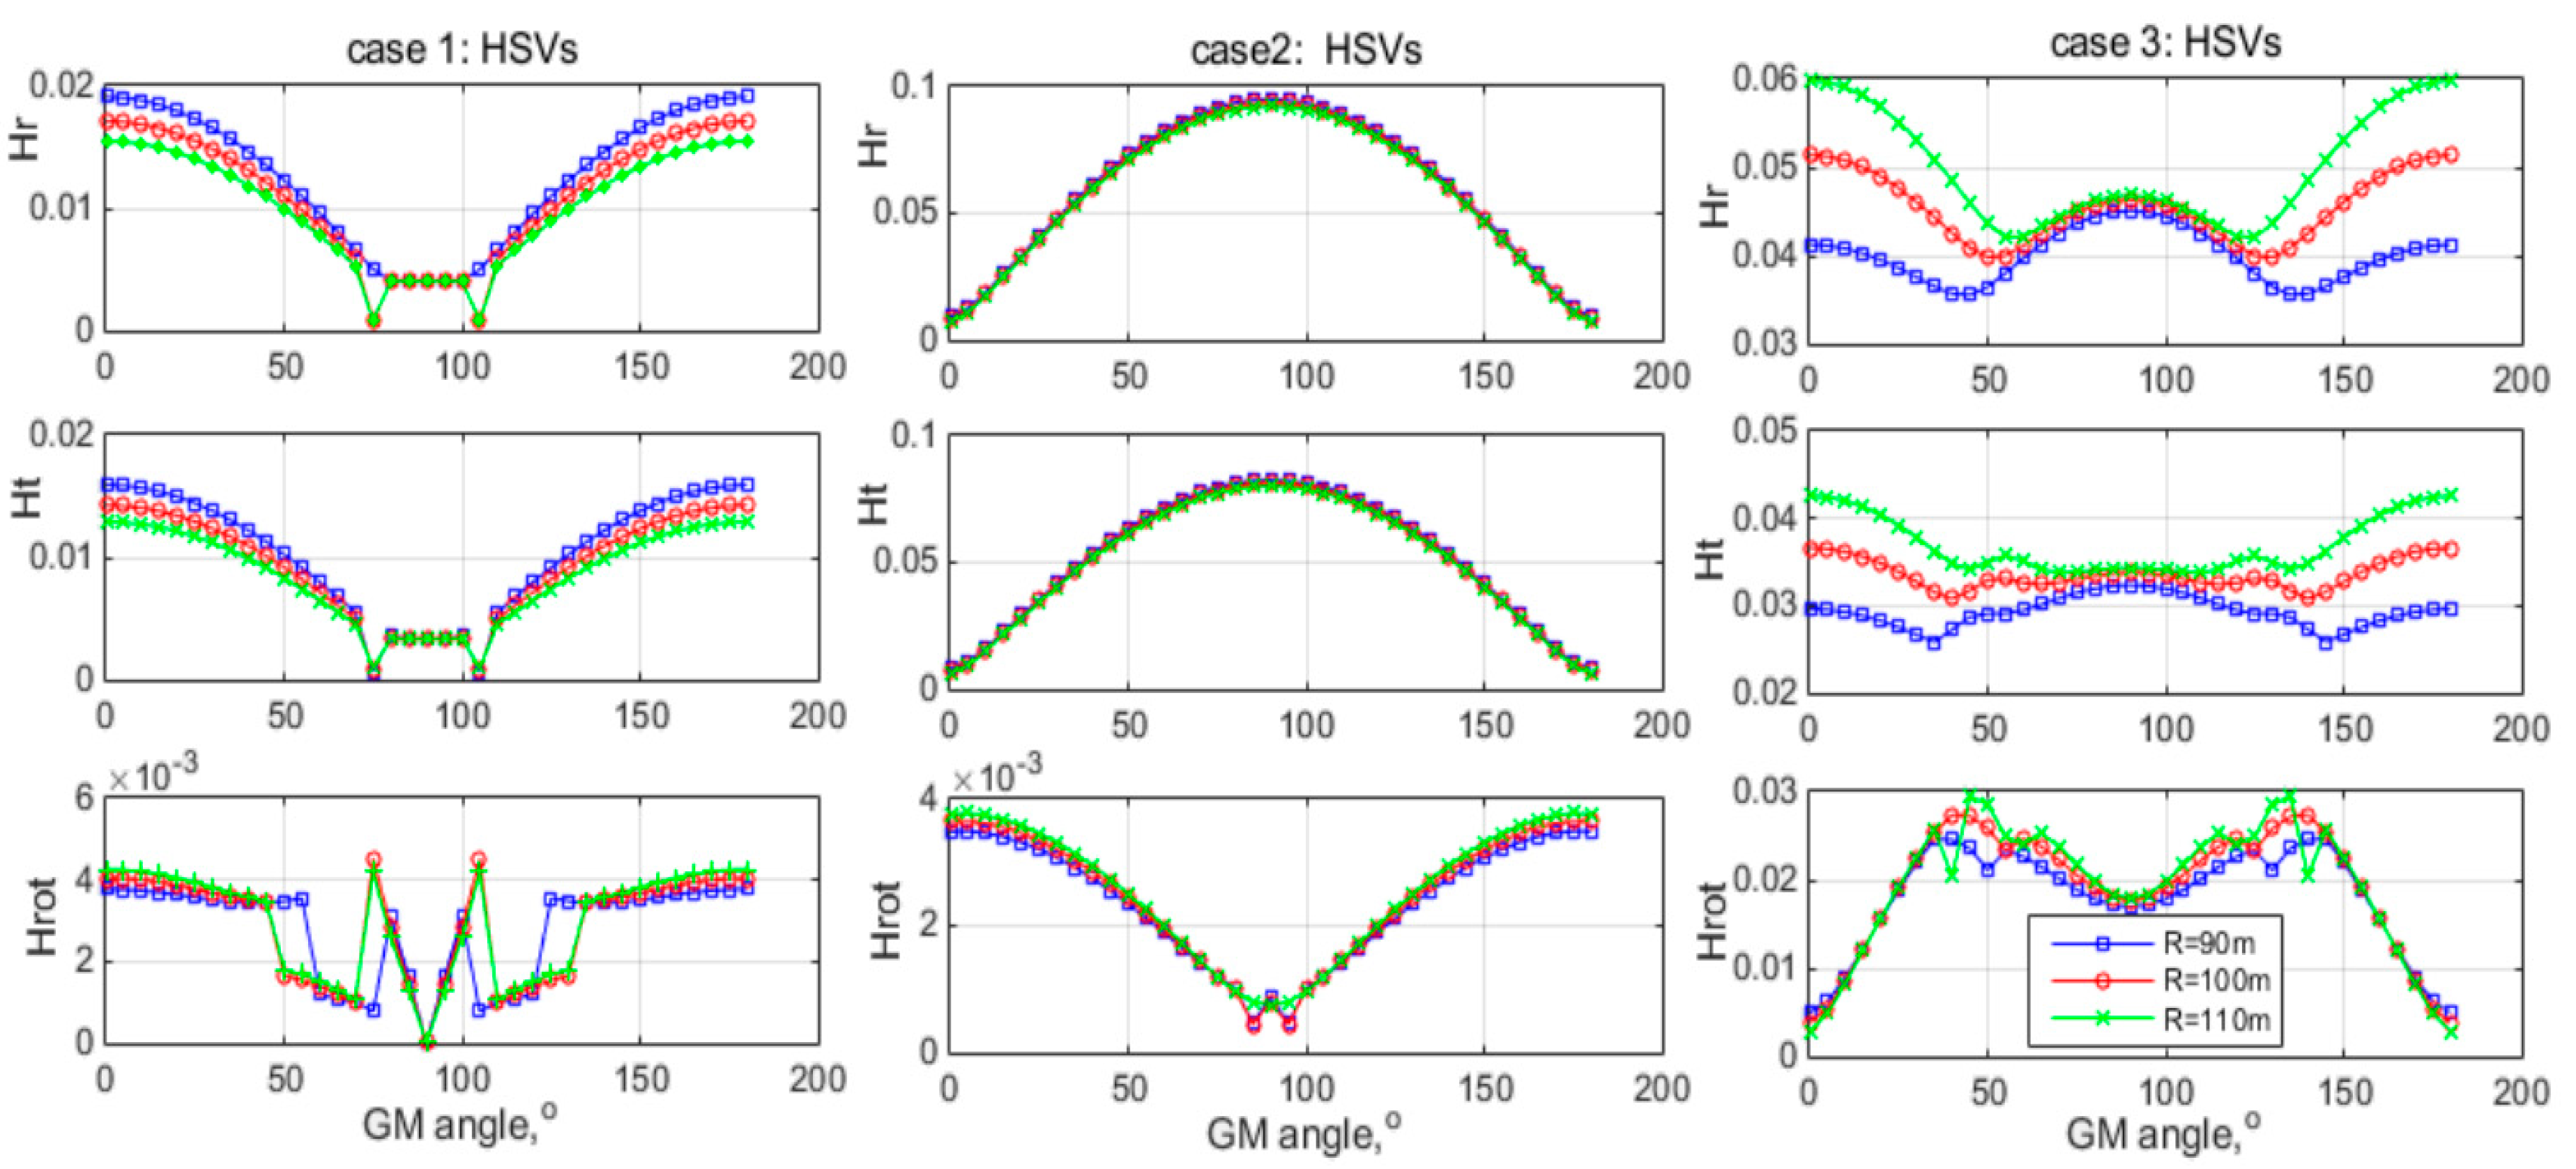
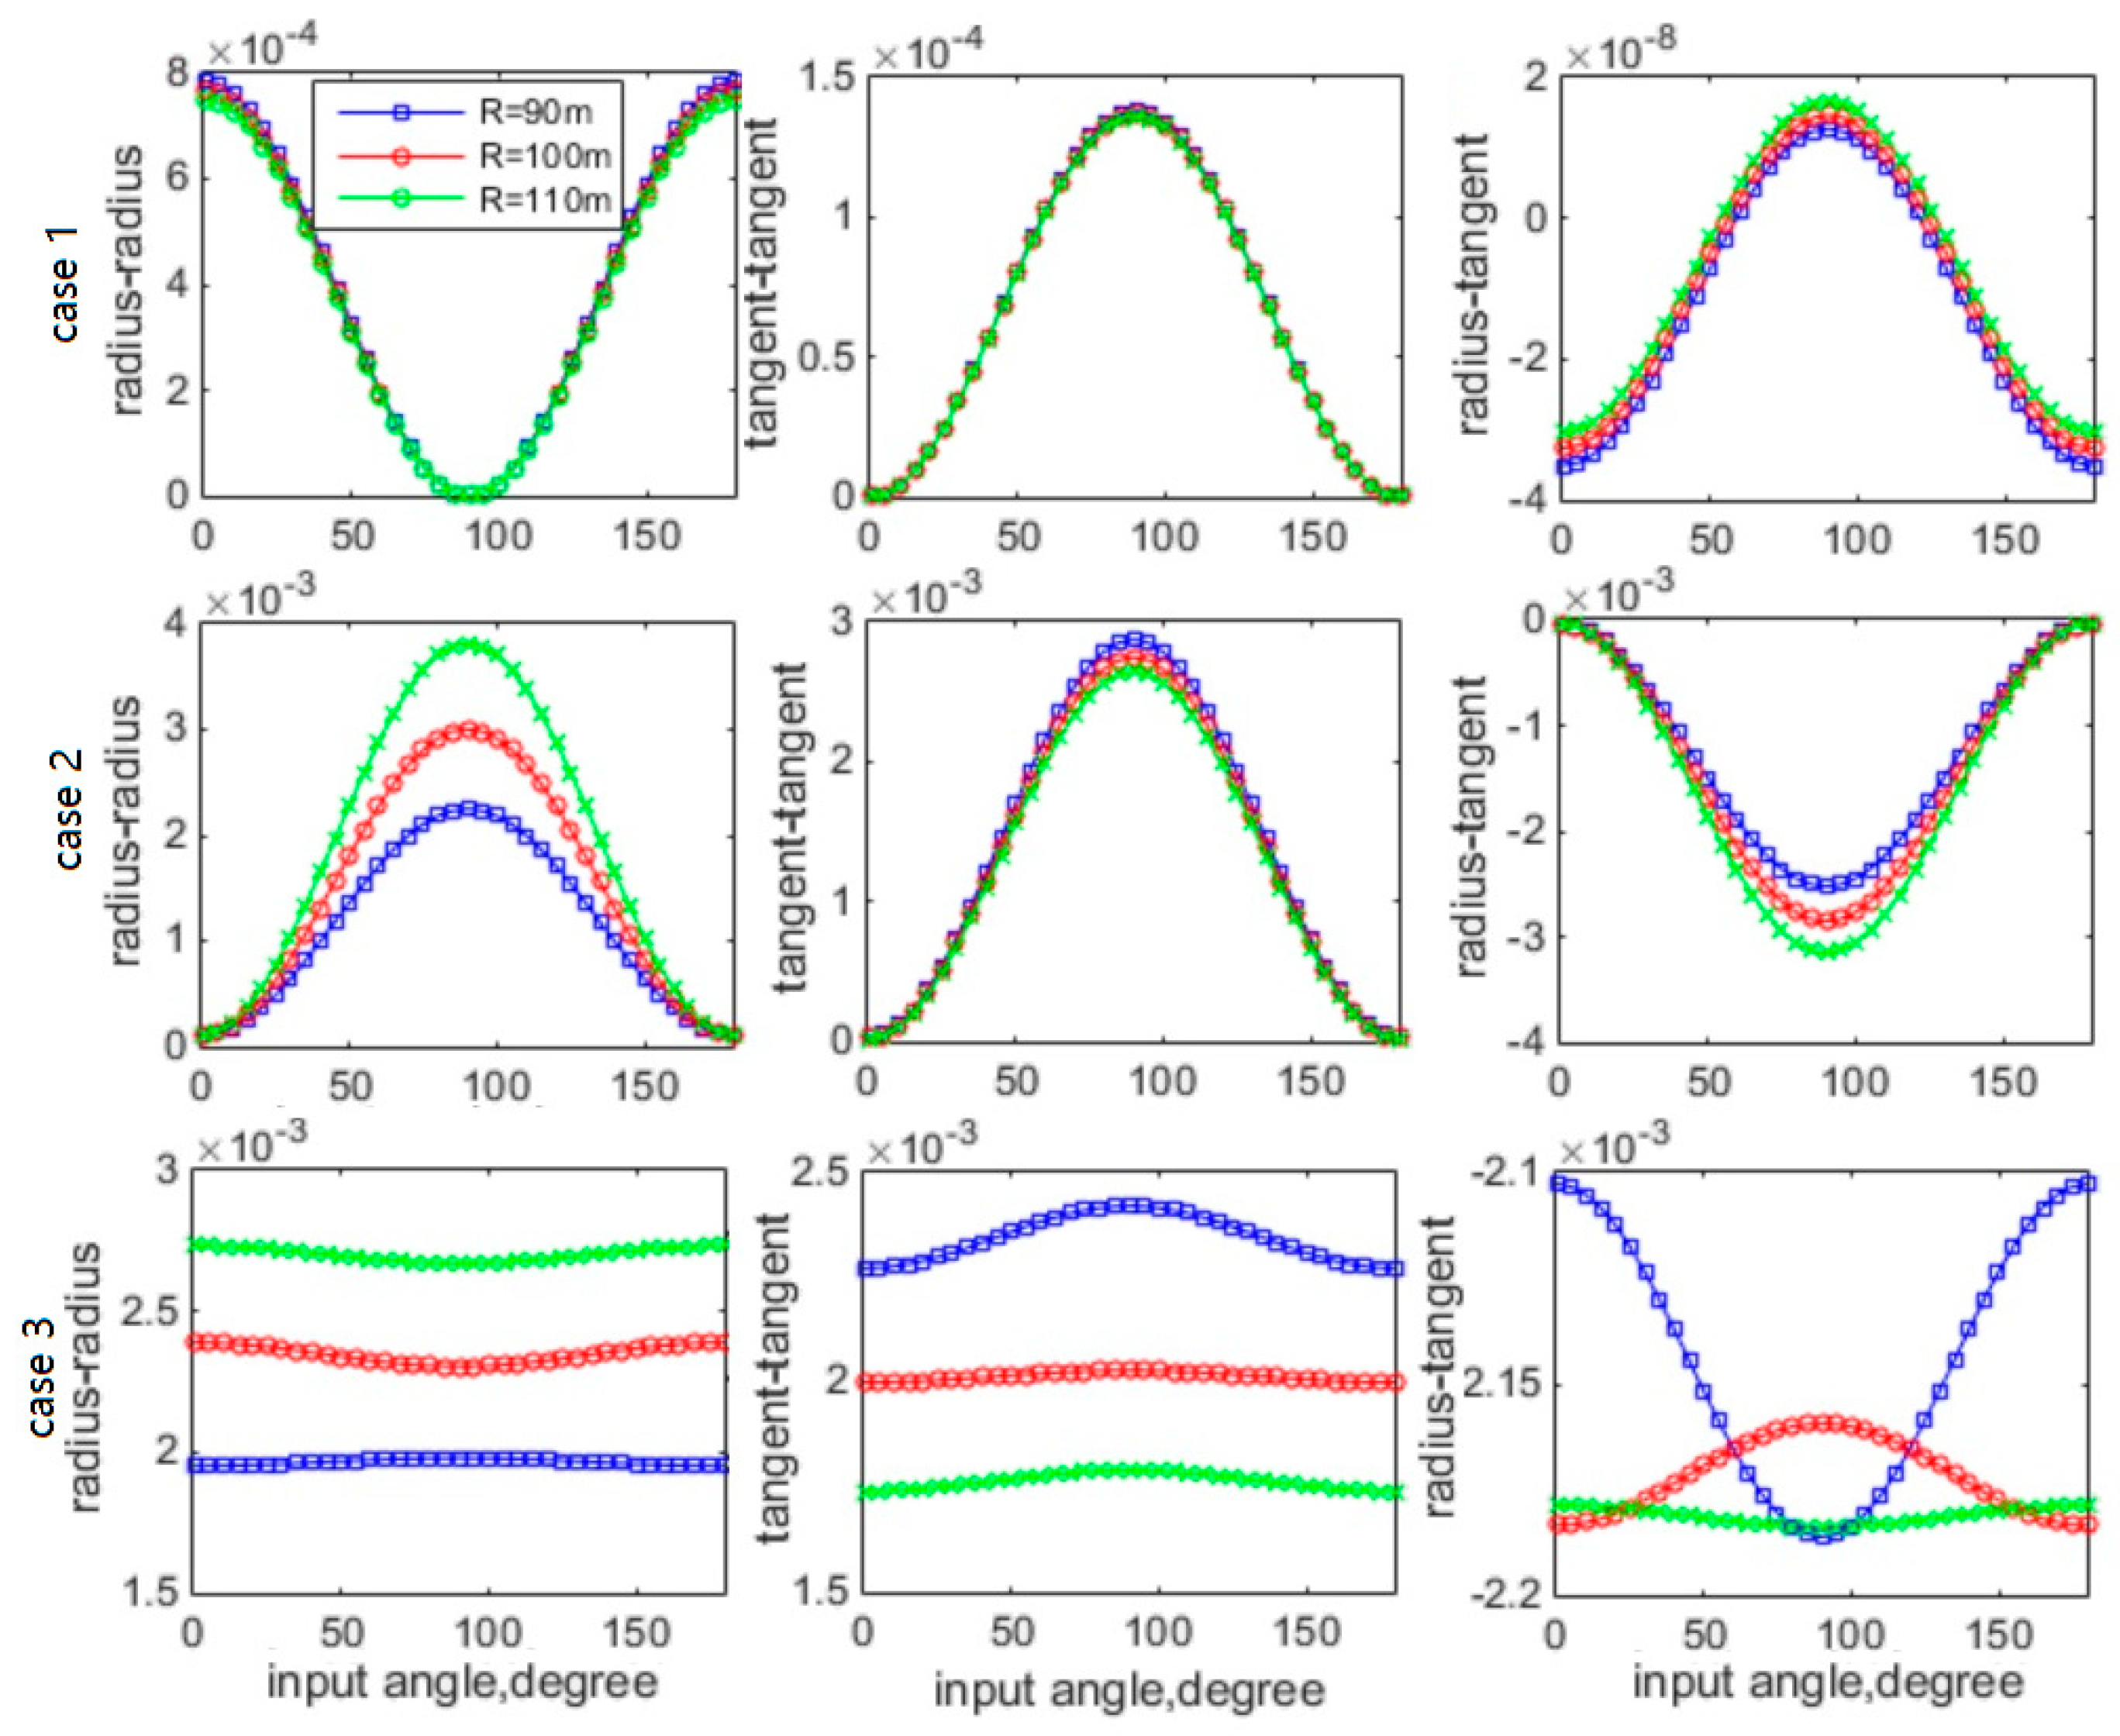
First, Hankel Singular Values (HSVs) changing with GM angles are shown in
Figure 6, where H
r represents radial HSVs, H
t represents tangential HSVs, H
rot represents rotational HSVs. Same legend applies all plots.
It can be seen that, for case 1 and case 3, Hr and Ht decrease when GMs change from the bridge’s longitudinal (x-axis) direction to transverse (y-axis) direction, but when GM directions are between 50° and 130° (where #2 and #4 supports located), the values remain at low level; Hrot and case 2 are opposite. The results show that cases 1 and 3 are more “controllable” by the x-components than by the y-components of GMs; case 2 is more “controllable” by the y-components than the x-components of GMs, and radius difference does not influence the HSVs too much for case 2. These results agree with the previous conceptual analysis and provide visual and deep insight into the eccentricity essence.
However, HSV is a comprehensive index of controllability and observability, which does not necessarily follow the same trend with controllability. For this problem, controllability is of more concern.
is a 2n × 2n (n = number of DOF) matrix, with first n × n corresponding to displacements, and last n × n corresponding to velocities. Diagonal terms of
are auto-Grammians, and off-diagonal terms are cross-Grammians, indicating coupling.
Figure 7 shows controllability Grammians,
of Pt #1 with GM angle change.
From
Figure 7, it can be seen that, the auto-Grammians agree with the HSV results, i.e., cases 1 and 3 are more controllable with smaller angle GMs, and case 2 are more controllable with larger angle GMs; radius also has little influence on Grammian values for case 2; bearing cases show more discrepancies in HSVs than radius cases. Cross-controllability Grammians are much smaller than auto-controllability Grammians for case 1, comparable for case 2, and strong for case 3, indicating the radial-tangential couplings go from weak to strong.
Section 6 discussed that the moment induced by x-and y-components of excitations may counteract each other due to eccentricity property of case 3.
Figure 7 confirmed the results: controllability Grammians of case 3 change little with GM directions and coupling indices decreased compared with case 2, i.e., curved bridges with this bearing arrangement have a relatively stable and robust response despite the GM direction change. Though couplings are still strong, the bridge’s performance remains in a moderate and predictable range.
8. Earthquake Time History Analysis
8.1. Earthquake Records to Use
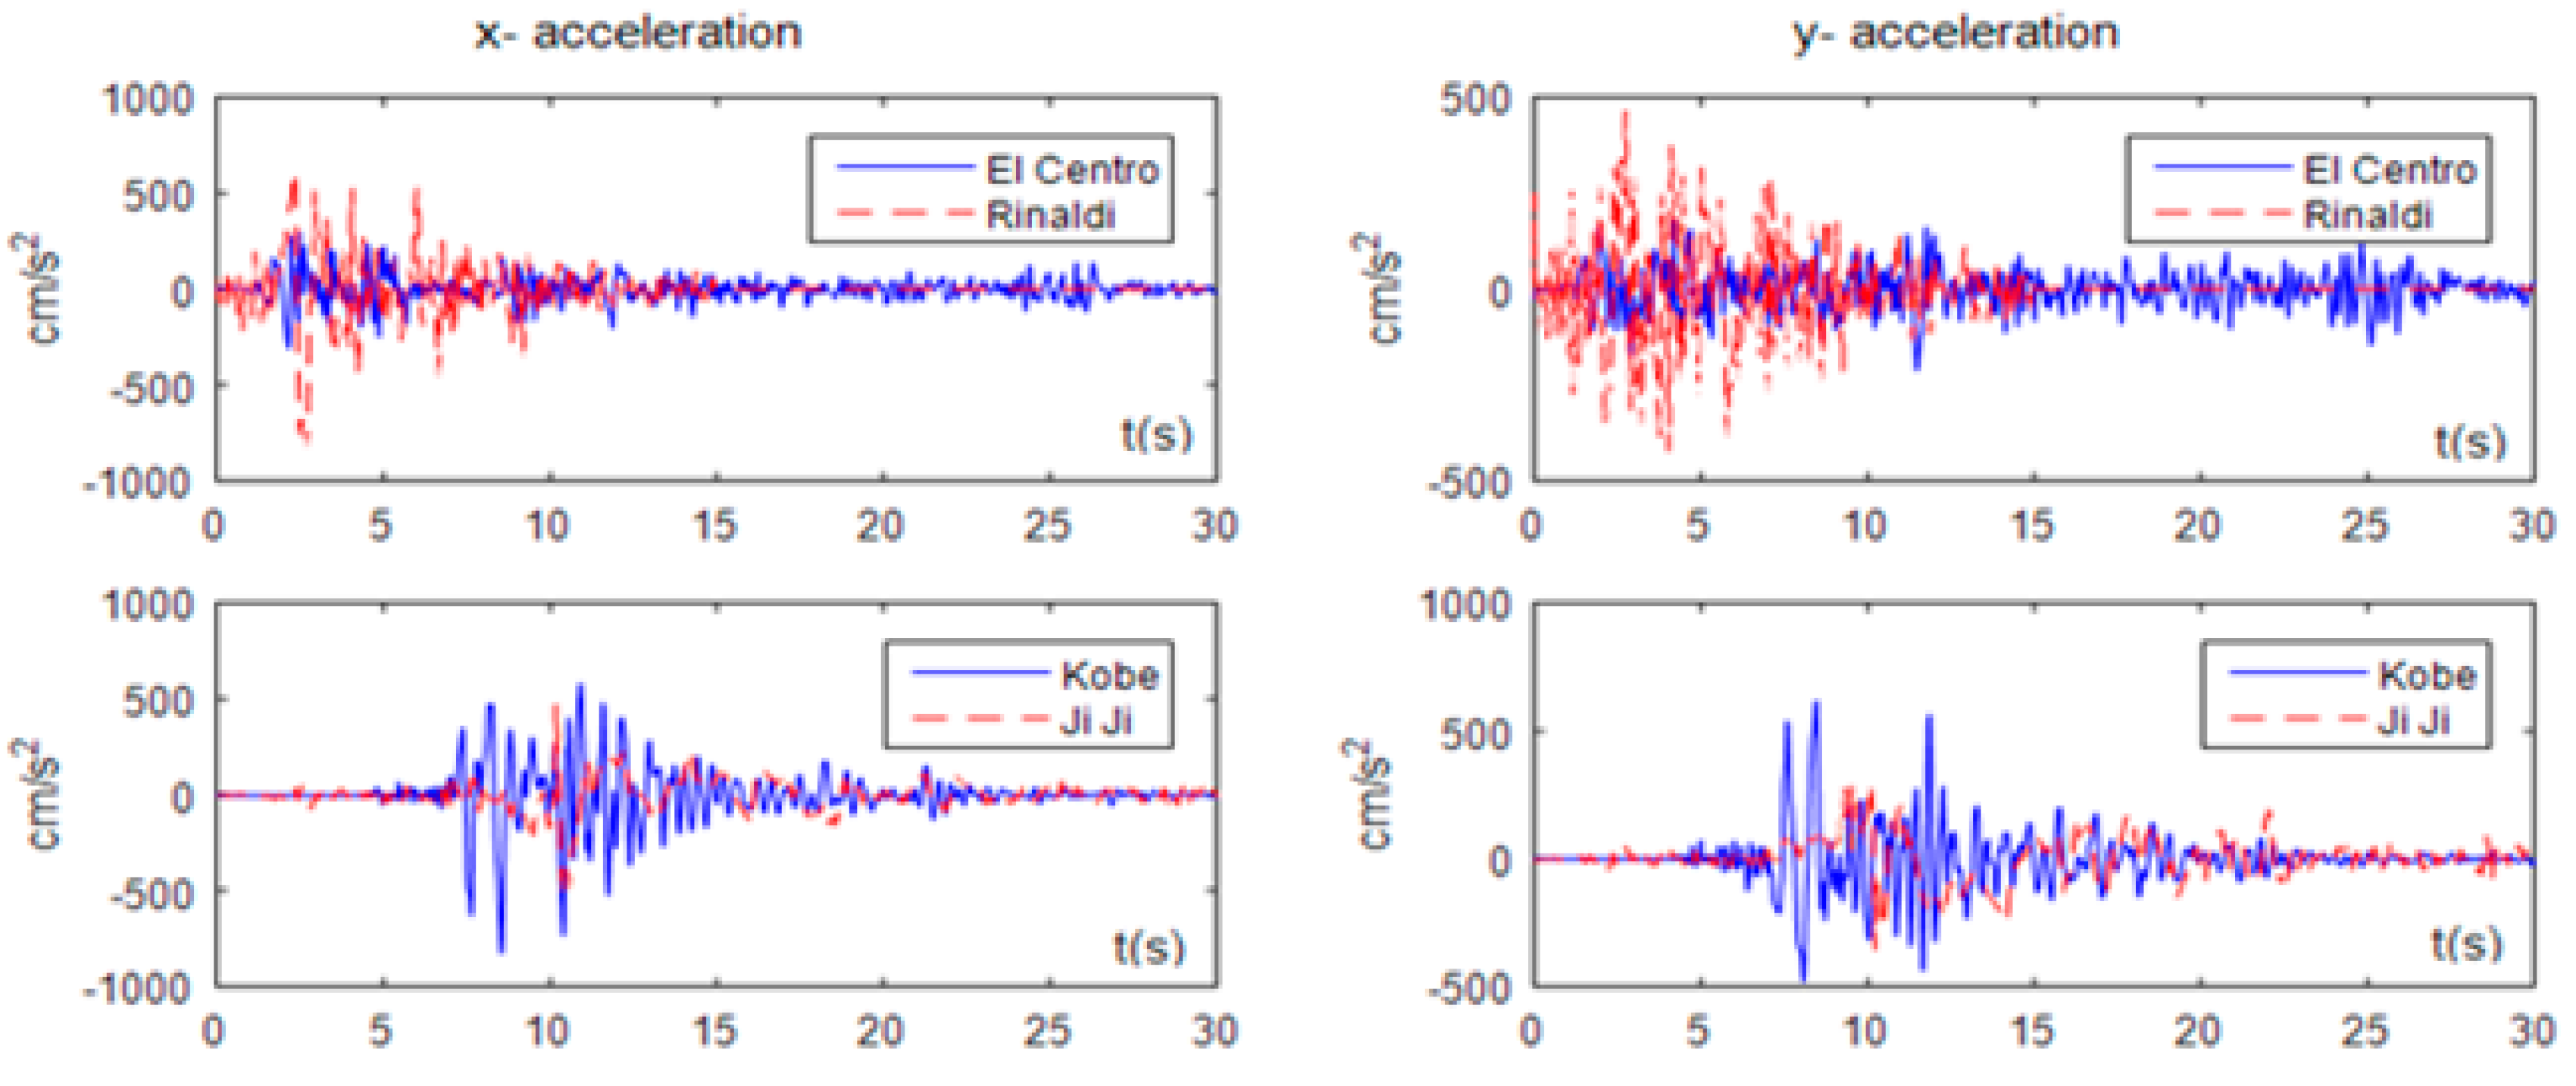
Four earthquake records, El Centro (1979 Imperial Valley), Rinaldi (1994 Northridge, Rinaldi station), Kobe (1995, JMA Station), and Jiji (1999, station TCU 068), will be used for the time history analyses. These earthquakes all contain fault parallel (FP) and fault normal (FN) components. Let the FP direction represent the x-direction, and the FN direction represent the y-direction, the two direction acceleration time histories of the four earthquakes are plotted in
Figure 8.
This study focuses on how internal property on structural seismic behaviors, and so nonlinearity is not considered, i.e., = 1, and structural damping ratio . The amplitude of the earthquakes is scaled to 0.2 g (199 cm/s2), corresponding to the intensity 8 design earthquake level.
8.2. Simulations
Time history comparisons should be made between parameters that bridges are sensitive to. Based on modal, controllability, and HSV analyses, the following simulations were made:
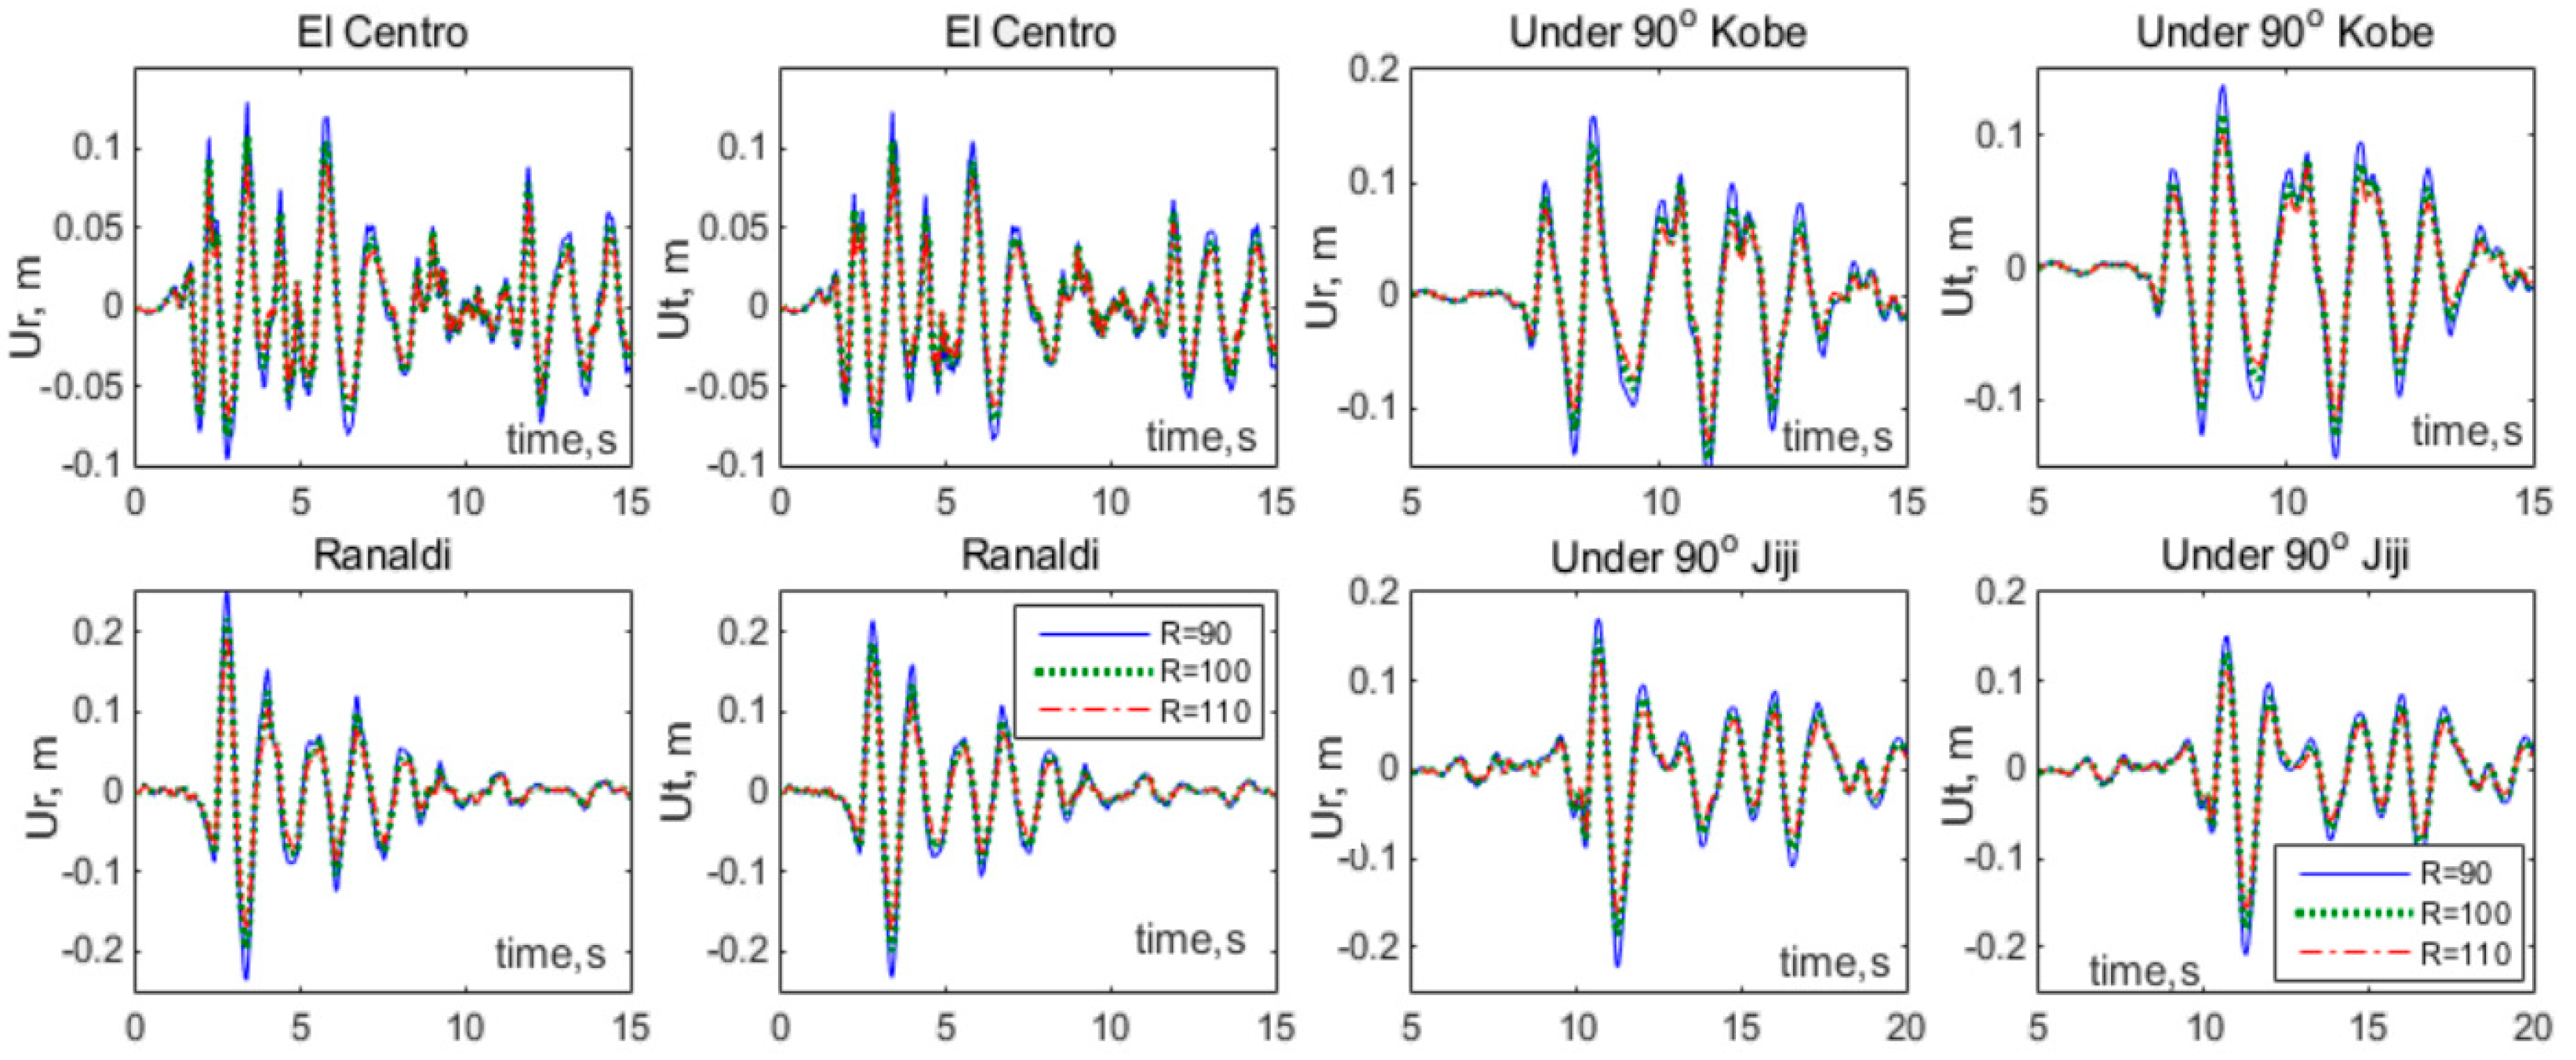
Examine the radius influence. So, comparison was made for the case 3 bridges with different radiuses and four GMs inputting at 90°. The time history responses (5~15–20 s) of Pt. #5 are shown in
Figure 9. Clearly, peak responses are in order of red lines (R = 110 m) < green lines (R = 100 m) < blue lines (R = 90 m), for both radius responses (U
r) and tangential responses (U
t), and for all earthquakes. Furthermore, U
r and U
t are nearly of the same order for all cases. The results show that smaller radius bridges have greater earthquake response, which agrees with the Grammian analyses in
Figure 7 (case 3) and validates the fact that a smaller radius worsens the eccentricity.
Examine the bearing influence and the earthquake superpose effects. Comparison was made on the 3 bearing cases of the R = 100 m bridge, with Kobe and Jiji GMs inputting at 0° and 45°, respectively. The two translational motions (radius U
r, and tangential U
t) are plotted in
Figure 10.
It can be seen that responses of case 1 and case 3 are much larger than those of case 2 for 0° GMs, while for 45° GMs, the peak responses are in order of case 2 > case 3 > case 1, and case 3 changes little. It confirms the Grammian and HSV analyses in that case 1 in sensitive to the GM directions, case 2 is sensitive to y-GMs, and case 3 is relatively stable under different GMs.
Furthermore, the 45° responses of case 1 are smaller than the 0° responses, while case 2 is on the contrary, and case 3 does not change much. This confirms the amplification or counteraction effects of eccentricities in case 2 and case 3, and the symmetric case 1 being sensitive to GM’s x-component. Ur and Ut are nearly of same order under 0° and 45° GMs for all cases, indicating the coupling is strong.
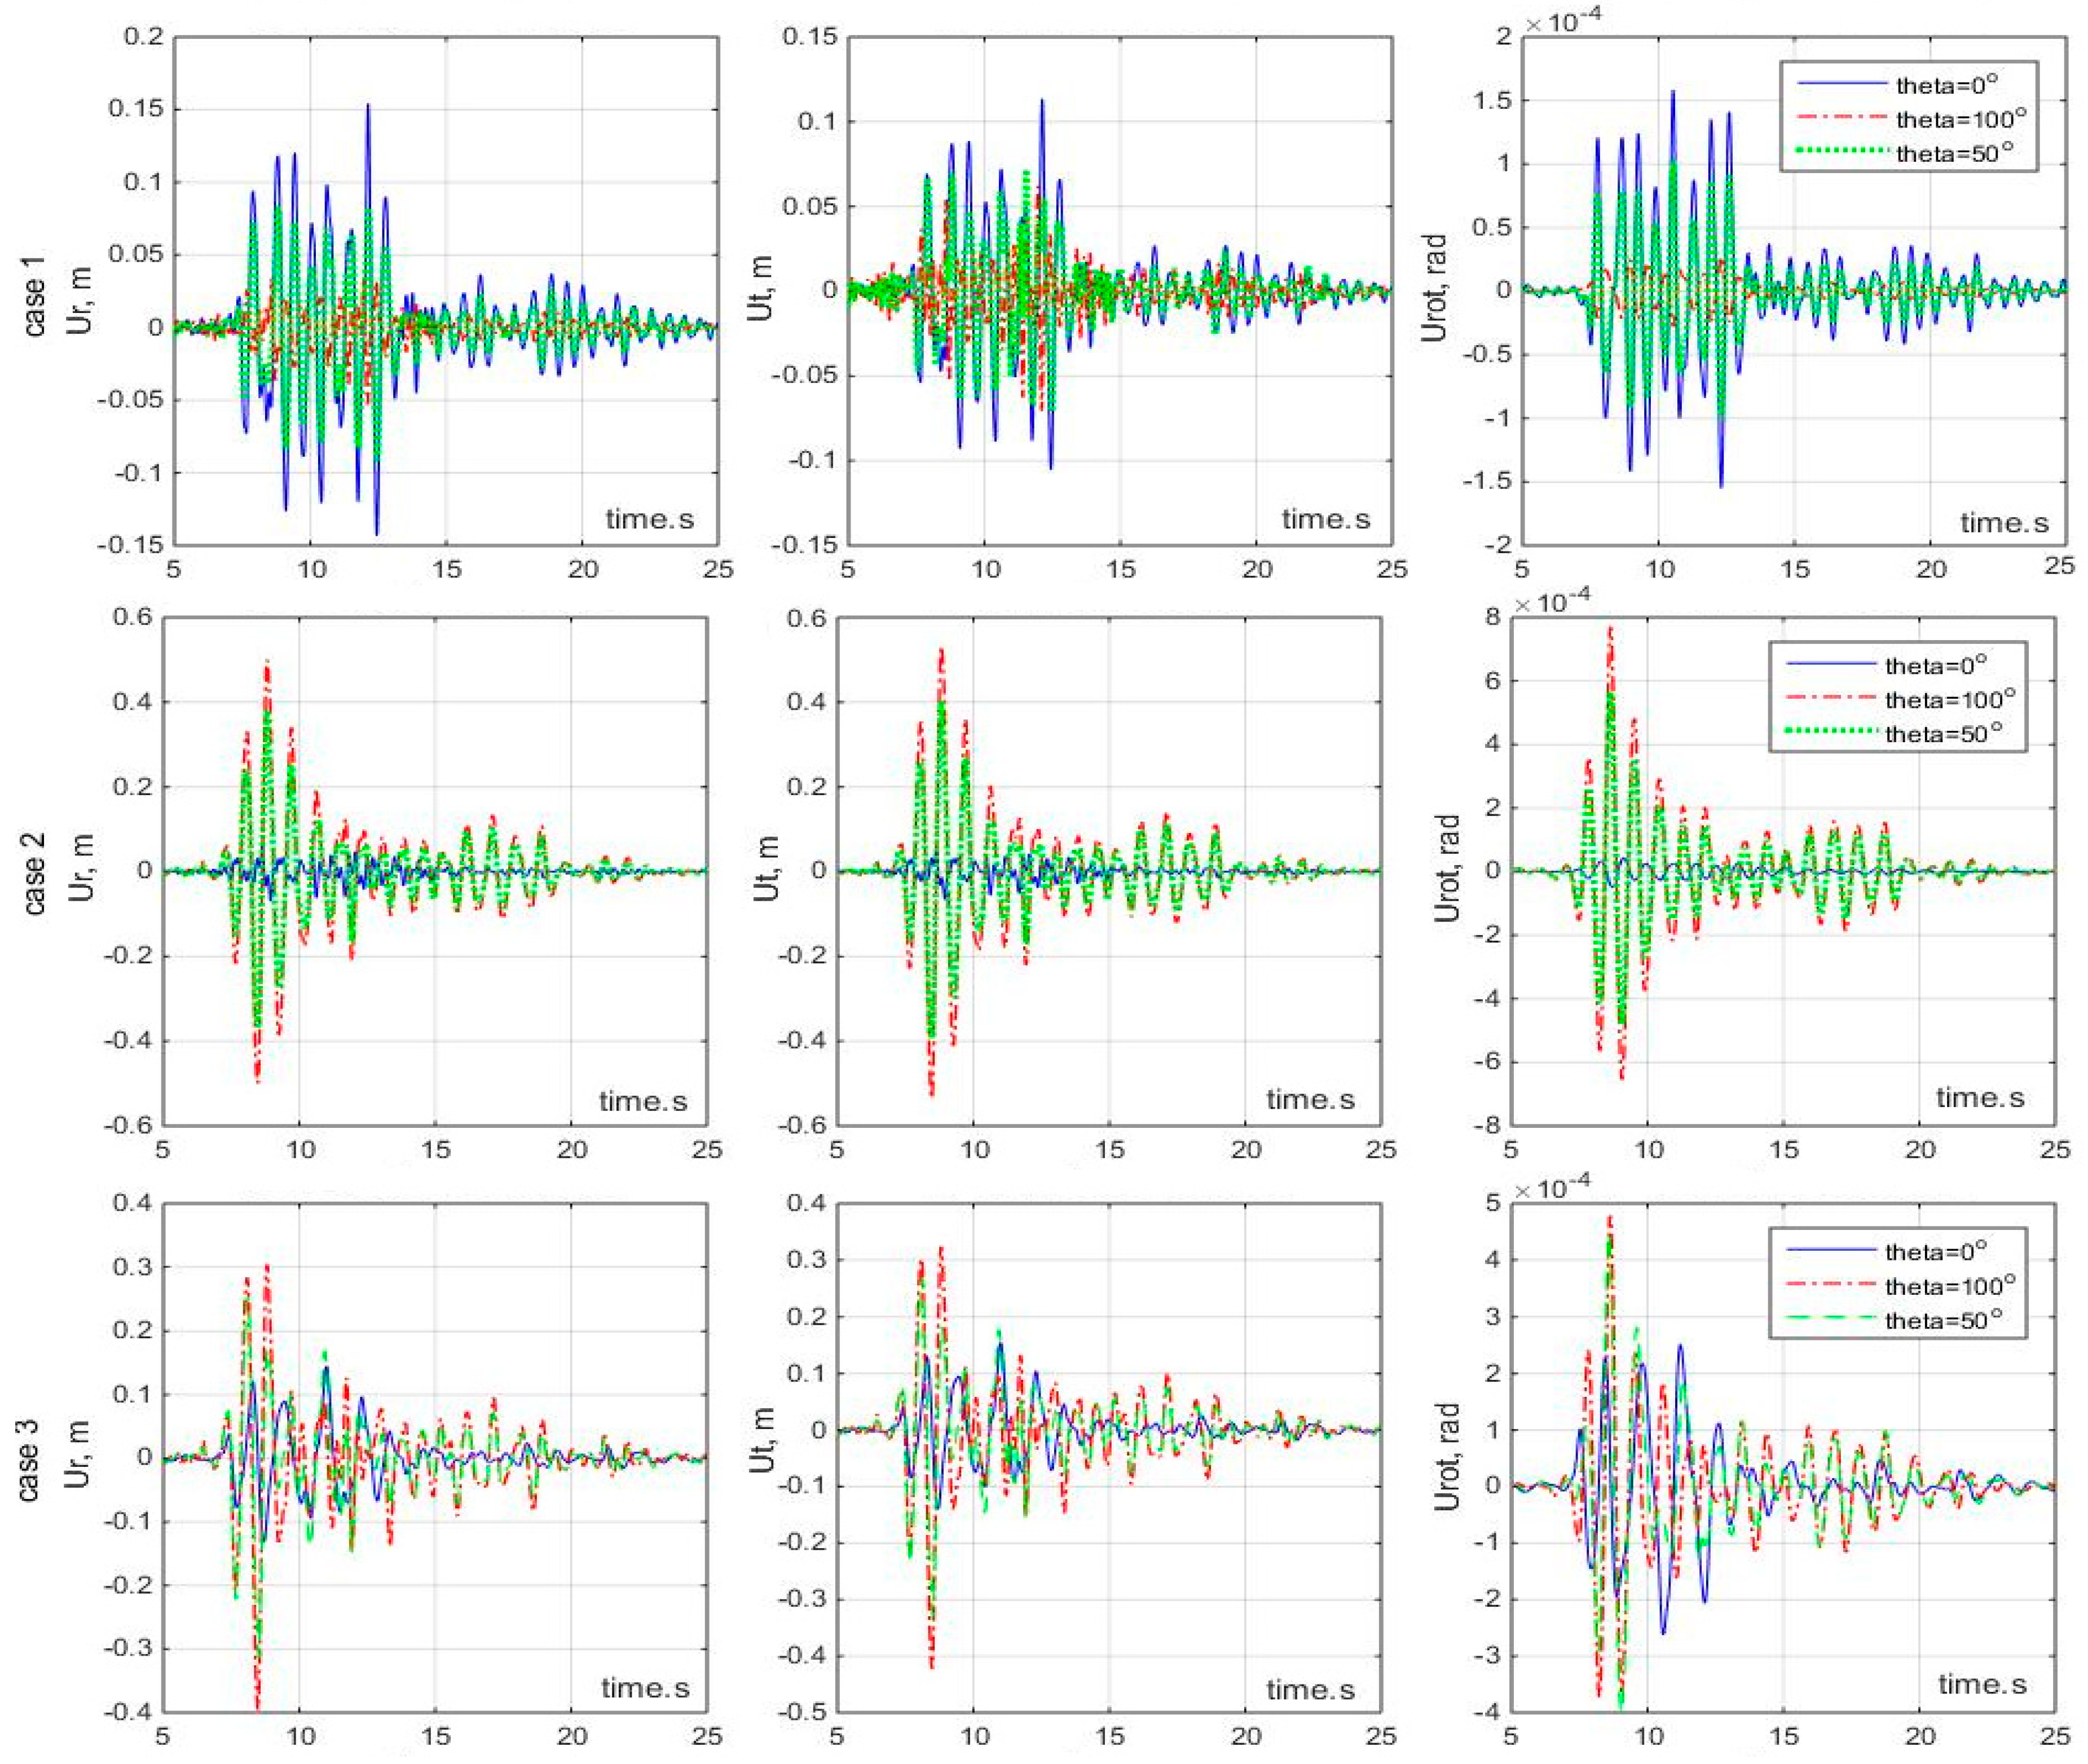
Examine the bridge responses with GM angle change. Based on the analyses of
Figure 6 and
Figure 7, the comparison was made for the R = 100 m bridges under Kobe earthquake inputting at 0°, 50°, and 100°, respectively. The results are shown in
Figure 11.
Figure 11 shows that the responses of case 1 decrease when GM angle changing from x-to y-. The results agree with the analyses of
Figure 6. Case 2 is contrary to case 1: the responses increase distinctly with GM angles increase, which also agree with the analyses of
Figure 6 and
Figure 7. Meanwhile, for case 3, the change of response magnitudes is moderate with GM angles of 0°, 50°, or 100°. So, case 3 is a better design than case 1 and case 2, because its responses remain in a controllable range to different earthquakes inputting from different directions. However, the U
r and U
t responses to 50° GM are not the smallest among the three angles as
Figure 6 indicates. The reason might lie in the large rotational responses U
rot (
Figure 6) and strongly coupled U
rot with U
r and U
t (
Figure 8).
9. Discussions
The new contribution and new results of this study are in the following discussions:
This study applied the controllability-based concepts on the evaluation of curved bridges. To make it work, a rigid-deck assumption was made to obtain the analytical equations of motion that can account for coupling effects, and six eccentricity cases were designed for the study of different sources of eccentricities.
HSV–GM direction and controllability Grammian–GM direction curves show the potential structural responses to earthquakes from different directions, and response variances for different stiffness cases and radius cases. Analyses confirmed that HSV and Grammian could reflect the link of structural geometric and physical properties to excitations. Their values could provide useful information for positions on the structure that are sensitive to excitations and measurements, and thus, factors that make the structure “irregular” or “asymmetrical” could be figured out.
A smaller radius indicates stronger eccentricity for curved bridges, which makes the bridge more “controllable” to ground motions in the chord’s direction, i.e., curved bridges illustrate strong irregularity to such ground motions. This phenomenon is shown in the typical y-symmetric case 1.
The support restriction (or stiffness) distribution is a more important factor for eccentricity control than radius for curved bridges, because it determines the relative position of CS and CM. After all, the CM location could not be adjusted once the line of the curved bridge is determined. The space between the curves on HSV and Grammian figures confirmed it.
Stiffness eccentricity literally aggravates the irregularity; however, its action could either amplify or counteract the other eccentricity source, ground motion directions. Comparison of case 2 and case 3 found that, case 2 “deteriorated” the eccentric condition, while case 3 “neutralized” the eccentric condition, and thus performed better than the y-symmetric case 2. So, proper design of stiffness eccentricity could achieve “symmetric” effects to some unfavorable ground motions, decrease the coupling effects, and result in a more robust bridge.
HSV is more comprehensive and general and better used in feedback control, while Grammian seems to be the right index for this control-only case. However, the indices still need to be studied further for easier implementation.
10. Conclusions
Curvature and eccentricities make curved bridges not conform to the “independent transverse and longitudinal” regularity in bridges’ seismic design tradition, and the resultant strong coupling and unpredictable large responses endanger their seismic safety. This paper introduced the indices of controllability to examine the eccentricity effects on curved bridges. Differential equations that can account for torsion and translation–torsion coupling were established based on rigid-deck assumption for analysis. Eccentricity resources such as radius, bearing arrangement, and ground motion directions, were strategized as different bridge cases. A parametric study was conducted with the equations and controllability indices. Analysis results showed that Grammians and HSVs were effective in evaluating how and in what degree different eccentricities interacted each other and influenced the seismic responses of curved bridges, and time history analyses to four earthquake records validated the controllability analysis conclusions. This study showed that controllability-based indices provided some insight into the underlying principle between the structural internal property and the outward manifestation (regularity or symmetry). With these indices, the adverse effects from different excitation directions could be decreased by properly arranging the stiffness. Thus, making use of eccentricities could somewhat counteract the irregularities from the curved shape and excitations, making the curved bridge display some regular characteristics and then be more robust.
