Abstract
Acquired Immunodeficiency Syndrome (AIDS) is the most severe phase of Human Immunodeficiency Virus (HIV) infection. Living with HIV results in a weakened immune system, with AIDS being the final stage of HIV and puzzling the world. The current medical environment remains unable to effectively cure AIDS, with treatment depending on long-term antiretroviral therapy (ART). To effectively treat and prevent HIV, it is important to elucidate the key factors of HIV propagation. This study proposes a rough set classifier based on adding recency (R) (i.e., the last physician visit), frequency (F) (i.e., the frequency of medical visits), and monetary (M) (i.e., medication adherence) attributes and integrated attribute selection methods to generate discriminatory rules and find the core attributes of HIV. The collected data consist of 1308 HIV infection records from Taiwan. From the experimental results, the frequency of CD4+ cells in the peripheral blood is able to determine patient medication, treatment willingness, and HIV infection stages, because HIV patients are less likely to be willing to receive long-term ART. Furthermore, drug abuse is found to be the greatest cause of HIV infection. These results show that the additional RFM attributes can improve classification accuracy, with the core attributes being M, R, plasma viral load (PVL) and age. Hence, we suggest that clinical physicians use these core attributes to understand the HIV infection stages.
1. Introduction
Acquired immunodeficiency syndrome (AIDS) is one of the most significant health issues in the world. AIDS is the final stage of Human Immunodeficiency Virus (HIV) infection, which spreads through HIV particles. The virus attacks the body’s immune system to destroy immunocytes, resulting in the body being unable to fight off infection and disease. According to the World Health Organization (WHO), 36.9 million people globally were living with HIV at the end of 2017. Current medical technology has still not yet discovered an effective vaccine for HIV and patients must take long-term, highly active antiretroviral therapy (HAART), also called antiretroviral therapy (ART).
In the past, the initiation of ART depended on the frequency of CD4+ cells in the peripheral blood (also named CD4 lymphocytes [1], CD4+ T-cell counts [2]). The risk of death was higher for patients with lower frequencies of CD4+ cells in the peripheral blood [1]. Montarroyos et al. [2] found that the patient’s age, smoking status, use of illicit drugs, hospital treatment, doctor consistency, and use of ART, were factors that affected the kinetics of the CD4+ cell counts. This study proposes a rough set classifier based on adding recency, frequency, and monetary (RFM) attributes, alongside an integrated attribute selection method, to elucidate the key attributes that affect the CD4+ cell counts and generate decision rules. The generated decision rules could help to identify patients’ HIV infection stages, with the results enabling medical institutions to implement diagnostic evaluations in the early stages of the disease.
Machine learning is widely used in diverse fields, such as healthcare, financial engineering, and many other industries. Langevin et al. [3] used association rules to classify the bacteria present in nasopharyngeal specimens, and many related studies employed machine learning in HIV/AIDS-related research [4,5]. Related work, including machine learning methods, were applied to the classification of HIV-1 protease inhibitors [5], and proposed an improved rough set quick-reduct algorithm to select features of the AIDS data set [6]. Other research [7] applied data mining to predict a patients’ CD4+ cell count status.
Compared with the aforementioned research, this study provides four key contributions: (1) three modified RFM (recency, frequency, and monetary) indicators are added and verified in terms of whether they are related to HIV infection stages; (2) integrated feature selection methods are utilized to select the important attributes of the HIV infection stages; (3) the accuracy of different important attributes are evaluated to elucidate the key attributes and compare the proposed method with the listed classifiers; and (4) a rough set to generate decision rules are utilized to assist professionals with their diagnostic evaluations.
2. Related Works
This section introduces HIV/AIDS, the RFM model, attribute selection, rough set theory, and the related classifiers as follows.
2.1. HIV/AIDS Disease
According to the joint United Nations Programme on HIV/AIDS (UNAIDS, 2018), 37.9 million people worldwide live with HIV and are undergoing ART [8]. Since HIV results in the final stage of AIDS [9], the medical field is continuing to develop AIDS-related treatments. The prevailing treatment is the administration of antiretroviral medicines to control HIV, consisting of three or more antiretroviral medicines. The treatment effect of multiple different types of antiretroviral medicines is better than using a single antiretroviral medicine and reduces drug resistance. As more antiretroviral medicines became available, newer HIV drugs became safer‚ more effective, and less expensive. WHO recommends that those infected with HIV start antiretroviral medicine immediately, as the best therapeutic effect occurs before progression of the disease to CD4+ cell counts thresholds [10]. Although antiretroviral medicines are still unable to cure HIV, they exhibit a significant effect regarding the control of viral replication and help to prolong survival [11,12]. The use of antiretroviral medicines saves many lives. From WHO’s global statistics [13], the incidence of new HIV infections decreased by 37% between 2000 and 2018, with HIV-related deaths declining by 45% over the same period. To obtain the best results from antiretroviral medicines, patients must always take long-term medication. If patients stop antiretroviral medicines, or even miss multiple doses re-treatment may trigger drug resistance, rendering the antiretroviral medicines ineffective and causing the reemergence of AIDS [14].
2.2. RFM Model
The recency, frequency, and monetary (RFM) model [15] is a common behavior-based method in marketing. It includes three key performance indicators: recency, frequency, and monetary. RFM is a classic analytic and segmentation technique to identify the best customers. First, customers are given a score that represents their three RFM ratings using customer relationship management application software. Second, consumers are sorted using analytical techniques according to their value as demonstrated by their RFM scores. The sorting results indicate the best customers and create a loyalty program to promote products and/or services. The higher the RFM score, the more likely this customer is to purchase the products and/or services again. As such, the RFM model is often used in the retail industry. The definitions of the RFM model are as follows [14]:
Recency (R): When did the customer recently make a purchase? (e.g., days/months/years)? In the consumer market, the more recently the customer purchased time is close to the current time, it is more likely the consumer will purchase again. Therefore, if the customer purchased recently, they are considered a better client.
Frequency (F): How many times did the customer buy the products and/or services during a specific period (e.g., monthly, quarterly, or yearly)? That is, the customer with the highest frequency of purchases over a certain period of time is considered to have higher loyalty to the company.
Monetary Value (M): How much did the customer spend? In many cases, a specific period is set to calculate the total amount of money. If the customer’s value is higher, then they are important and worthy of the company’s attention.
2.3. Attribute Selection
Healthcare data are often highly dimensional and include many data errors, irrelevant attributes, and missing values. Some factors are not directly analyzed, which is challenging for data mining and decision-making. Attribute selection is widely used in many data mining and machine learning fields, as the advantages of attribute selection methods have been proven in many previous studies. Attribute selection methods effectively improve classification performance and reduce the cost of processing high-dimensional data [16]. Attribute selection plays an important role in classification and involves selecting a subset of variables that effectively represents the original full attributes. Attribute selection reduces the complexity of data sets and provides better results for decision makers.
Attribute selection can be categorized into three types, namely, filter models, wrapper models, and embedded models [17]. Filter models utilize the original data attributes to conduct a selection of subset classification without performing any data mining algorithms [18,19]. Wrapper models employ data mining algorithms in advance, using performance as an evaluation criterion to evaluate subsets of classification attributes. This method is suitable for the exploration of unknown data but is more expensive than filter models [18,20]. Embedded models combine the advantages of both filter and wrapper models, taking benefits of the attribute selection process, and simultaneously performing attribute selection and classification [19,21].
2.4. Rough Set Theory
Rough set theory was proposed by Pawlak in 1982 [22]. It can be applied to ambiguous data, data reduction, and data mining. Incomplete knowledge and ambiguous data have always been present in the actual environment and urgently needs to be solved. Rough sets improve the aforementioned problem and are applied throughout many fields, particularly artificial intelligence fields, such as attribute selection and data mining [23,24,25,26].
The rough set method has the following advantages: (1) Information can be processed with uncertain ambiguities; (2) basic data can be used without the requirement for any additional information; (3) hidden messages can be found in data sets; (4) the method allows for a reduction in the original data; and (5) decision rules can be generated based on data sets [27,28].
2.5. Related Classifier
Historically, disease diagnoses relied heavily on physicians. Medical data sets contain a large amount of information, including patients, diseases, and treatment methods, among others. However, recent data mining technology was effectively used to support disease diagnosis and improve diagnostic accuracy. Therefore, more researchers applied machine learning technology to the medical field. The related classifiers are introduced as follows.
2.5.1. Decision Trees
The original concept of the decision tree existed before Quinlan proposed the Iterative Dichotomiser 3 (ID3) algorithm [29] in 1979, but became popular due to the invention of ID3. A decision tree is a tree structure concept designed for the intuitive management of classification problems. A node indicates the judgment of the attribute and a branch indicates the result of the judgment. This method is an easy-to-understand representation of a decision; thus, decision trees are often used in a variety of fields. Related literature demonstrated that medical researchers usually employ decision trees to support disease diagnoses and apply decision trees to find key factors such as hypertension [30] and type 2 diabetes [31].
2.5.2. Support Vector Machine
The support vector machine (SVM) algorithm [32] is used to find a hyperplane in higher-dimensional space that distinctly classifies data points. A Library for Support Vector Machines (LibSVM) is the most popular support vector machine and was developed by Chang and Lin [33] to provide a simple SVM interface to allow easy operation, multiple SVM formulae, and powerful multiclass classification [33].
2.5.3. Random Forest
A random forest [34] is an ensemble of decision trees. The concept is to build multiple decision trees and combine them into a single ensemble model that can be utilized for both classification and regression tasks. A decision tree relies on a single tree to make classification judgments [34]. The random forest is similar to the majority rule, using multiple trees to complement each other and complete the classification judgment. A random forest is formed by multiple decision trees and can therefore manage a large variety of data in a shorter training time than a decision tree. The random forest algorithm was proven to accurately predict the diagnoses of acute appendicitis [35] and congestive heart failure [36].
2.5.4. Radial Basis Function Networks
Radial Basis Function (RBF) networks were proposed by Broomhead and Lowe [37] in 1988. RBF is a supervised learning forward network constructed to avoid model training falling into local optima and two-stage training schemes [38]. Furthermore, RBF networks solve supervised learning problems, such as regression, classification, and time-series forecast [39]. RBF networks have three layers, namely, the input layer, the hidden layer, and the output layer. The input layer is the set of source nodes, the second layer is a high-dimension hidden layer, and the output layer causes the network to respond to applied activation patterns into the input layer [40]. The advantages of the RBF approach include the partial linearity in the parameters and the availability of fast and efficient training methods [41]. The use of radial basis functions results from a number of different concepts including function approximation, noisy interpolation, density estimation, and optimal classification theory [42].
3. Proposed Method
This study aimed to find the key attributes and generate decision rules to identify HIV status. From The Body website (https://www.thebody.com/) [43], HIV damages the immune system by targeting CD4+ cells in the peripheral blood. Therefore, this study employed the CD4+ cell counts as the decision attribute (class). Patients living with HIV who have a CD4+ cell counts over 500 are usually healthy, hence, this study partitioned the CD4+ cell counts into two classes, namely, well-controlled class and the unhealthy class. The RFM model was mainly used to measure the customer lifetime value, with patients undergoing long-term, highly active antiretroviral therapy (HAART). Thus, this study modified the RFM model to measure the medicine statuses of the patients and added the modified RFM attribute to the AIDS attribute set.
Based on the aforementioned factors, this study proposed a rough set classifier based on integrated attribute selection methods to classify HIV infection stages. We first added modified RFM attributes to an attribute set and utilized five attribute selection methods to select attributes from the attribute set, then employed the proposed integrated attribute selection method to integrate the important attributes. The proposed method applied a rough set to generate decision rules and identify the patients’ HIV infection stages. This study compared the accuracy of the proposed method with the listed classifiers.
To give a brief overview of the proposed method, the proposed procedure is shown in Figure 1 and consisted of four blocks (parts), as follows: (1) data preprocessing, whereby the actual AIDS data set was collected, outliers were removed, missing values were deleted, irrelevant attributes were screened-out, and finally, numerical attribute data were discretized; (2) additional attribute adding, from the AIDS data set, the RFM model was applied to redefine the three RFM attributes to meet the AIDS attributes; (3) attribute selection, whereby five attribute selection methods were utilized to select attributes and employ the proposed integrated attribute selection method to integrate the selected attributes into the important attributes; and (4) classification, whereby the less important attributes, which had the lower ranking scores, were sequentially removed, and five classifiers (rough set, tree, LibSVM, RBF network, and random forest) were utilized to classify the AIDS data until the accuracy could not improve further. The accuracy of the proposed method was then compared with the listed classifiers.
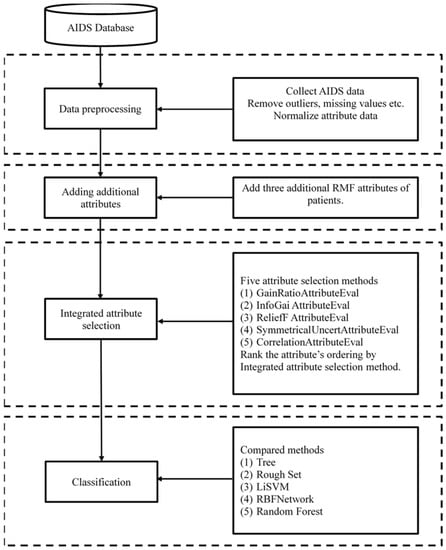
Figure 1.
Proposed procedure.
According to the four blocks of proposed procedure, we proposed four computational steps, of which the detailed steps are introduced as follows.
Step 1: Data Preprocessing
The collected AIDS data set consisted of real medical data from AIDS patients in Taiwan from January 2005 to January 2012 [44]. The original collected data set contained 18 attributes with 1321 records. Medical data sets are often influenced by human factors, causing the actual data to contain irrelevant attributes, biases and outliers, duplicated data, and missing values, among others.
The first step deleted the irrelevant attributes, biases and outliers, duplicated data, and missing values, and then corrected and cleared any incorrect data that may have affected the research results. The second step discretized the numerical attribute data as “Y or N” based on the National Taiwan University Hospital Department of Laboratory Medicine [45,46,47,48] to ensure the next step was executed correctly. In the third step, all medical records were required to be properly anonymized to protect patient privacy. After preprocessing, the AIDS data set contained 9 attributes with 1308 records, including eight conditional attributes, i.e., the patient’s age (age), gender, the cause of HIV infection (cause), the plasma viral load (PVL), platelet count (PLT_C), total bilirubin (T-bil_C), aspartate transaminase (AST_C), and alanine transaminase (ALT_C) and one decision attribute (class) was named CD4_C. According to The Body website [43], patients living with HIV with a CD4+ counts over 500 are usually in pretty good health, so this study partitioned CD4+ counts into two classes, namely, the well-controlled class and the unhealthy class. All of the detailed attributes (including the three added RFM attributes) are shown in Table 1.

Table 1.
Descriptive statistics.
Step 2: Adding Additional Attributes
The RFM model is primarily used to measure customer lifetime value. Current medical technology has not yet discovered an effective vaccine for HIV, therefore, patients must undergo long-term HAART. Hence, this study posited that the RFM model could be suitable to measure whether patients take their medicine. The original RFM model contains three attributes, namely, recency (R), frequency (F), and monetary (M). This study redefined the RFM attributes to make it more suitable to measure patients’ HAART statuses and added the modified RFM attributes to the AIDS attribute set. The redefined RFM is described as follows:
- (1)
- R (the last physician visit): The first medical record in the AIDS data set was recorded on 1 January 2005, and the last on 19 January 2012. This study divided the time interval (seven years) into five groups that were represented as code numbers 1 to 5, respectively. For example, the first time-group was ~2005/01/01–2006/05/30. If the patient’s medical treatment time fell within this time, it was identified as code 1. The second time-group was ~2006/05/31–2007/10/27, which was designated as code 2, and so on.
- (2)
- F (the frequency of medical visits): The definition of F was the number of patients’ physician visits from 1 January 2005 to 19 January 2012. In the AIDS data set, the highest frequency of patients’ physician visit was 10 and the least was 1. This study divided the visit frequency into five groups. If the number of medical visits was one or two, it was assigned code 1. Code 2 was designated for three or four visits, code 3 was for five or six visits, code 4 was for seven or eight visits, and code 5 was for nine or 10 visits.
- (3)
- M (whether or not the patient continued to take their medicine): This attribute was divided into two groups. Code 1 described a patient stopping their HAART medication. If the patient interrupted or stopped their HAART treatment, the record (patient) was assigned to this group. Code 2 was assigned to patients who continuously took HAART.
Step 3: Integrated Attribute Selection
To find the key attributes that were most relevant to the CD4+ class, five attribute selection methods were utilized to select the attributes. The five attribute selection methods were GainRatio [49], InfoGain [50,51], ReliefF [52], Symmetrical [49], and Correlation [49]. Each attribute had different importance degrees based on the five attribute selection methods. Therefore, this step proposed an integrated attribute selection method (IASM) to select the important attributes. First, after the five attribute selection methods selected their attributes, the proposed IASM utilized the importance degree of each attribute to assign scores. A higher attribute score indicated that the attribute was more important (see the second column in Table 2). Second, we added the scores of each attribute from the five attribute selection methods together and then re-ranked the attribute order (see Table 3). The ranking results denoted the order of importance of the selected attributes.
Table 2.
The results of the five attribute selections.
Table 3.
Re-ranking the order of the attributes.
Step 4: Classification
This step employed the AIDS data set to verify the proposed method and compared it with the listed classifiers (tree, random forest, LibSVM, and RBF network). This step also implemented experiments into the different attribute sets to find the key attributes and generated HIV decision rules. In experiment, we repeated 10 times and randomly sampled the AIDS data set based on 67% training data and 33% testing data, then we obtained the ten samples, each sample has 67% training data and 33% testing data to implement all of the experiments. We then compared the average accuracy of the proposed method with the listed classifiers.
4. Results
This study employed the proposed procedure and AIDS dataset to implement experiments using the different attribute sets when one attribute set received optimal accuracy, thereby allowing the key attributes to be found. In addition, this study also applied the LEM2 algorithm of the rough set to generate the HIV decision rules. In the experiments, this study partitioned the AIDS dataset into training data (67%) and testing data (33%). Random sampling was repeated 10 times to implement all of the experiments, then the proposed method was compared with the listed classifiers to find the average accuracy. Then, we divided the data into four facets to illustrate the results as follows.
4.1. Experimental Data and Attribute Selection
The original AIDS dataset from Chen [43] contained 18 attributes with 1321 records from January 2005 to January 2012. After preprocessing and adding three RFM attributes, the AIDS data set contained 12 attributes (11 conditional attributes and one class attribute) from 1308 records. The detailed descriptive statistics of all of the attributes are listed in Table 1. To test whether the sample proportions have difference between the independent attribute and the CD4+ cell counts, this study uses the sample proportion test of the 2 x 2 contingency table, the results show that the cause, R, F, and M attributes have statistically significant difference on the CD4+ cell counts as shown in the last column of Table 1. This study also uses a t-test to get the statistically significant difference (t = 14.966, p < 0.01) for the group M = 1 has higher average CD4+ cell counts.
This section applied five attribute selection methods (GainRatio, InfoGain, ReliefF, Symmetrical, and Correlation) to select the attributes. After performing the five attribute selection methods, each attribute had a different degree of importance. Table 2 shows the order of each attribute in the five attribute selection methods. M was clearly the most important attribute from the five attribute selection methods. However, the order of the other attributes could not be directly ranked. For example, the PVL attribute was listed as second in the GainRatio attribute selection method, but in the ReliefF attribute selection method, PVL was listed as 11th (the least important attribute). Hence, this study proposed an integrated attribute selection method (IASM) to integrate the selected attributes.
The proposed IASM was based on the order of each attribute to the assigned score. A higher attribute score denoted a more important attribute. After assigning scores, as shown in the second column in Table 2, we added the scores of each attribute from the five attribute selection methods as shown in Table 3, and then re-ranked the attribute order. From Table 3, it can be seen that the ordering of ReliefF was different than the other attribute selection methods; therefore, we deleted the ReliefF method to re-rank the ordering of the attributes, as shown in the fourth column of Table 3. The results showed that PVL was a more highly ranked attribute than age. The results demonstrated that the top three attributes were M, R, and PVL for the CD4+ class, and the least important attributes were ALT_C, AST_C, T-bil_C, and Gender.
4.2. Classification and Key Attributes
The less important attributes were sequentially removed and the five classifiers (rough set, tree, LibSVM, RBF network, and random forest) were utilized to classify the AIDS data until the accuracy could not be improved further, thus resulting in the key attributes being found. The parameters of the tree, the rough set, the random forest, LibSVM, and the RBF network classifiers are shown in Table 4. This study organized the experiments into four attribute sets: (1) the original attribute set (no RFM); (2) the new attribute set (adding RFM); (3) removal of the gender, T-bil, and ALT attributes; and (4) removal of the gender, T-bil, AST, and ALT attributes. The results were shown in Table 5, which denoted that adding RFM attributes was a more accurate method of prediction than not adding RFM, increasing the accuracy by 1.7%. After sequentially removing less important attributes, the retained RFM attributes improved accuracy by 3.7%. Therefore, RFM attributes were key for the identification of HIV infection stages and adding RFM attributes was an effective method.
Table 4.
The parameters of the five classifiers.
Table 5.
The results of the different attribute sets.
4.3. Decision Rule
Following on from Section 4.2, the key attributes using the LEM2 algorithm of the rough set were applied to generate the decision rules of HIV infection stage. The partial CD4+ cell counts decision rules are listed in Table 6. The top matched rule contained 52 records for class A (the unhealthy class) and six records for class B (the well-controlled class). The top class A rule and the top class B rule are explained as follows.
5. Findings and Discussion
The key findings after experimental results and comparisons are summarized as follows.
5.1. CD4+ Levels and Continued HAART Treatment
Previous studies, showed that more than one-third of patients undergoing medical treatment were considered to be late-stage, up to one-fifth of patients exhibiting CD4+ values below 100 [6]. From the generated CD4+ rules in this study, when the patient’s CD4+ value was below 500, the patient would take antiretroviral drugs. Conversely, when the patient’s CD4+ value was higher than or equal to 500, the patient would stop HAART. A lower CD4+ value resulted in significant patient discomfort in the final phase of the disease, with many patients often lacking consciousness. Therefore, this study found that comfortable patients were more likely to forget to take their medication and waited until they felt sick to visit a physician for help, only then resuming their medication regimen.
5.2. Lower Willingness to Continue Taking Antiretroviral Medications
Previous studies showed that 50%–70% of HIV patients did not continue taking antiretroviral medications, with alcohol abuse and drug abuse being the main indicators for these findings [6]. As shown in Table 1, the rate of willingness to continue taking antiretroviral medications was 29%, with the rate of stopping antiretroviral medications being 71%. Currently, an effective vaccine for HIV has not been discovered, forcing patients to undergo long-term HAART. If the patient had a high degree of compliance, the CD4+ count increased [1], HAART has been proven to be effective in reducing HIV mortality [8]. If patients do not continue to take antiretroviral medications, loss of HIV control will occur, possibly leading to death [8]. Therefore, doctors must consider the issue regarding the willingness of AIDS patients to continue HAART.
5.3. The Relationship between Drug Abuse and AIDS
Drug injectors have a high incidence of HIV, with up to 75% of new HIV patients being infected via drug use methods [12]. As shown in Table 1, 90% of patients with HIV contracted the virus from contaminated needles. Because drug abuse is one of the most pressing issues in society at present, sharing needles and injecting drugs are vital problems [10]. Effectively reducing the AIDS infection rate, decreasing the rate of drug addiction, and providing clean syringes to patients are of the utmost importance [14,15]. Therefore, all stakeholders (including the government, medical facilities, non-profit organizations, social communities, individuals, etc.) must assume responsibility to participate in and improve the aforementioned problems.
5.4. RFM Attributes and CD4+
The R in the RFM represented the time of the last visit to a physician. According to the literature [16,17], patients with increased CD4+ counts tend to be admitted to hospital for HAART treatment from this, it can be inferred that recent medical visits increase the likelihood of patients being provided with newer and better treatments. The F in the study referred to the number of medical treatments, and M represented continuous medication. When the patient had as higher rate of compliance, the CD4+ count was higher. If the treatment was interrupted midway, immunity was reduced and the viral load increased [4,5]. As shown in Table 5, adding RFM attributes was a more accurate method of prediction than not adding RFM, increasing the accuracy by 1.7%. After sequentially removing less important attributes, the retained RFM attributes improved accuracy by 3.7%. Therefore, RFM attributes were key for the identification of HIV infection stages and adding RFM attributes was an effective method. In practice, the clinicians have applied the last physician visit (R), frequency of medical visits (F), and medication adherence (M) to care for HIV/AIDS patients, the experienced clinicians could screen out the unimportant attributes, the diagonal accuracy would improve by 3.7%. Based on the RFM model, we segment the patients into five clusters by k-mean clustering [53] as shown Table 7. From Table 7, we suggest that clinicians could track the patients in cluster 2, the patients have not visit physician more than one year and five months, the frequency of medical visits ≤2, and stopping medication; The patients who in cluster 1 and cluster 3 maybe change to another hospital, the clinicians could ignore these patients because they have “no physician visit” for more than four years (Table 6).
Table 7.
RFM clustering for finding the targeted patients group.
Table 6.
The partial rules of CD4+ cell counts classification.
Unhealthy rule (class A)
If (cause = B) and (PLT_C = N) and (M=2) and (R = 4) => then (CD4_C = {A[52]}).
That is,
if the cause of the disease was high-risk sexual intercourse, and the PLT values were greater than or equal to 350 or less than 150, and the patient continued HAART, and the last physician visit was ~2009/26/03–2010/22/08, then the patient’s CD4+ value was lower than 500.
Well-controlled rule (class B):
If (cause = B) and (M = 1) and (PLT_C = Y) and (R = 3) and (F = 4) and (age = "(44.5,45.5)") = > then (CD4_C = {B[6]}).
That is,
if the cause of the disease was high-risk sexual intercourse, and, the patient stopped HAART, and the PLT values were greater than or equal to 150 or less than 350, and the last physician visit was ~2007/28/10–2009/25/03, and the number of medical visits was 7 or 8, and the age was between 45 and 46, then the patient’s CD4+ value was higher than 500.
5.5. Key Attributes
To find the key attributes, this study first utilized five attribute selection methods to select attributes from the new attribute set (including RFM), then employed the proposed integrated attribute selection method to select the important attributes. Second, the less important attributes were sequentially removed to obtain the optimal and most accurate attribute set. The order of the seven key attributes was: M, R, PVL, age, cause, F, and PLT_C.
This study also used a rough set to find the core set, which was {age, PVL}. As shown in Table 3, these two attributes ranked in the top three and four important attributes. Both PVL and CD4+ are used to assess HIV infection stages and measure the effectiveness of the ART [18]. When patients are infected with HIV, their PVL values are higher and their CD4+ cell counts are lower [16]. Previous studies [20,21] confirmed a link between age and CD4+ with older patients exhibiting lower CD4+ values [20] and younger patients showing higher repair capacity and therefore higher CD4+ values [21]. Therefore, we conclude that these two attributes have an important relationship with the CD4+ class. Furthermore, as Table 6 demonstrates, two attributes (age and PVL) simultaneously appeared in the generated decision rules. Therefore, this study selected M, R, age, and PVL as the core attributes. It is suggested that clinical physicians use these core attributes to determine the HIV infection stage.
6. Conclusions
Currently, global goals are focused on ending the AIDS epidemic by 2030. Researchers are actively exploring the best ways to end AIDS, and AIDS-related issues are popular topics of research. Based on this motivation, this study proposed a rough set theory based on adding RFM attributes to the prediction method and integrating attribute selection methods to determine HIV infection stages. The experimental results showed that the top three key attributes were M, R, and PVL. After sequentially removing the less important attributes, the order of the seven key attributes was M, R, PVL, age, cause, F, and PLT_C.
From the experimental results, the main contributions of this study are as follows: (1) the key attributes were found to generate a set of simple and understandable rules using the rough set technique; (2) the original three attributes (last physician visit, frequency of medical visits, and medication adherence) were discretized into categories of R, M, and F, with the discretized data aiming to help humans to infer in shortening time, and fast computation and generation of inference rules in machine learning; and (3) the generated rules could help physicians to diagnose patients whereby, they use the RFM model to segment the targeted patients group for managing the physician-patient relationship as RFM clustering of Table 7.
Based on the descriptive statistics of the collected dataset in Table 1, patients with CD4+ counts of <500 accounted for 73%, and the rate of ceasing antiretroviral medication was 71%, thereby showing that most of the patients only visited a physician when they were uncomfortable. Furthermore, it can be seen that the unhealthy rules (class A) had higher frequencies than the well-controlled rules, as shown in Table 5, representing that patients usually forgot to take their medication, until they felt uncomfortable, at which point they were forced to visit a physician for help and only then resumed taking their medication. Therefore, we suggest that the clinicians could use the RFM model to segment the targeted patients group as shown in Table 7. Patients with good adherence to medication and who recently visited could be identified by the physician, allowing them to only view the other key attributes, such as age and PVL. Targeted patients would be monitored more carefully by clinicians due to their potential to exhibit poorer responses to treatment.
The limitation of this study is the collected data from a regional hospital, we interview the physicians, who tell us that the collected data almost is from prisoners who have HIV infections, and the HIV+ patients may be out prison or transfer to another hospital. Hence, we have asked two physicians to evaluate the data availability and the feasibility of generated rules, they have a consistent reliability >0.7 for data availability and the feasibility of generated rules. However the results can only be used at that time (January 2005 to January 2012) and in a regional hospital case, which cannot extend to different times and samples.
Future work could include the following improvements:
- (1)
- The addition of other attributes or the use of other models in HIV/AIDS;
- (2)
- The development of feasible mobile information systems, such as the automated evaluation of HIV+ patients to aid clinical settings in the future;
- (3)
- The discretization of HIV infection stages to more classes.
Author Contributions
Conceptualization, C.-H.C.; methodology, C.-H.C. and Y.-C.W.; validation, Y.-C.W.; formal analysis: Y.-C.W.; resources, Y.-C.W.; data curation, Y.-C.W.; writing—original, draft preparation, C.-H.C. writing—review and editing, C.-H.C. All authors have read and agreed to the published version of the manuscript.
Funding
This research received no external funding.
Conflicts of Interest
The authors declare no conflict of interest.
References
- De, V.G.; Wulfsohn, M.; Fischl, M.A.; Tsiatis, A. Modeling the relationship between survival and CD4 lymphocytes in patients with AIDS and AIDS-related complex. J. Acquir. Immune Defic. Syndr. 1993, 6, 359–365. [Google Scholar]
- Montarroyos, U.R.; Miranda-Filho, D.B.; César, C.C.; Souza, W.V.; Lacerda, H.R.; Albuquerque Mde, F.; Aguiar, M.F.; Ximenes, R.A. Factors related to changes in CD4+ T-cell counts over time in patients living with HIV/AIDS: A multilevel analysis. PLoS ONE 2014, 9, e84276. [Google Scholar] [CrossRef] [PubMed]
- Langevin, S.; Pichon, M.; Smith, E.; Morrison, J.; Bent, Z.; Green, R.; Barker, K.; Solberg, O.; Gillet, Y.; Javouhey, E.; et al. Early nasopharyngeal microbial signature associated with severe influenza in children: A retrospective pilot study. J. Gen. Virol. 2017, 98, 2425–2437. [Google Scholar] [CrossRef] [PubMed]
- Oliveira, A.; Faria, B.M.; Gaio, R.A.; Reis, L. Data mining in HIV-AIDS surveillance system: Application to portuguese data. J. Med Syst. 2017, 41, 51. [Google Scholar] [CrossRef] [PubMed]
- Ko, G.M.; Reddy, A.S.; Kumar, S.; Bailey, B.A.; Garg, R. Computational analysis of HIV-1 protease protein binding pockets. J. Chem. Inf. Model. 2010, 50, 1759–1771. [Google Scholar] [CrossRef]
- Prabhu, P.; Duraiswamy, K. Feature selection for HIV database using rough system. In Proceedings of the 2010 Second International conference on Computing, Communication and Networking Technologies, Karur, India, 29–31 July 2010; pp. 1–6. [Google Scholar]
- Haile Mariam, T. Application of Data Mining Techniques for Predicting CD4 Status of Patients on ART in Jimma and Bonga Hospitals, Ethiopia. J. Health Med. Inform. 2015, 6, 208. [Google Scholar] [CrossRef]
- UNAIDS (The Joint United Nations Programme on HIV/AIDS). 2018. Available online: http://www.unaids.org/sites/default/files/media_asset/unaidsdata-2018_en.pdf#page=4&zoom=auto,-62,843 (accessed on 20 December 2018).
- Gallo, R.C.; Montagnier, L. The discovery of HIV as the cause of AIDS. N. Engl. J. Med. 2003, 349, 2283–2285. [Google Scholar] [CrossRef]
- Ford, N.; Meintjes, G.; Vitoria, M.; Greene, G.; Chiller, T. The evolving role of CD4 cell counts in HIV care. Curr. Opin. HIV AIDS 2017, 12, 123–128. [Google Scholar] [CrossRef]
- Pezzotti, P.; Napoli, P.A.; Acciai, S.; Boros, S.; Urciuoli, R.; Lazzeri, V.; Rezza, G.; Group, T.A.S. Increasing survival time after AIDS in Italy: The role of new combination antiretroviral therapies. AIDS 1999, 13, 249–255. [Google Scholar] [CrossRef]
- Hogg, R.S.; O’Shaughnessy, M.V.; Gataric, N.; Yip, B.; Craib, K.; Schechter, M.T.; Montaner, J.S. Decline in deaths from AIDS due to new antiretrovirals. Lancet 1997, 349, 1294. [Google Scholar] [CrossRef]
- WHO. HIV/AIDS. 15 November 2019. Available online: https://www.who.int/news-room/fact-sheets/detail/hiv-aids?fbclid=IwAR1y8FK_whe2s7K7SGGraydiwoMNjl6WGvnN4c9JYYGpRi2-50wPp7JLkew (accessed on 20 December 2019).
- Bangsberg, D.R.; Perry, S.; Charlebois, E.D.; Clark, R.A.; Roberston, M.; Zolopa, A.R.; Moss, A. Non-adherence to highly active antiretroviral therapy predicts progression to AIDS. AIDS 2001, 15, 1181–1183. [Google Scholar] [CrossRef] [PubMed]
- Tsiptsis, K.; Chorianopoulos, A. Data Mining Techniques in CRM: Inside Customer Segmentation; Wiley: Hoboken, NJ, USA, 2009. [Google Scholar]
- Cai, J.; Luo, J.; Wang, S.; Yang, S. Feature selection in machine learning: A new perspective. Neurocomputing 2018, 300, 70–79. [Google Scholar] [CrossRef]
- Tang, J.; Alelyani, S.; Liu, H. Feature selection for classification: A review. Data Classif. Algorithms Appl. 2014, 37, 37–64. [Google Scholar]
- Liu, H.; Yu, L. Toward integrating feature selection algorithms for classification and clustering. IEEE Trans. Knowl. Data Eng. 2005, 17, 491–502. [Google Scholar]
- Tuo, Q.; Zhao, H.; Hu, Q. Hierarchical feature selection with subtree based graph regularization. Knowl. Based Syst. 2019, 163, 996–1008. [Google Scholar] [CrossRef]
- Guyon, I.; Elisseeff, A. An introduction to variable and feature selection. J. Mach. Learn. Res. 2003, 3, 1157–1182. [Google Scholar]
- Chandrashekar, G.; Sahin, F. A survey on feature selection methods. Comput. Electr. Eng. 2014, 40, 16–28. [Google Scholar] [CrossRef]
- Pawlak, Z. Rough sets. Int. J. Comput. Inf. Sci. 1982, 11, 341–356. [Google Scholar] [CrossRef]
- Chen, H.; Li, T.; Fan, X.; Luo, C. Feature selection for imbalanced data based on neighborhood rough sets. Inf. Sci. 2019, 483, 1–20. [Google Scholar] [CrossRef]
- Sheeja, T.; Kuriakose, A.S. A novel feature selection method using fuzzy rough sets. Comput. Ind. 2018, 97, 111–121. [Google Scholar] [CrossRef]
- Kumar, S.S.; Inbarani, H.H. Optimistic multi-granulation rough set based classification for medical diagnosis. Procedia Comput. Sci. 2015, 47, 374–382. [Google Scholar] [CrossRef]
- Yıldırım, E.G.; Karahoca, A.; Uçar, T. Dosage planning for diabetes patients using data mining methods. Procedia Comput. Sci. 2011, 3, 1374–1380. [Google Scholar] [CrossRef][Green Version]
- Mahapatra, S.; Mahapatra, S. Attribute selection in marketing: A rough set approach. IIMB Manag. Rev. 2010, 22, 16–24. [Google Scholar] [CrossRef]
- Suraj, Z. An introduction to rough set theory and its applications. In Proceedings of the ICENCO’2004, Cairo, Egypt, 27–30 December 2004. [Google Scholar]
- Quinlan, J.R. Induction of decision trees. Mach. Learn. 1986, 1, 81–106. [Google Scholar] [CrossRef]
- Tayefi, M.; Esmaeili, H.; Karimian, M.S.; Zadeh, A.A.; Ebrahimi, M.; Safarian, M.; Nematy, M.; Parizadeh, S.M.R.; Ferns, G.A.; Ghayour-Mobarhan, M. The application of a decision tree to establish the parameters associated with hypertension. Comput. Methods Programs Biomed. 2017, 139, 83–91. [Google Scholar] [CrossRef]
- Ramezankhani, A.; Pournik, O.; Shahrabi, J.; Khalili, D.; Azizi, F.; Hadaegh, F. Applying decision tree for identification of a low risk population for type 2 diabetes. Tehran Lipid and Glucose Study. Diabetes Res. Clin. Pract. 2014, 105, 391–398. [Google Scholar] [CrossRef]
- Cortes, C.; Vapnik, V. Support-vector networks. Mach. Learn. 1995, 20, 273–297. [Google Scholar] [CrossRef]
- Chang, C.-C.; Lin, C.-J. LIBSVM: A library for support vector machines. ACM Trans. Intell. Syst. Technol. 2011, 2, 27. [Google Scholar] [CrossRef]
- Ho, T.K. Random decision forests. In Proceedings of the Third International Conference on Document Analysis and Recognition, Montreal, QC, Canada, 14–16 August 1995; pp. 278–282. [Google Scholar]
- Hsieh, C.-H.; Lu, R.-H.; Lee, N.-H.; Chiu, W.-T.; Hsu, M.-H.; Li, Y.-C.J. Novel solutions for an old disease: Diagnosis of acute appendicitis with random forest, support vector machines, and artificial neural networks. Surgery 2011, 149, 87–93. [Google Scholar] [CrossRef]
- Masetic, Z.; Subasi, A. Congestive heart failure detection using random forest classifier. Comput. Methods Programs Biomed. 2016, 130, 54–64. [Google Scholar] [CrossRef]
- Broomhead, D.S.; Lowe, D. Multivariable functional interpolation and adaptive networks. Complex Syst. 1988, 2, 321–355. [Google Scholar]
- Ganapathy, K.; Vaidehi, V.; Chandrasekar, J.B. Optimum steepest descent higher level learning radial basis function network. Expert Syst. Appl. 2015, 42, 8064–8077. [Google Scholar] [CrossRef]
- Brandstetter, P.; Kuchar, M. Sensorless control of variable speed induction motor drive using RBF neural network. J. Appl. Logic 2017, 24, 97–108. [Google Scholar] [CrossRef]
- Anish, C.M.; Majhi, B. Hybrid nonlinear adaptive scheme for stock market prediction using feedback FLANN and factor analysis. J. Korean Stat. Soc. 2016, 45, 64–76. [Google Scholar] [CrossRef]
- Pottmann, M.; Jörgl, H.P. Radial basis function networks for internal model control. Appl. Math. Comput. 1995, 70, 283–298. [Google Scholar] [CrossRef]
- Morlini, I. Radial basis function networks with partially classified data. Ecol. Model. 1999, 120, 109–118. [Google Scholar] [CrossRef]
- Project, T.W. The Body. Available online: http://www.thebody.com/content/58838/understanding-cd4-cells-and-cd4-cell-tests.html?getPage=1#hiv (accessed on 24 February 2019).
- Chen, Y.-S. A comprehensive identification-evidence based alternative for HIV/AIDS treatment with HAART in the healthcare industries. Comput. Methods Programs Biomed. 2016, 131, 111–126. [Google Scholar] [CrossRef]
- Department of Laboratory Medicine, National Taiwan University Hospital. Blood Biological Reference Interval. Available online: https://wwwsp.ntuh.gov.tw/labmed/%E6%AA%A2%E9%A9%97%E7%9B%AE%E9%8C%84/Lists/service/DispForm.aspx?ID=381&Source=https%3A%2F%2Fwwwsp.ntuh.gov.tw%2Flabmed%2F%25e6%25aa%25a2%25e9%25a9%2597%25e7%259b%25ae%25e9%258c%2584%2FPages%2FA.aspx%3FTXT%3DAST%25EF%25BC%2588GOT%25EF%25BC%2589%26button%3D%25E9%2580%2581%25E5%2587%25BA&ContentTypeId=0x01003E4C6DCCAFBEF64BACFA9B88DBDEF416&fbclid=IwAR2GLgtSjEWmkz-YvxxOkawv-yOUUZhVZyKeEUz5vZyPIgSfHoJ6GMVEOJ0 (accessed on 26 December 2019).
- Department of Laboratory Medicine, National Taiwan University Hospital. Clinical Laboratory Manual. Available online: https://wwwsp.ntuh.gov.tw/labmed/%E6%AA%A2%E9%A9%97%E7%9B%AE%E9%8C%84/Lists/service/DispForm.aspx?ID=377&Source=https%3A%2F%2Fwwwsp.ntuh.gov.tw%2Flabmed%2F%25e6%25aa%25a2%25e9%25a9%2597%25e7%259b%25ae%25e9%258c%2584%2FPages%2FA.aspx%3FTXT%3DALT%26button%3D%25E9%2580%2581%25E5%2587%25BA&ContentTypeId=0x01003E4C6DCCAFBEF64BACFA9B88DBDEF416&fbclid=IwAR1rOXhAWFODgGwxCAtWNdN2cKl4JlhNTcHfXR1mLHLeCH91x11O365PhDc (accessed on 26 December 2019).
- Department of Laboratory Medicine, National Taiwan University Hospital. Clinical Laboratory Manual. Available online: https://wwwsp.ntuh.gov.tw/labmed/%E6%AA%A2%E9%A9%97%E7%9B%AE%E9%8C%84/Lists/service/DispForm.aspx?ID=383&Source=https%3A%2F%2Fwwwsp.ntuh.gov.tw%2Flabmed%2F%25e6%25aa%25a2%25e9%25a9%2597%25e7%259b%25ae%25e9%258c%2584%2FPages%2FA.aspx%3FTXT%3DBilirubin-T%26button%3D%25E9%2580%2581%25E5%2587%25BA&ContentTypeId=0x01003E4C6DCCAFBEF64BACFA9B88DBDEF416&fbclid=IwAR3IQubED7Y7etirAdxwCS5WCgxfBtGPKSfu1X6k61i0LxhDv7po6w-opTY (accessed on 26 December 2019).
- Department of Laboratory Medicine, National Taiwan University Hospital. Clinical Laboratory Manual. Available online: https://health.ntuh.gov.tw/health/hrc_v3/DataFiles/kensa.htm (accessed on 26 December 2019).
- Han, J.; Pei, J.; Kamber, M. Data Mining: Concepts and Techniques; Elsevier: Amsterdam, The Netherlands, 2011. [Google Scholar]
- Hall, M.A. Correlation-Based Feature Selection for Machine Learning. Ph.D. Thesis, The University of Waikato, Hamilton, New Zealand, 1999. [Google Scholar]
- Kononenko, I. Estimating attributes: Analysis and extensions of RELIEF. In Proceedings of the 7th European Conference on Machine Learning (ECML’94), Catania, Italy, 6–8 April 1994; pp. 171–182. [Google Scholar]
- Kira, K.; Rendell, L.A. A practical approach to feature selection. In Proceedings of the Ninth International Workshop on Machine Learning, Aberdeen, Scotland, 1–3 July 1992; pp. 249–256. [Google Scholar]
- Forgy, E.W. Cluster analysis of multivariate data: Efficiency versus interpretability of classifications. Biometrics 1965, 21, 768–769. [Google Scholar]

© 2020 by the authors. Licensee MDPI, Basel, Switzerland. This article is an open access article distributed under the terms and conditions of the Creative Commons Attribution (CC BY) license (http://creativecommons.org/licenses/by/4.0/).