Abstract
In this study, the principle of minimum spectral energy leakage is applied, and the mathematical model is also established by the general function through adding different constraints. To allow the target baseband signal to have a high-quality time-domain representation, it is assumed that the baseband signal is an even function. The time-domain waveform has symmetry about the y-axis, and the objective function is obtained by Fourier series approximation. The frequency-domain characteristics of the baseband signals are obtained by adding the energy limitation condition and the boundary restriction condition. Limit a point at the appropriate position of the main lobe of the normalized energy spectral density function, and at the same time, limit the appropriate point at the first side lobe. The changes of the points modified the whole characteristic of the frequency-domain. To more conveniently compare the characteristics of the signal under different constraints, according to the symmetry of the frequency-domain of the signal, the normalized energy spectrum main lobe energy ratio is defined as a parameter, and thereby the spectral performance of the signal is discriminated by the size of this parameter. Through comparative analysis, the signal with the frequency-domain restriction conditions added has a larger normalized energy spectrum main lobe energy ratio. With increasing roll-off factor n, the energy ratio of the main energy spectrum of the normalized spectrum increases accordingly, i.e., the energy leakage is effectively suppressed. The baseband signal can be considered more suitable as a modern wireless communication system and can be obtained by adding a suitable restriction condition and establishing a model with a general function.
1. Introduction
Wireless communication technology has been advancing at an immense pace with the rapid development of science, technology, and civilization. This technology has seen numerous advances, bringing more convenience to people’s production and lifestyle; however, at the same time, its development is still facing great challenges. One of the main problems is the increasing strain on the wireless spectrum resources. Therefore, many novel schemes have been put forth to address this problem. One of the representative schemes starts with the modulation method [1,2,3,4,5]. The purpose of this method is to use modulation to improve the transmission rate of the communication system and reduce the energy leakage of the frequency band. Typical representative is the orthogonal frequency division multiplexing (OFDM) technique [6,7,8,9]. Mesleh et al. proposed that spatial modulation technology should be applied to OFDM as a multi-antenna transmission technique, and that multiple-input multiple-output (MIMO) technology is used to effectively improve the spectral efficiency [10]. However, since the OFDM scheme uses a rectangular prototype filter, it is inevitable that the side lobes of the spectrum are large in the frequency-domain, thereby affecting the spectral efficiency. Based on the requirement of efficient use of spectrum performance, modulation techniques such as generalized frequency division multiplexing (GFDM) and filter bank multi-carrier (FBMC) were proposed for 5G technology [11,12,13,14,15,16]. Michailow et al. proposed the GFDM modulation method, which no longer uses a single prototype filter, by using a richer Nyquist filter bank to generate baseband signal waveform. This technique effectively lowers the out-of-band power leakage level than the out-of-band power leakage of the OFDM systems [17]. The FBMC technology is designed for the filter bank in order for much possible energy to be concentrated on the main lobe, improving the spectral efficiency [18,19,20,21].
This paper aims to solve the target baseband signal by adding different constraints and establishing a general function model using the principle of minimum spectral energy leakage. The target baseband signal is set as an even function to have a high-quality time-domain representation, and the time-domain waveform is symmetrical about the y-axis. The objective function is obtained by Fourier series approximation. With the continuous development of wireless communication and more demanding requirement of frequency spectrum, the signal obtained with only energy and boundary restrictions has relatively excellent spectrum properties in the frequency-domain. After adding the frequency-domain restriction condition, the baseband signal with high-quality characteristics is obtained by MATLAB software and compared to the baseband signal obtained under the original conditions. To conveniently compare the characteristics of the signal under different constraints based on the symmetry of the frequency-domain of the signal, the normalized energy spectrum main lobe energy ratio is defined as a parameter, and the spectral performance of the signal depends on the size of this parameter. Using contrast analysis, the signal with the frequency-domain constraint added has a larger normalized energy spectrum main lobe energy ratio. With increasing roll-off factor n, the energy ratio of the main energy spectrum of the normalized spectrum increases accordingly. The baseband signal is more suitable as a modern wireless communication system and can be obtained just by adding a suitable restriction condition and establishing a model with a general function.
2. General Function Model with the Minimal Spectral Energy Leakage
To obtain better spectrum use with the baseband signals, the general function model is constructed using the principle of minimum spectral energy leakage and it can be expressed as follows [22]:
In Equation (1), define as the roll-off convergence function of the spectral density of the target signal, and is defined as the energy spectrum density of the target signal. The target signal has a length of T in the time-domain, and is set as an even function. Thus, the frequency-domain function obtained by the Fourier transform of will not have an imaginary part. Thus, is expressed as follows:
Obviously, is a rising function about the y-axis symmetry, and n depends on the spectral energy leakage of the target signal has. To obtain an accurate integration result by using Equation (1), the energy spectral density of is required to have a roll-off speed faster than the rising speed, thus achieving the goal of limiting the target signal to have a specific falling speed in the frequency-domain.
By applying the Taylor series expansion method, the even function property of the impulse signal , and the inverse Fourier transform, Equation (1) can be written as follows: Thus, (1) can be written as follows:
where is the -order derivative of .
Equation (3) shows that the initial problem can be transformed into the problem of solving the target signal when the minimum value of J is taken according to the minimum spectral energy leakage principle.
3. Limitations of the General Function Model
To enable the target signal to have high-quality time-frequency properties, simply using the above-established general function model is not enough, and different restrictions must be applied to it. For , according to its time-domain length, its energy needs to be a certain value, i.e., its energy cannot be infinite. The energy limitation of a single signal is expressed as:
where the energy value of a single signal is taken as a unit value of 1. To concentrate the energy of the target signal on the main lobe, the time-domain boundary constraints are added. The constraint signal is much smoother at the boundary; therefore, its peak value increases accordingly. A single signal satisfies the order derivative value of at the end of the time-domain, and the time-domain value is zero at the . The specific form is expressed as follows:
The baseband signals with high-quality can be obtained by applying the above two constraints; however, the suppression of spectral energy leakage is limited. To further improve the spectrum use efficiency, the following two frequency-domain restriction conditions are added, and there is a mutual constraint relationship between the two restriction conditions. The specific expressions is expressed as follows:
where is the frequency value corresponding to a certain point of the main lobe portion of the frequency-domain, and corresponds to the energy spectral density value corresponding to . The purpose of adding this limiting condition is to increase the corresponding spectral density value of the point. If is used as the original spectral density value of , then , and is the frequency value corresponding to a point of the first side lobe adjacent to the main domain of the frequency-domain, and corresponds to the energy density value corresponding to . The purpose of adding the constraint condition is to reduce the corresponding spectral density value of the point. If is used as the original spectral density value of , then . According to the above four constraints, the specific Lagrange equation can be expressed as follows:
Since is an even function, Fourier series expansion can be used.
The Fourier series coefficient is expressed as:
Substituting Equations (9) and (10) into Equation (8), the unknown variables in the Lagrange equation are the Fourier series and the Lagrange coefficients. As long as these unknown variables are solved by MATLAB software, the target signal a(t) can be obtained. Thus, the Lagrange equation can be expressed as follows:
Furthermore, the Lagrange equation is expressed as follows:
To solve the target signal by variational calculus, the Lagrange equation needs to satisfy the following equations:
4. Solution and Analysis of Signal with High-Quality Spectrum Characteristics
4.1. Numerical Solution of Signal with High-Quality Spectral Characteristics
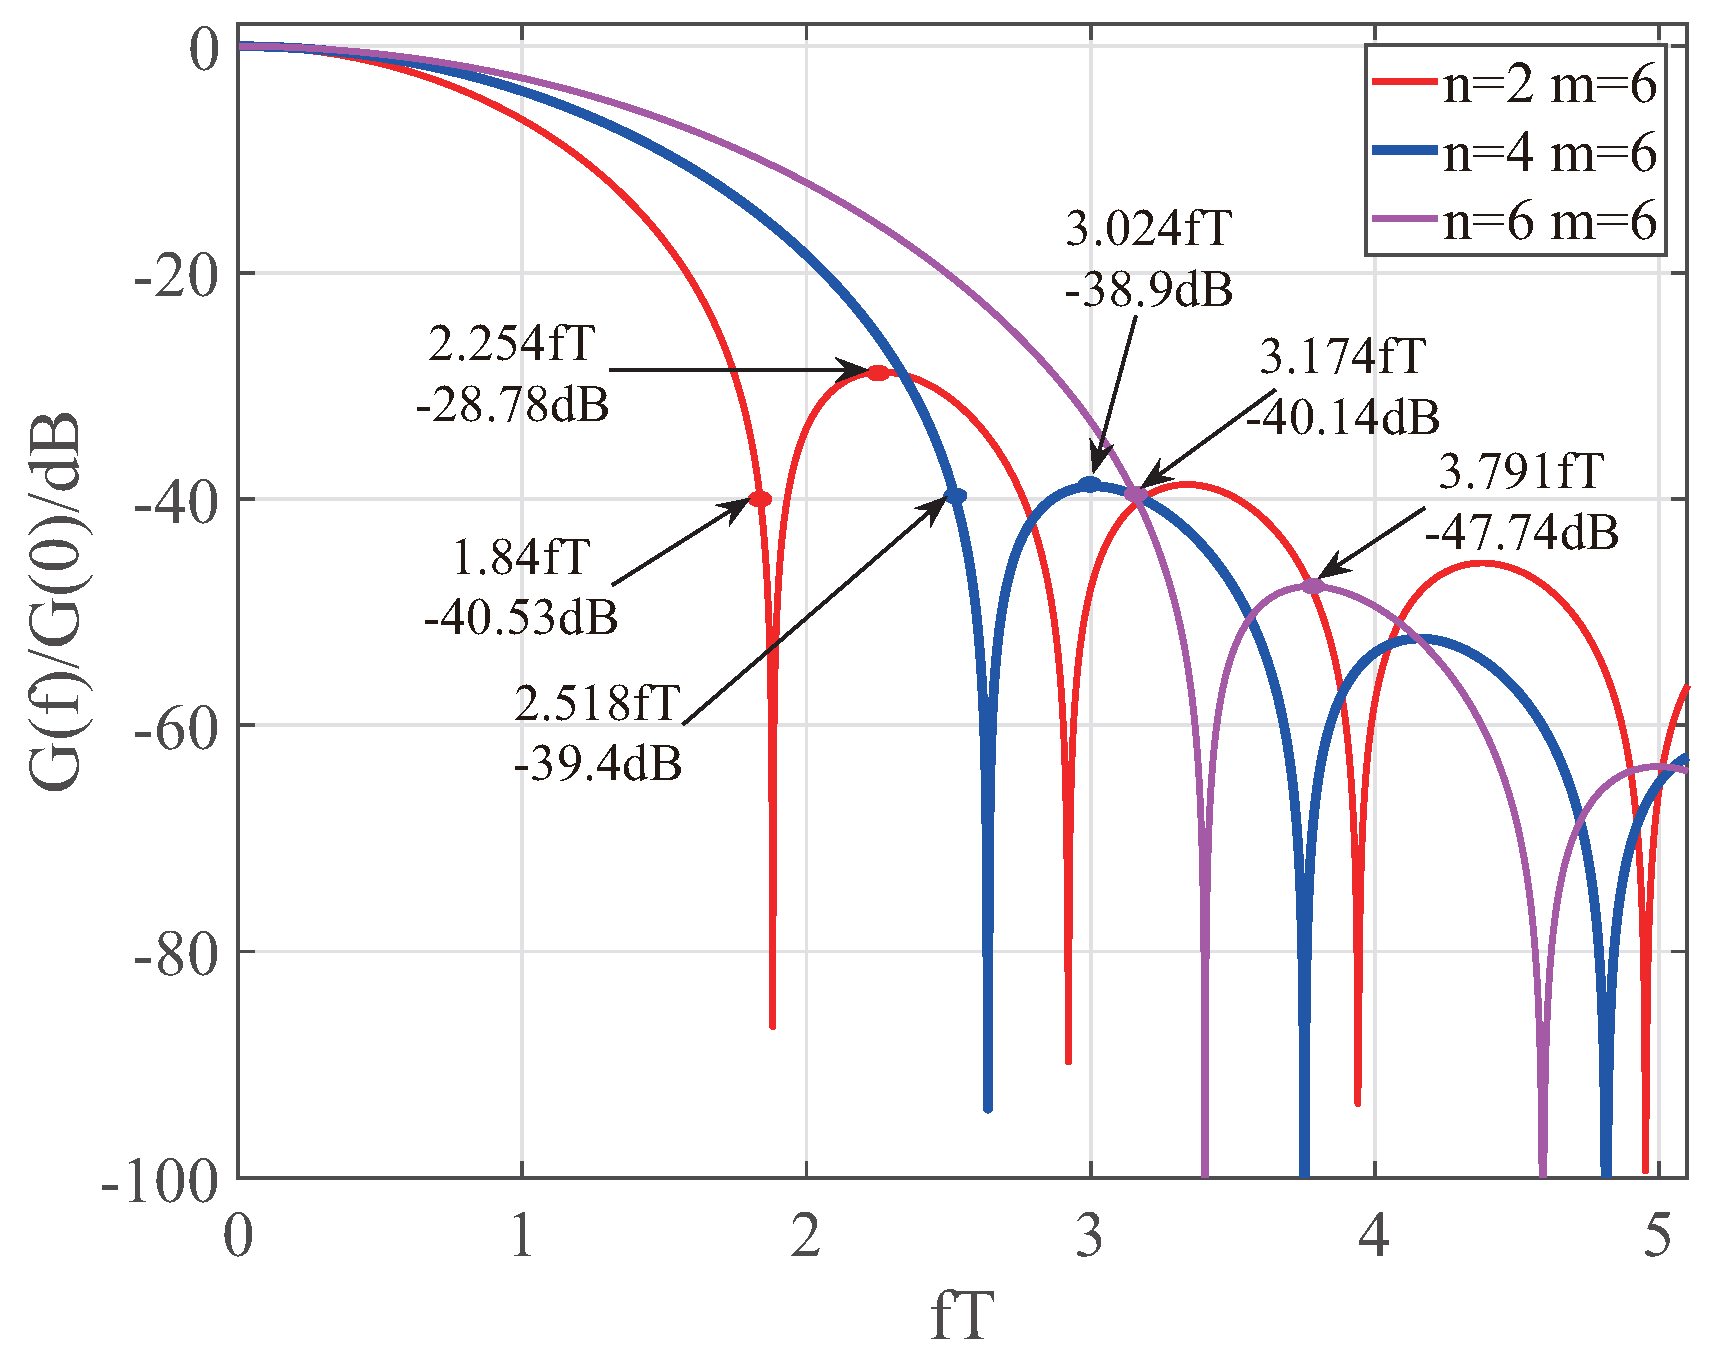
According to the energy limitation condition of a single signal, boundary constraints, and two spectrally constrained conditions with flexible changes, the corresponding Fourier series numerical solution were obtained. The frequency-domain constraints should be determined based on the spectral density of the baseband signal obtained under the energy and boundary constraints of a single signal. Since the signal spectral densities at the same n value are substantially coincident when the frequency-domain restriction conditions are not added, n = 2, m = 6, n = 4, m= 6 and n = 6, and m = 6 are taken as a reference. Figure 1 shows the relevant selection locations.
Figure 1.
Location of frequency-domain constraints selected from normalized energy spectra of different n values.
In Figure 1, a total of six points are selected, each of which is a set of frequency-domain constraints and will be discussed in the context of obtaining the Fourier coefficients of the corresponding signals. When the roll-off index n = 2, the time-domain length T of the signal equals 1, and the energy E = 1. The Fourier series coefficients of the corresponding baseband signal are obtained when the number of terms of the Fourier series m has different values. According to the boundary constraints: , the frequency-domain conditions: (1.84 fT, −40.53 dB) is limited to (1.84 fT, −20 dB), and (2.254 fT, −28.78 dB) is limited to (2.254 fT, −60 dB). The specific expression after the restriction condition is as follows:
MATLAB is applied to solve the Fourier series, and the relevant data are listed in Table 1:
Table 1.
The roll-off index n = 2, the coefficients of the Fourier series of the corresponding baseband signal at different values of the Fourier series m.
When the roll-off index n = 4, the time-domain length T of the signal equals 1, and the energy E equals 1. The Fourier series coefficients of the corresponding baseband signal are obtained when the number of terms of the Fourier series m has different values. According to the boundary constraints: , the frequency-domain conditions: (2.518 fT, −39.4 dB) is limited to (2.518 fT, −20 dB), and (3.024 fT, −38.9 dB) is limited to (3.024 fT, −100 dB). The specific expression after the restriction condition is as follows:
MATLAB is applied to solve the Fourier series, and the relevant data are shown in Table 2:
Table 2.
The roll-off index n = 4, the coefficients of the Fourier series of the corresponding baseband signal at different numbers of terms of the Fourier series m.
When the roll-off index n = 6, the time-domain length T of the signal equals 1, and the energy E equals 1. The Fourier series coefficients of the corresponding baseband signal are obtained when the number of terms of the Fourier series m has different values. According to the boundary constraints: , the frequency-domain conditions: (3.174 fT, −39.96 dB) is limited to (3.174 fT, −20 dB), and (3.791 fT, −47.94 dB) is limited to (3.791 fT, −100 dB).The specific expression after the restriction condition is as follows:
MATLAB is applied to solve the Fourier series, and the relevant data are shown in Table 3:
4.2. Comparative Analysis of Energy Spectrum under Different Constraints
The data in Table 1 and Table 2 are obtained by forcing the frequency-domain characteristics based on the energy limitation conditions and boundary limitation conditions. Therefore, it is necessary to compare the optimized signal in the frequency-domain with the original optimized signal in the time-domain and frequency-domain. For comparison purposes, the function normalized energy spectrum main lobe energy is defined as follows:
where n is the corresponding roll-off index in the general function model, m is the value of the Fourier series term, is the energy occupied by the corresponding main lobe, and is the target signal. The value of the spectral density at the zero point, , represents the boundary frequency of the positive half-axis of the main lobe. According to the data in Table 1, the Fourier series is used to construct the signal with n = 2 and m = 6:
When the frequency-domain restriction condition is not added, the signal constructed by the Fourier series when n = 2 and m = 6 is as follows:
According to the data in Table 2, the Fourier series is used to construct the signal with n = 4 and m = 6, and the resulting Equation is as follows:
When the frequency-domain restriction condition is not added, the signal constructed by the Fourier series when n = 4 and m = 6 is as follows:
According to the data in Table 3, the Fourier series is used to construct the signal with n = 6 and m = 6:
When the frequency-domain restriction condition is not added, the signal constructed by the Fourier series at n = 6 and m = 6 is as follows:
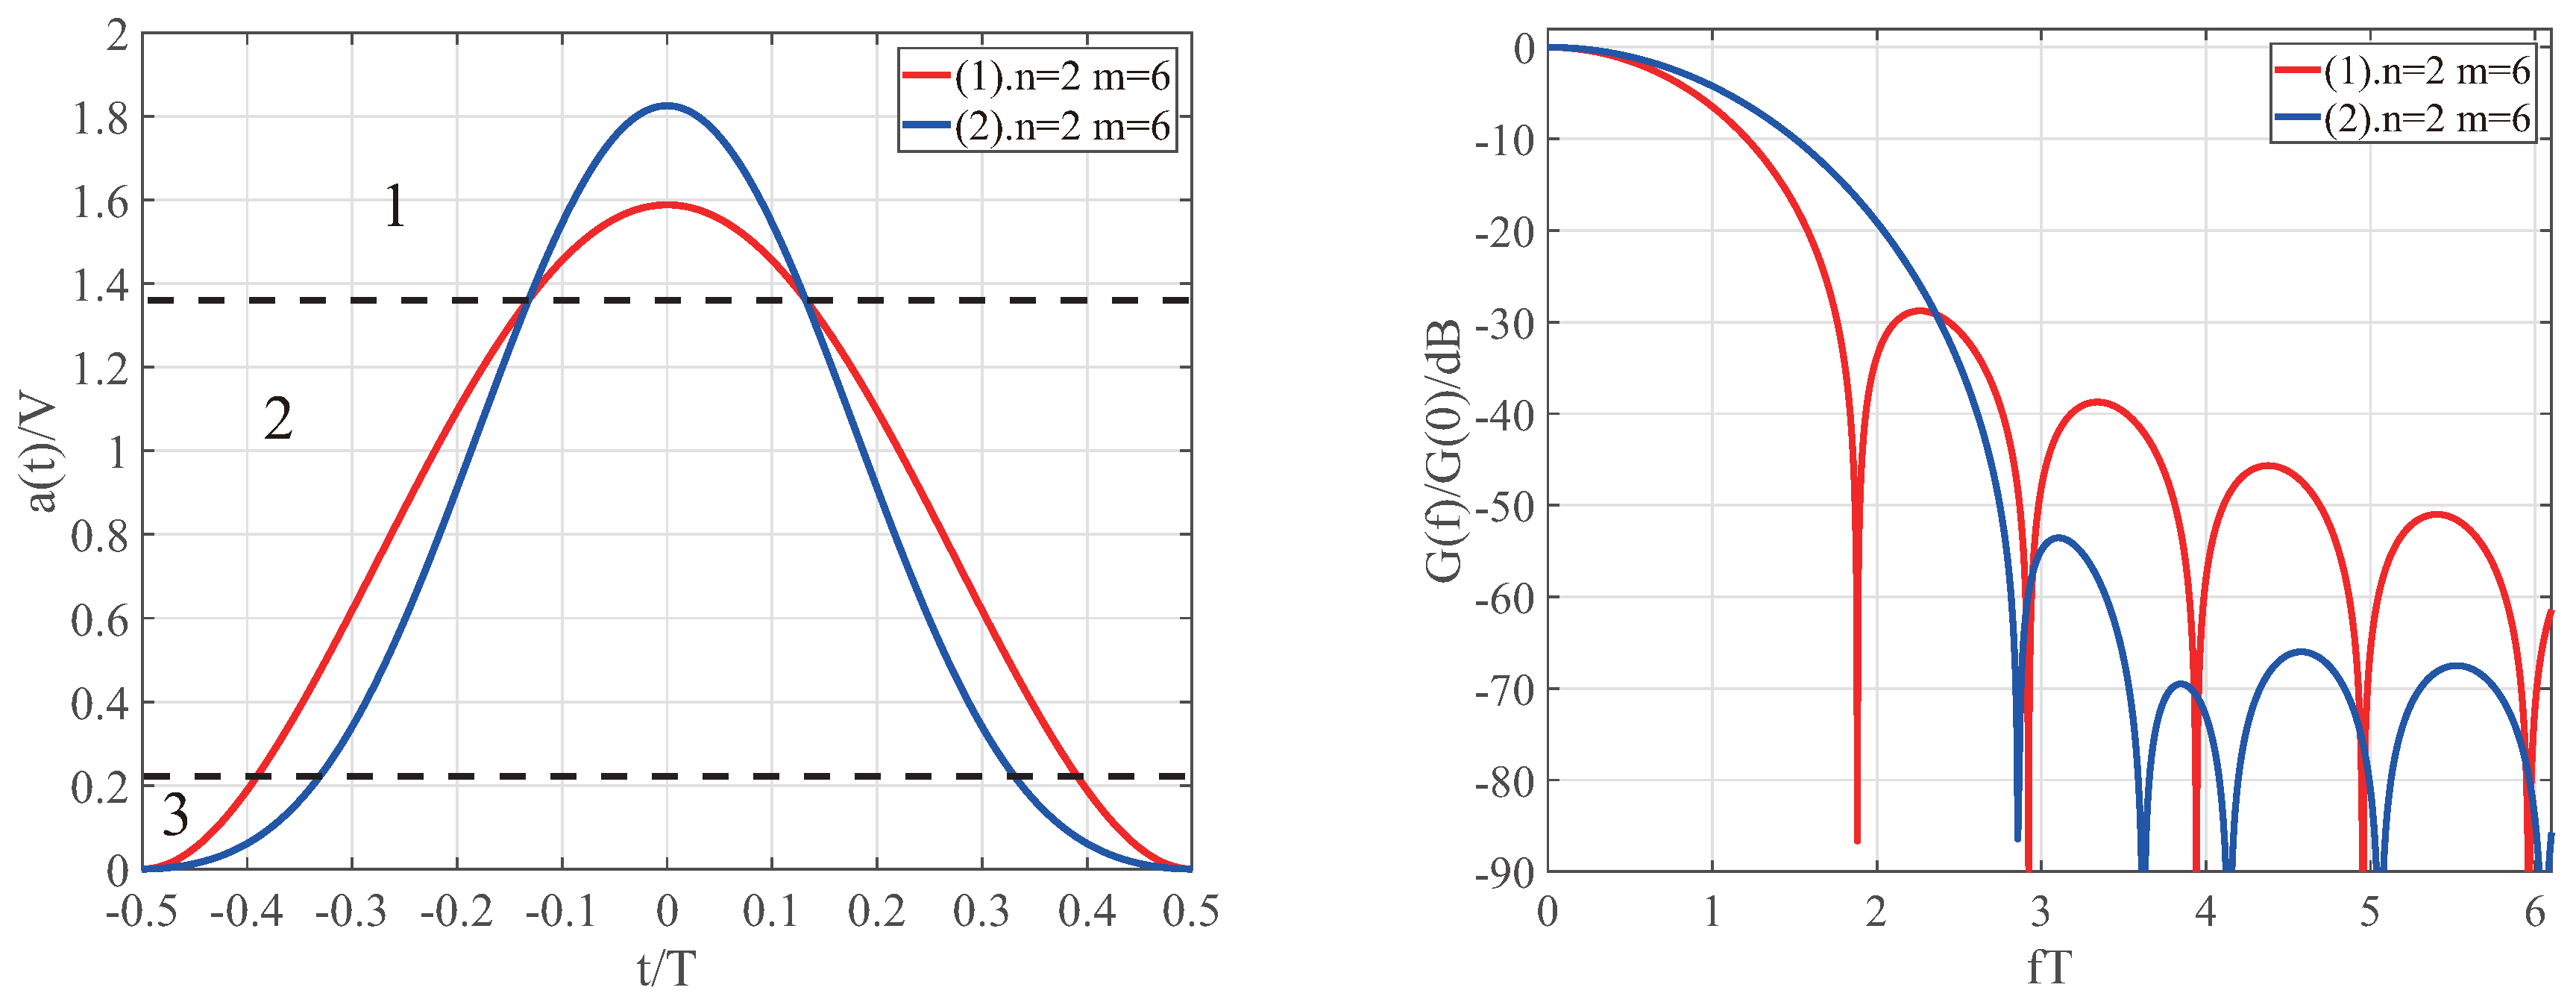
The corresponding time-domain signals and their normalized energy spectrum density can be obtained from Equations (17) and (18), as shown in Figure 2, where line (1) represents the signal when there is only energy and boundary limitations, and line (2) represents the signal under the additional frequency-domain limitations.
Figure 2.
Time-domain plots and normalized energy density plots for n = 2, m = 6 under different constraints.
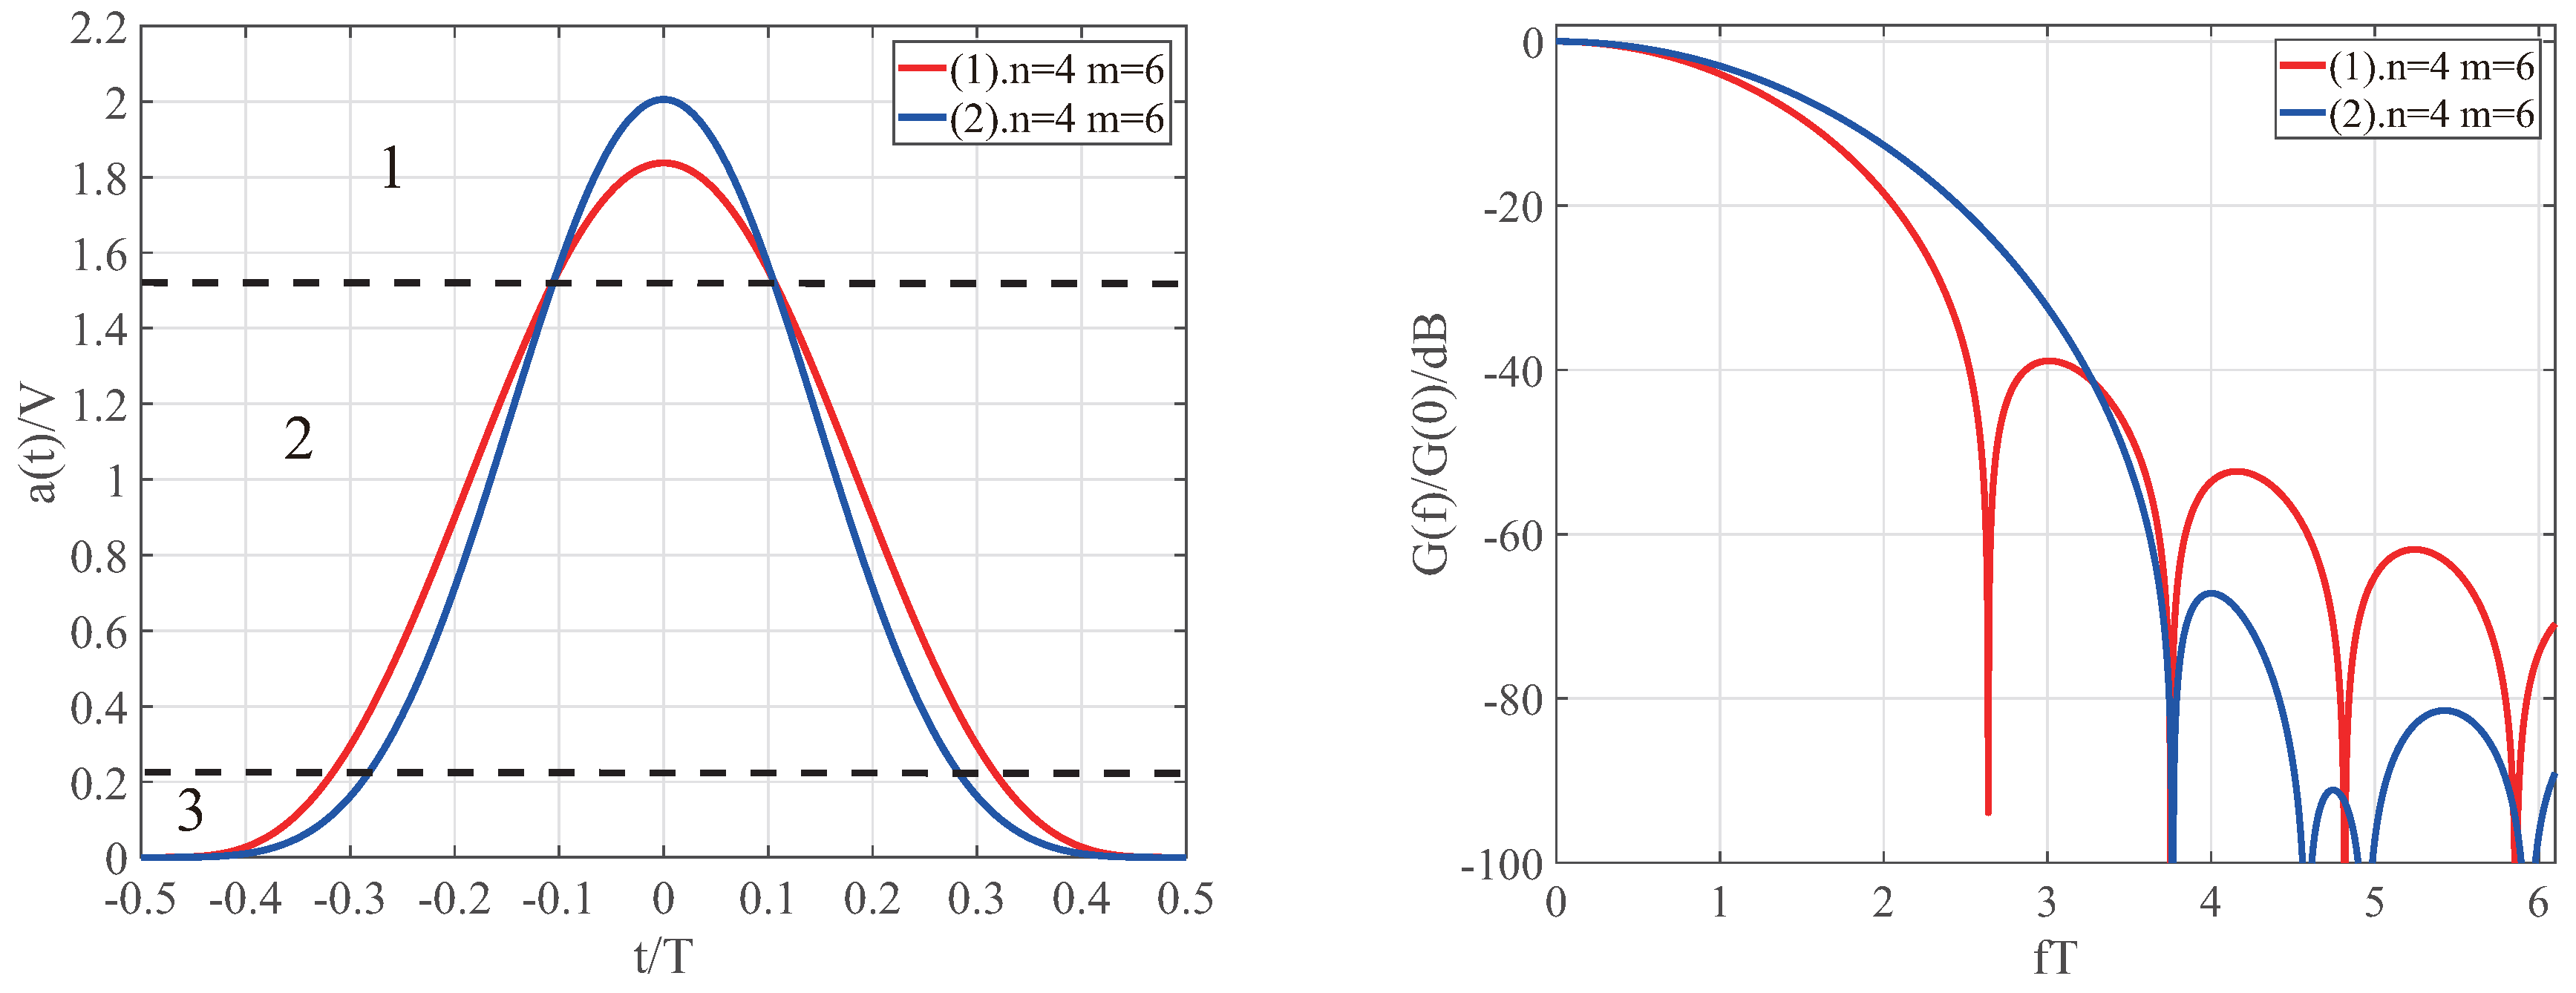
The corresponding time-domain signals and their normalized energy spectrum density can be obtained from Equations (19) and (20), as shown in Figure 3, where line (1) represents the signal under only energy limitation and boundary limitation, and line (2) represents the signal under the additional frequency-domain limitation condition.
Figure 3.
Time-domain plots and normalized energy density plots for n = 4, m = 6 under different constraints.
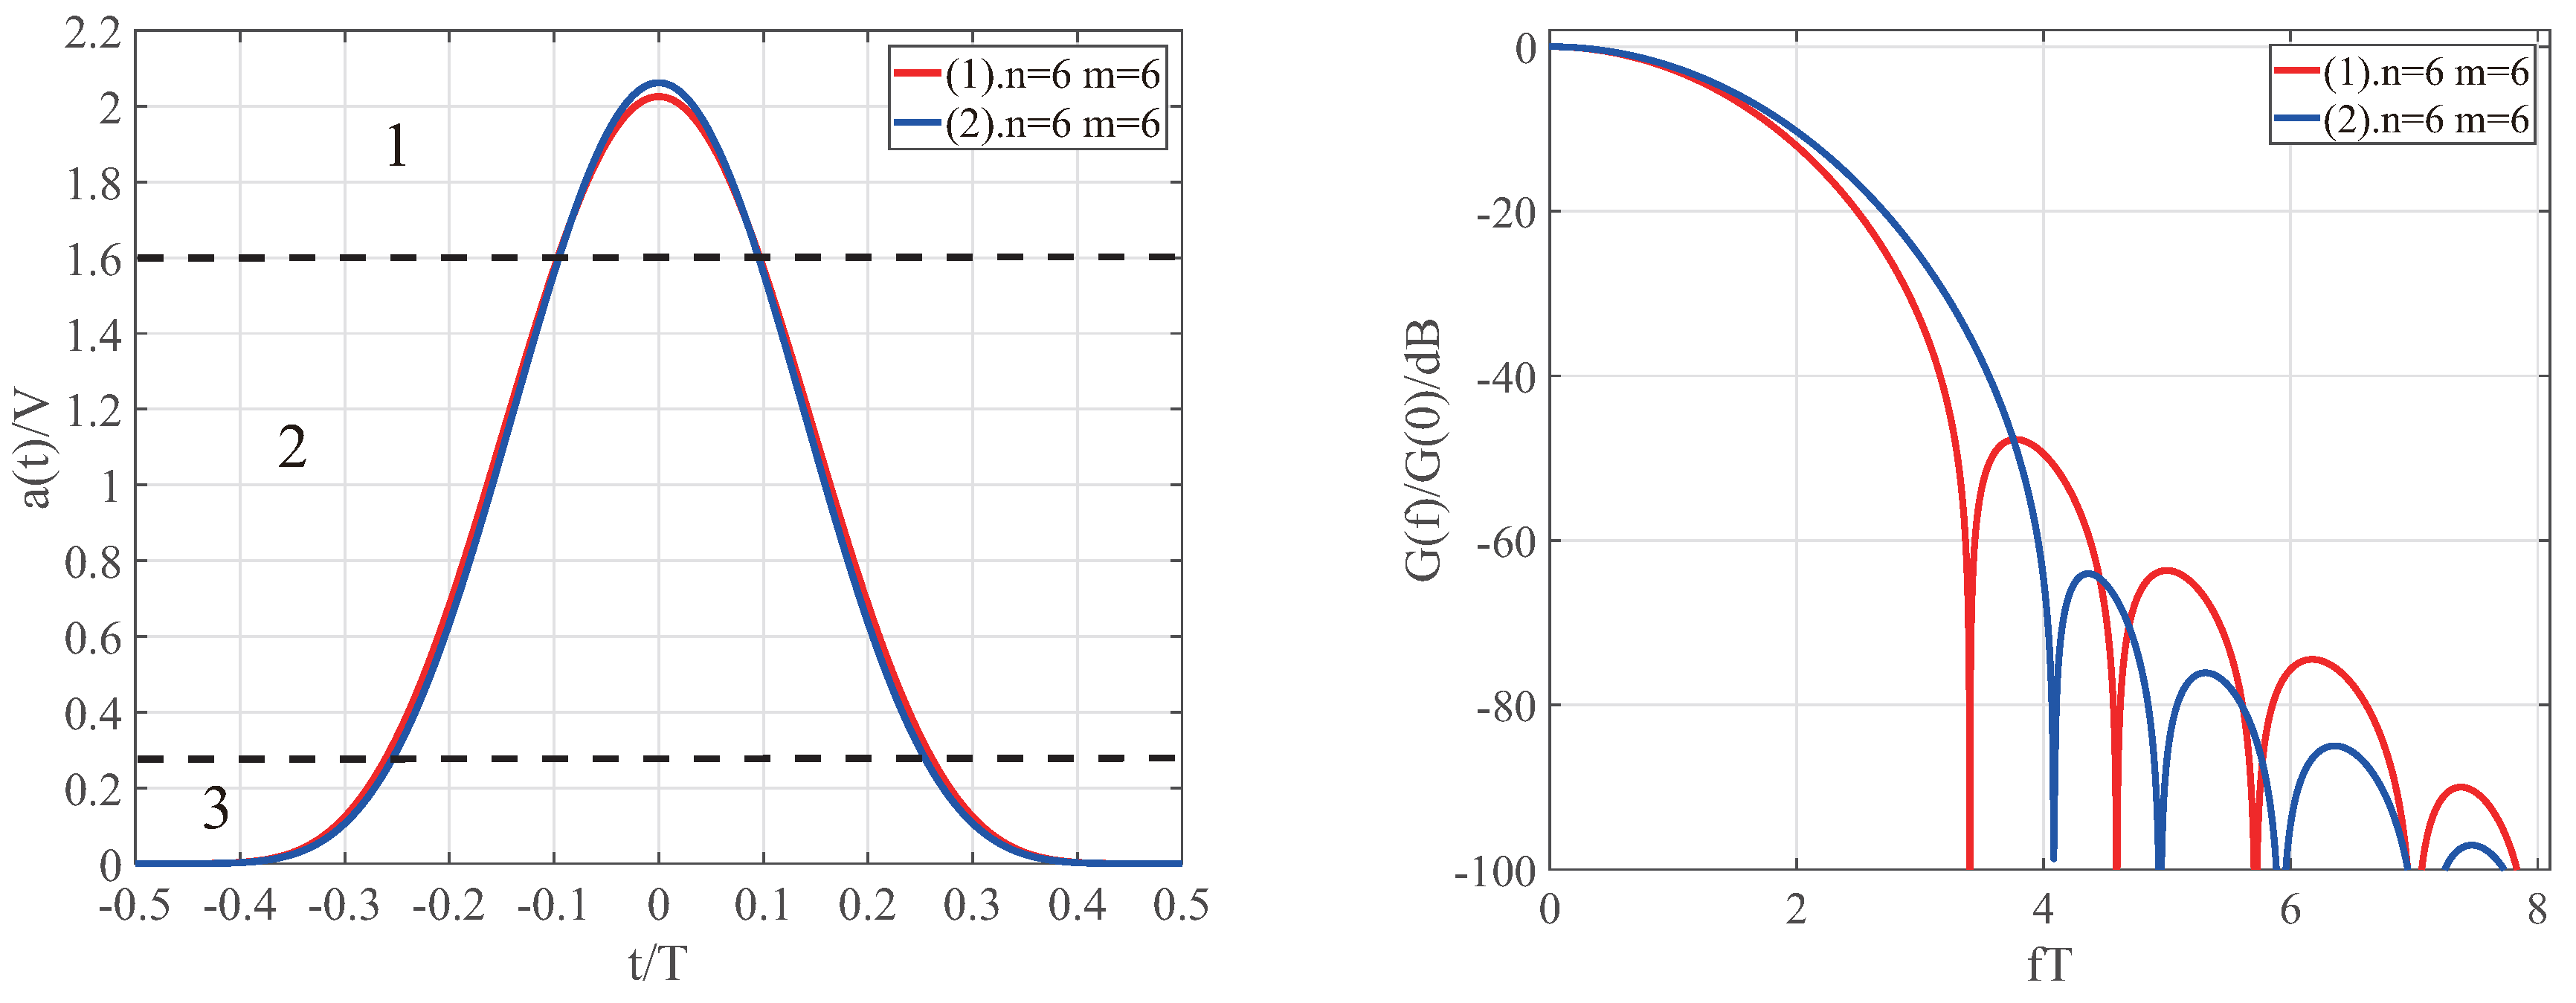
The corresponding time-domain signals and their normalized energy spectrum density can be obtained from Equations (21) and (22), as shown in Figure 4, where line (1) represents the signal under only energy and boundary limitations, and line (2) represents the signal under the additional frequency-domain limitation condition.
Figure 4.
Time-domain plots and normalized energy density plots for n = 6, m = 6 under different constraints.
A comparison of Figure 2 and Figure 4 indicates that after the additional frequency-domain constraints, the corresponding baseband signals in the time-domain all show an obvious increase in the peak value in the time-domain, and the main lobe of the normalized spectral density increases significantly. Therefore, the time-domain waveforms are divided into three parts. From the first part, the peak value of the baseband signal obtained by the additional frequency-domain restriction condition is higher than the baseband signal without the frequency-domain restriction condition. According to the energy limitation condition, if the peak value increases, the code signal needs to decrease a part of the energy in a certain part. Therefore, in part 2, line (1) is significantly narrow, and in part 3, line (1) is smoother.
For wireless communication systems, improving the efficiency of communication transmission is crucial, and the evolution of each generation of communication systems needs to consider this important issue. The baseband signal obtained by adding the frequency-domain restriction condition is an exploration for this problem. In Figure 2, the normalized energy spectrum main lobe width of line (1) is 1.875 fT, and that of line (2) is 2.849 fT. In Figure 3, the normalized energy spectrum main lobe width of line (1) is 2.645 fT, and the normalized energy spectrum main lobe width of line (2) is 3.748 fT. In Figure 4, the normalized energy spectrum main lobe width of line (1) is 3.39 fT, and the normalized energy spectrum main lobe width of line (2) is 4.074 fT. Small changes in the main lobe can have a significant effect on the distribution of energy. According to Formula (14), the normalized energy spectrum main lobe energy ratio corresponding to the six lines in Figure 2, Figure 3 and Figure 4 is shown in Table 4.
Obviously, the energy ratio of the main energy spectrum of the normalized spectrum improved by adding the additional conditions in the frequency-domain. The magnitude of this value can also be used as a criterion for measuring the nature of the spectrum. In addition, under the frequency-domain restriction, the optimization restriction is made according to the signal in the frequency-domain that has not been normalized. The figures show the energy spectrum density obtained after normalization, together with the effect of the two frequency-domain restriction conditions. Therefore, the obtained normalized energy spectrum density does not completely coincide with the requirements of the restriction conditions. For example, at n = 4, m = 6, the normalized energy spectral density at a frequency of 2.518 fT is −21 dB and does not completely coincide with the limited −20 dB.
4.3. Spectral Analysis of Signals with Additional Frequency-Domain Restrictions
Based on the different representations of the spectrum of the baseband signals obtained with only energy and boundary constraints, different frequency-domain constraints exist in the corresponding spectrum. The target signals with the frequency-domain restriction conditions are compared and analyzed separately at different values of roll-off factor n, keeping the m values same and adding the empirical signal cosine signal to the obtained baseband signal for the normalized spectral density comparison.
The following normalized energy spectral density diagram is made of the baseband signal, and the empirical signal cosine signal obtained at n equals 4 and 6, and m equals 6, as shown in Figure 5.
Figure 5.
The values of n are 4 and 6. When m is 6, the baseband signal and the empirical signal cosine signal are obtained to make the following normalized energy spectral density diagram.
As mentioned above, the normalized energy spectrum main lobe energy ratios of the baseband signals are obtained by adding the frequency-domain conditions at n = 4 and 6, and m = 6 as 2.242426 and 2.309111, respectively. Under the same conditions, the normalized energy spectrum of the cosine signal has a main lobe energy ratio of 1.2414315. At n = 4 and 6, and m = 6, the normalized energy ratio of the baseband signal is 1.81 times and 1.86 times, respectively, of the cosine signal. In other words, the baseband signal obtained by using the general function model constructed by the principle of minimum spectral energy leakage has smaller side lobes in the frequency-domain. This feature is also in accordance with the FBMC’s design philosophy, in principle, by designing the filter bank to decrease the side lobes as much as possible.
4.4. Comparative Analysis of Spectral Characteristics under Different Constraints at n = 2
For the same value of roll-off factor n and different m values, the frequency-domain main lobe energy ratio of the signal under different constraints and the spectral bandwidth calculated by −40 dB and −60 dB are compared and analyzed at n = 2, and m = 5, 6, and 7. The relevant data obtained in the absence and presence of the frequency-domain restriction condition are shown in Table 5 and Table 6, respectively.
Table 5.
When n = 2 and m = 5, 6 and, 7, the frequency-domain principal lobe energy ratio of the code signal in the absence of frequency-domain restriction is compared and analyzed with the spectrum bandwidth calculated by −40 dB and −60 dB.
Table 6.
When n = 2 and m = 5, 6, and 7, the frequency-domain principal lobe energy ratio of the code signal in the frequency-domain is added, and the spectrum bandwidth is calculated with −40 dB and −60 dB.
Table 5 and Table 6 show that with increasing frequency-domain conditions, the spectral efficiency of the normalized energy spectrum main lobe energy ratio, or the −40 dB spectral bandwidth and the −60 dB spectral bandwidth improved significantly. For different wireless communication systems, the appropriate baseband signals can be selected by adding different constraints to achieve different communication requirements.
5. Conclusions
In conclusion, the principle of minimum spectral energy leakage was applied to the Wireless communication systems, and the mathematical model was built by the general function adding different constraints. The time-frequency characteristics of the baseband signals under different constraints were analyzed. According to the additional energy constraints and under the restricted conditions of the boundary element signal spectrum characteristics of frequency-domain restrictions, by using the normalized spectral density function of the main lobe suitable location choice as restriction, and at the same time, choosing the first side lobe of the main lobe adjacent to limit the right point, through the change to drive the point in the changes of characteristic of the frequency-domain. To more conveniently compare the characteristics of the signal at different constraints, the normalized energy spectrum main lobe energy ratio was defined as a parameter, and the spectral performance of the signal was determined by the size of this parameter. In the time-domain, the time-domain signals at the same n, the same m, and different constraints were analyzed, and the time-domain waveform is divided into three parts. By analyzing the characteristics of the three parts, the baseband signal with better quality frequency-domain characteristics were obtained. Signals with better spectral characteristics should satisfy the larger peaks, the lines in part 2 are significantly more “narrow”, and in part 3, the lines are smoother. In the frequency-domain, the normalized energy spectrum main lobe energy ratio of the signals under the same conditions is compared at different constraints. The energy ratio of the normalized principal lobe of the code signal obtained after the frequency-domain restriction was significantly higher than that of the signal without the frequency-domain restriction. When n = 2 and m = 6, the energy ratio of the normalized principal lobe of line (1) is 1.470202, while that of line (2) is 1.780325, which is approximately 1.21 times of that of line (1); when n = 4 and m = 6, the energy ratio of the normalized principal lobe of the line (1) is 1.855372, while that of line (2) is 2.242426, which is approximately 1.21 times of that of line (1); when n = 6 and m = 6, the energy ratio of the normalized principal lobe of line (1) is 2.197020, whereas the energy ratio of the normalized principal lobe of line (2) is 2.309111, which is approximately 1.05 times of that of line (1). At the same time, the spectral characteristics of the cosine signal of the empirical signal were compared at n = 4 and 6, and the main lobe energy ratio of the signal normalized energy spectrum was 1.81 times and 1.86 times, respectively, of the cosine signal when m was 6. The baseband signals obtained by the additional frequency-domain constraints have better quality frequency-domain performance. In the design of the window function of OFDM, the method of designing the baseband signal in the paper can be used. We believe that this study will have important reference value for the selection of baseband signals in modern wireless communication systems in the near future.
Author Contributions
M.L. did the mathematical modeling and the simulations. He also wrote the draft of the paper. B.L. and P.J. contributed to the revisions and the discussion of the results. W.X. and S.B.M. put forward the idea and checked the simulation of this paper. All authors have read and agreed to the published version of the manuscript.
Funding
This research were funded by the Central Universities under Grant HEUCFG201829, the China Postdoctoral Science Foundation (2018M631911), CSIC joint fund project(6141B04040402) and Heilongjiang Postdoctoral Fund (LBH-Z18055).
Conflicts of Interest
The authors declare no conflict of interest.
References
- Han, S.H.; Lee, J.H. An overview of peak-to-average power ratio reduction techniques for multicarrier transmission. IEEE Trans. Wirel. Commun. 2005, 12, 56–65. [Google Scholar] [CrossRef]
- Sahin, A.; Guvene, I.; Sian, H. A Survey on Multicarrier Communications: Prototype Filters, Lattice Structures, and Implementation Aspects. IEEE Commun. Surv. Tutor. 2014, 16, 1312–1338. [Google Scholar] [CrossRef]
- Chevalier, P.; Pipon, F. New insights into optimal widely linear array receivers for the demodulation of BPSK, MSK, and GMSK signals corrupted by noncircular interferences-application to SAIC. IEEE Trans. Signal Process. 2006, 54, 870–883. [Google Scholar] [CrossRef]
- Shen, Z.; Andrews, J.G.; Evans, B.L. Adaptive resource allocation in multiuser OFDM systems with proportional rate constraints. IEEE Trans. Wirel. Commun. 2005, 4, 2726–2737. [Google Scholar] [CrossRef]
- Wu, Q.; Li, Y.; Zakharov, Y.V.; Xue, W.; Shi, W. A Kernel Affine Projection-Like Algorithm in Reproducing Kernel Hilbert Space. IEEE Trans. Circuits Syst. II Express Briefs 2019, 14, 1–5. [Google Scholar] [CrossRef]
- Armstrong, J. OFDM for Optical Communications. J. Lightw. Technol. 2009, 27, 189–204. [Google Scholar] [CrossRef]
- Jang, J.; Lee, K.B. Transmit power adaptation for multiuser OFDM systems. IEEE J. Sel. Areas Commun. 2003, 21, 171–178. [Google Scholar] [CrossRef]
- Farhang-Boroujeny, B. OFDM Versus Filter Bank Multicarrier. IEEE Commun. Mag. 2011, 28, 92–112. [Google Scholar] [CrossRef]
- Siohan, P.; Siclet, C.; Lacaille, N. Analysis and design of OFDM/OQAM systems based on filterbank theory. IEEE Trans. Signal Process. 2002, 50, 1170–1183. [Google Scholar] [CrossRef]
- Mesleh, R.Y.; Haas, H.; Sinanovic, S.; Ahn, C.W.; Yun, S. Spatial Modulation. IEEE Trans. Veh. Technol. 2008, 57, 2228–2241. [Google Scholar] [CrossRef]
- Michailow, N.; Mendes, L.; Matthé, M.; Gaspar, I.; Festag, A.; Fettweis, G. Robust WHT-GFDM for the Next Generation of Wireless Networks. IEEE Commun. Lett. 2015, 19, 106–109. [Google Scholar] [CrossRef]
- Tao, Y.; Liu, L.; Liu, S.; Zhang, Z. A survey: Several technologies of non-orthogonal transmission for 5G. China Commun. 2015, 12, 1–15. [Google Scholar] [CrossRef]
- Farhang, A.; Marchetti, N.; Doyle, L.E. Low-Complexity Modem Design for GFDM. IEEE Trans. Signal Process. 2016, 64, 1507–1518. [Google Scholar] [CrossRef]
- Matthé, M.; Mendes, L.L.; Fettweis, G. Generalized Frequency Division Multiplexing in a Gabor Transform Setting. IEEE Commun. Lett. 2014, 18, 1379–1382. [Google Scholar] [CrossRef]
- Qu, D.; Lu, S.; Jiang, T. Multi-Block Joint Optimization for the Peak-to-Average Power Ratio Reduction of FBMC-OQAM Signals. IEEE Trans. Signal Process. 2013, 61, 1605–1613. [Google Scholar] [CrossRef]
- Ihalainen, T.; Ikhlef, A.; Louveaux, J.; Renfors, M. Channel Equalization for Multi-Antenna FBMC/OQAM Receivers. IEEE Trans. Veh. Technol. 2011, 60, 2070–2085. [Google Scholar] [CrossRef]
- Michailow, N.; Matthe, M.; Gaspar, I.S.; Caldevilla, A.N.; Mendes, L.L.; Festag, A.; Fettweis, G. Generalized Frequency Division Multiplexing for 5th Generation Cellular Networks. IEEE Trans. Commun. 2014, 62, 3045–3061. [Google Scholar] [CrossRef]
- Saeedi-Sourck, H.; Wu, Y.; Bergmans, J.W.M.; Sadri, S.; Farhang-Boroujeny, B. Sensitivity analysis of offset QAM multicarrier systems to residual carrier frequency and timing offsets. Signal Process. 2011, 91, 1604–1612. [Google Scholar] [CrossRef]
- Zhang, L.; Xiao, P.; Zafar, A.; Quddus, A.; Tafazolli, R. FBMC System: An Insight Into Doubly Dispersive Channel Impact. IEEE Trans. Veh. Technol. 2016, 66, 3942–3956. [Google Scholar] [CrossRef]
- Caus, M.; Pérez-Neira, A.I. Multi-Stream Transmission for Highly Frequency Selective Channels in MIMO-FBMC/OQAM Systems. IEEE Trans. Signal Process. 2013, 62, 786–796. [Google Scholar] [CrossRef]
- Zhang, D.; Matthé, M.; Mendes, L.L.; Fettweis, G. A Study on the Link Level Performance of Advanced Multicarrier Waveforms Under MIMO Wireless Communication Channels. IEEE Trans. Wirel. Commun. 2017, 16, 2350–2365. [Google Scholar] [CrossRef]
- Xu, Y.; Xue, W.; Shang, W. A Pan-Function Model for the Utilization of Bandwidth Improvement and PAPR Reduction. Math. Probl. Eng. 2014, 2014. [Google Scholar] [CrossRef]
© 2019 by the authors. Licensee MDPI, Basel, Switzerland. This article is an open access article distributed under the terms and conditions of the Creative Commons Attribution (CC BY) license (http://creativecommons.org/licenses/by/4.0/).