Article

Critical Nodes Identification in Complex Networks

1
School of Transportation Science and Engineering, Harbin Institute of Technology, Harbin 150090, China
2
Department of Civil and Environmental Engineering, The Hong Kong Polytechnic University, Hung Hom 999077, Hong Kong, China
*
Author to whom correspondence should be addressed.
Symmetry 2020, 12(1), 123; https://doi.org/10.3390/sym12010123
Submission received: 25 December 2019 / Revised: 4 January 2020 / Accepted: 6 January 2020 / Published: 8 January 2020

Abstract

:
Critical nodes identification in complex networks is significance for studying the survivability and robustness of networks. The previous studies on structural hole theory uncovered that structural holes are gaps between a group of indirectly connected nodes and intermediaries that fill the holes and serve as brokers for information exchange. In this paper, we leverage the property of structural hole to design a heuristic algorithm based on local information of the network topology to identify node importance in undirected and unweighted network, whose adjacency matrix is symmetric. In the algorithm, a node with a larger degree and greater number of structural holes associated with it, achieves a higher importance ranking. Six real networks are used as test data. The experimental results show that the proposed method not only has low computational complexity, but also outperforms degree centrality, k-shell method, mapping entropy centrality, the collective influence algorithm, DDN algorithm that based on node degree and their neighbors, and random ranking method in identifying node importance for network connectivity in complex networks.

1. Introduction

Networks have become an attractive subject in complex system research, due to their universality for depicting a wide range of systems in nature and society [1,2,3]. This is based on the fact that a complex system which is composed of a set of components with connections between them can be graphically represent by a network graph, where nodes represent individual components and links stand for their interactions.
Networks are everywhere [4,5], ranging from nature and biological system to society, such as cellular networks [6], traffic networks [7,8,9], social networks [10], power grids [11], and many others. Research regarding evaluation of node importance for certain structural or functional objectives in complex network is a challenge of both theoretical and practical significance. In real life, complex networks or systems are not always secure. Threats to complex networks can come from two sources, random failures and target destruction [12,13]. Previous studies show that a large number of real systems such as the World Wide Web, the Internet, power grids, and airline networks, etc. are with notable heterogeneity [14], which means that the role of nodes in network structure and function varies greatly. These networks have a higher tolerance to random failures but are sensitive to intentional attacks.
Critical nodes are those special nodes that can affect the structure and function of the network to a greater extent. Protecting the key nodes of the network is of great significance for improving the robustness and survivability of the network [15]. How to design an effective algorithm to evaluate the importance of nodes has attracted a large number of scholars to study it in recent years [16]. Many methods have been proposed from different aspects to identify critical nodes, such as degree centrality (Deg) [17], mapping entropy centrality (ME) [18], the collective influence algorithm (CI) [19], semi-local centrality [20], coreness [21], and H-index [22] which are based on node local neighbors information. Eccentricity [23], information indices [24], Katz centrality [25], closeness centrality, betweenness centrality [26], and subgraph centrality [27] are designed from the perspective of number of paths for communication. In addition to the methods mentioned above, there are also many iterative refinement algorithms, which consider not only the number of neighbors but also the importance of its neighbors. Representative algorithms include the well-known PageRank [28], HITs [29], and eigenvector centrality [30], as well as some recently porposed algorithms such as LeaderRank [31] and TwitterRank [32].
Due to the rapid development of information technology, as well as the constantly expanding network scale and increasing complexity of the network, the design for evaluating algorithms on node importance in very large-scale networks is becoming a significant challenge nowadays. The importance evaluation of algorithms is computationally expensive if they are based on global information of the network. Therefore, the design of evaluation algorithm should not only be effective but also efficient. To address this, designing a sorting algorithm based on network local information would be a better solution. In this paper, we present a new approach called DSHC (based on local degree information and structure hole count) to evaluate node importance of the network. We summarize the following three contributions of the paper:
(1)
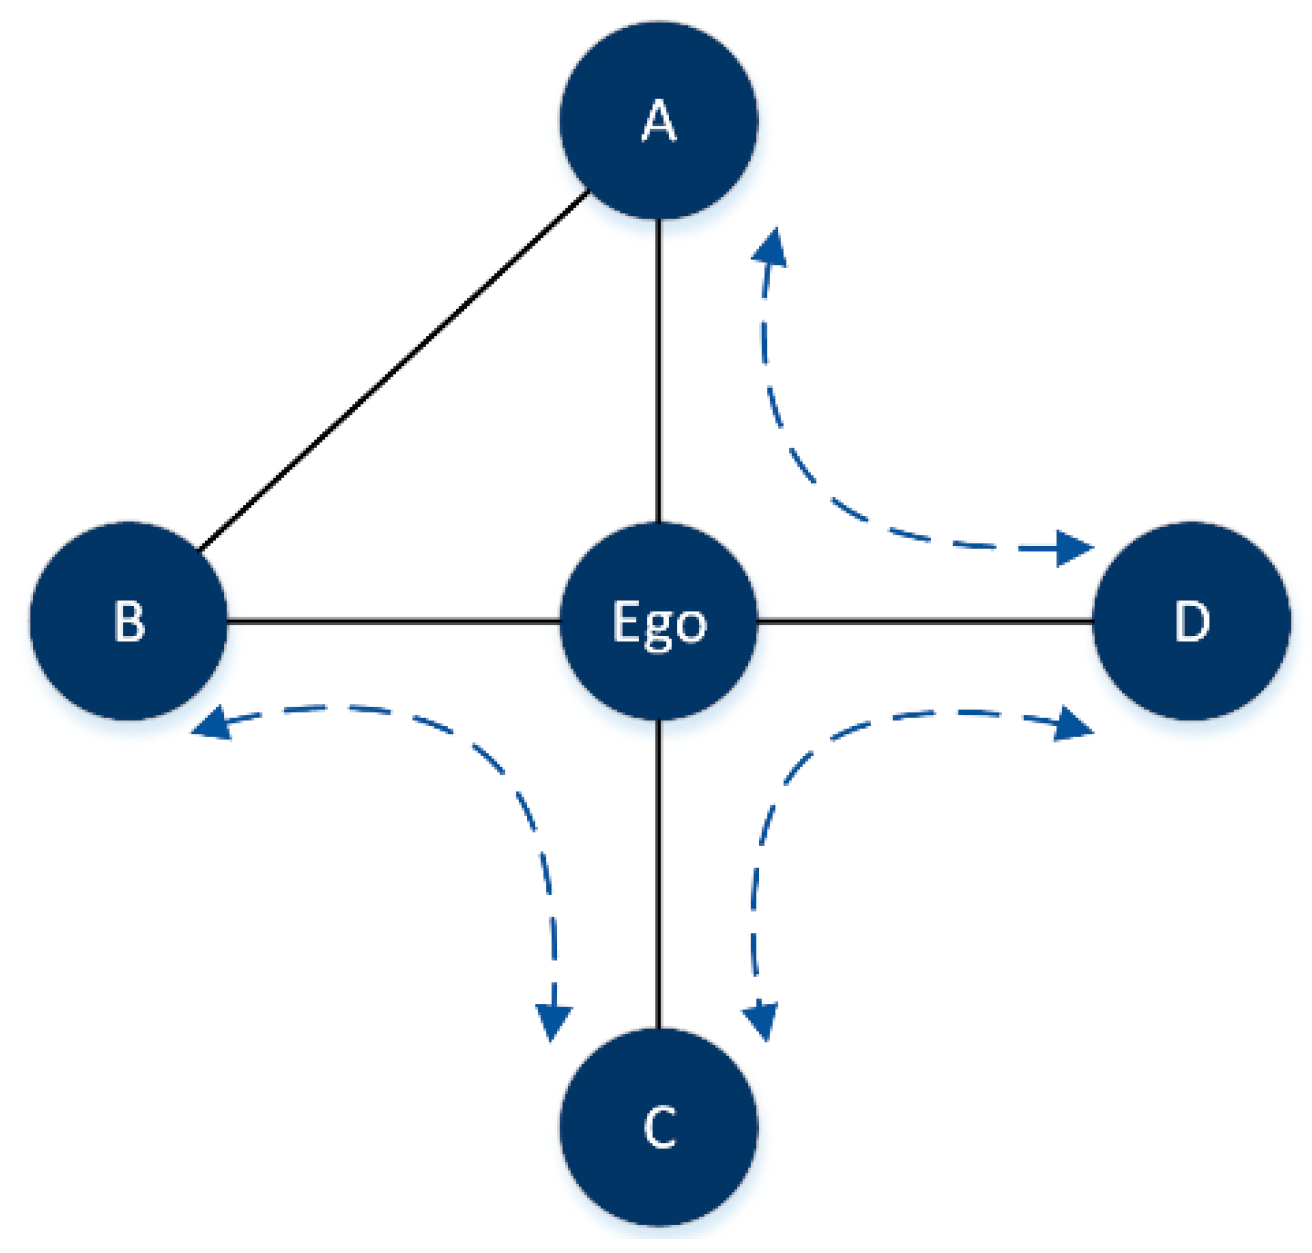
We draw inspiration from the theory of structural holes [33] and only consider the node’s local neighborhood information to evaluate the importance of nodes. This makes the algorithm more computationally attractive for large-scale networks;
(2)
The proposed algorithm can effectively identify the hubs with numerous structural holes, which play important role in bridging different clusters of the network;
(3)
Empirical analyses on real and synthetic networks demonstrate that the proposed method can outperform Deg, k-shell, ME, CI, DDN [34], and random ranking method (Rand).
The outline of this paper is organized as follows: First, we introduce a theory for the study of competition relationship in social networks analysis according to the theory of structural holes and then, devise the evaluation algorithm to identify node importance and introduce the benchmark algorithms in Section 2. In Section 3, we introduce the indicators used to evaluate the accuracy of importance ranking. In Section 4, we present real network datasets for experiments. In Section 5, we compare the proposed algorithms with other existing methods in both synthetic networks and real networks. Finally, we provide a summary in Section 6.

2. Materials and Methods

An unweighted and undirected network G(V, E) with N = |V| nodes and M = |E| edges is considered in this paper. The network could be described by an adjacent matrix A(aij), where aij = 1 represents there is a connection linking node i and node j, and aij = 0 otherwise. The degree value of node i is represented by ki.

2.1. Measurement of Node Importance Based on Degree and Structural Hole Count

We begin our analysis by introducing a theory for the study of competitive relationships in social networks, based on the so-called structural holes. From a sociological perspective, structural holes are gaps between a group of indirectly connected nodes, and some individuals that act as structural hole spanners to fill the hole get more network benefits than their neighbors. Take Figure 1 as an example, there are three structural holes marked by dashed arrows associated with the intermediate node Ego. Compared with its neighbors A, B, C, and D, Ego will gain more network benefits than its neighbors, because there is no alternative communication channel between them. Obviously, the Ego node plays a significant role in maintaining the network connectivity and we can infer that the large degree value a node has and the greater the number of structural holes associated with the node, the more significant the node will be.
In view of the analysis above, we leverage the property of structural holes to design an intuitive algorithm for quantifying node importance in maintaining the network connectivity, based on degree and structural hole count, expressed by
D S H C i = j Γ i ( ( 1 k i + 1 k j ) 1 1 + Δ i j ) 2
where Γi represents the neighbor set of node i and Δij represents the number of structural holes formed between node i and j with node i as the intermediary. According to Equation (1), the larger the degree of a node and its neighbors, and the higher the number of structural holes between the node and its neighbors, this means that the stronger the irreplaceability of nodes in the structure, the smaller the value of DSHC will be. According to Figure 1, we calculate the DSHCEgo_A between node Ego and node A, there are two structural holes between node Ego and node A,{A-Ego-C, A-Ego-D}. Therefore, we can get
DSHCEgo_A = ((1/4 + 1/2) × (1/(1 + 2)))2 = 1/16
Futhermore, we calculate the DSHCEgo_B, DSHCEgo_C, and DSHCEgo_D, and sum them to get DSHCEgo.
The algorithm comprehensively considers the degree of the node and its neighbors and the information about the topological overlapping of its neighbors. A large DSHC value indicates that the neighborhood of the node is closely interconnected and forms a dense local cluster. Removal of such nodes usually does not significantly affect the network connectivity.
The DSHC algorithm is described as follows:
Algorithm 1 the DSHC Method
Input: Network adjacency matrix A(aij), degree of network nodes k, the size of network N
Output: The DSHC value of each node
1: for i = 1 to N
2: Si = find (A(aij) =1) // Find the neighbors Si of node i
3: len(Si) = length(Si) // Number of neighbors of node i
4: for j = 1:len(Si)
5: Si_j= find (A(ajk) =1) // Find the neighbors Si_j of neighbor j of node i
6: Δij= |Si_j - intersect(Si, Si_j)| // calculate the number of structural holes formed between node i and j with node i as the intermediary
7: D S H C i _ j = ( ( 1 k i + 1 k j ) 1 1 + Δ i j ) 2
8: end for
9: DSHCi = sum(DSHCi_j) // according to Equation(1)
10: end for
11: Return DSHC value of each node

2.2. Benchmark Methods

We use several popular heuristic methods that are also based solely on the network topology to investigate the performance of the proposed method. These measures include:
1. Degree centrality
Degree centrality is a basic ranking algorithm to evaluate the importance of nodes. The degree of node i can be defined as
k i = j = 1 N a i j
2. The k-shell decomposition method
The k-shell decomposition algorithm categorizes the nodes into core nodes and fringe nodes. The algorithm steps are as follows: First, delete all nodes that have only one connection and assign those nodes to the 1-shell. In this process, there may be new nodes with k = 1, and then pruning is repeated until all nodes with k = 1 are removed. The removed nodes will be classified using a 1-shell. Next, this process continues in a similar way for nodes with degree k = 2 and gets the 2-shell of the network. The pruning is repeated until all network nodes are assigned to one of the shells.
3. The DDN method
The DDN method believes that the importance of a node is determined by the degree of the node and the degree of its neighbors, which is defined as
D D N i = j Γ i w i j
where the weight of node is expressed as w i j = k i × k j .
4. The ME centrality
The ME centrality is based on local neighborhood information, which is defined as
M E i = k i j = 1 P log k j
where P is the number of node i’s neighbors.
5. The CI algorithm
The CI algorithm can be utilized to identify a set of key nodes whose removal is most efficient in destroying the network connectivity, which is defined as
C I i = ( k i 1 ) j b a l l ( i , ) ( k j 1 )
where b a l l ( i , ) is the boundary of the sphere centered on node i with radius , and is composed of all nodes whose distance from node i does not exceed . The CI radius of this article is set to 2.
6. Random ranking method
Ranking the importance of network nodes in a random order.

3. How to Evaluate the Performance

There are three kinds of metrics which are often used to evaluate the performance of ranking algorithm, namely susceptibility value S [35], the maximum connectivity coefficient [36] G, and the network efficiency [37,38] η. The change of network connectivity caused by removing node is equivalent to the importance of node.
1. The maximum connectivity coefficient
The maximum connectivity coefficient reflects the size of the maximum connected component of the network, which is attacked by removing node. Mathematically reads
G = R/N
where R means the size of the giant component after node removal and N represents the number of nodes in the network. Obviously, the smaller G is, the better the attack strategy is.
2. Susceptibility
Susceptibility quantifies the change of network connectivity in response to the removal of network nodes. The gradual removal of network nodes breaks the network into many disconnected parts. In this process, the susceptibility value, S, usually has a peak value corresponding to a specific proportion, pc, at which the network collapse. In particular, if the network is broken multiple times during the process of gradually removing nodes, there exists multiple peaks. The susceptibility value S is defined as:
S = s < σ n s s 2 N
where ns denotes the number of components with size equal to s and N represents the size of the network nodes. Obviously, the smaller the value of pc, the better the ranking algorithm.
3. The Decline Rate of Network Efficiency
Network efficiency reflects the quality of the network connectivity, which is defined as
u = 1 N ( N 1 ) i , j V η i j
where ηij means the efficiency of node i and j, ηij = 1/dij, and dij denotes the shortest path length between node i and j. As network nodes are gradually removed, the average shortest path between nodes becomes larger, which makes the connectivity of the network worse.
We adopt the decline rate of the network efficiency to analyze the disintegration effect of nodes removal, which is defined as
η = 1 u / u 0
where η represents the efficiency of the network after network attack and u0 denotes the network efficiency of the original network.

4. Data Description

To validate the effectiveness of the DSHC method, six real complex networks including Facebook (Slavo Zitnik’s social network on Facebook) [39], Erdos (scientific collaboration network) [40], USAir (American aviation network) [41,42], USAirport (USA airport network) [43], Yeast (yeast protein-protein binding network) [44,45], and Power (connections between US west power stations) [46] are used for a comparison experiment. The basic statistics of six real networks are shown in Table 1.

5. Results and Analysis

In order to verify the effectiveness of the DSHC indicator in measuring the importance of nodes, we compare the proposed method with K-shell, Degree, ME, CI, and Rand to simulate the intentional attack effect on real and synthetic networks by selectively removing the nodes in descending order of node importance. The experiments were simulated on MATLAB toolset.

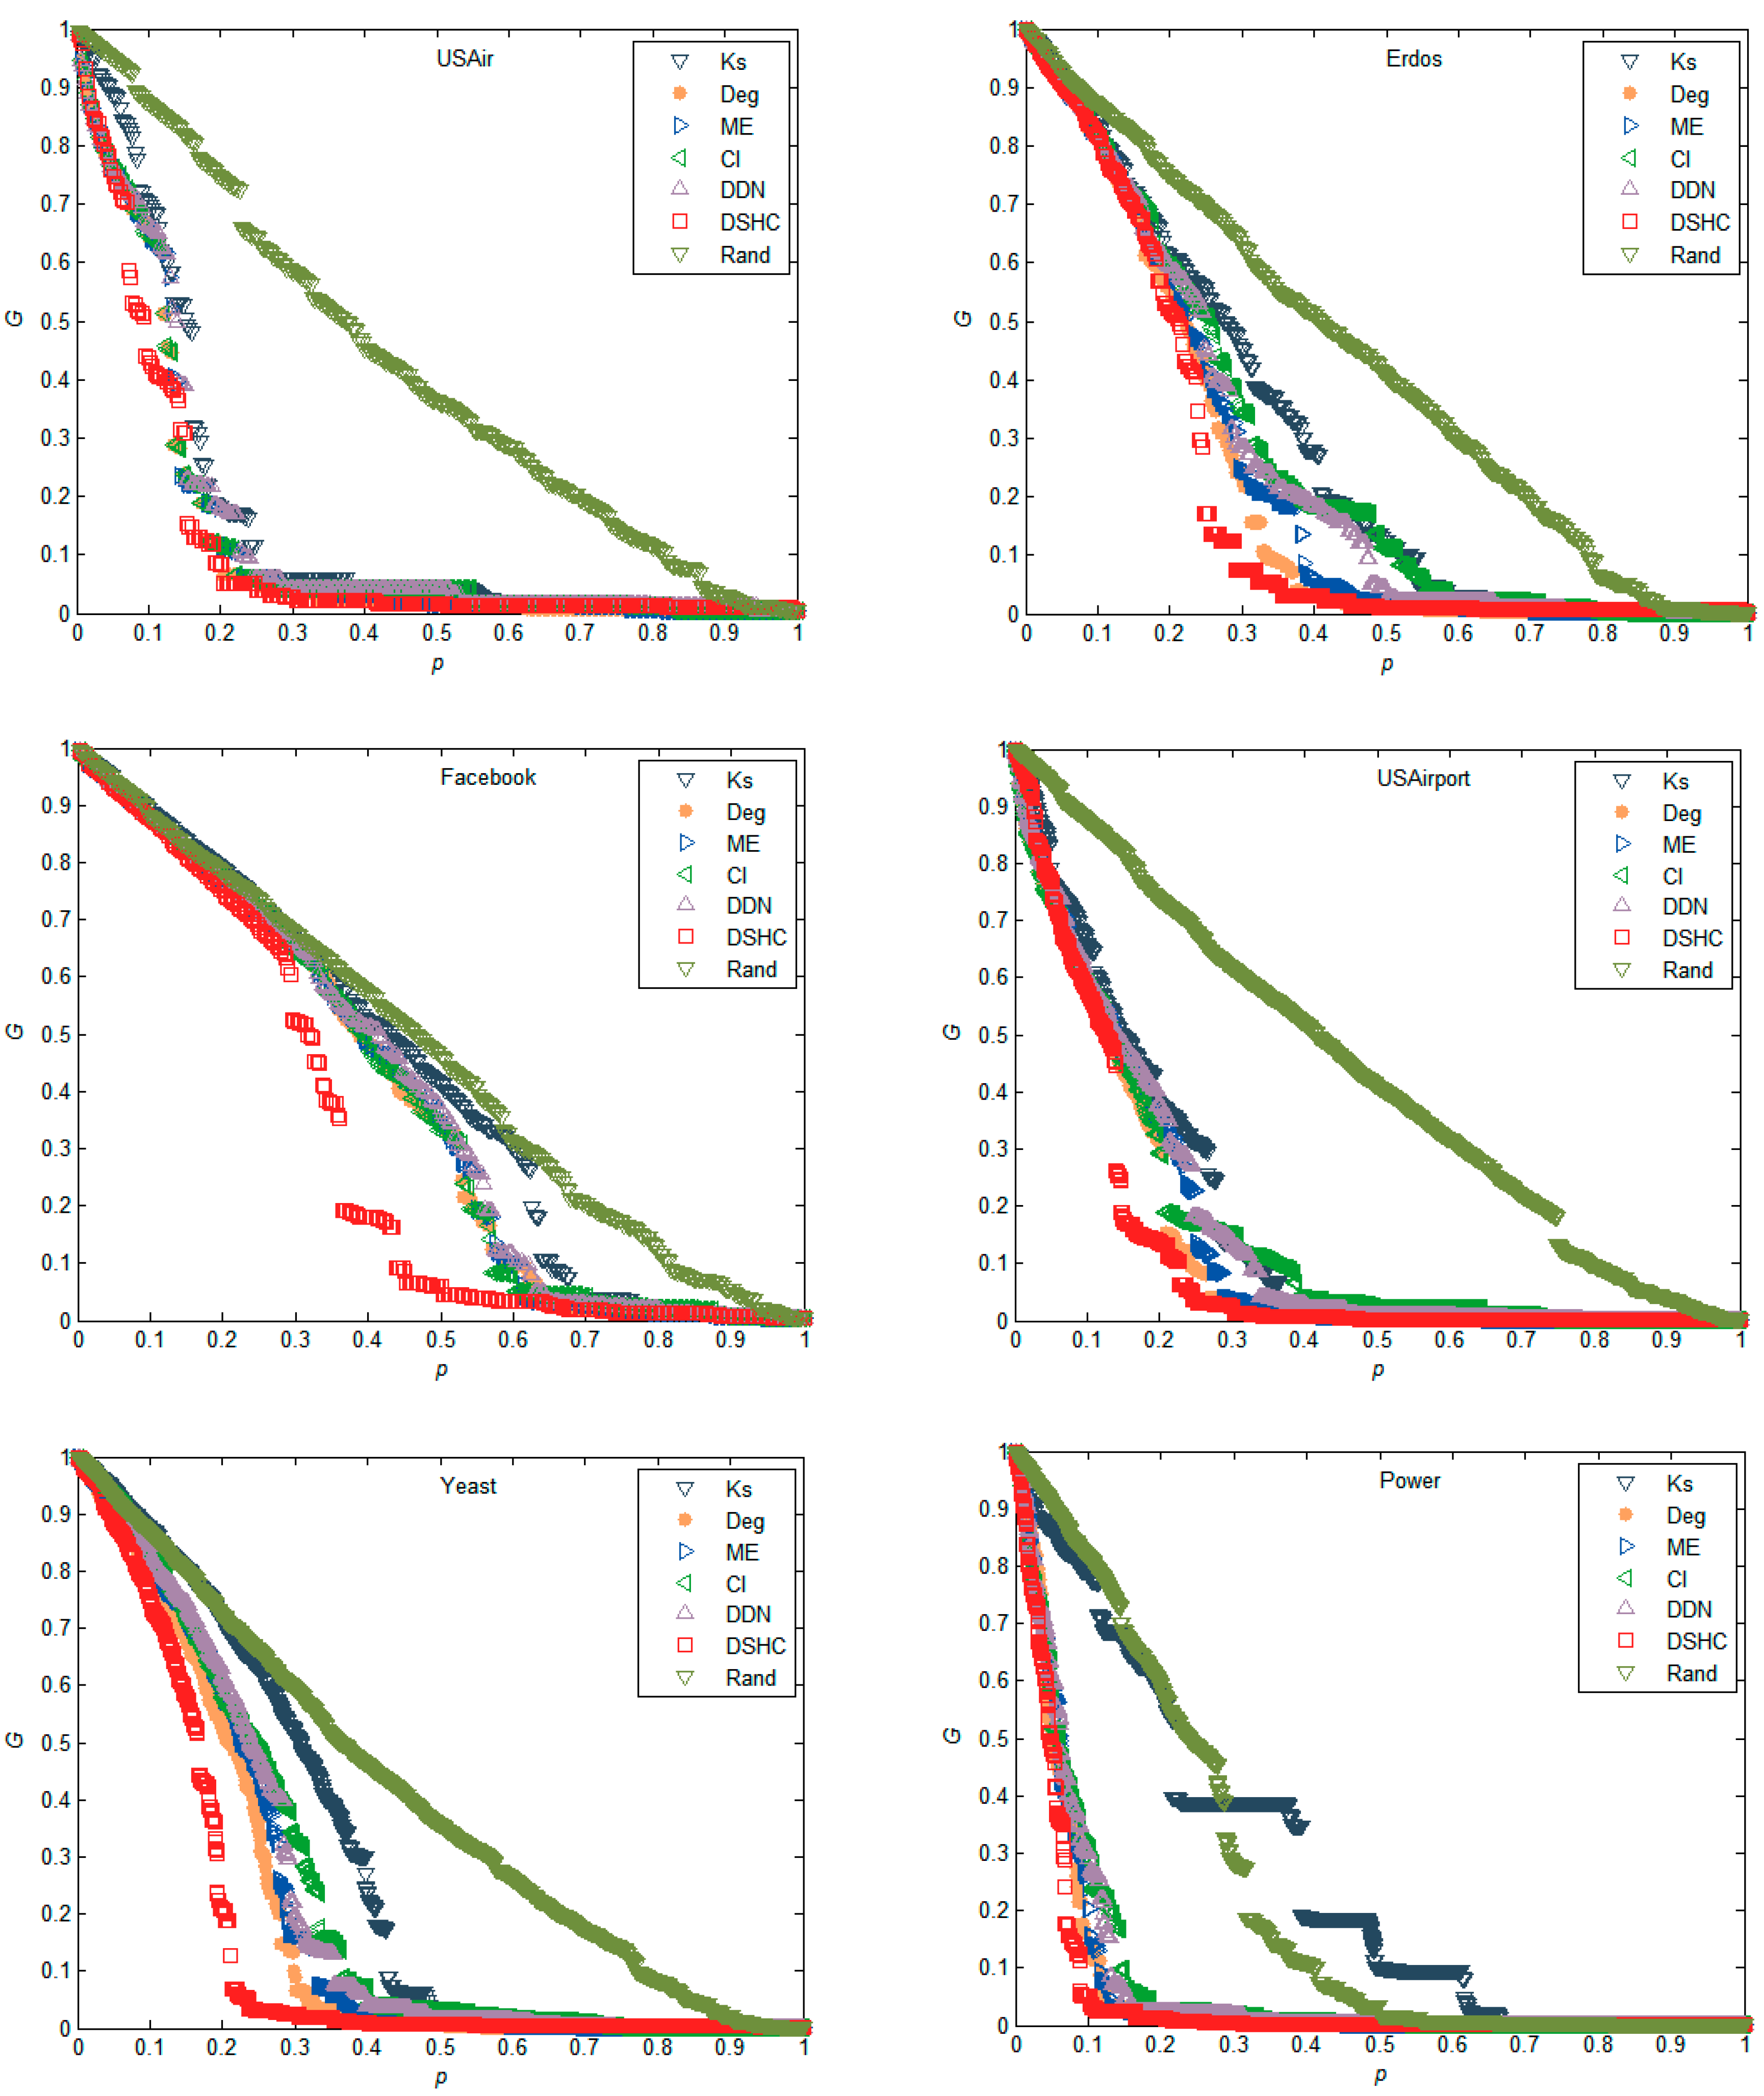
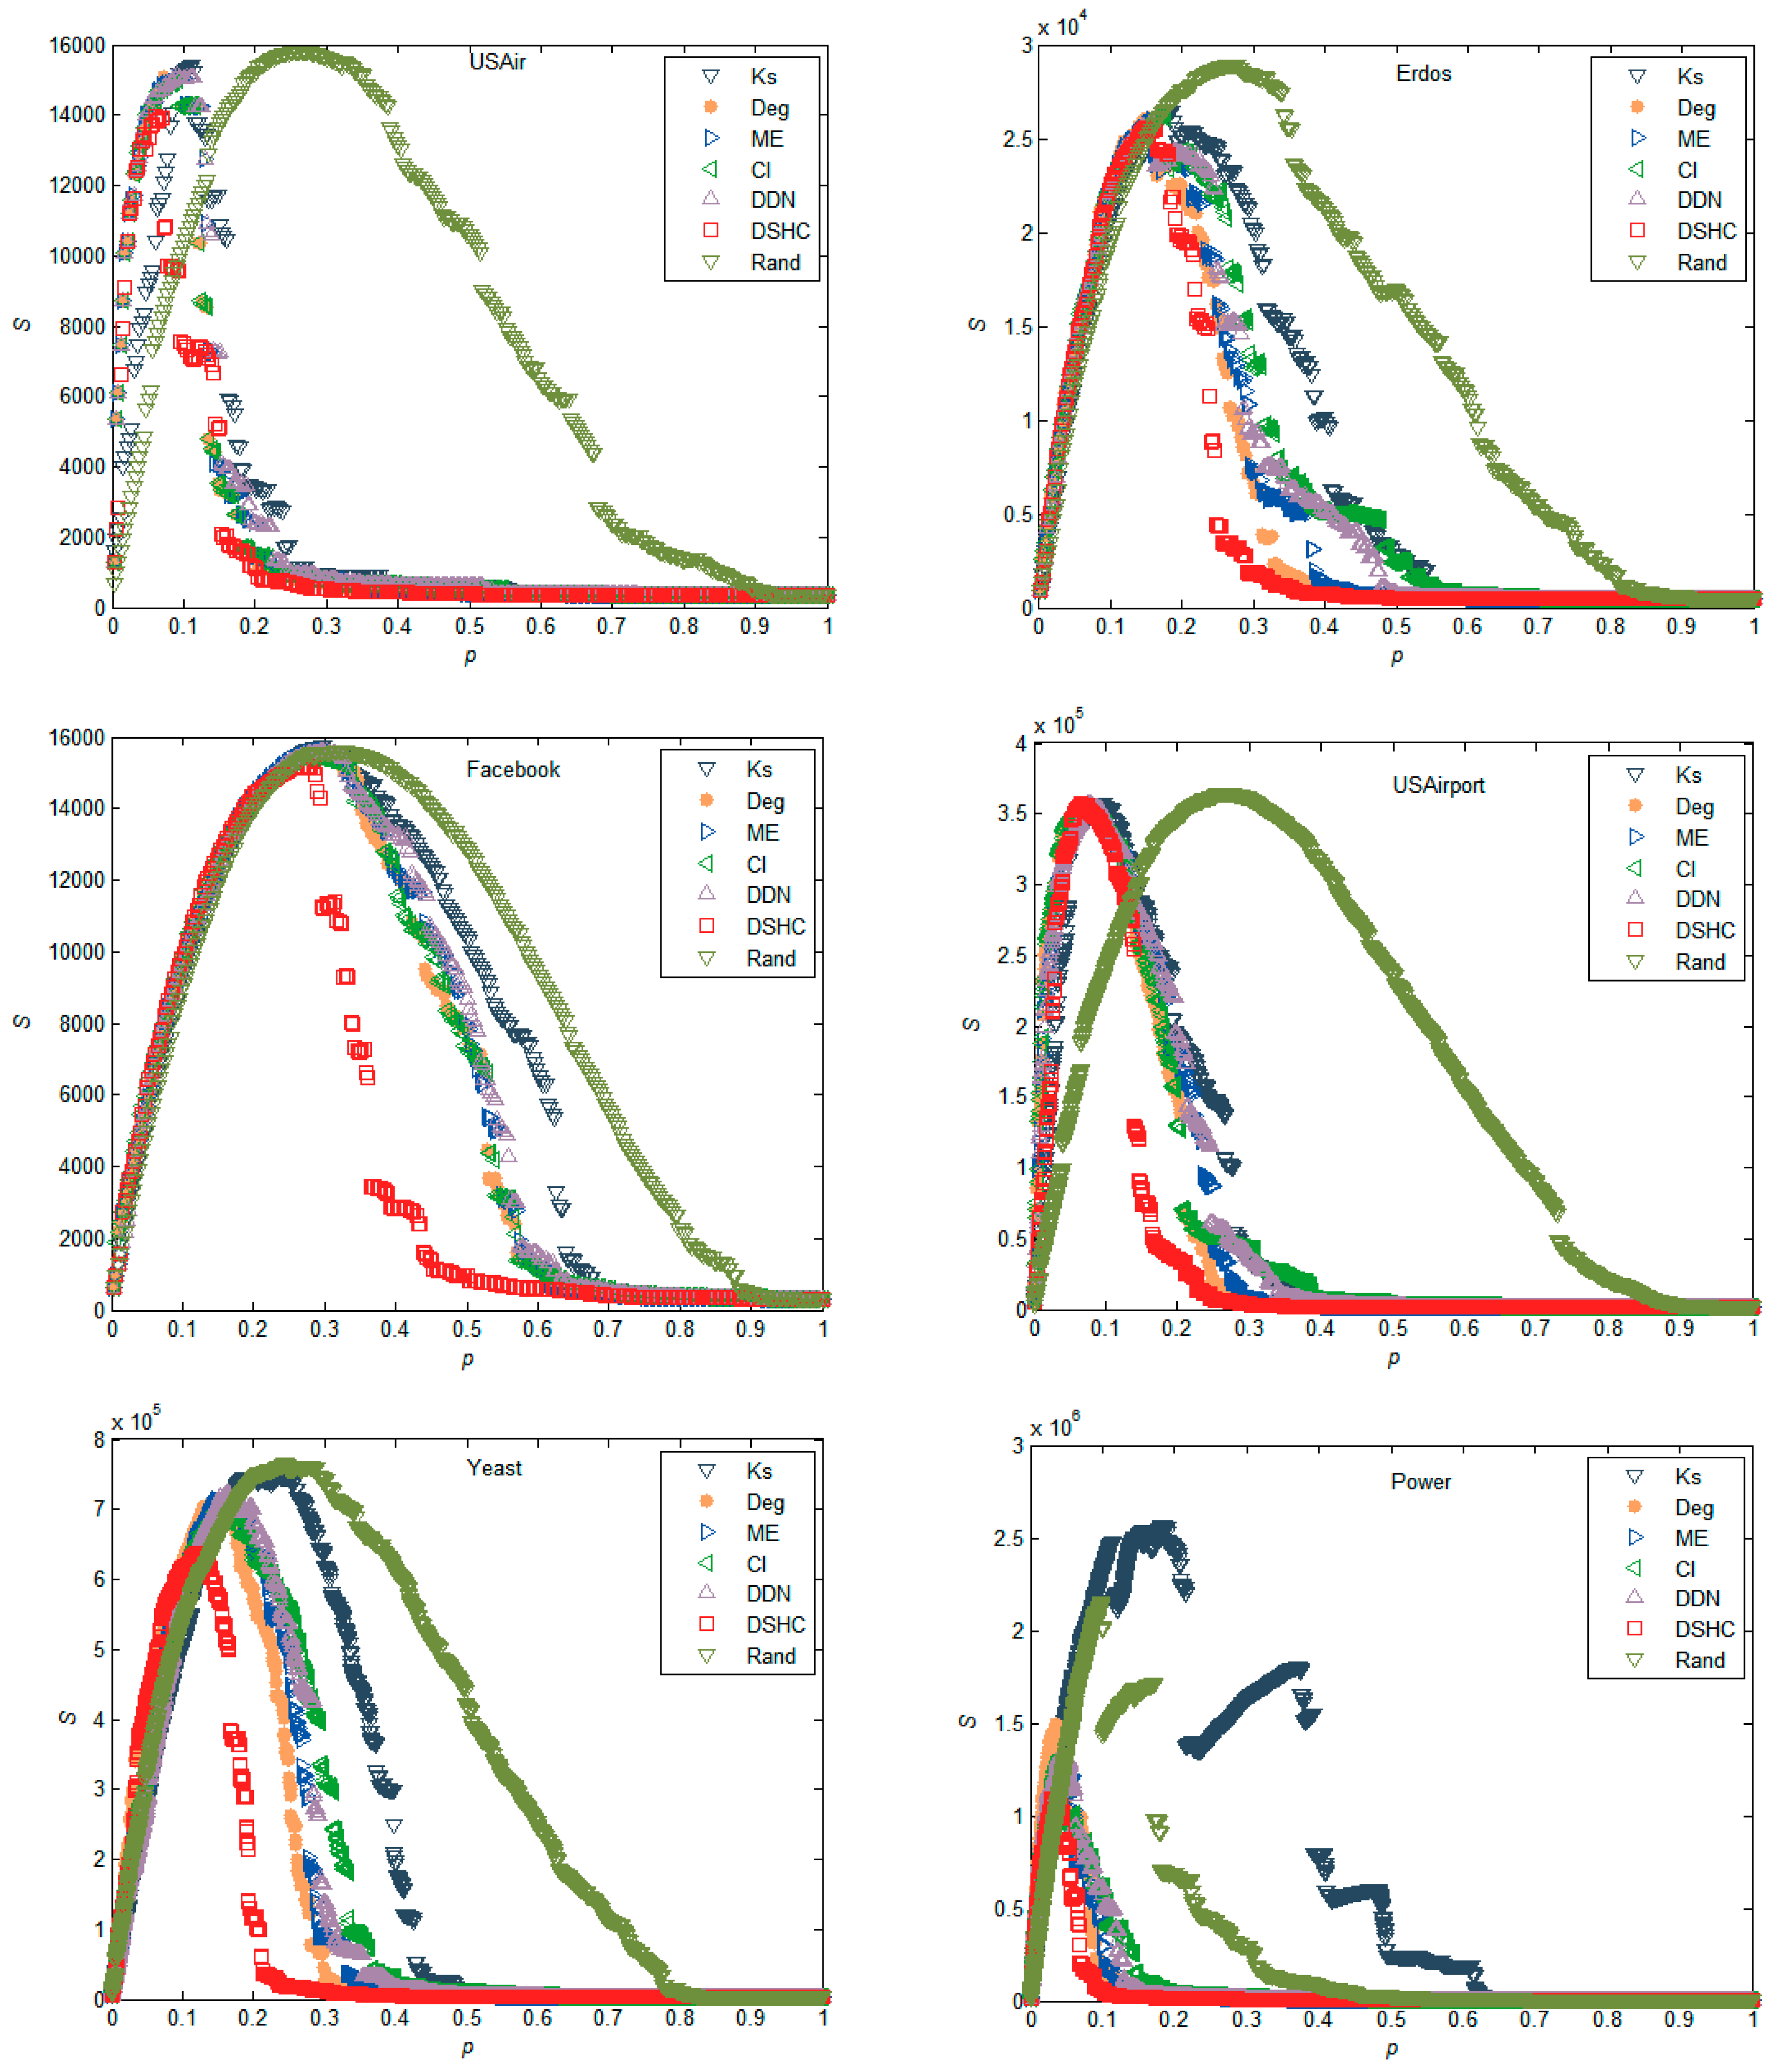
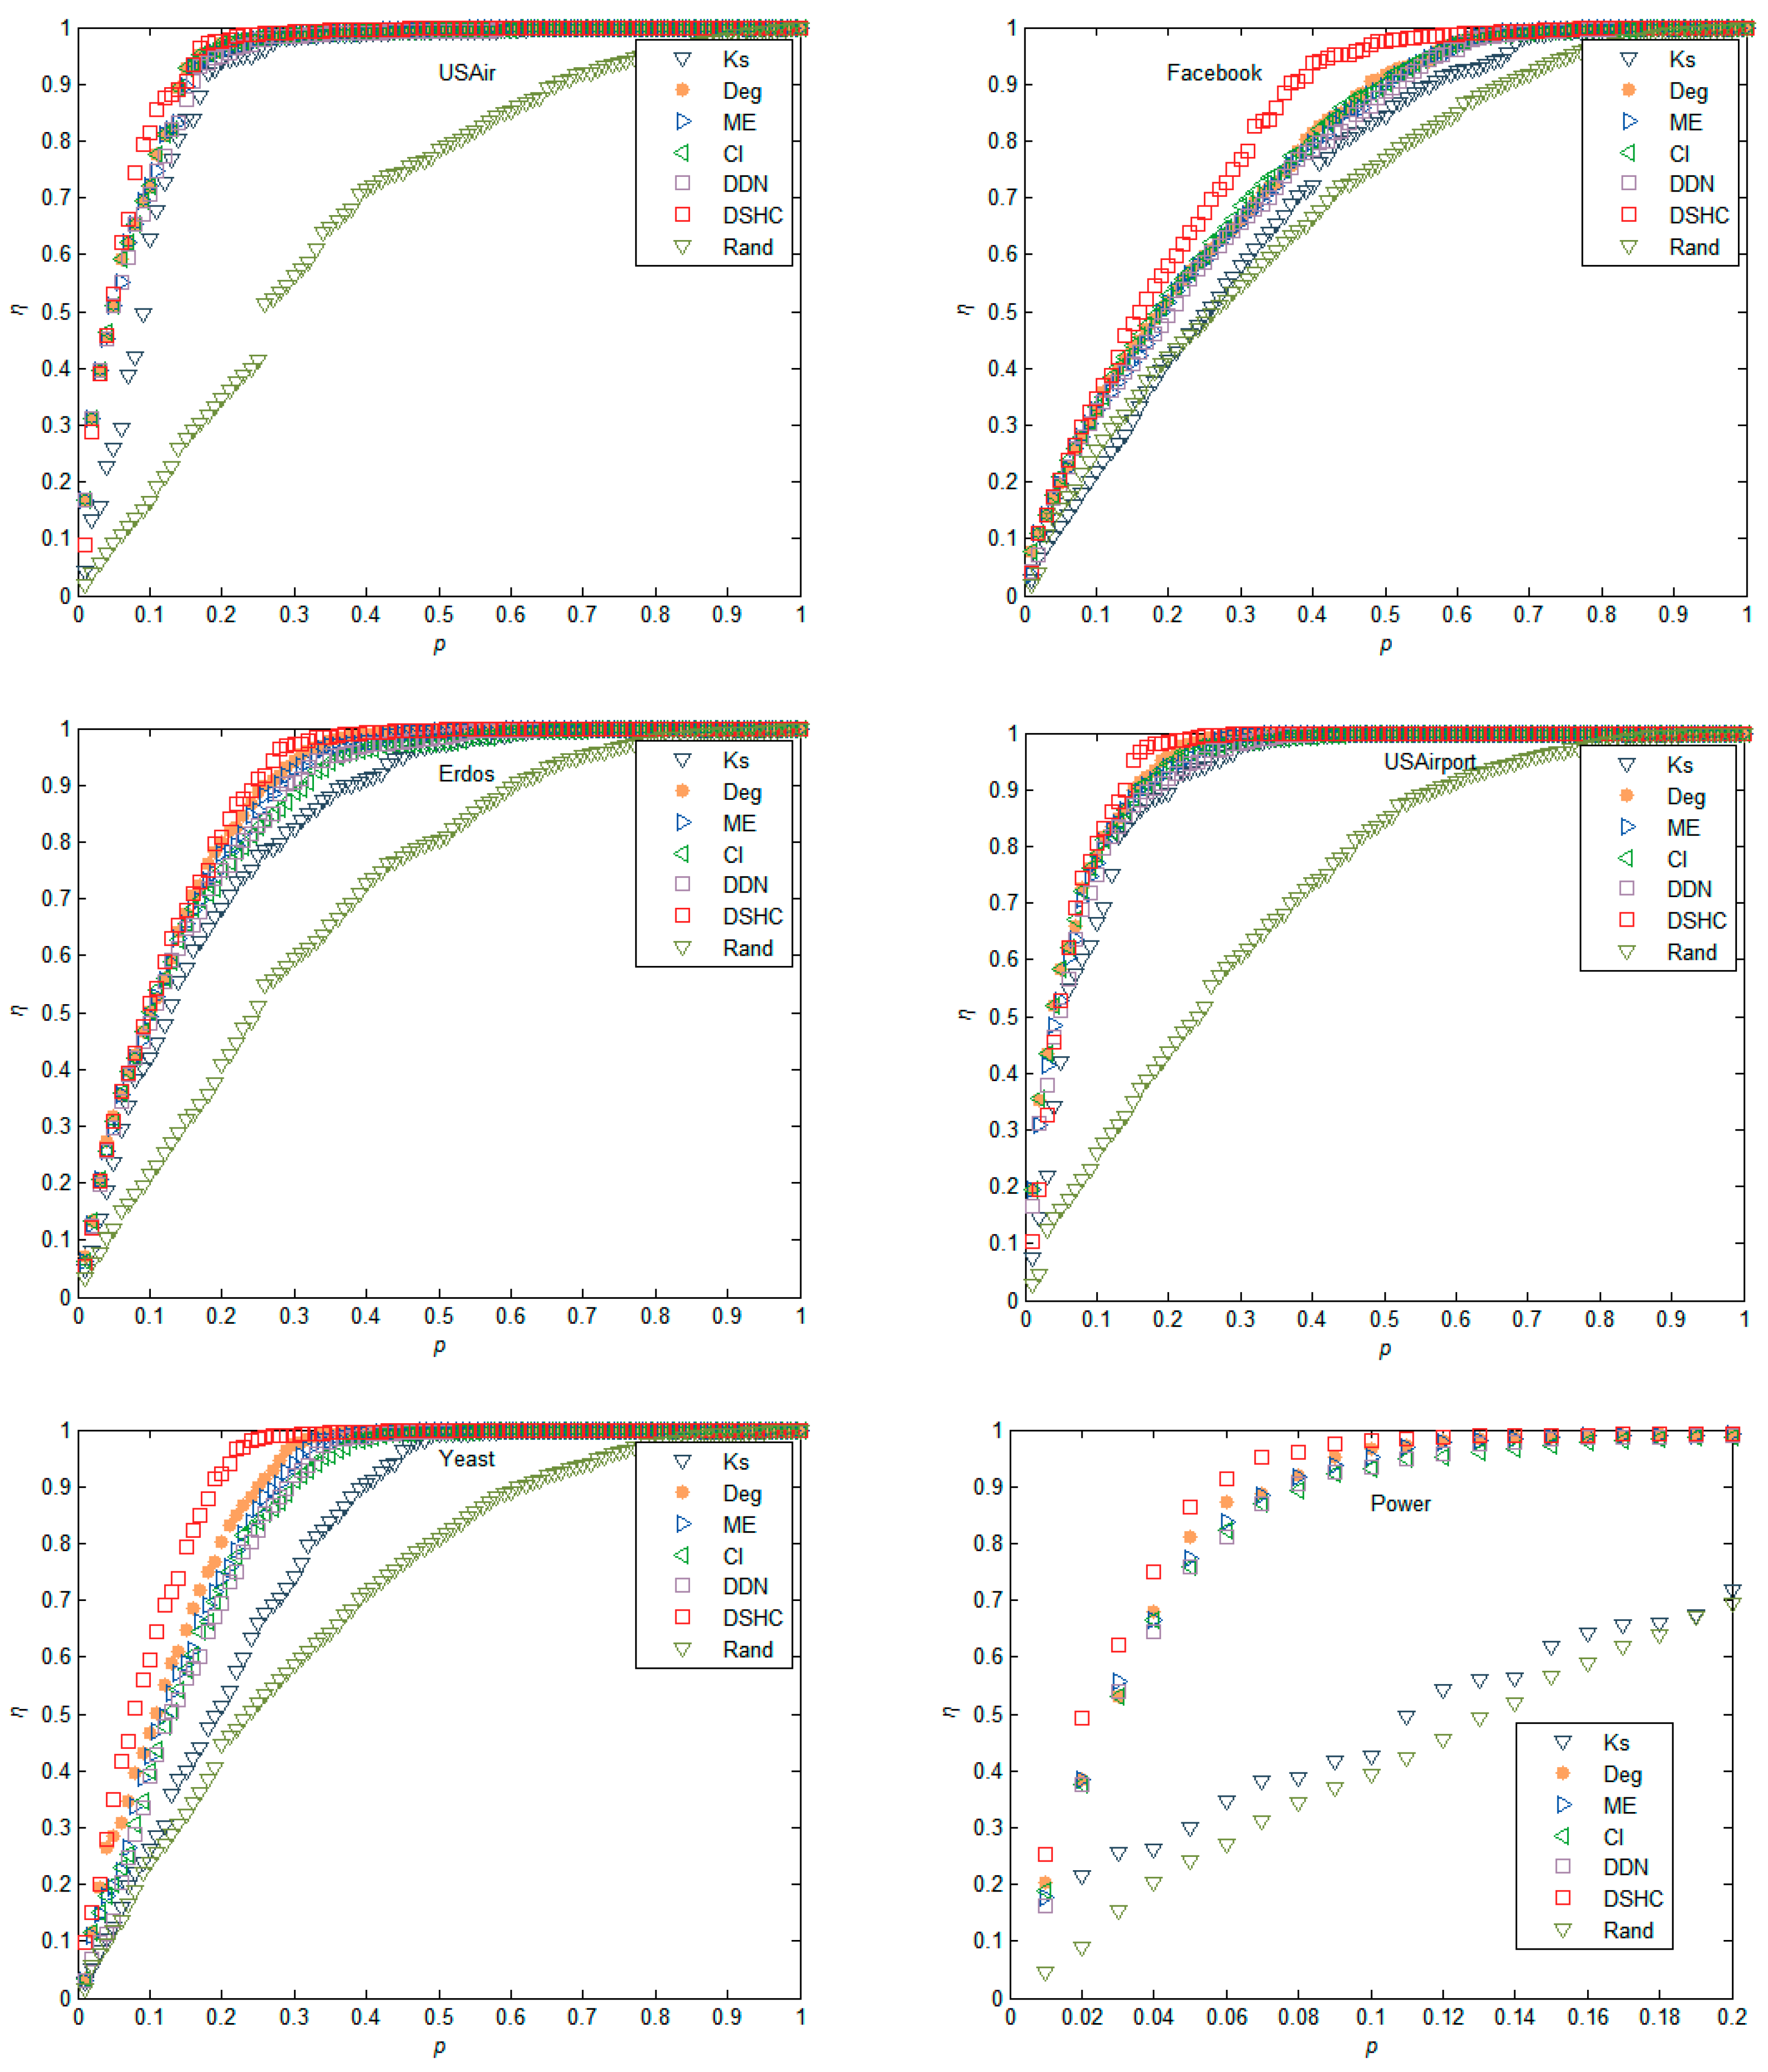
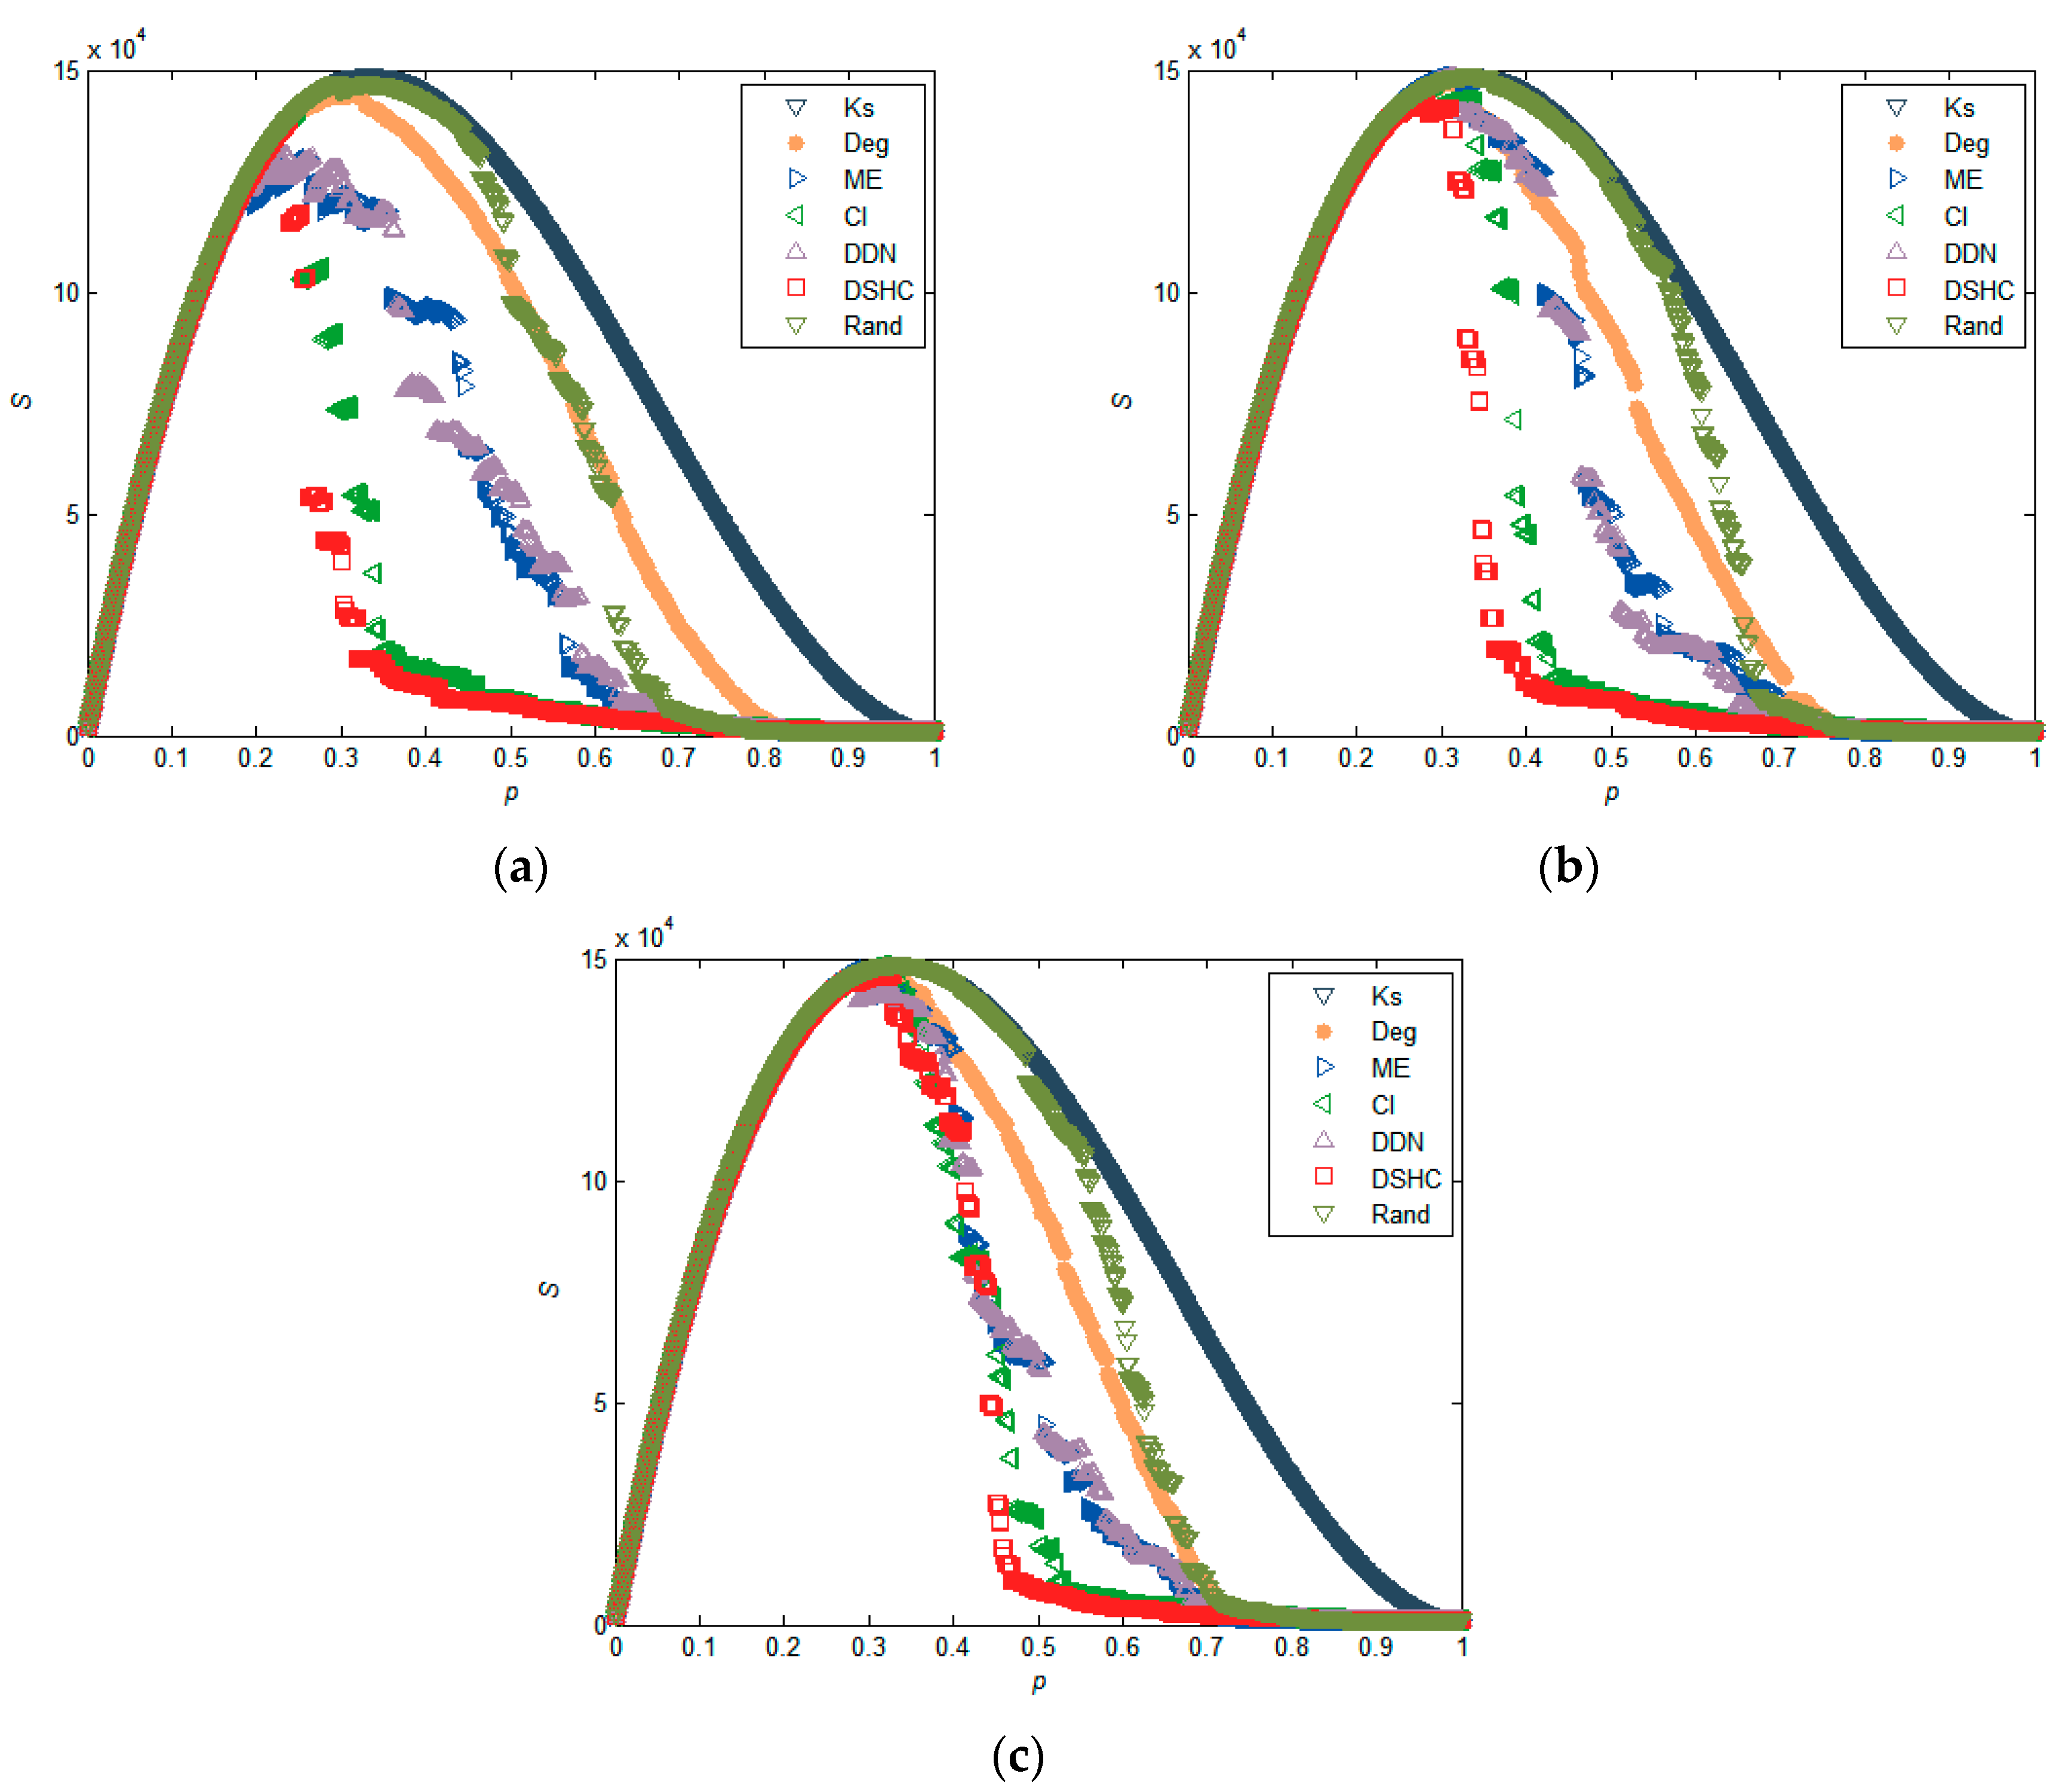
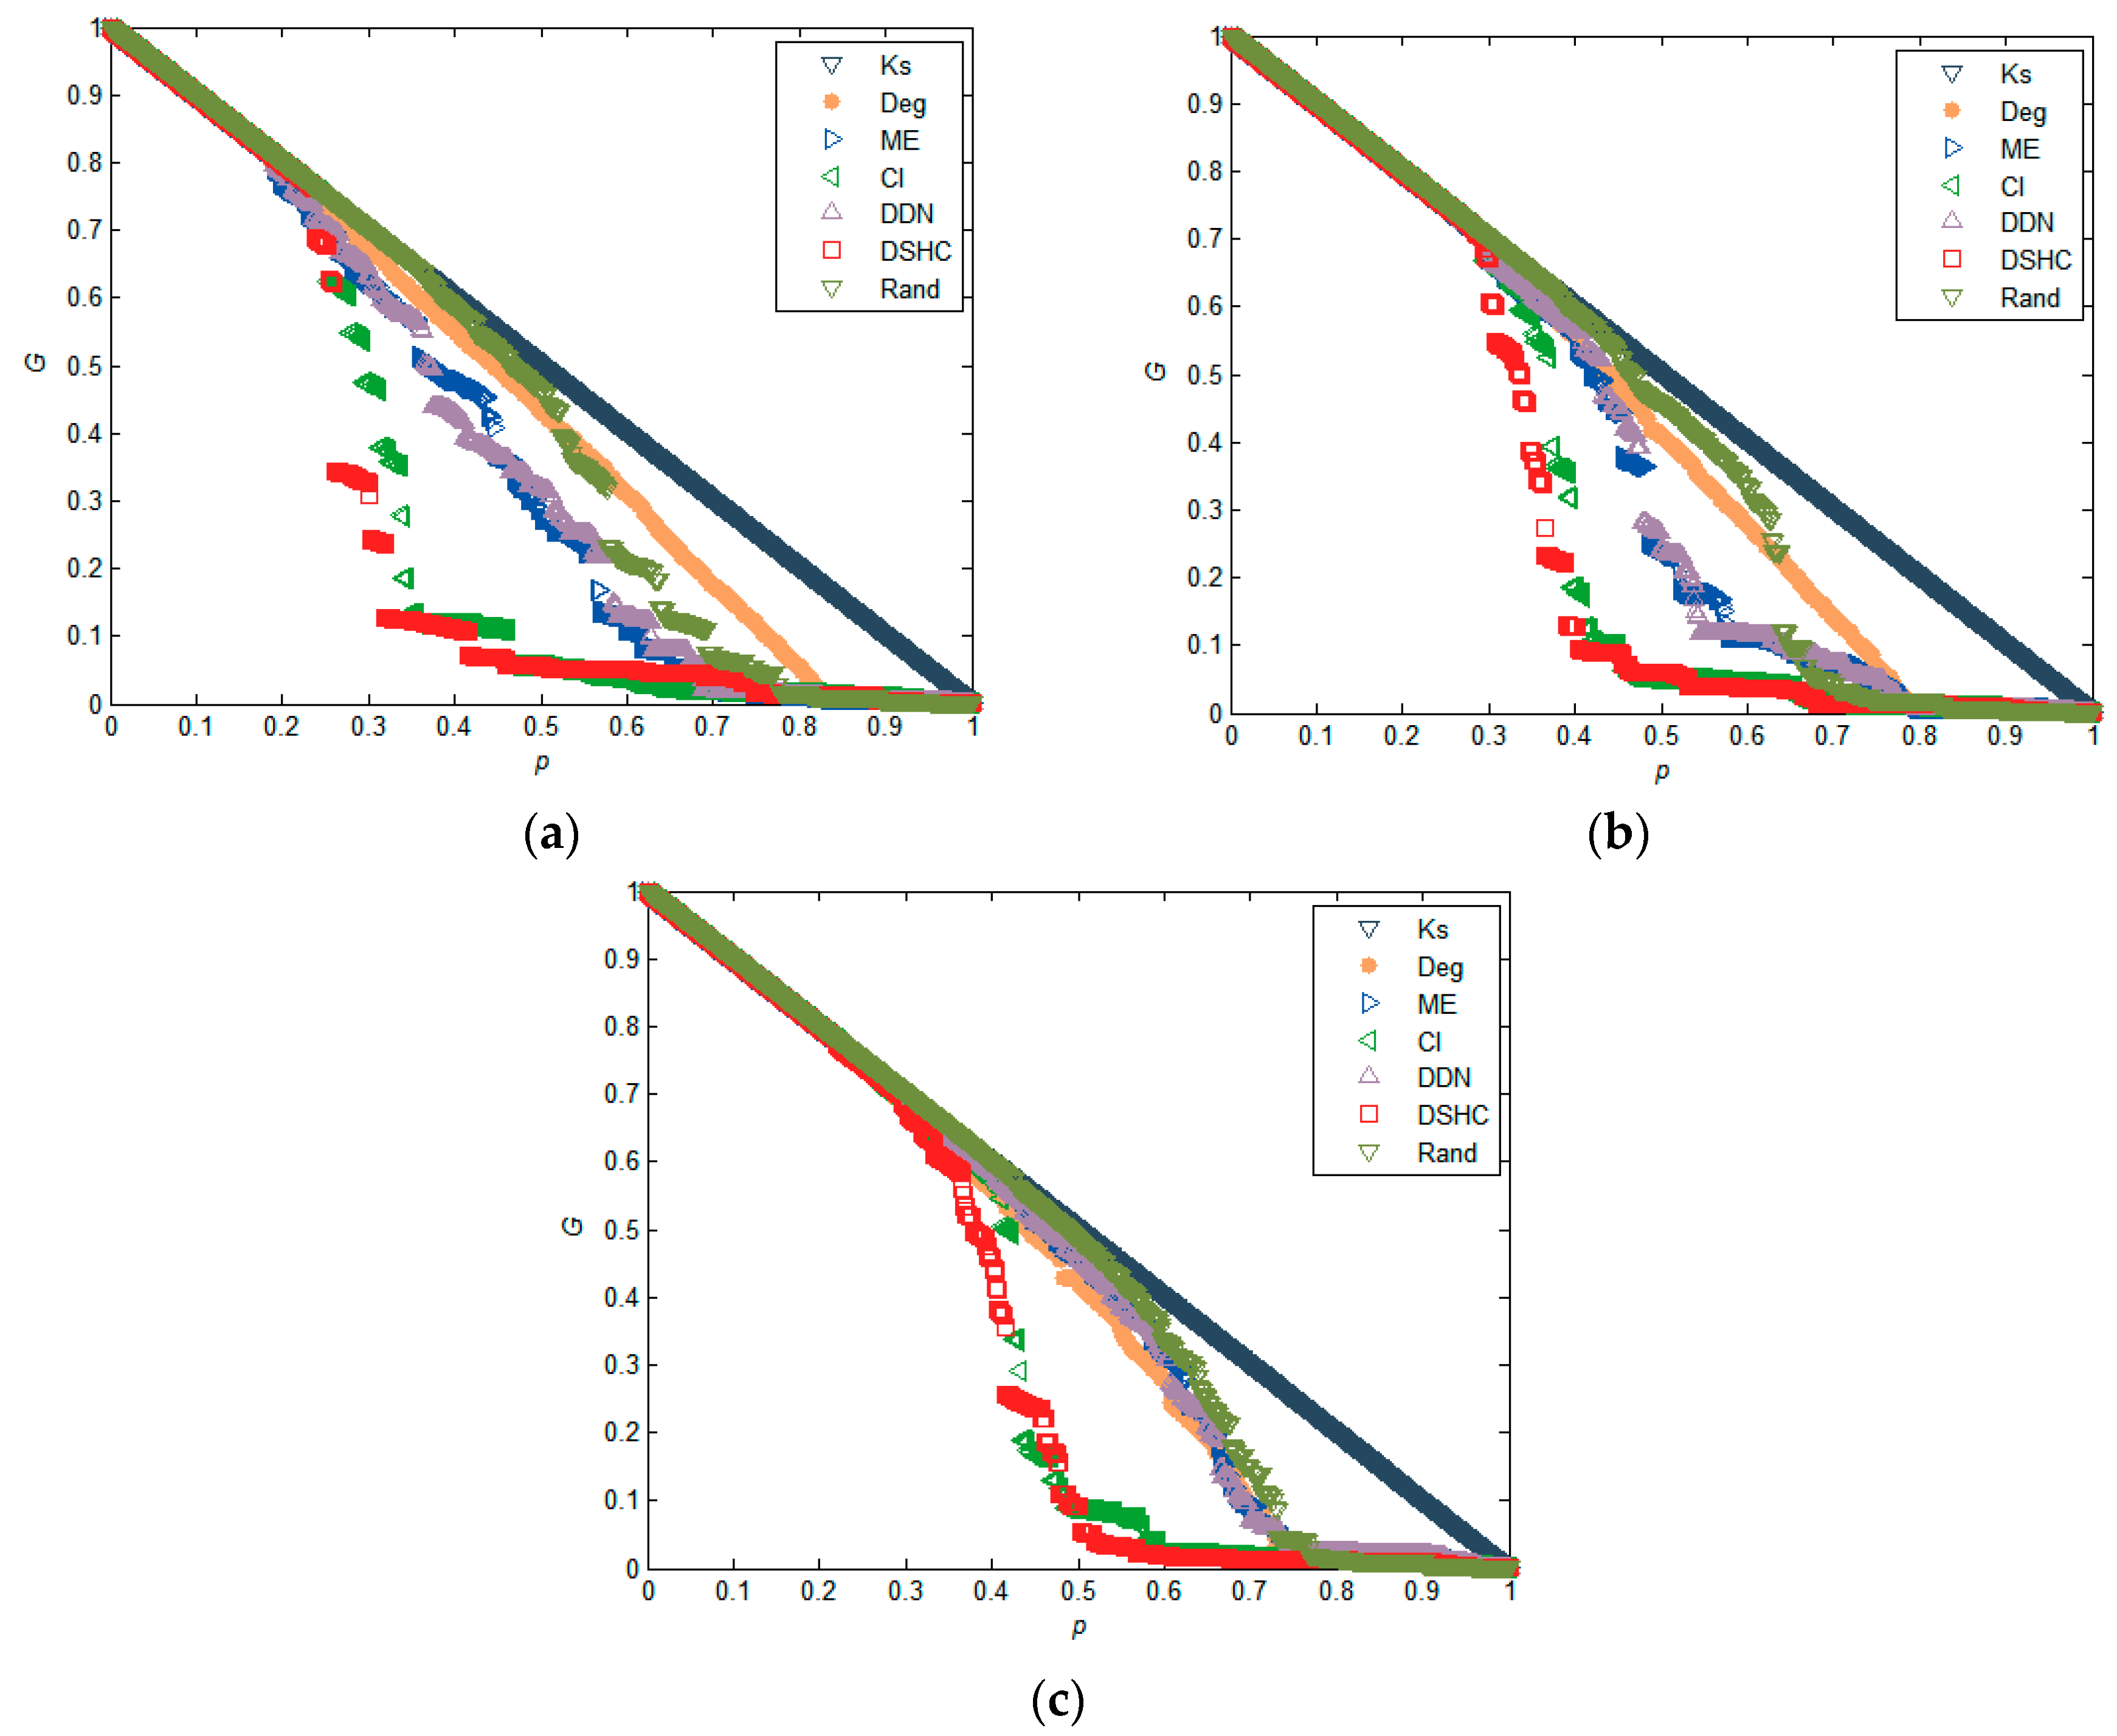
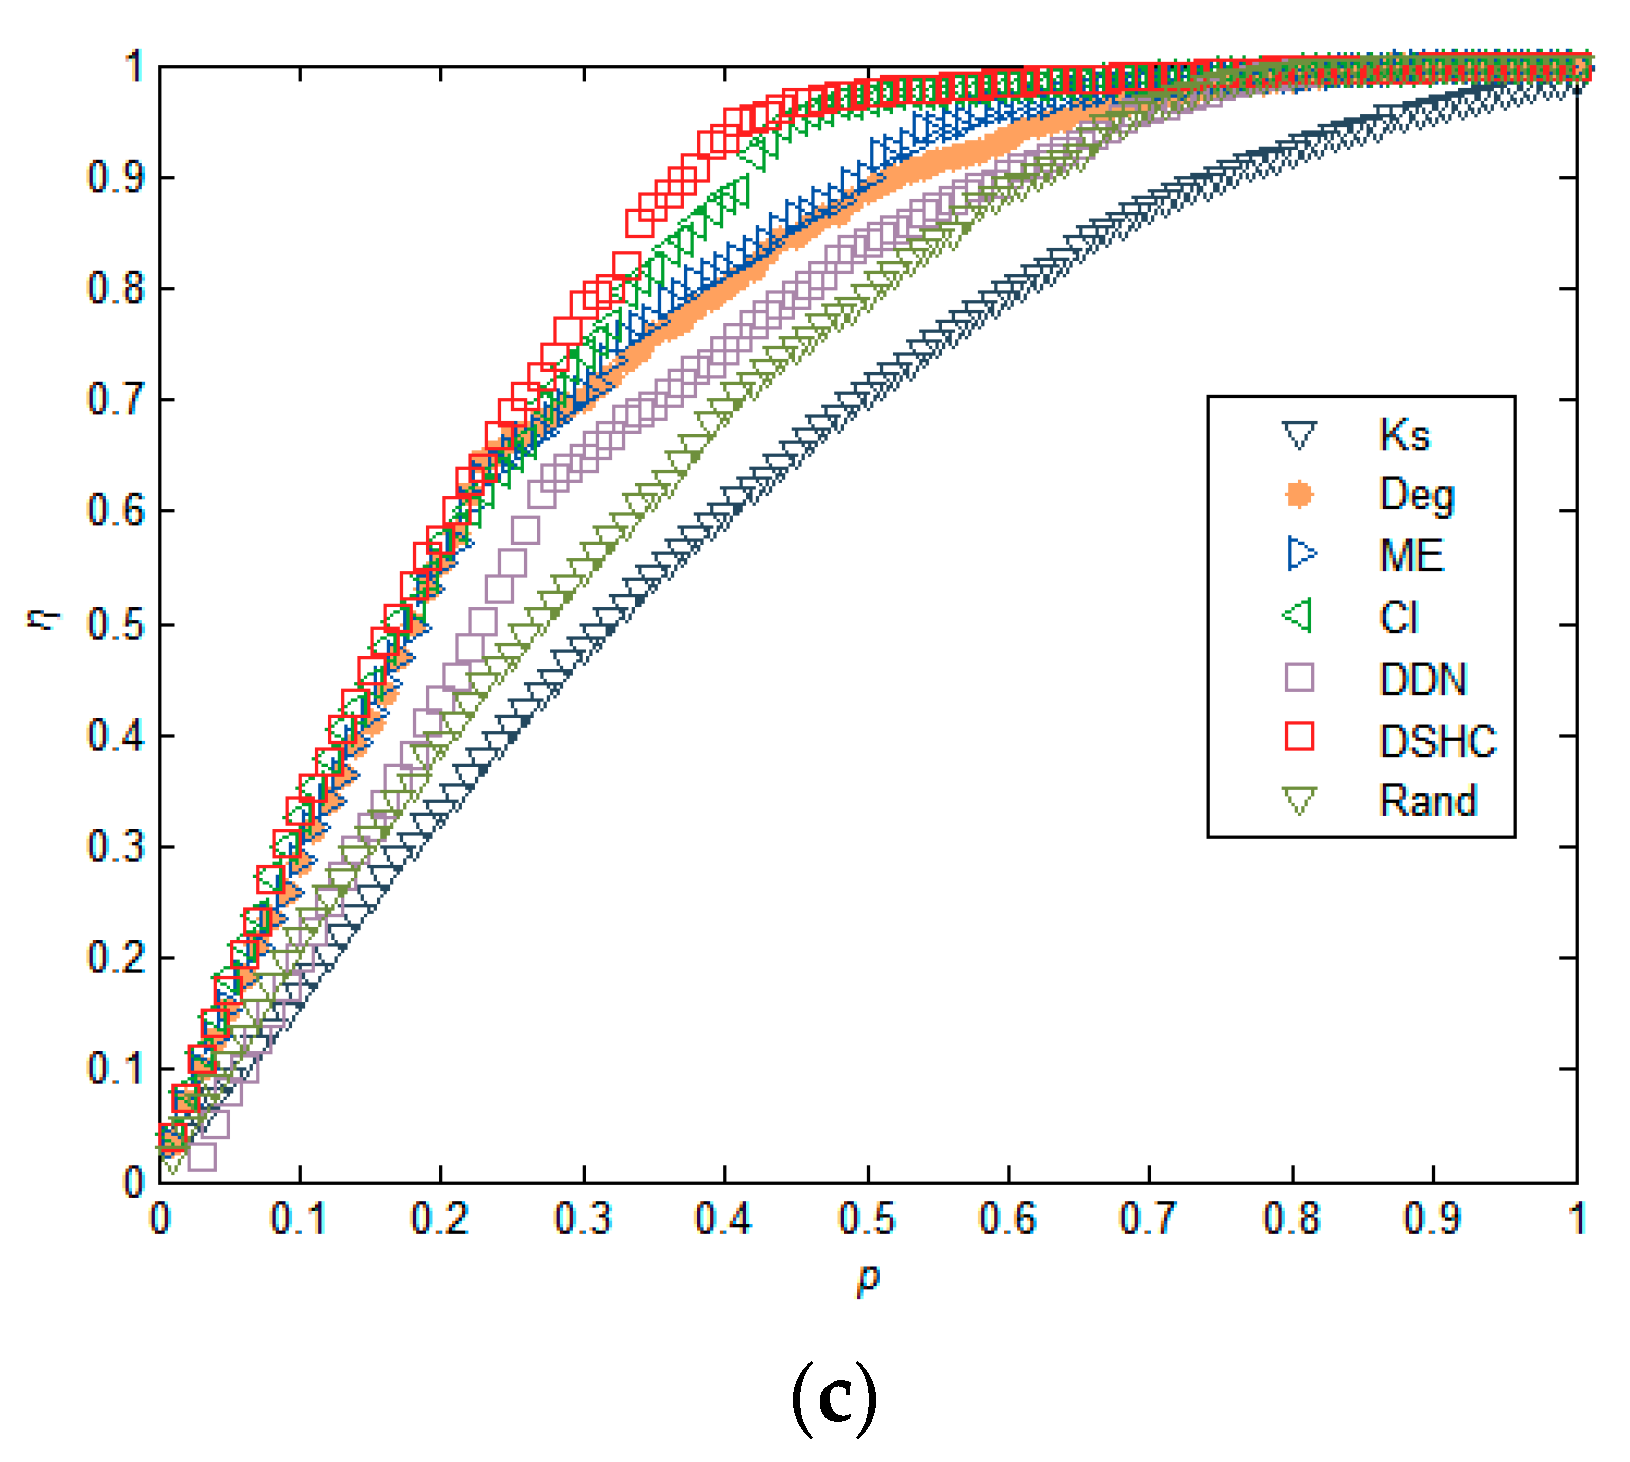
5.1. Experiments in Real Networks

The experimental results in Figure 2 reflect the performance of different attack strategies on six real networks in terms of the maximum connectivity coefficient, which is estimated by numerical simulation of the change of relative size of the giant component of the network, as mentioned previously. It can be seen that in all six networks, using DSHC indicators to remove important nodes in the network, can make the scale of the network giant change the fastest. This indicates that the proposed DSHC index can identify the most important nodes more accurately in the network than the k-shell, degree, ME, CI, DDN, and Rand. For example, in the Yeast network in Figure 2, when p = 0.2, the G values of the k-shell, degree, ME, CI, DDN, DSHC, and Rand are 0.7154, 0.5314, 0.5903, 0.5781, 0.6143, 0.2080, and 0.7229, respectively, which indicates that the network connectivity becomes worst as compared with the k-shell, degree, ME, CI, DDN, and Rand when using the DSHC method to remove the top 20% nodes. The attack effectiveness of DSHC is 70.92%, 71.23% higher than that of k-shell and Rand respectively. Similarly, in power network, when p = 0.1, the G values of the indicators k-shell, degree, ME, CI, DDN, DSHC, and Rand are 0.7891, 0.1358, 0.2374, 0.3111, 0.3036, 0.0498, and 0.8197, respectively. This shows that when the top 10% of nodes are removed according to the DSHC index, the network connectivity is also the worst as compared with the top 10% of nodes removed according to the k-shell, degree, ME, CI, DDN, and Rand algorithms.
Figure 3 shows the susceptibility of the resulting networks as a function of proportion p of nodes removed, using different attack strategies, as discussed above. We can see that the DSHC method outperforms other methods in that the network collapses into many disconnected pieces with the minimum p. More specifically, the susceptibility reaches the maximum by removing about 3% of the nodes with the proposed method in the power network (Figure 3). In contrast, the values, p, corresponding to the maximum susceptibility value of the CI and degree index are 3.56% and 4.09%, respectively. Overall, the performances of random schemes are inferior; the degree centrality can outperform the CI index, and our approach always outperforms other competing methods in these real networks.
We further compare the changes in the decline rate of network efficiency when nodes are removed based on different importance sequences calculated by k-shell, degree, ME, CI, DDN, DSHC, and Rand. It can be observed that nodes removal according to the proposed method results in the largest decrease of the network efficiency. Taking network Facebook network in Figure 4 as an example, when p changes from 0.1 to 0.5, the curve corresponding to the DSHC algorithm is always higher than the curve represented by other algorithms. In other networks, it can also be seen that DSHC algorithm can achieve better results in a larger scale of p.

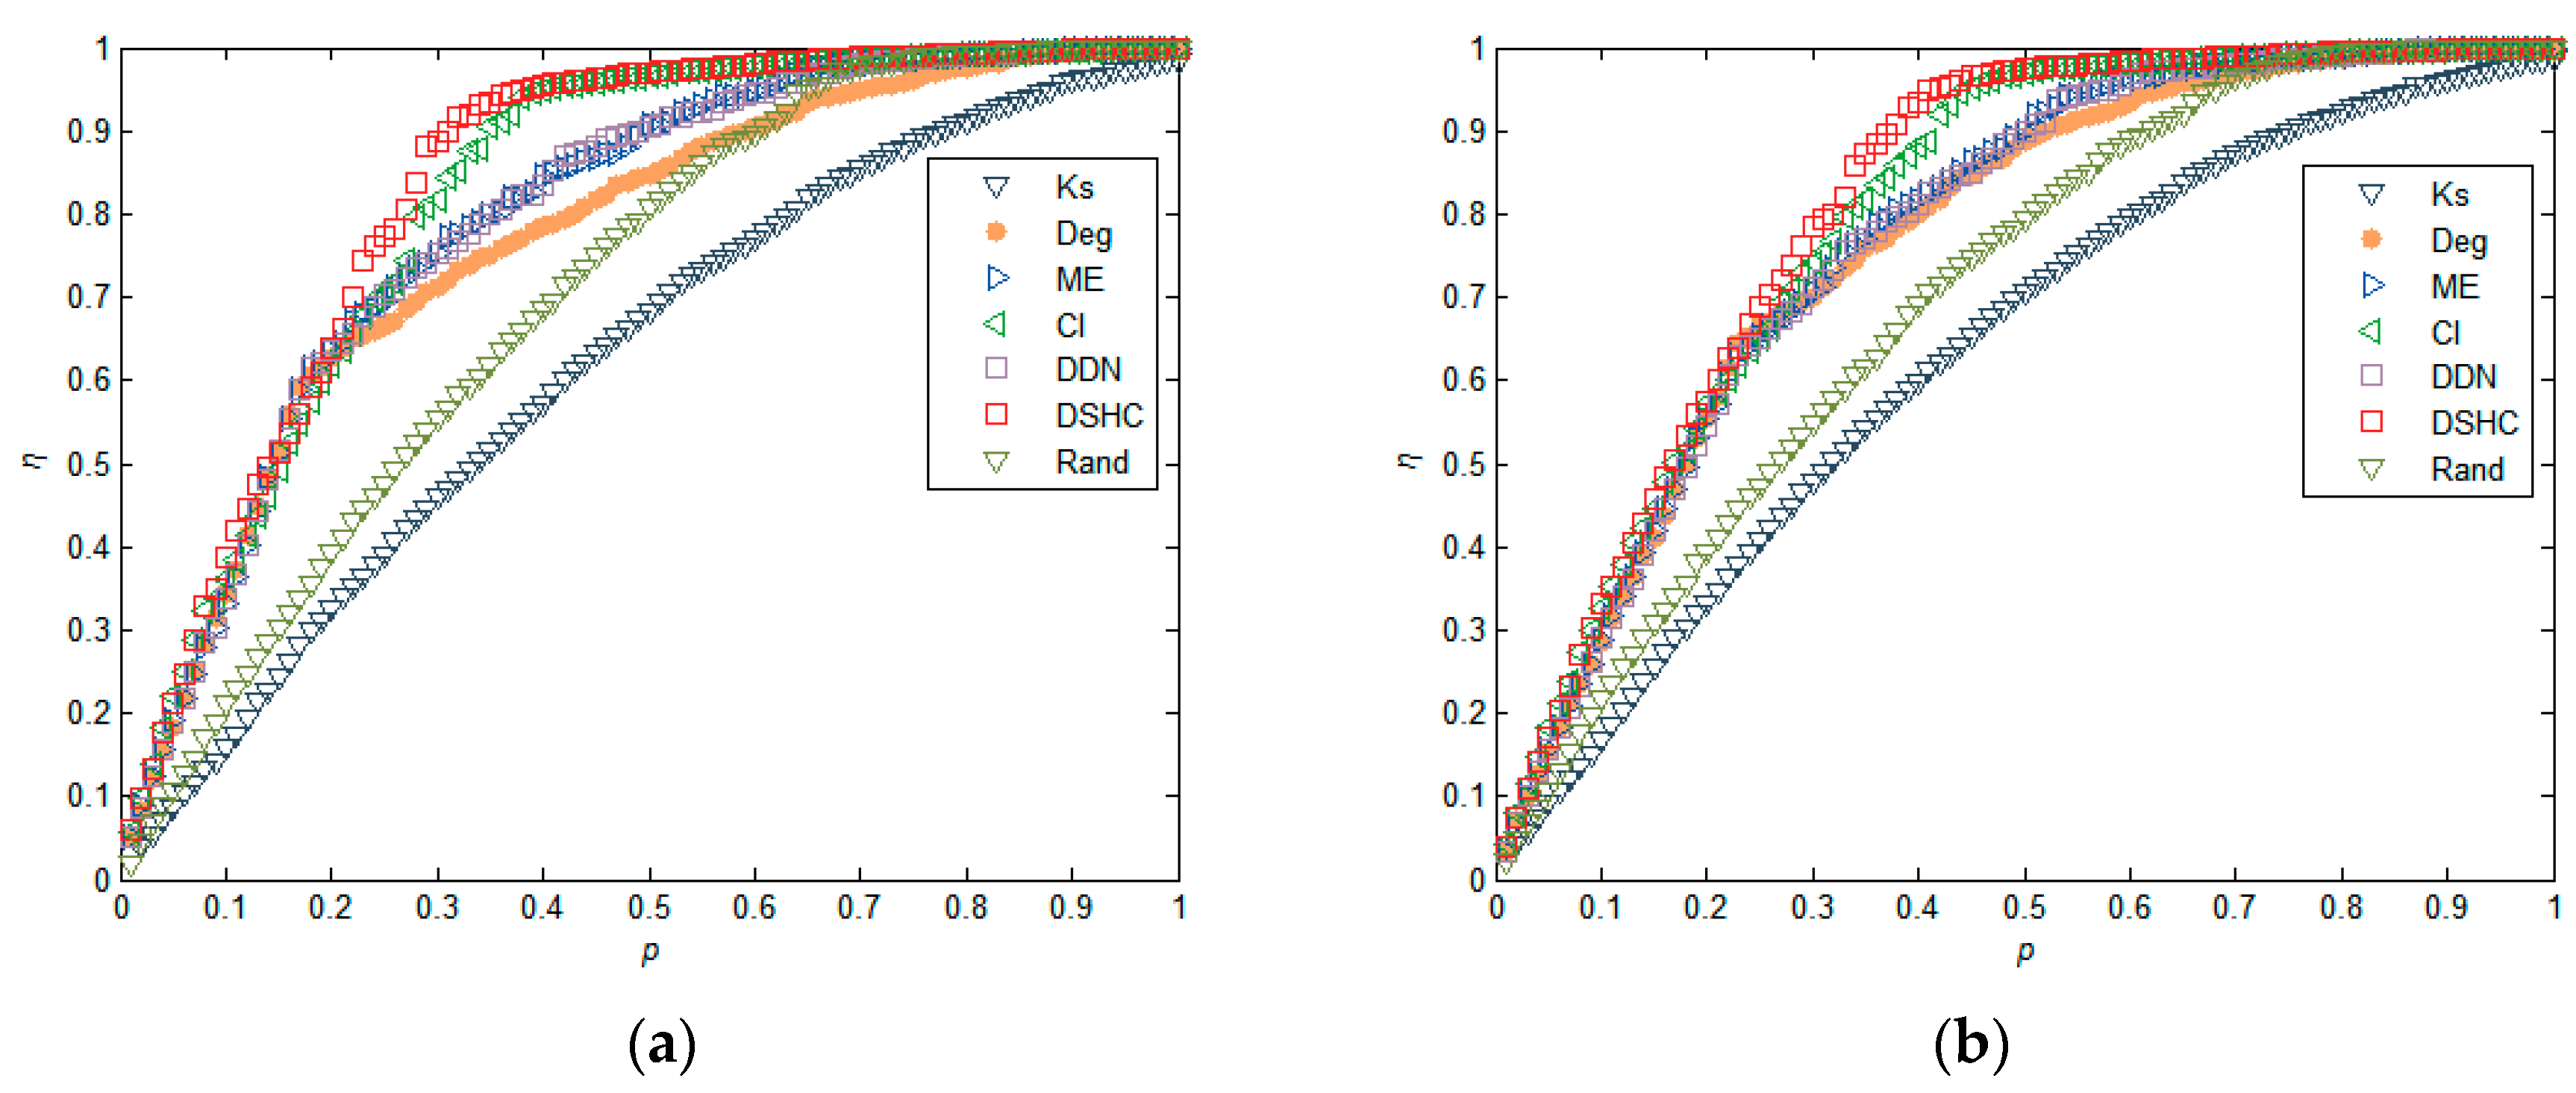
5.2. Experiments in Synthetic Networks

In addition to the real network, we also verify our approach on synthetic small-world networks. We generate three small-world networks with N = 1000 by a configuration model [47], the number of neighbor nodes of each node in the nearest-neighbor coupled network is α = 8. We adjust the density of the network by adjusting the randomization reconnection probabilities μ, and generate three network datasets with μ = 0.06, 0.08, 0.1, respectively. From the results in Figure 5, we find that our approach generally outperforms the five existing methods. This is especially true when the networks have a low level of clustering, as shown in Figure 5b,c. This is because, in a network with a low level of clustering, the structural hole characteristics of the nodes in the network are more obvious, and therefore our algorithm produces an advantage. For a highly clustered network, removing nodes whose neighbors are densely interconnected with each other hardly blocks communication between nodes’ neighbors, because alternative communication channels for its neighbors still exist. Similar results can also be found in Figure 6 and Figure 7. These results imply that nodes with higher structural holes count, and a larger degree are crucial for maintaining the network connectivity.

6. Conclusions

Ranking the importance of nodes in complex networks is a challenge of both theoretical and practical significance. In this paper, we leverage the property of structural holes to design a local algorithm to evaluate node importance in maintaining network connectivity. To compare the performance of the proposed measurement with other ranking methods, we investigate the node importance for network connectivity on real and synthetic networks. The experimental results show that our method can outperform the k-shell, degree, ME, CI, DDN, and random sort algorithm. In addition to this, comparisons with the methods using global information, show that the method based on the topological characteristics depends merely on local connectivity patterns, which is much more suitable for large-scale networks.
The algorithm proposed in this paper is used mainly in undirected and unweighted networks. When the local information of nodes is obtained, the structural importance of nodes in the network can be calculated whereas, in the real world, there is a cost limit to launching attacks in the network. Therefore, in future work, we should consider the cost of disintegrating nodes on the design of the node importance ranking algorithm.

Author Contributions

Conceptualization, H.Y.; methodology S.A.; writing-original draft preparation H.Y.; writing-review and editing, H.Y. and S.A. All authors have read and agreed to the published version of the manuscript.

Funding

This research received no external funding.

Conflicts of Interest

The authors declare no conflict of interest.

References

  1. Lü, L.Y.; Chen, D.B.; Ren, X.L.; Zhang, Q.M.; Zhou, T. Vital nodes identification in complex networks. Phys. Rep. 2016, 650, 1–63. [Google Scholar] [CrossRef] [Green Version]
  2. Albert, R.; Barabási, A.L. Statistical mechanics of complex networks. Rev. Mod. Phys. 2002, 74, 47–97. [Google Scholar] [CrossRef] [Green Version]
  3. Amini, M.H.; Arasteh, H.; Siano, P. Sustainable smart cities through the lens of complex interdependent infrastructures: Panorama and state-of-the-art. In Sustainable Interdependent Networks II; Springer: Cham, Switzerland, 2019; pp. 45–68. [Google Scholar]
  4. Liu, J.G.; Ren, Z.M.; Guo, Q.; Wang, B.H. Node importance ranking of complex networks. Acta Phys. Sin. 2013, 62, 178901. [Google Scholar]
  5. Wang, X.F.; Li, X.; Chen, G.R. Complex Networks Theory and Its Application; Tsinghua University Press: Beijing, China, 2006; pp. 1–100. [Google Scholar]
  6. Yu, C.H.; Doppler, K.; Ribeiro, C.B.; Tirkkonen, O. Resource sharing optimization for device-to-device communication underlaying cellular networks. IEEE Trans. Wirel. Commun. 2011, 10, 2752–2763. [Google Scholar]
  7. Liu, H.K.; Zhou, T. Empirical study of Chinese city airline network. Acta Phys. Sin. 2007, 56, 106–111. [Google Scholar]
  8. Zhao, Y.; Du, W.; Chen, S. Application of complex network theory to Urban transportation network analysis. Urban Transp. China 2009, 7, 57–65. [Google Scholar]
  9. Cai, K.Q.; Zhang, J.; Du, W.B.; Cao, X.B. Analysis of the Chinese air route network as a complex network. Chin. Phys. B 2012, 21, 028903. [Google Scholar] [CrossRef]
  10. Watts, D.J.; Dodds, P.S.; Newman, M.E.J. Identity and search in social networks. Science 2012, 296, 1302–1305. [Google Scholar] [CrossRef] [Green Version]
  11. Fang, X.; Misra, S.; Xue, G.; Yang, D. Smart grid—The new and improved power grid: A survey. IEEE Commun. Surv. Tutor. 2012, 14, 944–980. [Google Scholar] [CrossRef]
  12. Callaway, D.S.; Newman, M.E.J.; Strogatz, S.H.; Watts, D.J. Network Robustness and Fragility: Percolation on Random Graphs. Phys. Rev. Lett. 2000, 85, 5468. [Google Scholar] [CrossRef] [Green Version]
  13. Cohen, R.; Erez, K.; ben-Avraham, D.; Havlin, S. Breakdown of the Internet under Intentional Attack. Phys. Rev. Lett. 2001, 86, 3682. [Google Scholar] [CrossRef] [Green Version]
  14. Hao, Y.H.; Han, J.H.; Lin, Y.; Liu, L. Vulnerability of complex networks under three-level-tree attacks. Physica A 2016, 462, 674–683. [Google Scholar] [CrossRef]
  15. Ruan, Y.R.; Lao, S.Y.; Wang, J.D.; Bai, L.; Chen, L.D. Node importance measurement based on neighborhood similarity in complex network. Acta Phys. Sin. 2017, 66, 38902. [Google Scholar]
  16. Ruan, Y.R.; Lao, S.Y.; Xiao, Y.D.; Wang, J.D.; Bai, L. Identifying influence of nodes in complex networks with coreness centrality: Decreasing the impact of densely local connection. Chin. Phys. Lett. 2016, 33, 028901. [Google Scholar]
  17. Albert, R.; Jeong, H.; Barabási, A.L. Internet: Diameter of the world-wide web. Nature 1999, 401, 130–131. [Google Scholar] [CrossRef] [Green Version]
  18. Nie, T.Y.; Guo, Z.; Zhao, K.; Lu, Z.M. Using mapping entropy to identify node centrality in complex networks. Physica A 2016, 453, 290–297. [Google Scholar] [CrossRef]
  19. Morone, F.; Makse, H.A. Influence maximization in complex networks through optimal percolation. Nature 2015, 524, 65–68. [Google Scholar] [CrossRef] [Green Version]
  20. Chen, D.B.; Lü, L.Y.; Shang, M.S.; Zhang, Y.C.; Zhou, T. Identifying influential nodes in complex networks. Physica A 2012, 391, 1777–1787. [Google Scholar] [CrossRef] [Green Version]
  21. Bae, J.; Kim, S. Identifying and ranking influential spreaders in complex networks by neighborhood coreness. Physica A 2014, 395, 549–559. [Google Scholar] [CrossRef]
  22. Lü, L.Y.; Zhou, T.; Zhang, Q.-M.; Stanley, H.E. The h-index of a network node and its relation to degree and coreness. Nat. Commun. 2016, 7, 10168. [Google Scholar] [CrossRef] [Green Version]
  23. Hage, P.; Harary, F. Eccentricity and centrality in networks. Soc. Netw. 1995, 17, 57–63. [Google Scholar] [CrossRef]
  24. Stephenson, K.; Zelen, M. Rethinking centrality: Methods and examples. Soc. Netw. 1989, 11, 1–37. [Google Scholar] [CrossRef]
  25. Katz, L. A new status index derived from sociometric analysis. Psychometrika 1953, 18, 39–43. [Google Scholar] [CrossRef]
  26. Sabidussi, G. The centrality index of a graph. Psychometrika 1996, 31, 581–603. [Google Scholar] [CrossRef] [PubMed]
  27. Estrada, E.; Rodriguez-Velazquez, J.A. Subgraph centrality in complex networks. Phys. Rev. E 2005, 71, 056103. [Google Scholar] [CrossRef] [Green Version]
  28. Brin, S.; Page, L. The anatomy of a large-scale hypertextual web search engine. Web Conf. 1998, 30, 107–117. [Google Scholar] [CrossRef]
  29. Kleinberg, J.M. Authoritative sources in a hyperlinked environment. J. ACM 1999, 46, 604–632. [Google Scholar] [CrossRef]
  30. Bonacich, P. Factoring and weighting approaches to status scores and clique identification. J. Math. Sociol. 1972, 2, 113–120. [Google Scholar] [CrossRef]
  31. Lü, L.Y.; Zhang, Y.C.; Yeung, C.H.; Zhou, T. Leaders in social networks, the delicious case. PLoS ONE 2011, 6, e21202. [Google Scholar] [CrossRef] [Green Version]
  32. Weng, J.; Lim, E.P.; Jiang, J.; He, Q. Twitterrank: Finding topic-sensitive influential twitterers. In Third ACM International Conference on Web Search and Data Mining; ACM Press: New York, NY, USA, 2010; pp. 261–270. [Google Scholar]
  33. Burt, R.S. Structural Holes: The Social Structure of Competition; Harvard University Press: Cambridge, MA, USA, 2009. [Google Scholar]
  34. Wang, J.W.; Rong, L.L.; Guo, T.Z. A new measure method of network node importance based on local characteristics. J. Dalian Univ. Technol. 2010, 50, 822–826. [Google Scholar]
  35. Kitsak, M.; Gallos, L.K.; Havlin, S.; Liljeros, F.; Muchnik, L.; Eugene Stanley, H.; Makse, H.A. Identification of influential spreaders in complex networks. Nat. Phys. 2010, 6, 888–893. [Google Scholar] [CrossRef] [Green Version]
  36. Cheng, X.Q.; Ren, F.X.; Shen, H.W.; Zhang, Z.K.; Zhou, T. Bridgeness: A local index on edge significance in maintaining global connectivity. J. Stat. Mech. Theory Exp. 2010, 10, 10011. [Google Scholar] [CrossRef] [Green Version]
  37. Dereich, S.; Mörters, P. Random networks with sublinear preferential attachment: The giant component. Ann. Probab. 2013, 41, 329–384. [Google Scholar] [CrossRef] [Green Version]
  38. Vragovi’c, I.; Louis, E.; Díaz-Guilera, A. Efficiency of informational transfer in regular and complex networks. Phys. Rev. E 2005, 71, 36122. [Google Scholar] [CrossRef] [Green Version]
  39. Latora, V.; Marchiori, M. A measure of centrality based on network efficiency. New J. Phys. 2007, 9, 188. [Google Scholar] [CrossRef]
  40. Blagus, N.; Šubelj, L.; Bajec, M. Self-similar scaling of density in complex real-world networks. Physica A 2012, 391, 2794–2802. [Google Scholar] [CrossRef] [Green Version]
  41. Pajek Datasets. Available online: http://vlado.fmf.unilj.si/pub/networks/pajek/data/gphs.htm (accessed on 1 January 2006).
  42. Batagelj, V.; Mrvar, A. Pajek-program for large network analysis. Connections 1998, 21, 47–57. [Google Scholar]
  43. Zeng, A.; Liu, W. Enhancing network robustness against malicious attacks. Phys. Rev. E 2012, 85, 66130. [Google Scholar] [CrossRef] [Green Version]
  44. Sun, X.; Gollnick, V.; Wandelt, S. Robustness analysis metrics for worldwide airport network: A comprehensive study. Chin. J. Aeronaut. 2017, 30, 500–512. [Google Scholar] [CrossRef]
  45. Von Mering, C.; Krause, R.; Snel, B.; Cornell, M.; Oliver, S.G.; Fields, S.; Bork, P. Comparative assessment of large-scale data sets of protein-protein interactions. Nature 2002, 417, 399–403. [Google Scholar] [CrossRef]
  46. Guelzim, N.; Bottani, S.; Bourgine, P.; Kepes, F. Topological and causal structure of the yeast transcriptional regulatory network. Nat. Genet. 2002, 31, 60–63. [Google Scholar] [CrossRef]
  47. Watts, D.J.; Strogatz, S.H. Collective dynamics of small-world networks. Nature 1998, 393, 440–442. [Google Scholar] [CrossRef] [PubMed]
Figure 1. Concept of structural hole.
Symmetry 12 00123 g001
Figure 2. The network maximum connectivity coefficient (G) as a monotonic function of the number of removed nodes as compared with k-shell, degree, mapping entropy centrality (ME), CI, DDN, and Rand in USAir, Erdos, Facebook, USAirport, Yeast, and Power networks, respectively.
Symmetry 12 00123 g002
Figure 3. The network susceptibility (S) subjects with different attack strategies.
Symmetry 12 00123 g003
Figure 4. The decline rate of network efficiency (η) as a monotonic function of the number of blocked nodes as compared with k-shell, degree, ME, collective influence algorithm (CI), DDN, and Rand in USAir, Erdos, Facebook, USAirport, Yeast, and Power networks, respectively.
Symmetry 12 00123 g004
Figure 5. Comparison of the maximum connectivity coefficient (G) under different attack strategies in synthetic small-world networks, where the size of networks N = 1000, the number of neighbor nodes of each node in the nearest-neighbor coupled network is α = 8, and the randomization reconnection probabilities μ = 0.06, 0.08, and 0.1 for (a), (b), (c), respectively.
Symmetry 12 00123 g005
Figure 6. Comparison of the decline rate of network efficiency (η) under different attack strategies in synthetic small-world networks, where the size of networks N = 1000, the number of neighbor nodes of each node in the nearest-neighbor coupled network is α = 8, and the randomization reconnection probabilities μ = 0.06, 0.08, and 0.1 for (a), (b), (c), respectively.
Symmetry 12 00123 g006aSymmetry 12 00123 g006b
Figure 7. Comparison of the susceptibility (S) under different attack strategies in synthetic small-world networks, where the size of networks N = 1000, the number of neighbor nodes of each node in the nearest-neighbor coupled network is α = 8, and the randomization reconnection probabilities μ = 0.06, 0.08, and 0.1 for (a), (b), (c), respectively.
Symmetry 12 00123 g007
Table 1. The basic statistical features of Facebook, Erdos, USAir, USAirport, Yeast, Power networks where N and M represent the number of nodes and connections, respectively. <k> and C is the average degree and average clustering coefficient of the network, ksmax represents the largest k-shell values, and L denotes the average shortest path length.
NetworkNM<k>CksmaxL
USAir332212612.8070.625262.738
Facebook324221813.690.466183.054
Erdos44614176.330.29693.952
USAirport157428,23621.9010.505643.113
Yeast237511,6939.8470.306405.094
Power496169642.6690.080518.989

