Abstract
Recently, small and medium enterprises (SMEs) are increasingly focusing on the implementation of green innovation, mainly due to customers’ increasing environmental consciousness. However, SMEs have not yet achieved any significant accomplishment. The lack of success in implementing green practices is due to various barriers. So, it is crucial to analyze and address these barriers prior to introducing green initiatives. This study prioritizes barriers and solutions to adopt green practices in the context of SMEs in Saudi Arabia. The study develops an integrated decision framework based on symmetry principles to identify main-barriers, sub-barriers, and strategies to overcome these barriers. Six main barriers, 24 sub-barriers, and 10 strategic solutions were identified through literature survey. Then, fuzzy analytical hierarchy process (FAHP) was employed to evaluate main-barriers and sub-barriers. Later, fuzzy technique for order of preference by similarity to ideal solution (FTOPSIS) methodology was used to rank strategies. Results of FAHP revealed that the political barrier category holds higher importance than other barriers. Results of FTOPSIS showed that the strategic solution ‘developing research practices to carryout green innovation in SMEs’ is more important in addressing green innovation barriers in SMEs.
1. Introduction
Nowadays, customers have become more cognizant of environmental protection than ever [1]. Also, governments are introducing stringent environmental policies to limit pollution caused by industries, including small and medium enterprises (SMEs) [2]. These industries, irrespective of their small or medium sizes, are essential for economic growth and also responsible for environmental degradation. However, due to the small size of SMEs, their contributions to environmental degradation go unnoticed at both national and regional levels. Studies have claimed that SMEs account for nearly 70% of total industrial environmental pollution and waste. Subsequently, the increased awareness of customers and pressure from stakeholders and the governments have increased SMEs’ responsibility to minimize environmental impacts caused by their economic activities [3].
Several international level conventions urge SMEs to reduce environmental pollution to protect environmental resources and mitigate climate change challenges. Most of the countries pledged at the Paris 2015 Accord that they shall strictly adhere to the Accord’s objective of minimizing greenhouse gas emissions to protect the environment [4]. As we earlier mentioned, SMEs are one of the largest contributors to greenhouse gas emission; however, due to limited resources, SMEs are unable to come up with the expected level of participation. Therefore, policymakers and governments are focusing on the formulation of a new set of policies and the introduction of innovative ideas to help SMEs reduce their emission levels [5].
One of the best strategies that researchers and policymakers recommend for SMEs to reduce environmental pollution while being competitive is ‘green innovation.’ Green or environmental innovation involves the introduction of new and innovative products, production processes or methods, and materials that limit the utilization of natural resources and curb the release of environmental pollution and waste in the environment [6,7]. Green innovation can be a sustainable solution for addressing the surmounting environmental challenges of SMEs. Implementation of green practices can enable SMEs to gain a competitive edge and sustain in the long run [8]. However, the implementation of green innovation strategies involves various hurdles and barriers for SMEs, and it is vital for SMEs to properly analyze and address these barriers in order to successfully implement green ideas. Keeping this in view, we designed the objectives of our study as (i) to identify green innovation barriers for SMEs; (ii) to prioritize and rank identified barriers; (iii) to find strategies for these barriers; and (iv) to prioritize and rank the strategies.
To achieve the objectives of our study, we symmetrically combined two multi-criteria decision-making techniques with fuzzy set theory. The analysis is divided into three phases. In the initial phase, we identified various barriers to the implementation of green practices for SMEs through an exhaustive literature survey. Later, we classified these barriers into the major barrier categories. Finally, we obtained strategies for these barriers from the experts’ feedback and literature survey. In the second phase, we applied fuzzy analytical hierarchy process (FAHP) to obtain weights of major barriers to know the extent to which they impede green innovation. Later, we used a similar process of FAHP to compute the priority weights of sub-barriers. Lastly, we obtained global weights of sub-barriers by multiplying their priority weights to their respective major barrier category weights. In the final phase, we used global weights of sub-barriers to rank the strategies for SMEs using fuzzy technique for order of preference by similarity ideal solution (FTOPSIS). The uniqueness of this study is that it studies the understudied SME sector of Saudi Arabia. This study is the first one that identifies and ranks barriers to environmental innovation in Saudi Arabia and also provides strategies to address these barriers. Also, the topic of green innovation, despite having great importance, is still less explored and researched. Moreover, barriers and strategies to green innovation in SMEs evolve and differ depending on the background of a country or a region, so it is important to carry out research specific to a country or a region. However, the framework developed in this study can help carry further research on this topic.
The rest of the study proceeds as follows: Section 2 conducts a literature survey and identifies barriers and strategies to green innovation in the context of Saudi Arabia. Section 3 explains the importance of methods and the aim of using them in this study. Section 4 presents results and discussion, while Section 5 concludes the study.
2. Related Studies
Green innovation reduces environmental hazards, air pollution, and other negative environmental implications of product use. The term green innovation is broadly categorized into the green process, green product innovation, and green managerial or system innovation [9,10]. Researchers have provided several definitions of green innovation over the past years. We use the terms green innovation and environmental innovation interchangeably in this study. Kemp (2010) [11] put forward the definition of environmental innovation as the “product, an adaptation of a product, process of production, management or service or a novel business model that reduces pollution, environmental hazards, and other adverse impacts of resource utilization compared to relevant business methods and processes.” Likewise, Beise and Rennings (2015) [12] and De Marchi (2012) [13] described green innovation as an advanced product, process, or service that is environment-friendly and minimizes environmental risks. Ghisetti et al. (2017) [6] defined green innovation as “a significantly new or improved product, service, process, marketing solution, or organizational change that decreases natural resource use and reduces harmful substances release throughout product life-cycle.”
However, the implementation of environmental innovation is often faced with several barriers. SMEs particularly lag behind when it comes to adopting green practices. Extensive studies have revealed a variety of barriers to green practices for SMEs. We have summarized in Table 1, a few of the recent studies conducted to identify barriers to green practices and environmental innovation.

Table 1.
Relevant studies on green innovation practices in small and medium enterprises (SMEs).
2.1. Barriers and Sub-barriers to Green Innovation in Small and Medium Enterprises (SMEs)
After studying recent and most relevant studies, we obtained experts’ feedback to finalize barriers in the context of Saudi Arabia since no study has ever been conducted to identify barriers to green innovation for SMEs in Saudi Arabia. Twenty-four barriers were finalized in the context of Saudi Arabia. These barriers were categorized into six main barriers comprising economic barriers (EB), market barriers (MB), political barriers (PB), information barriers (IB), technical barriers (TB), and managerial barriers (MAB). Table 2 lists the selected barriers and sub-barriers.
Table 2.
List of main barriers and sub-barriers to green innovation in SMEs.
2.2. Strategies to Overcome Barriers to Green Innovation in SMEs
After identifying the important barriers and sub-barriers, this study has determined 10 significant strategies to overcome the barriers in implementing green practices for SMEs. The literature review suggests various strategies for SMEs to overcome these barriers and adopt green innovations. These strategies were also finalized after conducting an exhaustive literature survey. This study, therefore, finalized 10 strategies to overcome these barriers for the implementation of green innovation practices in SMEs (see Table 3).
Table 3.
List of strategies to overcome barriers to green innovation in SMEs.
Taking into account the above provides a literature review, this research study develops a systematic and effective methodology based on FAHP and FTOPSIS approaches for evaluating and prioritizing the barriers and strategies to overcome these barriers to green innovation in SMEs in the context of Saudi Arabia.
3. Research Framework
The proposed symmetric research framework (FAHP and FTOPSIS) is applied in the context of Saudi Arabia. The study is based on 10 SMEs located in different regions. Names of selected SMEs are not revealed here due to anonymity. Figure 1 presents the proposed methodology of the study. The main theme of the research is to determine barriers that impede the implementation of green innovation practices in selected SMEs and then provide strategies to overcome these barriers and implement sustainable green practices. We consulted 12 experts (managers) to assign weights to barriers and strategies. It is very important to engage qualified and professional experts while implementing any multi-criteria decision method such as fuzzy AHP and fuzzy TOPSIS, since the relevancy and understanding of experts in assigning weights could be conflicting and uncertain. In order to obtain pertinent results and avoid any disagreement among experts, we consulted 12 experienced managers in the study. Therefore, the 12 managers were engaged as respondents in both fuzzy AHP and fuzzy TOPSIS to maintain the consistency and validity of the obtained results.
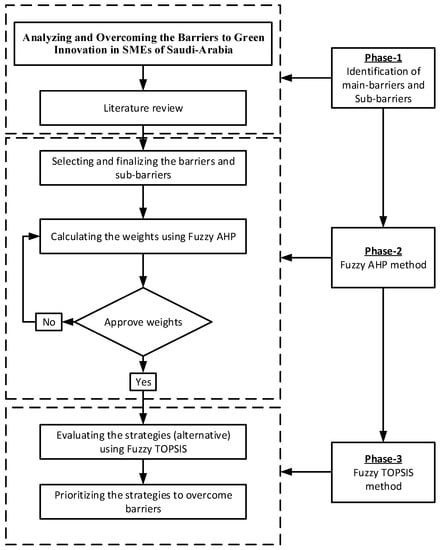
Figure 1.
The research framework of the study.
The main barriers and sub-barriers to green innovation in SMEs have been determined using the FAHP method, and then these obtained barriers were incorporated to FTOPSIS to overcome the barriers for sustainable implementation of green innovations in SMEs.
3.1. Fuzzy Analytic Hierarchy Process (FAHP) Method
Analytic hierarchy process (AHP) is a widely used technique to solve complex and multifaceted decision-making problems [63,64]. However, AHP is criticized in the literature due to its unbalanced judgment-scale, and lack of ability to incorporate vagueness and uncertainty in decision-making [65,66]. To address these shortcomings of AHP, studies integrate fuzzy with AHP to form FAHP [67]. FAHP in this study is applied in the following steps:
Let a matrix be . Let a fuzzy number be ;
Step 1: Construct paired comparison matrices using fuzzy numbers.
Step 2: Use Equations (1)–(4) to obtain values of fuzzy synthetic extent value (:
Step 3: Use Equation (5) to obtain a degree of possibility ≥ :
where is the intersection between and ; and values are compared with and .
Step 4: Obtain minimum possibility degree of : where .
Let:
then the weight vector is:
where ( represents elements:
Step 5: Vector is normalized as follows:
where is a non-fuzzy weight.
3.2. Fuzzy Technique for Order of Preference by Similarity Ideal Solution (FTOPSIS) Method
TOPSIS method was developed by Hwang and Yoon in 1981 [68]. TOPSIS method develops the relationship or a common idea based on the positive and negative ideal solution. However, in this study, a fuzzy-based TOPSIS method has been employed to obtain more reliable results by minimizing the uncertainty of the decision problem. The fuzzy set theory helps in providing the incomplete information and immeasurable problem under fuzzy environment [69,70]. This method is preferable in evaluating and ranking the alternatives using linguistic variables. Therefore, triangular fuzzy numbers (TFNs) has been used to analyze the alternatives with respect to each of their criteria. Linguistic variables can help in reducing the uncertain problem by converting it into quantitative terms [71]. There are various ways to represent linguistic variables using TFNs; Table 4 shows the linguistic variables scale of the present study.
Table 4.
Linguistic variables scale [72].
Linguistic variables based on TFNs are shown in the following steps:
Step I. Let , are the two fuzzy numbers; thus their mathematical relation is as follows:
Step II. Let be a TFNs for . Afterward, the normalized fuzzy number of each is shown as:
where and .
For a positive ideal solution (i.e., benefit criteria), the fuzzy normalization process is presented as:
where is a benefit type criteria.
For negative ideal solution (i.e., cost criteria), the fuzzy normalization process is shown as:
is cost type criteria.
Step III. Construct the fuzzy weighted normalized decision matrix.
and
Here, .
Step IV. Determine the distance between fuzzy ideal () and fuzzy negative () the ideal solution.
where
where .
Here, the distance between , is presented as:
Step V. Construct the closeness coefficient of each alternative:
where ; is a distance from fuzzy positive ideal solution; and is the distance from the fuzzy negative ideal solution.
Step VI. Rank and select optimal alternatives.
After utilizing FTOPSIS method steps, it would provide the ranking of alternatives with respect to ideal and negative ideal solution.
4. Results and Discussion
In the study, a hybrid decision framework (i.e., FAHP and FTOPSIS) has been used to assess and overcome the barriers to green innovation services in SMEs. The FAHP method has been employed to assess six main barriers and 24 sub-barriers. The comprehensive analysis of main-barriers and sub-barriers to green innovation in SMEs is provided in Appendix A. Then, the FTOPSIS method has been used to overcome the barriers by proposing 10 strategies to green innovation in SMEs. This is the first kind of study for Saudi Arabia to implement green innovation practices in SMEs. Thus, the present analysis lays a foundation for stakeholders, policymakers, and governments to determine the decision framework for overcoming the barriers as well as for sustainable implementation of green innovation practices in SMEs of Saudi Arabia.
4.1. The Main Barriers Results of FAHP
The FAHP method has identified main barriers results. A total of six main barriers were finalized for green innovation practices through experts’ opinion and analysis. Figure 2 presents the weights and ranking of main barriers. The results reveal that political barriers (PB) with a weight of 0.191 is the most influential barrier that impedes the implementation of green innovation in SMEs. The remaining main barriers are ordered as follows: Managerial barriers (MAB) with a weight of 0.181, technical barriers (TB) with a weight of 0.180, information barriers (IB) with a weight of 0.174, economic barriers (EB) with a weight of 0.150, and market barriers (MB) with a weight of 0.123. The analysis is originally made in the context of Saudi Arabia; as such, every country has different economic, market, political, technical, and social conditions [73].
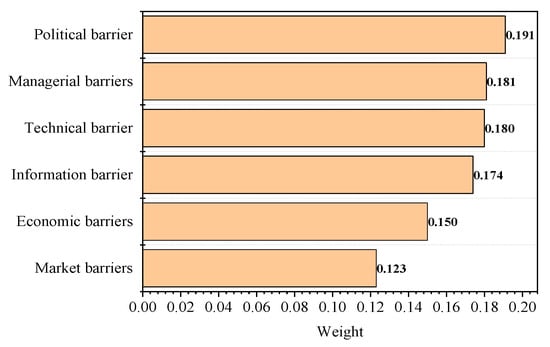
Figure 2.
Ranking of main barriers with respect to the goal.
4.2. The Sub-Barriers Results of FAHP
Figure 3 presents the weights and ranking of the sub-barriers with respect to economic barriers (EB). The high green system costs (EB4) with a weight of 0.217, the lack of subsidies and financial incentives (EB3) with a weight of 0.211, and high disposing of hazardous wastes costs (EB5) with a weight of 0.208 have been prioritized as the most influential sub-barriers. Whereas, less payoff (EB2) with a weight of 0.192, and unavailability of bank loans (EB1) with a weight of 0.171 are the least significant sub-barriers towards the implementation of green innovations in SMEs of Saudi Arabia. However, all the analyzed sub-barriers are very critical for the successful implementation of green innovations in SMEs.
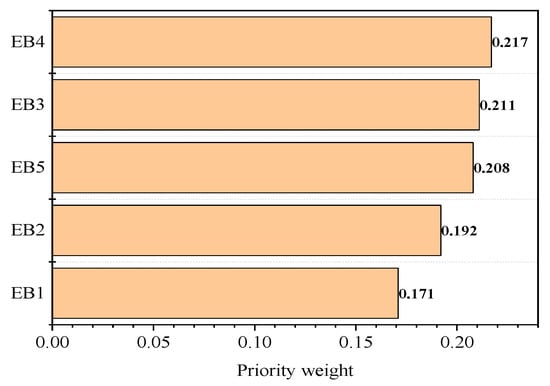
Figure 3.
Weights and ranking of sub-barriers with respect to the economic barriers (EB).
According to [6], financial support is very important for green innovations; however, green innovation systems are not developed due to improper financial systems. The high prices for purchasing green innovations is also a key barrier or concern for SMEs because the financial budget to handle green activities is very small, and limited financial support schemes act as a critical barrier to green innovation [19]. Thus, the government and policymakers should enhance the financial benefits and reduce the green system costs to SMEs for the development of green innovations.
Figure 4 shows the sub-barriers ranking with respect to market barriers (MB). Therefore, from the MB perspective, the lack of customers’ responsiveness (MB2) with a weight of 0.398, and the lack of awareness and knowledge (MB3) with a weight of 0.390 have been ranked as important sub-barriers. While inability to access market (MB1) with a weight of 0.212 has been prioritized as the least important sub-barrier towards the successful implementation of green innovations in SMEs. It is important to open doors of the market to access green resources, to produce green products, and to enhance the customers’ responsiveness, knowledge, and awareness about green products. The demand for the product entirely depends upon the customers’ willingness and choice about the product; green product customers are often unwilling to pay additional money for the product, which impedes innovation efforts due to lack of customer demand [30]. Unfortunately, the customers are unaware of the benefits of green innovation to the environment, which leads to the low demand for green products [29,37]. Therefore, it is important for governments and policymakers to analyze the market barriers to green innovations in SMEs.
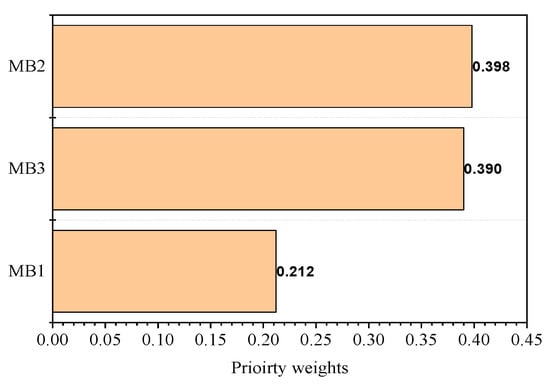
Figure 4.
Weights and ranking of sub-barriers with respect to the market barriers (MB).
Figure 5 depicts the sub-barriers ranking with respect to political barriers (PB). The results reveal that the implementation of environmental policies (PB3) with a weight of 0.276, and the lack of government policies to upgrade green technology (PB2) with a weight of 0.257 have emerged as significant sub-barriers that impede the green innovation practices in SMEs in Saudi Arabia. The complex green policies (PB1) with a weight of 0.253 have been considered a third important sub-barrier, while the lack of training and consultancy programs (PB4) is the least important sub-barrier. It is determined that the government should ease the making of green policies and regulations, making effective environmental policies to take advantage, and initiate training programs for SMEs to incorporate green innovation practices in the country [19]. It is important to have confidence over the government for sustainable deployment of green innovation practices in SMEs; therefore, the government and policymakers are responsible to design and formulate policies for sustainable green innovations.
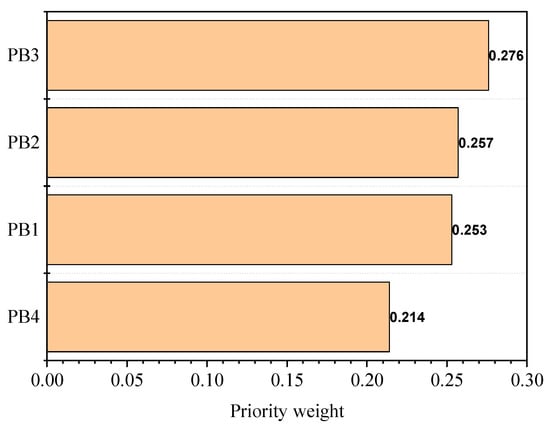
Figure 5.
Weights and ranking of sub-barriers with respect to the political barriers (PB).
Figure 6 shows the sub-barriers ranking with respect to information barriers (IB). The results indicate that lack of technological information (IB3) is a key sub-barrier with a weight of 0.258, following lack of ability (IB4), lack of knowledge (IB2), and lack of awareness (IB1), respectively. The lack of technical information refers to the unavailability of green technologies to transform the SMEs into green innovation practices. While lack of knowledge refers to the green practices and legislations among entrepreneurs and employees, they also have a lack of ability to determine environmental prospects. Further, they have no information or lack of awareness to recycle wastage material and reverse logistics facilities. Thus, the government should enhance information and knowledge programs regarding green practices.
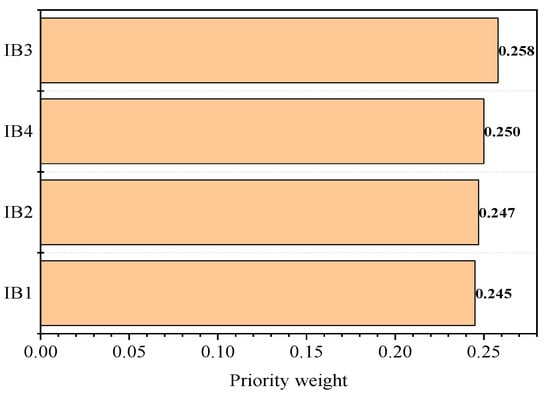
Figure 6.
Weights and ranking of sub-barriers with respect to the information barriers (IB).
Figure 7 presents the sub-barriers ranking with respect to technical barriers (TB). From the TB perspective, the lack of research and development (R&D) capacity (TB2) with a weight of 0.272 was identified to be greatest sub-barrier to the development of green innovation in SMEs. Whereas, complex designing process (TB3) was identified as a moderate significant sub-barrier towards the development of green innovation practices in SMEs. Technological and market uncertainty (TB1), and the lack of technologies (TB4) have been recognized as the least important sub-barriers that impede the use of green practices in SMEs.
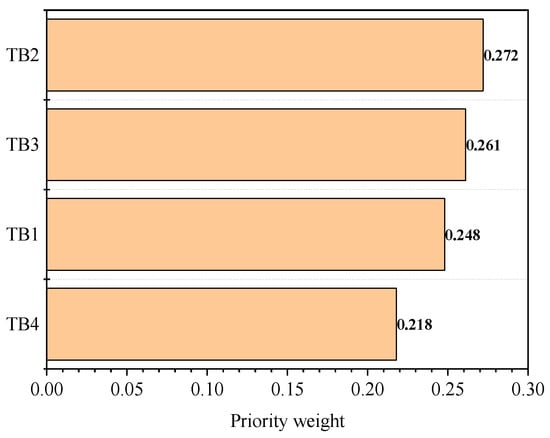
Figure 7.
Weights and ranking of sub-barriers with respect to the technical barriers (TB).
The results have a similarity with the past study conduct by Maria et al. [30], in which authors identified a lack of technological expertise as an important barrier to green innovation, because less technical expertise leads to the negative impact over green innovation practices of the enterprise. The sufficient R&D capacities, financial resources, and green innovation provides a benefit to the enterprise or organization and helps them to initiate green innovation products. For any SMEs, the environmental resources are important for long run sustainability. Technical barriers involve the lack of technologies or complex demand patterns for green innovations; therefore, it is important to systematically manage the technologies for green products, which are often considered an important barrier to green innovations [19]. Saudi Arabia is a developing economy with limited technological resources; therefore, the government requires gigantic efforts to involve green innovation practices in SMEs by improving technological services.
Figure 8 shows the sub-barriers ranking with respect to managerial barriers (MAB). Within the managerial barriers (MAB), unwillingness to switch to green practices (MAB3) with a weight of 0.286 was determined as the most dominant sub-barrier to green innovation in SMEs. The rest of the barriers have been ranked as follows: Lack of commitment (MAB2), lack of reward systems (MAB4), and lack of human resources (MAB1), respectively. SMEs are facing many socio-economic and environmental challenges; therefore, it is a reluctance to switch to green practices, and lack of commitment from SME entrepreneurs to implement green innovation practices, as well as lack of human resources for green innovation that are the key barriers in the development of green innovations in SMEs [2]. All these sub-barriers should be reduced or overcome for the sustainable development of SMEs.
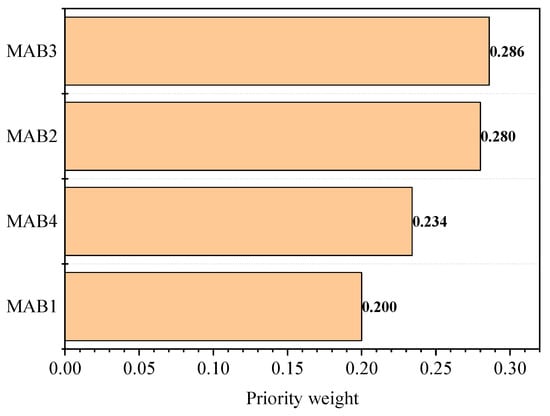
Figure 8.
Weights and ranking of sub-barriers with respect to the managerial barriers (MAB).
4.3. The Overall Sub-Barriers Results
In this sub-section, the 24 sub-barriers weights were evaluated, regardless of their grouping. Table 5 presents the final ranking of these overall sub-barriers. The results indicate that implementation of environmental policies (PB3) with a weight of 0.0527 is ranked as the most influential sub-barrier, followed by lack of commitment (MAB2) with a weight of 0.0518, and unwillingness to switch to green practices (MAB3) with a weight of 0.0507, as second and third most significant sub-barriers, respectively. The lack of commitment to the green innovation, and lack of technology to design efficient green products impede a switch over to the green innovation system [43]. The remaining sub-barriers have been ranked as follows: PB2 < TB2 < MB2 < PB1 < MB3 < TB3 < IB3 < TB1 < IB4 < IB2 < IB1 < MAB4 < BP4 < TB4 < MAB1 < EB4 < EB3 < EB5 < EB2 < MB1 < EB1. It is evident that all these considered sub-barriers can impede the development of green innovation in SMEs of Saudi Arabia.
Table 5.
Weights and ranking of overall sub-barriers.
4.4. FTOPSIS Results
Various important strategies have been proposed in the study to overcome the main barriers to the development of green innovation practices in SMEs of Saudi Arabia. In this context, the FTOPSIS method has been used to identify and rank green innovation strategies. The analysis of this method has established a fuzzy evaluation matrix using TFNs scale. Appendix B provides the overall analysis of FTOPSIS method. Table 6 presents the final prioritizing order of strategies to overcome the barriers to green innovation in SMEs.
Table 6.
Ranking of strategies to overcome barriers to green innovation in SMEs of Saudi Arabia.
The main results indicate that “developing research practices to carry out green innovation in SMEs (S1)” is ranked as the highest green innovation strategy for the development of SMEs. While “increasing research and development (R&D) practices to design green products (S6),” and “developing environmental management systems for monitoring the systems in SMEs (S3)” are the second and third important green innovation strategies to overcome the barriers in the SMEs. The remaining ranking of the strategies (i.e., alternatives) are as follows: S5 > S4 > S9 > S10 > S7 > S2 > S8.
The government needs to develop a clear and systematic decision framework to implement green innovation practices in SMEs of Saudi Arabia. This framework can be determined through policies like technological support, subsidized loans, and environmental tax benefits, etc. It is also important for the government to increase R&D capacity for designing green products for SMEs, as it would help in shifting SMEs to green practices. Moreover, SMEs have resource constraints, and a beginner can face difficulty in developing new technologies and so implementing standard processes can help SMEs to turn green [67]. The study aimed to assess and overcome the barriers to green innovation in SMEs of Saudi Arabia. This study helps governments, policymakers, and stakeholders to evaluate the important barriers that impede the development of green innovation in SMEs. Therefore, this research will be very useful in planning and developing green innovation system in SMEs.
5. Conclusions
Implementation of green innovation practices, the production of green products, and recycling of waste material or activities in SMEs are still at an initial stage in Saudi Arabia. The SMEs of the country are lagging behind due to their limited capacity-based size. Nowadays, many countries are shifting and implementing their SMEs to green innovation practices, and this can be a solution to their problem by overcoming the barriers. Therefore, this is the very first attempt to evaluate the barriers and strategies to overcome these barriers of green innovation in SMEs in the context of Saudi Arabia. In the study, a comprehensive decision framework has been used to understand these barriers for green practices in the context of SMEs.
To address the research gap, the present study has proposed a symmetric decision support framework (i.e., FAHP and FTOPSIS) to identify and evaluate main barriers and strategies to overcome these barriers to adopting green innovation practices in SMEs. The framework was proposed with the help of existing literature and 12 professional experts of Saudi Arabian SMEs. In the study, a total of six main barriers and 24 sub-barriers were identified, along with 10 strategies to overcome these identified barriers to green innovation in SMEs of Saudi Arabia. The main barriers and sub-barriers were evaluated and ranked through FAHP method. The results indicate that political barriers (PB) are the most vital barriers followed by managerial barriers (MAB) and technical barriers (TB). Then, FTOPSIS methodology was employed to prioritize strategies to overcome the main barriers and sub-barriers to green innovation in SMEs. Developing research practices to carry out green innovation in SMEs (S1) is placed first among strategies, followed by increasing research and development (R&D) practices to design green products (S6), and developing environmental management systems for monitoring the systems in SMEs (S3). Analyzing these strategies can greatly help policymakers and managers to implement green innovation practices in SMEs.
This study has been carried out in a comprehensive way; however, it has several limitations which need to be analyzed in the future research study. This study particularly was undertaken in the context of five SMEs of Saudi Arabia. Therefore, it is important to compare the results of this study with similar SMEs of other countries. Further, every country has its own and different barriers in the implementation of green innovation practices in SMEs. This research has FAHP and FTOPSIS methodology for prioritizing barriers and strategies to overcome the barriers. But, other MCDM methods such as ANP, VIKOR, ELECTRE, and WASPAS can also be used to compare the results for any changes. Moreover, a large number of SMEs can be explored and taken as a case study to statistically validate the findings. Finally, this study has attempted to analyze barriers and strategies to green innovation in SMEs; therefore, further research can shed much more light on this topic.
Author Contributions
All the authors contributed to this work. A.S.M.O. and Z.Z. conceived and structured the study. S.A.A.S. undertook the survey and along with A.O.M.O., A.S.M.O. and S.A.A.S. developed the methodology and preliminary manuscript. Z.A.S. and H.H. reviewed and improved the manuscript. All authors have read and agreed to the published version of the manuscript.
Funding
This research received no external funding.
Acknowledgments
The authors acknowledge anonymous reviewers for providing their valuable comments to improve this manuscript.
Conflicts of Interest
The authors declare no conflict of interest.
Appendix A
Table A1.
Fuzzy paired comparison matrix of main barriers.
Table A1.
Fuzzy paired comparison matrix of main barriers.
| EB | MB | PB | IB | TB | MAB | |
|---|---|---|---|---|---|---|
| EB | 1, 1, 1 | 0.983, 1.399, 1.846 | 0.649, 0.872, 1.188 | 0.566, 0.733, 1.036 | 0.566, 0.765, 1.109 | 0.606, 0.799, 1.109 |
| MB | 0.542, 0.715, 1.017 | 1, 1, 1 | 0.606, 0.835, 1.188 | 0.519, 0.684, 0.992 | 0.566, 0.733, 1.036 | 0.566, 0.765, 1.109 |
| PB | 0.842, 1.147, 1.541 | 0.842, 1.198, 1.65 | 1, 1, 1 | 0.966, 1.364, 1.825 | 0.842, 1.147, 1.591 | 0.827, 1.176, 1.592 |
| IB | 0.966, 1.364, 1.767 | 1.008, 1.461, 1.927 | 0.548, 0.733, 1.036 | 1, 1, 1 | 0.728, 0.971, 1.316 | 0.649, 0.872, 1.188 |
| TB | 0.902, 1.306, 1.767 | 0.966, 1.364, 1.767 | 0.629, 0.872, 1.188 | 0.842, 1.147, 1.541 | 1, 1, 1 | 0.649, 0.91, 1.272 |
| MAB | 0.902, 1.251, 1.65 | 0.902, 1.306, 1.767 | 0.628, 0.851, 1.21 | 0.842, 1.147, 1.541 | 0.786, 1.099, 1.541 | 1, 1, 1 |
Table A2.
Fuzzy paired comparison matrix of economic sub-barriers.
Table A2.
Fuzzy paired comparison matrix of economic sub-barriers.
| EB1 | EB2 | EB3 | EB4 | EB5 | |
|---|---|---|---|---|---|
| EB1 | 1, 1, 1 | 0.983, 1.399, 1.846 | 0.649, 0.872, 1.188 | 0.566, 0.733, 1.036 | 0.566, 0.765, 1.109 |
| EB2 | 0.542, 0.715, 1.017 | 1, 1, 1 | 0.606, 0.835, 1.188 | 0.519, 0.684, 0.992 | 0.566, 0.733, 1.036 |
| EB3 | 0.842, 1.147, 1.541 | 0.842, 1.198, 1.65 | 1, 1, 1 | 0.966, 1.364, 1.825 | 0.842, 1.147, 1.591 |
| EB4 | 0.966, 1.364, 1.767 | 1.008, 1.461, 1.927 | 0.548, 0.733, 1.036 | 1, 1, 1 | 0.728, 0.971, 1.316 |
| EB5 | 0.902, 1.306, 1.767 | 0.966, 1.364, 1.767 | 0.629, 0.872, 1.188 | 0.842, 1.147, 1.541 | 1, 1, 1 |
Table A3.
Fuzzy paired comparison matrix of market sub-barriers.
Table A3.
Fuzzy paired comparison matrix of market sub-barriers.
| MB1 | MB2 | MB3 | |
|---|---|---|---|
| MB1 | 1, 1, 1 | 0.475, 0.633, 0.855 | 0.593, 0.801, 1.09 |
| MB2 | 1.17, 1.579, 2.105 | 1, 1, 1 | 0.695, 0.868, 1.087 |
| MB3 | 0.918, 1.249, 1.686 | 0.92, 1.151, 1.439 | 1, 1, 1 |
Table A4.
Fuzzy paired comparison matrix of political sub-barriers.
Table A4.
Fuzzy paired comparison matrix of political sub-barriers.
| PB1 | PB2 | PB3 | PB4 | |
|---|---|---|---|---|
| PB1 | 1, 1, 1 | 0.866, 1.194, 1.626 | 0.578, 0.774, 1.099 | 0.813, 1.104, 1.492 |
| PB2 | 0.615, 0.837, 1.155 | 1, 1, 1 | 0.872, 1.17, 1.543 | 0.83, 1.137, 1.511 |
| PB3 | 0.91, 1.292, 1.731 | 0.648, 0.855, 1.146 | 1, 1, 1 | 0.929, 1.265, 1.681 |
| PB4 | 0.67, 0.906, 1.229 | 0.662, 0.88, 1.204 | 0.595, 0.79, 1.077 | 1, 1, 1 |
Table A5.
Fuzzy paired comparison matrix of information sub-barriers.
Table A5.
Fuzzy paired comparison matrix of information sub-barriers.
| IB1 | IB2 | IB3 | IB4 | |
|---|---|---|---|---|
| IB1 | 1, 1, 1 | 0.963, 1.397, 1.967 | 0.508, 0.716, 1.038 | 0.638, 0.88, 1.249 |
| IB2 | 0.508, 0.716, 1.038 | 1, 1, 1 | 0.872, 1.17, 1.543 | 0.824, 1.137, 1.523 |
| IB3 | 0.963, 1.397, 1.967 | 0.648, 0.855, 1.146 | 1, 1, 1 | 0.725, 0.952, 1.275 |
| IB4 | 0.801, 1.137, 1.567 | 0.657, 0.88, 1.213 | 0.784, 1.051, 1.379 | 1, 1, 1 |
Table A6.
Fuzzy paired comparison matrix of technical sub-barriers.
Table A6.
Fuzzy paired comparison matrix of technical sub-barriers.
| TB1 | TB2 | TB3 | TB4 | |
|---|---|---|---|---|
| TB1 | 1, 1, 1 | 0.805, 1.137, 1.56 | 0.569, 0.74, 1.006 | 0.842, 1.127, 1.508 |
| TB2 | 0.641, 0.88, 1.243 | 1, 1, 1 | 0.877, 1.17, 1.535 | 0.834, 1.137, 1.504 |
| TB3 | 0.994, 1.351, 1.758 | 0.651, 0.855, 1.141 | 1, 1, 1 | 0.87, 1.137, 1.442 |
| TB4 | 0.663, 0.887, 1.188 | 0.665, 0.88, 1.198 | 0.694, 0.88, 1.149 | 1, 1, 1 |
Table A7.
Fuzzy paired comparison matrix of managerial sub-barriers.
Table A7.
Fuzzy paired comparison matrix of managerial sub-barriers.
| MAB 1 | MAB 2 | MAB 3 | MAB 4 | |
|---|---|---|---|---|
| MAB1 | 1, 1, 1 | 0.805, 1.137, 1.56 | 0.569, 0.74, 1.006 | 0.842, 1.127, 1.508 |
| MAB 2 | 0.641, 0.88, 1.243 | 1, 1, 1 | 0.877, 1.17, 1.535 | 0.834, 1.137, 1.504 |
| MAB 3 | 0.994, 1.351, 1.758 | 0.651, 0.855, 1.141 | 1, 1, 1 | 0.87, 1.137, 1.442 |
| MAB 4 | 0.663, 0.887, 1.188 | 0.665, 0.88, 1.198 | 0.694, 0.88, 1.149 | 1, 1, 1 |
Appendix B
Table A8.
Fuzzy decision matrix of criteria.
Table A8.
Fuzzy decision matrix of criteria.
| (EB1) | (EB2) | (EB3) | (EB4) | (EB5) | (MB1) | (MB2) | (MB3) | (PB1) | (PB2) | (PB3) | (PB4) | (IB1) | (IB2) | (IB3) | (IB4) | (TB1) | (TB2) | (TB3) | (TB4) | (MAB1) | (MAB2) | (MAB3) | (MAB4) | |
|---|---|---|---|---|---|---|---|---|---|---|---|---|---|---|---|---|---|---|---|---|---|---|---|---|
| S1 | 5.4, 6.4, 7.4 | 5.7, 6.7, 7.7 | 4.5, 5.5, 6.5 | 6, 7, 8 | 5.2, 6.2, 7.2 | 4.7, 5.7, 6.7 | 5.6, 6.6, 7.6 | 5, 6, 7 | 4.5, 5.5, 6.5 | 5.3, 6.3, 7.3 | 4, 5, 6 | 4.1, 5.1, 6.1 | 4.8, 5.8, 6.8 | 5.9, 6.9, 7.9 | 5.1, 6.1, 7.1 | 4.9, 5.9, 6.9 | 5.5, 6.5, 7.5 | 5.2, 6.2, 7.2 | 4.4, 5.4, 6.4 | 5.2, 6.2, 7.2 | 5.1, 6.1, 7.1 | 4.3, 5.3, 6.3 | 3.8, 4.8, 5.8 | 4.6, 5.6, 6.6 |
| S2 | 4, 5, 6 | 3.9, 4.9, 5.9 | 2, 3, 4 | 3.3, 4.3, 5.3 | 2.1, 3.1, 4.1 | 2.3, 3.3, 4.3 | 3.9, 4.9, 5.9 | 2.9, 3.9, 4.9 | 3.4, 4.4, 5.4 | 3.1, 4.1, 5.1 | 2.6, 3.6, 4.6 | 3.1, 4.1, 5.1 | 3.2, 4.2, 5.2 | 3.7, 4.7, 5.7 | 2.8, 3.8, 4.8 | 3.3, 4.3, 5.3 | 3.1, 4.1, 5.1 | 3.3, 4.3, 5.3 | 3.1, 4.1, 5.1 | 2.8, 3.8, 4.8 | 2.8, 3.8, 4.8 | 2.3, 3.3, 4.3 | 2, 3, 4 | 2.9, 3.9, 4.9 |
| S3 | 4.9, 5.9, 6.9 | 5.1, 6.1, 7.1 | 3.2, 4.2, 5.2 | 5.6, 6.6, 7.6 | 3.6, 4.6, 5.6 | 3.8, 4.8, 5.8 | 4.8, 5.8, 6.8 | 4.4, 5.4, 6.4 | 4.1, 5.1, 6.1 | 4.1, 5.1, 6.1 | 3.1, 4.1, 5.1 | 3.5, 4.5, 5.5 | 4, 5, 6 | 5.6, 6.6, 7.6 | 3.8, 4.8, 5.8 | 4.2, 5.2, 6.2 | 4.6, 5.6, 6.6 | 4.6, 5.6, 6.6 | 3.9, 4.9, 5.9 | 4.1, 5.1, 6.1 | 3.7, 4.7, 5.7 | 3.4, 4.4, 5.4 | 2.5, 3.5, 4.5 | 3.9, 4.9, 5.9 |
| S4 | 4.6, 5.6, 6.6 | 4.9, 5.9, 6.9 | 2.9, 3.9, 4.9 | 5, 6, 7 | 3.4, 4.4, 5.4 | 3.6, 4.6, 5.6 | 4.6, 5.6, 6.6 | 4.2, 5.2, 6.2 | 3.6, 4.6, 5.6 | 3.5, 4.5, 5.5 | 3.1, 4.1, 5.1 | 2.8, 3.8, 4.8 | 3.9, 4.9, 5.9 | 5, 6, 7 | 3.2, 4.2, 5.2 | 4.3, 5.3, 6.3 | 4.3, 5.3, 6.3 | 4.4, 5.4, 6.4 | 3.5, 4.5, 5.5 | 3.6, 4.6, 5.6 | 3.6, 4.6, 5.6 | 3.1, 4.1, 5.1 | 2.1, 3.1, 4.1 | 3.6, 4.6, 5.6 |
| S5 | 4.8, 5.8, 6.8 | 5.1, 6.1, 7.1 | 3.5, 4.5, 5.5 | 5.2, 6.2, 7.2 | 4.2, 5.2, 6.2 | 3.9, 4.9, 5.9 | 4.6, 5.6, 6.6 | 4.5, 5.5, 6.5 | 3.9, 4.9, 5.9 | 3.9, 4.9, 5.9 | 3.4, 4.4, 5.4 | 3.6, 4.6, 5.6 | 3.8, 4.8, 5.8 | 5.6, 6.6, 7.6 | 4.1, 5.1, 6.1 | 4.3, 5.3, 6.3 | 5, 6, 7 | 4.73, 5.73, 6.73 | 4, 5, 6 | 4, 5, 6 | 4.6, 5.6, 6.6 | 3.9, 4.9, 5.9 | 2.9, 3.9, 4.9 | 3.8, 4.8, 5.8 |
| S6 | 5.3, 6.3, 7.3 | 5.5, 6.5, 7.5 | 4.3, 5.3, 6.3 | 5.8, 6.8, 7.8 | 4.9, 5.9, 6.9 | 4.4, 5.4, 6.4 | 5.1, 6.1, 7.1 | 4.5, 5.5, 6.5 | 4.2, 5.2, 6.2 | 4.9, 5.9, 6.9 | 3.8, 4.8, 5.8 | 3.9, 4.9, 5.9 | 4.4, 5.4, 6.4 | 5.8, 6.8, 7.8 | 4.2, 5.2, 6.2 | 4.7, 5.7, 6.7 | 5.3, 6.3, 7.3 | 5, 6, 7 | 4.2, 5.2, 6.2 | 4.6, 5.6, 6.6 | 4.8, 5.8, 6.8 | 4.1, 5.1, 6.1 | 3.4, 4.4, 5.4 | 4.4, 5.4, 6.4 |
| S7 | 4.2, 5.2, 6.2 | 4.1, 5.1, 6.1 | 2.2, 3.2, 4.2 | 3.7, 4.7, 5.7 | 2.3, 3.3, 4.3 | 2.6, 3.6, 4.6 | 3.8, 4.8, 5.8 | 3.3, 4.3, 5.3 | 3.5, 4.5, 5.5 | 2.4, 3.4, 4.4 | 2.9, 3.9, 4.9 | 2.6, 3.6, 4.6 | 3.4, 4.4, 5.4 | 4.4, 5.4, 6.4 | 3.4, 4.4, 5.4 | 3.3, 4.3, 5.3 | 3.3, 4.3, 5.3 | 3.9, 4.9, 5.9 | 2.8, 3.8, 4.8 | 3, 4, 5 | 3.1, 4.1, 5.1 | 2.4, 3.4, 4.4 | 2.4, 3.4, 4.4 | 3.3, 4.3, 5.3 |
| S8 | 3.7, 4.7, 5.7 | 3.6, 4.6, 5.6 | 1.9, 2.9, 3.9 | 3.2, 4.2, 5.2 | 2, 3, 4 | 2.5, 3.5, 4.5 | 3.8, 4.8, 5.8 | 3.2, 4.2, 5.2 | 3.1, 4.1, 5.1 | 2.6, 3.6, 4.6 | 2.9, 3.9, 4.9 | 2.7, 3.7, 4.7 | 3.1, 4.1, 5.1 | 4.5, 5.6, 6.7 | 2.5, 3.5, 4.5 | 3.2, 4.2, 5.2 | 3, 4, 5 | 3.2, 4.2, 5.2 | 3, 4, 5 | 2.7, 3.7, 4.7 | 3.1, 4.1, 5.1 | 2.3, 3.3, 4.3 | 2, 3, 4 | 2.7, 3.7, 4.7 |
| S9 | 4.5, 5.5, 6.5 | 4.7, 5.7, 6.7 | 2.4, 3.4, 4.4 | 4.5, 5.5, 6.5 | 3.1, 4.1, 5.1 | 2.7, 3.7, 4.7 | 4.1, 5.1, 6.1 | 3.8, 4.8, 5.8 | 3.5, 4.5, 5.5 | 3.2, 4.2, 5.2 | 3.1, 4.1, 5.1 | 2.9, 3.9, 4.9 | 3.4, 4.4, 5.4 | 5.3, 6.3, 7.3 | 3.7, 4.7, 5.7 | 3.9, 4.9, 5.9 | 3.9, 4.9, 5.9 | 4.5, 5.5, 6.5 | 3.7, 4.7, 5.7 | 3.6, 4.6, 5.6 | 3.5, 4.5, 5.5 | 2.8, 3.8, 4.8 | 2.5, 3.5, 4.5 | 3.3, 4.3, 5.3 |
| S10 | 4.3, 5.3, 6.3 | 4.4, 5.4, 6.4 | 2.1, 3.1, 4.1 | 4.2, 5.2, 6.2 | 2.9, 3.9, 4.9 | 2.4, 3.4, 4.4 | 4.1, 5.1, 6.1 | 3.5, 4.5, 5.5 | 3.6, 4.6, 5.6 | 2.8, 3.8, 4.8 | 2.8, 3.8, 4.8 | 3, 4, 5 | 3.5, 4.5, 5.5 | 4.8, 5.8, 6.8 | 2.8, 3.8, 4.8 | 3.7, 4.7, 5.7 | 3.5, 4.5, 5.5 | 4.3, 5.3, 6.3 | 3.5, 4.5, 5.5 | 3.1, 4.1, 5.1 | 3.3, 4.3, 5.3 | 2.4, 3.4, 4.4 | 2.1, 3.1, 4.1 | 3.3, 4.3, 5.3 |
Table A9.
Fuzzy normalized decision matrix of criteria.
Table A9.
Fuzzy normalized decision matrix of criteria.
| (EB1) | (EB2) | (EB3) | (EB4) | (EB5) | (MB1) | (MB2) | (MB3) | (PB1) | (PB2) | (PB3) | (PB4) | (IB1) | (IB2) | (IB3) | (IB4) | (TB1) | (TB2) | (TB3) | (TB4) | (MAB1) | (MAB2) | (MAB3) | (MAB4) | |
|---|---|---|---|---|---|---|---|---|---|---|---|---|---|---|---|---|---|---|---|---|---|---|---|---|
| S1 | 0.73, 0.86, 1 | 0.74, 0.87, 1 | 0.69, 0.85, 1 | 0.75, 0.88, 1 | 0.72, 0.86, 1 | 0.7, 0.85, 1 | 0.74, 0.87, 1 | 0.71, 0.86, 1 | 0.69, 0.85, 1 | 0.73, 0.86, 1 | 0.67, 0.83, 1 | 0.67, 0.84, 1 | 0.71, 0.85, 1 | 0.75, 0.87, 1 | 0.72, 0.86, 1 | 0.71, 0.86, 1 | 0.73, 0.87, 1 | 0.72, 0.86, 1 | 0.69, 0.84, 1 | 0.72, 0.86, 1 | 0.72, 0.86, 1 | 0.68, 0.84, 1 | 0.66, 0.83, 1 | 0.7, 0.85, 1 |
| S2 | 0.54, 0.68, 0.81 | 0.51, 0.64, 0.77 | 0.31, 0.46, 0.62 | 0.41, 0.54, 0.66 | 0.29, 0.43, 0.57 | 0.34, 0.49, 0.64 | 0.51, 0.64, 0.78 | 0.41, 0.56, 0.7 | 0.52, 0.68, 0.83 | 0.42, 0.56, 0.7 | 0.43, 0.6, 0.77 | 0.51, 0.67, 0.84 | 0.47, 0.62, 0.76 | 0.47, 0.59, 0.72 | 0.39, 0.54, 0.68 | 0.48, 0.62, 0.77 | 0.41, 0.55, 0.68 | 0.46, 0.6, 0.74 | 0.48, 0.64, 0.8 | 0.39, 0.53, 0.67 | 0.39, 0.54, 0.68 | 0.37, 0.52, 0.68 | 0.34, 0.52, 0.69 | 0.44, 0.59, 0.74 |
| S3 | 0.66, 0.8, 0.93 | 0.66, 0.79, 0.92 | 0.49, 0.65, 0.8 | 0.7, 0.83, 0.95 | 0.5, 0.64, 0.78 | 0.57, 0.72, 0.87 | 0.63, 0.76, 0.89 | 0.63, 0.77, 0.91 | 0.63, 0.78, 0.94 | 0.56, 0.7, 0.84 | 0.52, 0.68, 0.85 | 0.57, 0.74, 0.9 | 0.59, 0.74, 0.88 | 0.71, 0.84, 0.96 | 0.54, 0.68, 0.82 | 0.61, 0.75, 0.9 | 0.61, 0.75, 0.88 | 0.64, 0.78, 0.92 | 0.61, 0.77, 0.92 | 0.57, 0.71, 0.85 | 0.52, 0.66, 0.8 | 0.54, 0.7, 0.86 | 0.43, 0.6, 0.78 | 0.59, 0.74, 0.89 |
| S4 | 0.62, 0.76, 0.89 | 0.64, 0.77, 0.9 | 0.45, 0.6, 0.75 | 0.63, 0.75, 0.88 | 0.47, 0.61, 0.75 | 0.54, 0.69, 0.84 | 0.61, 0.74, 0.87 | 0.6, 0.74, 0.89 | 0.55, 0.71, 0.86 | 0.48, 0.62, 0.75 | 0.52, 0.68, 0.85 | 0.46, 0.62, 0.79 | 0.57, 0.72, 0.87 | 0.63, 0.76, 0.89 | 0.45, 0.59, 0.73 | 0.62, 0.77, 0.91 | 0.57, 0.71, 0.84 | 0.61, 0.75, 0.89 | 0.55, 0.7, 0.86 | 0.5, 0.64, 0.78 | 0.51, 0.65, 0.79 | 0.49, 0.65, 0.81 | 0.36, 0.53, 0.71 | 0.55, 0.7, 0.85 |
| S5 | 0.65, 0.78, 0.92 | 0.66, 0.79, 0.92 | 0.54, 0.69, 0.85 | 0.65, 0.78, 0.9 | 0.58, 0.72, 0.86 | 0.58, 0.73, 0.88 | 0.61, 0.74, 0.87 | 0.64, 0.79, 0.93 | 0.6, 0.75, 0.91 | 0.53, 0.67, 0.81 | 0.57, 0.73, 0.9 | 0.59, 0.75, 0.92 | 0.56, 0.71, 0.85 | 0.71, 0.84, 0.96 | 0.58, 0.72, 0.86 | 0.62, 0.77, 0.91 | 0.67, 0.8, 0.93 | 0.66, 0.8, 0.93 | 0.63, 0.78, 0.94 | 0.56, 0.69, 0.83 | 0.65, 0.79, 0.93 | 0.62, 0.78, 0.94 | 0.5, 0.67, 0.84 | 0.58, 0.73, 0.88 |
| S6 | 0.72, 0.85, 0.99 | 0.71, 0.84, 0.97 | 0.66, 0.82, 0.97 | 0.73, 0.85, 0.98 | 0.68, 0.82, 0.96 | 0.66, 0.81, 0.96 | 0.67, 0.8, 0.93 | 0.64, 0.79, 0.93 | 0.65, 0.8, 0.95 | 0.67, 0.81, 0.95 | 0.63, 0.8, 0.97 | 0.64, 0.8, 0.97 | 0.65, 0.79, 0.94 | 0.73, 0.86, 0.99 | 0.59, 0.73, 0.87 | 0.68, 0.83, 0.97 | 0.71, 0.84, 0.97 | 0.69, 0.83, 0.97 | 0.66, 0.81, 0.97 | 0.64, 0.78, 0.92 | 0.68, 0.82, 0.96 | 0.65, 0.81, 0.97 | 0.59, 0.76, 0.93 | 0.67, 0.82, 0.97 |
| S7 | 0.57, 0.7, 0.84 | 0.53, 0.66, 0.79 | 0.34, 0.49, 0.65 | 0.46, 0.59, 0.71 | 0.32, 0.46, 0.6 | 0.39, 0.54, 0.69 | 0.5, 0.63, 0.76 | 0.47, 0.61, 0.76 | 0.54, 0.69, 0.85 | 0.33, 0.47, 0.6 | 0.48, 0.65, 0.82 | 0.43, 0.59, 0.75 | 0.5, 0.65, 0.79 | 0.56, 0.68, 0.81 | 0.48, 0.62, 0.76 | 0.48, 0.62, 0.77 | 0.44, 0.57, 0.71 | 0.54, 0.68, 0.82 | 0.44, 0.59, 0.75 | 0.42, 0.56, 0.69 | 0.44, 0.58, 0.72 | 0.38, 0.54, 0.7 | 0.41, 0.59, 0.76 | 0.5, 0.65, 0.8 |
| S8 | 0.5, 0.64, 0.77 | 0.47, 0.6, 0.73 | 0.29, 0.45, 0.6 | 0.4, 0.53, 0.65 | 0.28, 0.42, 0.56 | 0.37, 0.52, 0.67 | 0.5, 0.63, 0.76 | 0.46, 0.6, 0.74 | 0.48, 0.63, 0.78 | 0.36, 0.49, 0.63 | 0.48, 0.65, 0.82 | 0.44, 0.61, 0.77 | 0.46, 0.6, 0.75 | 0.57, 0.71, 0.85 | 0.35, 0.49, 0.63 | 0.46, 0.61, 0.75 | 0.4, 0.53, 0.67 | 0.44, 0.58, 0.72 | 0.47, 0.63, 0.78 | 0.38, 0.51, 0.65 | 0.44, 0.58, 0.72 | 0.37, 0.52, 0.68 | 0.34, 0.52, 0.69 | 0.41, 0.56, 0.71 |
| S9 | 0.61, 0.74, 0.88 | 0.61, 0.74, 0.87 | 0.37, 0.52, 0.68 | 0.56, 0.69, 0.81 | 0.43, 0.57, 0.71 | 0.4, 0.55, 0.7 | 0.54, 0.67, 0.8 | 0.54, 0.69, 0.83 | 0.54, 0.69, 0.85 | 0.44, 0.58, 0.71 | 0.52, 0.68, 0.85 | 0.48, 0.64, 0.8 | 0.5, 0.65, 0.79 | 0.67, 0.8, 0.92 | 0.52, 0.66, 0.8 | 0.57, 0.71, 0.86 | 0.52, 0.65, 0.79 | 0.63, 0.76, 0.9 | 0.58, 0.73, 0.89 | 0.5, 0.64, 0.78 | 0.49, 0.63, 0.77 | 0.44, 0.6, 0.76 | 0.43, 0.6, 0.78 | 0.5, 0.65, 0.8 |
| S10 | 0.58, 0.72, 0.85 | 0.57, 0.7, 0.83 | 0.32, 0.48, 0.63 | 0.53, 0.65, 0.78 | 0.4, 0.54, 0.68 | 0.36, 0.51, 0.66 | 0.54, 0.67, 0.8 | 0.5, 0.64, 0.79 | 0.55, 0.71, 0.86 | 0.38, 0.52, 0.66 | 0.47, 0.63, 0.8 | 0.49, 0.66, 0.82 | 0.51, 0.66, 0.81 | 0.61, 0.73, 0.86 | 0.39, 0.54, 0.68 | 0.54, 0.68, 0.83 | 0.47, 0.6, 0.73 | 0.6, 0.74, 0.88 | 0.55, 0.7, 0.86 | 0.43, 0.57, 0.71 | 0.46, 0.61, 0.75 | 0.38, 0.54, 0.7 | 0.36, 0.53, 0.71 | 0.5, 0.65, 0.8 |
Table A10.
Fuzzy weighted matrix of criteria.
Table A10.
Fuzzy weighted matrix of criteria.
| (EB1) | (EB2) | (EB3) | (EB4) | (EB5) | (MB1) | (MB2) | (MB3) | (PB1) | (PB2) | (PB3) | (PB4) | (IB1) | (IB2) | (IB3) | (IB4) | (TB1) | (TB2) | (TB3) | (TB4) | (MAB1) | (MAB2) | (MAB3) | (MAB4) | |
|---|---|---|---|---|---|---|---|---|---|---|---|---|---|---|---|---|---|---|---|---|---|---|---|---|
| S1 | 0.02, 0.02, 0.03 | 0.02, 0.03, 0.03 | 0.02, 0.03, 0.03 | 0.02, 0.03, 0.03 | 0.02, 0.03, 0.03 | 0.02, 0.02, 0.03 | 0.04, 0.04, 0.05 | 0.03, 0.04, 0.05 | 0.03, 0.04, 0.05 | 0.04, 0.04, 0.05 | 0.04, 0.04, 0.05 | 0.03, 0.03, 0.04 | 0.03, 0.04, 0.04 | 0.03, 0.04, 0.04 | 0.03, 0.04, 0.04 | 0.03, 0.04, 0.04 | 0.03, 0.04, 0.04 | 0.04, 0.04, 0.05 | 0.03, 0.04, 0.05 | 0.03, 0.03, 0.04 | 0.03, 0.03, 0.04 | 0.04, 0.04, 0.05 | 0.03, 0.04, 0.05 | 0.03, 0.04, 0.04 |
| S2 | 0.01, 0.02, 0.02 | 0.01, 0.02, 0.02 | 0.01, 0.01, 0.02 | 0.01, 0.02, 0.02 | 0.01, 0.01, 0.02 | 0.01, 0.01, 0.02 | 0.03, 0.03, 0.04 | 0.02, 0.03, 0.03 | 0.03, 0.03, 0.04 | 0.02, 0.03, 0.03 | 0.02, 0.03, 0.04 | 0.02, 0.03, 0.03 | 0.02, 0.03, 0.03 | 0.02, 0.03, 0.03 | 0.02, 0.02, 0.03 | 0.02, 0.03, 0.03 | 0.02, 0.02, 0.03 | 0.02, 0.03, 0.04 | 0.02, 0.03, 0.04 | 0.02, 0.02, 0.03 | 0.01, 0.02, 0.02 | 0.02, 0.03, 0.04 | 0.02, 0.03, 0.04 | 0.02, 0.03, 0.03 |
| S3 | 0.02, 0.02, 0.02 | 0.02, 0.02, 0.03 | 0.02, 0.02, 0.03 | 0.02, 0.03, 0.03 | 0.02, 0.02, 0.02 | 0.01, 0.02, 0.02 | 0.03, 0.04, 0.04 | 0.03, 0.04, 0.04 | 0.03, 0.04, 0.05 | 0.03, 0.03, 0.04 | 0.03, 0.04, 0.04 | 0.02, 0.03, 0.04 | 0.03, 0.03, 0.04 | 0.03, 0.04, 0.04 | 0.02, 0.03, 0.04 | 0.03, 0.03, 0.04 | 0.03, 0.03, 0.04 | 0.03, 0.04, 0.04 | 0.03, 0.04, 0.04 | 0.02, 0.03, 0.03 | 0.02, 0.02, 0.03 | 0.03, 0.04, 0.04 | 0.02, 0.03, 0.04 | 0.03, 0.03, 0.04 |
| S4 | 0.02, 0.02, 0.02 | 0.02, 0.02, 0.03 | 0.01, 0.02, 0.02 | 0.02, 0.02, 0.03 | 0.01, 0.02, 0.02 | 0.01, 0.02, 0.02 | 0.03, 0.04, 0.04 | 0.03, 0.04, 0.04 | 0.03, 0.03, 0.04 | 0.02, 0.03, 0.04 | 0.03, 0.04, 0.04 | 0.02, 0.03, 0.03 | 0.02, 0.03, 0.04 | 0.03, 0.03, 0.04 | 0.02, 0.03, 0.03 | 0.03, 0.03, 0.04 | 0.03, 0.03, 0.04 | 0.03, 0.04, 0.04 | 0.03, 0.03, 0.04 | 0.02, 0.03, 0.03 | 0.02, 0.02, 0.03 | 0.03, 0.03, 0.04 | 0.02, 0.03, 0.04 | 0.02, 0.03, 0.04 |
| S5 | 0.02, 0.02, 0.02 | 0.02, 0.02, 0.03 | 0.02, 0.02, 0.03 | 0.02, 0.03, 0.03 | 0.02, 0.02, 0.03 | 0.02, 0.02, 0.02 | 0.03, 0.04, 0.04 | 0.03, 0.04, 0.04 | 0.03, 0.04, 0.04 | 0.03, 0.03, 0.04 | 0.03, 0.04, 0.05 | 0.02, 0.03, 0.04 | 0.02, 0.03, 0.04 | 0.03, 0.04, 0.04 | 0.03, 0.03, 0.04 | 0.03, 0.03, 0.04 | 0.03, 0.04, 0.04 | 0.03, 0.04, 0.05 | 0.03, 0.04, 0.04 | 0.02, 0.03, 0.03 | 0.02, 0.03, 0.03 | 0.03, 0.04, 0.05 | 0.03, 0.03, 0.04 | 0.02, 0.03, 0.04 |
| S6 | 0.02, 0.02, 0.03 | 0.02, 0.02, 0.03 | 0.02, 0.03, 0.03 | 0.02, 0.03, 0.03 | 0.02, 0.03, 0.03 | 0.02, 0.02, 0.02 | 0.03, 0.04, 0.05 | 0.03, 0.04, 0.04 | 0.03, 0.04, 0.05 | 0.03, 0.04, 0.05 | 0.03, 0.04, 0.05 | 0.03, 0.03, 0.04 | 0.03, 0.03, 0.04 | 0.03, 0.04, 0.04 | 0.03, 0.03, 0.04 | 0.03, 0.04, 0.04 | 0.03, 0.04, 0.04 | 0.03, 0.04, 0.05 | 0.03, 0.04, 0.05 | 0.03, 0.03, 0.04 | 0.02, 0.03, 0.03 | 0.03, 0.04, 0.05 | 0.03, 0.04, 0.05 | 0.03, 0.03, 0.04 |
| S7 | 0.01, 0.02, 0.02 | 0.02, 0.02, 0.02 | 0.01, 0.02, 0.02 | 0.02, 0.02, 0.02 | 0.01, 0.01, 0.02 | 0.01, 0.01, 0.02 | 0.02, 0.03, 0.04 | 0.02, 0.03, 0.04 | 0.03, 0.03, 0.04 | 0.02, 0.02, 0.03 | 0.03, 0.03, 0.04 | 0.02, 0.02, 0.03 | 0.02, 0.03, 0.03 | 0.02, 0.03, 0.03 | 0.02, 0.03, 0.03 | 0.02, 0.03, 0.03 | 0.02, 0.03, 0.03 | 0.03, 0.03, 0.04 | 0.02, 0.03, 0.04 | 0.02, 0.02, 0.03 | 0.02, 0.02, 0.03 | 0.02, 0.03, 0.04 | 0.02, 0.03, 0.04 | 0.02, 0.03, 0.03 |
| S8 | 0.01, 0.02, 0.02 | 0.01, 0.02, 0.02 | 0.01, 0.01, 0.02 | 0.01, 0.02, 0.02 | 0.01, 0.01, 0.02 | 0.01, 0.01, 0.02 | 0.02, 0.03, 0.04 | 0.02, 0.03, 0.04 | 0.02, 0.03, 0.04 | 0.02, 0.02, 0.03 | 0.03, 0.03, 0.04 | 0.02, 0.02, 0.03 | 0.02, 0.03, 0.03 | 0.02, 0.03, 0.04 | 0.02, 0.02, 0.03 | 0.02, 0.03, 0.03 | 0.02, 0.02, 0.03 | 0.02, 0.03, 0.04 | 0.02, 0.03, 0.04 | 0.01, 0.02, 0.03 | 0.02, 0.02, 0.03 | 0.02, 0.03, 0.04 | 0.02, 0.03, 0.04 | 0.02, 0.02, 0.03 |
| S9 | 0.02, 0.02, 0.02 | 0.02, 0.02, 0.03 | 0.01, 0.02, 0.02 | 0.02, 0.02, 0.03 | 0.01, 0.02, 0.02 | 0.01, 0.01, 0.02 | 0.03, 0.03, 0.04 | 0.03, 0.03, 0.04 | 0.03, 0.03, 0.04 | 0.02, 0.03, 0.04 | 0.03, 0.04, 0.04 | 0.02, 0.03, 0.03 | 0.02, 0.03, 0.03 | 0.03, 0.03, 0.04 | 0.02, 0.03, 0.04 | 0.02, 0.03, 0.04 | 0.02, 0.03, 0.04 | 0.03, 0.04, 0.04 | 0.03, 0.03, 0.04 | 0.02, 0.03, 0.03 | 0.02, 0.02, 0.03 | 0.02, 0.03, 0.04 | 0.02, 0.03, 0.04 | 0.02, 0.03, 0.03 |
| S10 | 0.01, 0.02, 0.02 | 0.02, 0.02, 0.02 | 0.01, 0.02, 0.02 | 0.02, 0.02, 0.03 | 0.01, 0.02, 0.02 | 0.01, 0.01, 0.02 | 0.03, 0.03, 0.04 | 0.02, 0.03, 0.04 | 0.03, 0.03, 0.04 | 0.02, 0.03, 0.03 | 0.02, 0.03, 0.04 | 0.02, 0.03, 0.03 | 0.02, 0.03, 0.03 | 0.03, 0.03, 0.04 | 0.02, 0.02, 0.03 | 0.02, 0.03, 0.04 | 0.02, 0.03, 0.03 | 0.03, 0.04, 0.04 | 0.03, 0.03, 0.04 | 0.02, 0.02, 0.03 | 0.02, 0.02, 0.03 | 0.02, 0.03, 0.04 | 0.02, 0.03, 0.04 | 0.02, 0.03, 0.03 |
References
- Wątróbski, J.; Ziemba, P.; Jankowski, J.; Zioło, M. Green energy for a green city—A multi-perspective model approach. Sustainability 2016, 8, 702. [Google Scholar] [CrossRef]
- Mathiyazhagan, K.; Govindan, K.; Noorul Haq, A. Pressure analysis for green supply chain management implementation in Indian industries using analytic hierarchy process. Int. J. Prod. Res. 2014, 52, 188–202. [Google Scholar] [CrossRef]
- Walker, H.; Di Sisto, L.; McBain, D. Drivers and barriers to environmental supply chain management practices: Lessons from the public and private sectors. J. Purch. Supply Manag. 2008, 14, 69–85. [Google Scholar] [CrossRef]
- Shah, S.A.A.; Zhou, P.; Walasai, G.D.; Mohsin, M. Energy security and environmental sustainability index of South Asian countries: A composite index approach. Ecol. Indic. 2019, 106, 105507. [Google Scholar] [CrossRef]
- Cordeiro, A.; Vieira, F. Barriers to innovation amongst small and medium-sized enterprises (SMEs) in Portugal. In Proceedings of the 7th European Conference on Innovation and Entrepreneurship (ECIE), Academic Conferences Limited, Santarem, Portugal, 20–21 September 2012; p. 97. [Google Scholar]
- Ghisetti, C.; Mancinelli, S.; Mazzanti, M.; Zoli, M. Financial barriers and environmental innovations: Evidence from EU manufacturing firms. Clim. Policy 2017, 17, S131–S147. [Google Scholar] [CrossRef]
- Ikram, M.; Zhou, P.; Shah, S.A.A.; Liu, G.Q. Do environmental management systems help improve corporate sustainable development? Evidence from manufacturing companies in Pakistan. J. Clean. Prod. 2019, 226, 628–641. [Google Scholar] [CrossRef]
- Zhu, Q.; Sarkis, J. Relationships between operational practices and performance among early adopters of green supply chain management practices in Chinese manufacturing enterprises. J. Oper. Manag. 2004, 22, 265–289. [Google Scholar] [CrossRef]
- Chen, Y.-S.; Lai, S.-B.; Wen, C.-T. The influence of green innovation performance on corporate advantage in Taiwan. J. Bus. Ethics 2006, 67, 331–339. [Google Scholar] [CrossRef]
- Chen, Y.-S. The driver of green innovation and green image–green core competence. J. Bus. Ethics 2008, 81, 531–543. [Google Scholar] [CrossRef]
- Kemp, R. Eco-Innovation: Definition, measurement and open research issues. Econ. Polit. 2010, 27, 397–420. [Google Scholar]
- Beise, M.; Rennings, K. Lead markets and regulation: A framework for analyzing the international diffusion of environmental innovations. Ecol. Econ. 2005, 52, 5–17. [Google Scholar] [CrossRef]
- De Marchi, V. Environmental innovation and R&D cooperation: Empirical evidence from Spanish manufacturing firms. Res. Policy 2012, 41, 614–623. [Google Scholar]
- Gupta, H.; Barua, M.K. A framework to overcome barriers to green innovation in SMEs using BWM and Fuzzy TOPSIS. Sci. Total Environ. 2018, 633, 122–139. [Google Scholar] [CrossRef] [PubMed]
- Majumdar, A.; Sinha, S. Modeling the barriers of green supply chain management in small and medium enterprises: A case of Indian clothing industry. Manag. Environ. Qual. Int. J. 2018, 29, 1110–1122. [Google Scholar] [CrossRef]
- Seth, D.; Rehman, M.A.A.; Shrivastava, R.L. Green manufacturing drivers and their relationships for small and medium (SME) and large industries. J. Clean. Prod. 2018, 198, 1381–1405. [Google Scholar] [CrossRef]
- Panigrahi, S.S.; Rao, N.S. A stakeholders’ perspective on barriers to adopt sustainable practices in MSME supply chain: Issues and challenges in the textile sector. Res. J. Text. Appar. 2018, 22, 59–76. [Google Scholar] [CrossRef]
- De Jesus Pacheco, D.A.; Carla, S.; Jung, C.F.; Ribeiro, J.L.D.; Navas, H.V.G.; Cruz-Machado, V.A. Eco-innovation determinants in manufacturing SMEs: Systematic review and research directions. J. Clean. Prod. 2017, 142, 2277–2287. [Google Scholar] [CrossRef]
- Pinget, A.; Bocquet, R.; Mothe, C. Barriers to environmental innovation in SMEs: Empirical evidence from french firms. Management 2015, 18, 132–155. [Google Scholar] [CrossRef]
- Ghazilla, R.A.R.; Sakundarini, N.; Abdul-Rashid, S.H.; Ayub, N.S.; Olugu, E.U.; Musa, S.N. Drivers and barriers analysis for green manufacturing practices in Malaysian SMEs: A preliminary findings. Procedia Cirp 2015, 26, 658–663. [Google Scholar] [CrossRef]
- Cecere, G.; Corrocher, N.; Mancusi, M.L. Financial constraints and public funding of eco-innovation: Empirical evidence from European SMEs. Small Bus. Econ. 2018, 1–18. [Google Scholar] [CrossRef]
- Mathiyazhagan, K.; Govindan, K.; NoorulHaq, A.; Geng, Y. An ISM approach for the barrier analysis in implementing green supply chain management. J. Clean. Prod. 2013, 47, 283–297. [Google Scholar] [CrossRef]
- Govindan, K.; Kaliyan, M.; Kannan, D.; Haq, A.N. Barriers analysis for green supply chain management implementation in Indian industries using analytic hierarchy process. Int. J. Prod. Econ. 2014, 147, 555–568. [Google Scholar] [CrossRef]
- Matus, K.J.M.; Xiao, X.; Zimmerman, J.B. Green chemistry and green engineering in China: Drivers, policies and barriers to innovation. J. Clean. Prod. 2012, 32, 193–203. [Google Scholar] [CrossRef]
- Annual Report 2010: EIO Eco-Innovation Challenge: Pathways to A Resource Efficient Europe; DG Environment: Brussels, Belgium, 2011.
- Hojnik, J.; Ruzzier, M. Drivers of and barriers to eco-innovation: A case study. Int. J. Sustain. Econ. 2016, 8, 273–294. [Google Scholar] [CrossRef]
- Hillary, R. Environmental management systems and the smaller enterprise. J. Clean. Prod. 2004, 12, 561–569. [Google Scholar] [CrossRef]
- Ashford, N.A. Understanding Technological Responses of Industrial Firms to Environmental Problems: Implications for Government Policy (Chapter); Island Press: Washington, DC, USA, 1993. [Google Scholar]
- Dhull, S.; Narwal, M. Drivers and barriers in green supply chain management adaptation: A state-of-art review. Uncertain Supply Chain Manag. 2016, 4, 61–76. [Google Scholar] [CrossRef]
- José Silva, M.; Leitao, J.; Raposo, M. Barriers to innovation faced by manufacturing firms in Portugal: How to overcome it for fostering business excellence? Int. J. Bus. Excell. 2008, 1, 92–105. [Google Scholar] [CrossRef]
- Zhu, Y.; Wittmann, X.; Peng, M.W. Institution-based barriers to innovation in SMEs in China. Asia Pac. J. Manag. 2012, 29, 1131–1142. [Google Scholar] [CrossRef]
- Zhu, Q.; Sarkis, J.; Lai, K. Green supply chain management innovation diffusion and its relationship to organizational improvement: An ecological modernization perspective. J. Eng. Technol. Manag. 2012, 29, 168–185. [Google Scholar] [CrossRef]
- Runhaar, H.; Tigchelaar, C.; Vermeulen, W.J. V Environmental leaders: Making a difference. A typology of environmental leaders and recommendations for a differentiated policy approach. Bus. Strateg. Environ. 2008, 17, 160–178. [Google Scholar] [CrossRef]
- Blok, V.; Long, T.B.; Gaziulusoy, A.I.; Ciliz, N.; Lozano, R.; Huisingh, D.; Csutora, M.; Boks, C. From best practices to bridges for a more sustainable future: Advances and challenges in the transition to global sustainable production and consumption: Introduction to the ERSCP stream of the Special volume. J. Clean. Prod. 2015, 108, 19–30. [Google Scholar] [CrossRef]
- Mangla, S.K.; Govindan, K.; Luthra, S. Prioritizing the barriers to achieve sustainable consumption and production trends in supply chains using fuzzy Analytical Hierarchy Process. J. Clean. Prod. 2017, 151, 509–525. [Google Scholar] [CrossRef]
- Carter, C.R.; Dresner, M. Purchasing’s role in environmental management: Cross-functional development of grounded theory. J. Supply Chain Manag. 2001, 37, 12–27. [Google Scholar] [CrossRef]
- Mudgal, R.K.; Shankar, R.; Talib, P.; Raj, T. Modelling the barriers of green supply chain practices: An Indian perspective. Int. J. Logist. Syst. Manag. 2010, 7, 81–107. [Google Scholar] [CrossRef]
- Madrid-Guijarro, A.; Garcia, D.; Van Auken, H. Barriers to innovation among Spanish manufacturing SMEs. J. Small Bus. Manag. 2009, 47, 465–488. [Google Scholar] [CrossRef]
- Theyel, G. Management practices for environmental innovation and performance. Int. J. Oper. Prod. Manag. 2000, 20, 249–266. [Google Scholar] [CrossRef]
- Jinzhou, W. Discussion on the relationship between green technological innovation and system innovation. Energy Procedia 2011, 5, 2352–2357. [Google Scholar] [CrossRef]
- Rao, P.; Holt, D. Do green supply chains lead to competitiveness and economic performance? Int. J. Oper. Prod. Manag. 2005, 25, 898–916. [Google Scholar] [CrossRef]
- Lai, S.B.; Wen, C.T.; Chen, Y.S. The exploration of the relationship between the environmental pressure and the corporate competitive advantage. In Proceedings of the CSMOT Academic Conference, Hsin-Chu, China, 22 April 2003; Volume 22. [Google Scholar]
- Perron, G.M. Barriers to Environmental Performance Improvements in Canadian SMEs. Ph.D. Thesis, Dalhousie University, Halifax, NS, Canada, 2005. [Google Scholar]
- Beamon, B.M. Designing the green supply chain. Logist. Inf. Manag. 1999, 12, 332–342. [Google Scholar] [CrossRef]
- Russel, T. Greener Purchasing: Opportunities and Innovations; Routledge: London, UK, 2017; ISBN 1351283405. [Google Scholar]
- Del Río, P.; Carrillo-Hermosilla, J.; Könnölä, T. Policy strategies to promote eco-innovation: An integrated framework. J. Ind. Ecol. 2010, 14, 541–557. [Google Scholar] [CrossRef]
- Lin, C.-Y.; Ho, Y.-H. An empirical study on logistics service providersx intention to adopt green innovations. J. Technol. Manag. Innov. 2008, 3, 17–26. [Google Scholar]
- Collins, E.; Lawrence, S.; Pavlovich, K.; Ryan, C. Business networks and the uptake of sustainability practices: The case of New Zealand. J. Clean. Prod. 2007, 15, 729–740. [Google Scholar] [CrossRef]
- Dubey, R.; Gunasekaran, A.; Ali, S.S. Exploring the relationship between leadership, operational practices, institutional pressures and environmental performance: A framework for green supply chain. Int. J. Prod. Econ. 2015, 160, 120–132. [Google Scholar] [CrossRef]
- Jones, P.; Hillier, D.; Comfort, D. Shopping for tomorrow: Promoting sustainable consumption within food stores. Br. Food J. 2011, 113, 935–948. [Google Scholar] [CrossRef]
- Dangelico, R.M. Green product innovation: Where we are and where we are going. Bus. Strateg. Environ. 2016, 25, 560–576. [Google Scholar] [CrossRef]
- Horbach, J.; Rammer, C.; Rennings, K. Determinants of eco-innovations by type of environmental impact—The role of regulatory push/pull, technology push and market pull. Ecol. Econ. 2012, 78, 112–122. [Google Scholar] [CrossRef]
- Solazzo, R.; Donati, M.; Tomasi, L.; Arfini, F. How effective is greening policy in reducing GHG emissions from agriculture? Evidence from Italy. Sci. Total Environ. 2016, 573, 1115–1124. [Google Scholar] [CrossRef]
- Somsuk, N.; Laosirihongthong, T. Prioritization of applicable drivers for green supply chain management implementation toward sustainability in Thailand. Int. J. Sustain. Dev. World Ecol. 2017, 24, 175–191. [Google Scholar] [CrossRef]
- Lee, V.-H.; Ooi, K.-B.; Chong, A.Y.-L.; Seow, C. Creating technological innovation via green supply chain management: An empirical analysis. Expert Syst. Appl. 2014, 41, 6983–6994. [Google Scholar] [CrossRef]
- Jabbour, C.J.C.; Jugend, D.; De Sousa Jabbour, A.B.L.; Gunasekaran, A.; Latan, H. Green product development and performance of Brazilian firms: Measuring the role of human and technical aspects. J. Clean. Prod. 2015, 87, 442–451. [Google Scholar] [CrossRef]
- Govindan, K.; Muduli, K.; Devika, K.; Barve, A. Investigation of the influential strength of factors on adoption of green supply chain management practices: An Indian mining scenario. Resour. Conserv. Recycl. 2016, 107, 185–194. [Google Scholar] [CrossRef]
- Kiss, B.; Manchón, C.G.; Neij, L. The role of policy instruments in supporting the development of mineral wool insulation in Germany, Sweden and the United Kingdom. J. Clean. Prod. 2013, 48, 187–199. [Google Scholar] [CrossRef]
- Gupta, H.; Barua, M.K. Supplier selection among SMEs on the basis of their green innovation ability using BWM and fuzzy TOPSIS. J. Clean. Prod. 2017, 152, 242–258. [Google Scholar] [CrossRef]
- Gupta, H.; Barua, M.K. A grey DEMATEL-based approach for modeling enablers of green innovation in manufacturing organizations. Environ. Sci. Pollut. Res. 2018, 25, 9556–9578. [Google Scholar] [CrossRef] [PubMed]
- De Medeiros, J.F.; Ribeiro, J.L.D.; Cortimiglia, M.N. Success factors for environmentally sustainable product innovation: A systematic literature review. J. Clean. Prod. 2014, 65, 76–86. [Google Scholar] [CrossRef]
- Hanim Mohamad Zailani, S.; Eltayeb, T.K.; Hsu, C.-C.; Choon Tan, K. The impact of external institutional drivers and internal strategy on environmental performance. Int. J. Oper. Prod. Manag. 2012, 32, 721–745. [Google Scholar] [CrossRef]
- Solangi, Y.A.; Shah, S.A.A.; Zameer, H.; Ikram, M.; Saracoglu, B.O. Assessing the solar PV power project site selection in Pakistan: Based on AHP-fuzzy VIKOR approach. Environ. Sci. Pollut. Res. 2019, 26, 30286–30302. [Google Scholar] [CrossRef]
- Solangi, Y.; Tan, Q.; Khan, M.; Mirjat, N.; Ahmed, I. The Selection of Wind Power Project Location in the Southeastern Corridor of Pakistan: A Factor Analysis, AHP, and Fuzzy-TOPSIS Application. Energies 2018, 11, 1940. [Google Scholar] [CrossRef]
- Ziemba, P. Inter-criteria dependencies-based decision support in the sustainable wind energy management. Energies 2019, 12, 749. [Google Scholar] [CrossRef]
- Xu, L.; Shah, S.A.A.; Zameer, H.; Solangi, Y.A. Evaluating renewable energy sources for implementing the hydrogen economy in Pakistan: A two-stage fuzzy MCDM approach. Environ. Sci. Pollut. Res. 2019, 26, 33202–33215. [Google Scholar] [CrossRef]
- Shah, S.A.A.; Solangi, Y.A.; Ikram, M. Analysis of barriers to the adoption of cleaner energy technologies in Pakistan using Modified Delphi and Fuzzy Analytical Hierarchy Process. J. Clean. Prod. 2019, 235, 1037–1050. [Google Scholar] [CrossRef]
- Boran, K. An evaluation of power plants in Turkey: Fuzzy TOPSIS method. Energy Sources Part B Econ. Plan. Policy 2017, 12, 119–125. [Google Scholar] [CrossRef]
- Ziemba, P. NEAT F-PROMETHEE–A new fuzzy multiple criteria decision making method based on the adjustment of mapping trapezoidal fuzzy numbers. Expert Syst. Appl. 2018, 110, 363–380. [Google Scholar] [CrossRef]
- Xu, L.; Wang, Y.; Shah, S.A.A.; Zameer, H.; Solangi, Y.A.; Walasai, G.D.; Siyal, Z.A. Economic Viability and Environmental Efficiency Analysis of Hydrogen Production Processes for the Decarbonization of Energy Systems. Processes 2019, 7, 494. [Google Scholar] [CrossRef]
- Ziemba, P.; Becker, J. Analysis of the digital divide using fuzzy forecasting. Symmetry 2019, 11, 166. [Google Scholar] [CrossRef]
- Han, H.; Trimi, S. A fuzzy TOPSIS method for performance evaluation of reverse logistics in social commerce platforms. Expert Syst. Appl. 2018, 103, 133–145. [Google Scholar] [CrossRef]
- Solangi, Y.A.; Tan, Q.; Mirjat, N.H.; Ali, S. Evaluating the strategies for sustainable energy planning in Pakistan: An integrated SWOT-AHP and Fuzzy-TOPSIS approach. J. Clean. Prod. 2019, 236, 117655. [Google Scholar] [CrossRef]


© 2020 by the authors. Licensee MDPI, Basel, Switzerland. This article is an open access article distributed under the terms and conditions of the Creative Commons Attribution (CC BY) license (http://creativecommons.org/licenses/by/4.0/).