Article

Estimation of Natural Radionuclides and Rare Earth Elements Concentration of the Rocks of Abu Khuruq Ring Complex, Egypt

1
Physics Department, Faculty of Science, Assiut University, 71516 Assiut, Egypt
2
Geology Department, Faculty of Science, Assiut University, 71516 Assiut, Egypt
*
Author to whom correspondence should be addressed.
Symmetry 2019, 11(8), 1041; https://doi.org/10.3390/sym11081041
Submission received: 19 July 2019 / Revised: 8 August 2019 / Accepted: 8 August 2019 / Published: 13 August 2019

Abstract

:
The naturally occurring radionuclides (radium-226, thorium-232, potassium-40 and radon-222) were investigated in the alkaline rocks of Abu Khuruq Ring, southern Eastern Desert, Egypt. A high-resolution germanium detector was used for the detection of 40K, 232Th, and 226Ra (Canberra, GR4020 model) while 222Rn concentration was measured by the Alpha-Guard Saphymo GmbH system, model PQ 2000 (AG). Major and rare earth elements (REEs) were assessed using the inductively coupled plasma mass spectrometry and atomic emission spectrometry techniques. Positive correlations were observed between REEs, indicating symmetrical chemical properties and their overall presence in the parent material—also, a positive correlation was observed between effective radium content and radon concentrations pointing to the strong linear dependency between both contents in the studied rocks. The average values of activity concentration of 40K, 232Th, 226Ra, and 222Rn were less than the suggested level by a factor of 1.38%, 3.16%, 2.09%, and 1.16%, respectively. Significant variations were found among the radiological hazards parameters, e.g., the mean value of the annual effective dose (0.55 mSv y−1) was more than the global reference value (0.41 mSv y−1) by a factor of 1.34. The calculated average value of the gamma index was 0.90, and that of the alpha index was 0.37. Hex, Hin and Raeq showed fewer average values than the standard values of unity and 370 Bq kg−1, respectively.

1. Introduction

The majority of the materials existing on the surface of the earth consist of a detectable quantity of naturally occurring radioactive materials (NORM), including thorium, uranium, and by-products. Materials that have a high quantity of NORM are generally carcinogenic in nature [1]. Gamma-radiation is characterized by the energy of gamma-quantum and its intensity. It is the main external source of exposure to radiation and therefore it is important to detect and estimate the radioactive elements in materials used in our daily lives, for the purpose of environmental radiation protection.
The natural radionuclides (40K, 232Th and 226Ra) are a source of external and internal exposures because of gamma ray emission of radon and its daughter products. Radionuclides are found in scattered proportions in the environment [1]. An external hazard occurs by way of direct contact with γ-ray radiation, whereas an internal hazard is caused by α-particles that enter the human body when thoron (220Rn), radon (222Rn), and their products are inhaled. These elements have a short life span but get deposited on the tissues of the respiratory tract [2]. The radioactive materials thoron (T1/2: 56 s) and radon (T1/2: 3.82 days) are formed from the disintegration of 224Ra and 226Ra, respectively, which are formed from the decay of 238U and 232Th. The exhalation process is important in the outdoor and indoor fraction quantity of radon [3,4].
The presence of radioactive elements like Ra, U, and Th is common in many types of rock. Few types of granite have more radioactive elements that depend on the characteristics of its original molten rock [5]. This behavior can be correlated to fractional crystallization and the partial melting of magma. This helps Th and U to converge in the liquid phase and concentrate into the silica-rich phases. Therefore, the granitic rocks are rich in Th and U (mean values: 61.5 Bq kg−1 (15 ppm) of Th and 62 Bq kg−1 (5 ppm) of U), as compared to the crust of the earth (average values: 29.52 Bq kg−1 (7.2 ppm) for Th and 22.32 Bq kg−1 (1.8 ppm) for U [6]. The continental crust’s upper portion has a mean value of 43.05 Bq kg−1 (10.5 ppm) for Th and 33.48 Bq kg−1 (2.7 ppm) for U [7]. In comparison, basaltic rocks or rocks having ultramafic composition contain 1.24 Bq kg−1 (0.1 ppm) of U and 0.82 Bq kg−1 (0.2 ppm) of Th [8]. Thus, the radiological impact of these elements can be assessed by exploring the concentrations of natural radioisotopes and their distributions in rocks [9]. Moreover, it is essential to determine radionuclide concentration in building materials by examining its radiation effect on human health and for managing these types of rocks.
Rare earth elements (REE) are widely used in high technologies such as wind power turbines, electric vehicles, energy-efficient lighting, and catalytic converters, in auto- and fluid catalysts, medical devices, metallurgy, and military defense systems [10]. According to the high economical use of REEs, global demand for REE will increase continuously, which will put great pressure on the current REE supply chain.
The REEs were classified according to The International Union of Pure and Applied Chemistry (IUPAC) recommendations as a group of 17 elements comprising 15 elements in the lanthanide group, plus scandium and yttrium [11]. REEs are divided into two groups light (LREE) and heavy (HREE) rare earth elements based on the structure of electron shell. The LREEs are lanthanum, cerium, praseodymium, neodymium, promethium, samarium, europium, and gadolinium, while terbium, dysprosium, holmium, erbium, thulium, ytterbium, and lutetium constitute the HREEs [12]. It is well known that the rare earths are highly concentrated in the alkaline rocks. Therefore, we have determined the content of REE in the Abu Khuruq rocks to evaluate their potentiality and their possible exploitation in future.
This study aimed to estimate the activity concentrations of the examined radioisotopes (Radium-226, Thorum-232 and Potassium-40) in the alkaline rocks of the Abu Khuruq ring complex, to increase awareness and mitigate possible hazards from radon concentration emitted from this area, and to study the spatial distribution of the REEs in the alkaline rocks from the Abu Khuruq ring complex in the Eastern Desert of Egypt. Consequently, these data could serve a basis for future mapping of the REEs levels in this location of the Eastern Desert of Egypt

2. Materials and Methods

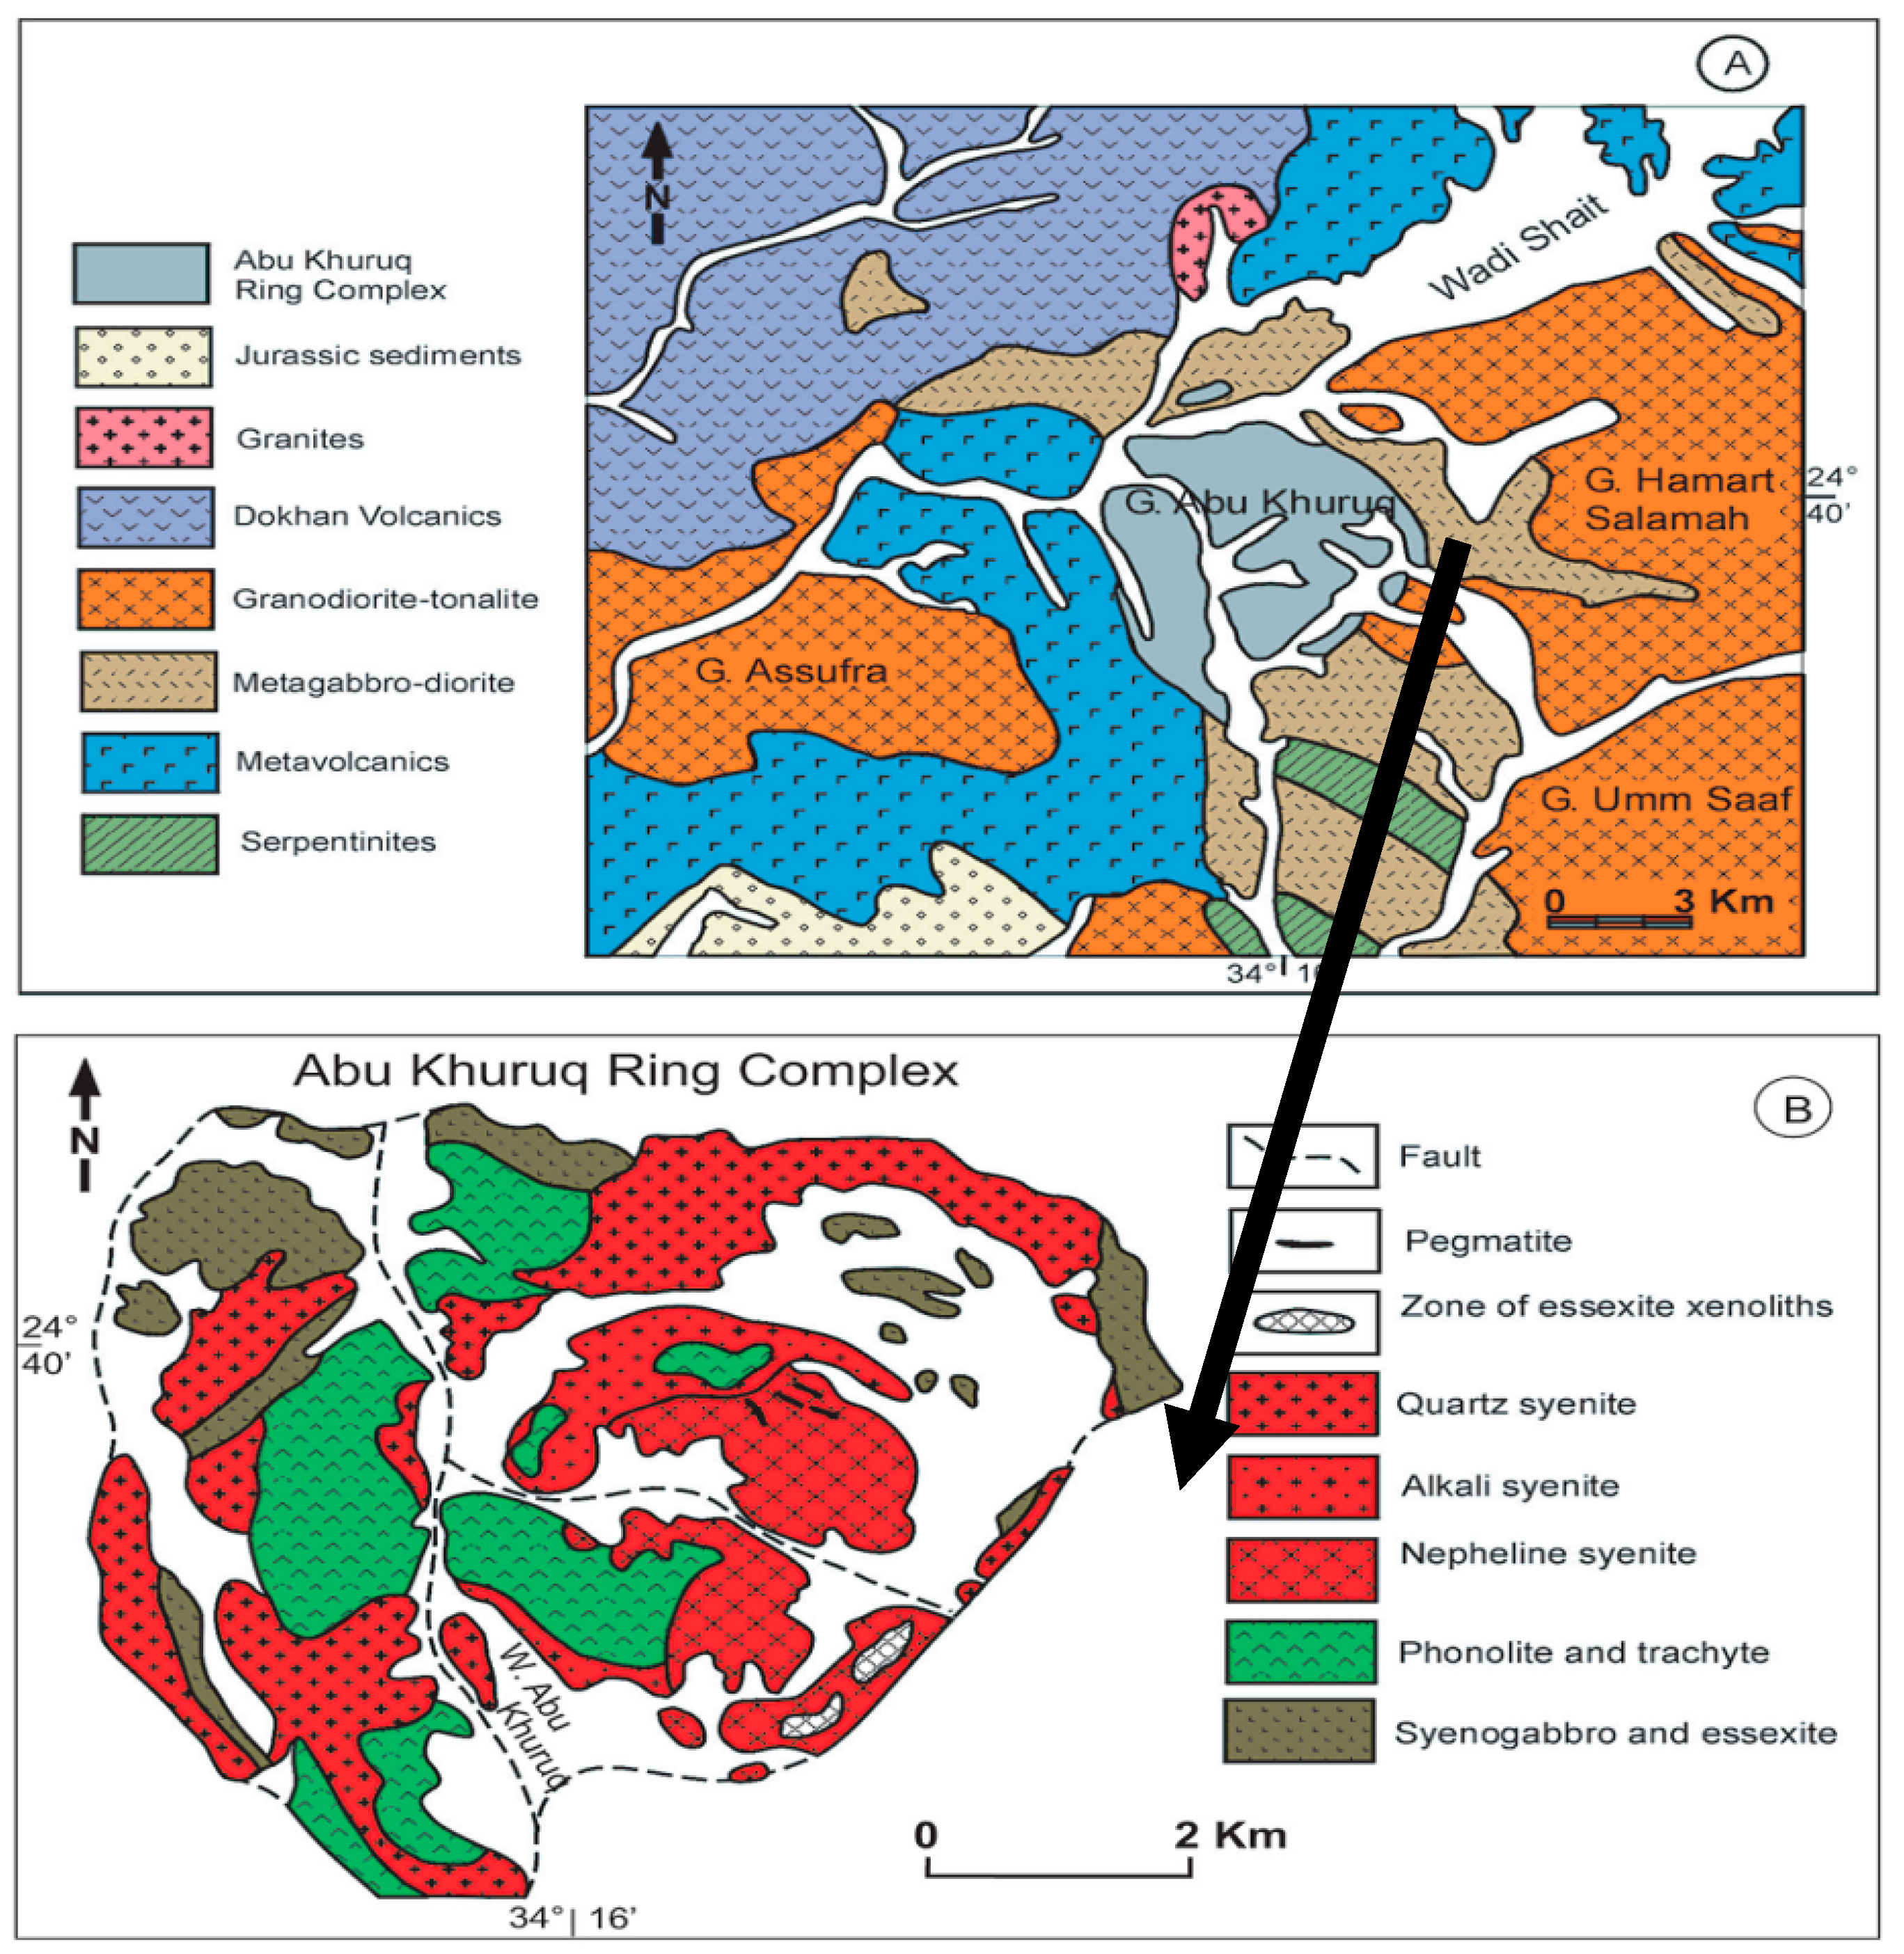
2.1. General Description of the Geology of Abu Khuruq Area

The late Cretaceous (89 Ma) Abu Khuruq ring in the southern portion of the Eastern Desert (Figure 1) is located between latitudes 24°00′10″ and 24°03′15″ N and longitudes 33°54′50″ and 33°58′ E. It is the youngest ring complex in Egypt [13]. The outcrop occupies about 14.5 km2 from north to south.
The ring is formed of discontinuous ring dykes, cones, sheets, and bodies of stock type [14]. Its center consists of alkaline trachyte and alkaline rhyolite porphyry rocks. The outer rings are composed of alkaline gabbro (syenogabbro, essexite) and syenites rocks. The latter consists of quartz syenite, syenite, nepheline syenite, and nepheline-bearing pegmatites. A major ring fracture isolates the outer ring, i.e., quartz syenite, and syenite and nepheline syenite. The alkaline rocks of Abu Khuruq consist of minerals rich in K and Na, including alkali pyroxenes, feldspathoids, and a part of alkali amphiboles. All these rocks occur in rifting and/or extensional tectonics settings [15].

2.2. Sample Preparation

Twenty granitic rock samples were clustered from the Abu Khuruq Alkaline Ring Complex during the winter of 2013 and 2014. These samples included all types of granitic rocks found in the area. Each sample was grinded into a fine powder, sieved using a mesh of size 200 μm, dried for more than three hours at 120 °C (for dehumidification), weighed and finally placed in a sealed plastic container measuring 95 mm in length, 80 mm in height and 0.5 mm in thickness. To ensure that the radon is airtight, each container was plastered tightly in the neck of the container with a vinyl tape. Containers were saved for 30 days or more to ensure secular equilibrium among 226Ra, 222Rn and their progenies.

2.3. The Gamma Radiation Measurement

The radioisotopes were examined in the Nuclear Lab, Physics Department, Faculty of Science, Assiut University using a high purity germanium detector (HPGe) (Canberra, GR4020 model). Its relative efficiency was about 40%, with an energy resolution of 2 keV (FWHM) for the gamma-rays of 1.332 MeV using 60Co transition. A lead shield (Model 747E, Canberra Industries, Inc., USA) was used for shielding the detector, and the DSA-1000 (Canberra Industries, USA) was utilized for data acquisition. 60Co and 137Cs point sources were used for energy calibration of the detection system. Further, efficiency calibration was done using Canberra’s Geometry Composer, Lab SOCS software. It was used as an alternative source for each sample for optimizing the containers’ physical dimensions. This improved the radiation detection capacity of HPGe detector. The measuring time depends on the radionuclide concentration in the measured samples. The spectra were analyzed automatically by GENIE-2000 software [16].
The concentration of 226Ra specific activity was estimated using the transition lines of energies 609.31, 1120.3 and 1764.5 keV for 214Bi and 295.2 and 351.9 keV for 214Pb. Using the transition gamma lines of energies 209.25, 338.32, 968.97 and 911.2 keV for 228Ac, 212Pb Gamma emissions at 238.63 keV and 208Ti emissions at 583.19 and 2614 keV gamma lines, the specific activity concentration of 232Th was computed, while the transition line 1460.8 keV was the only one used to assess the specific activity concentration of 40K.

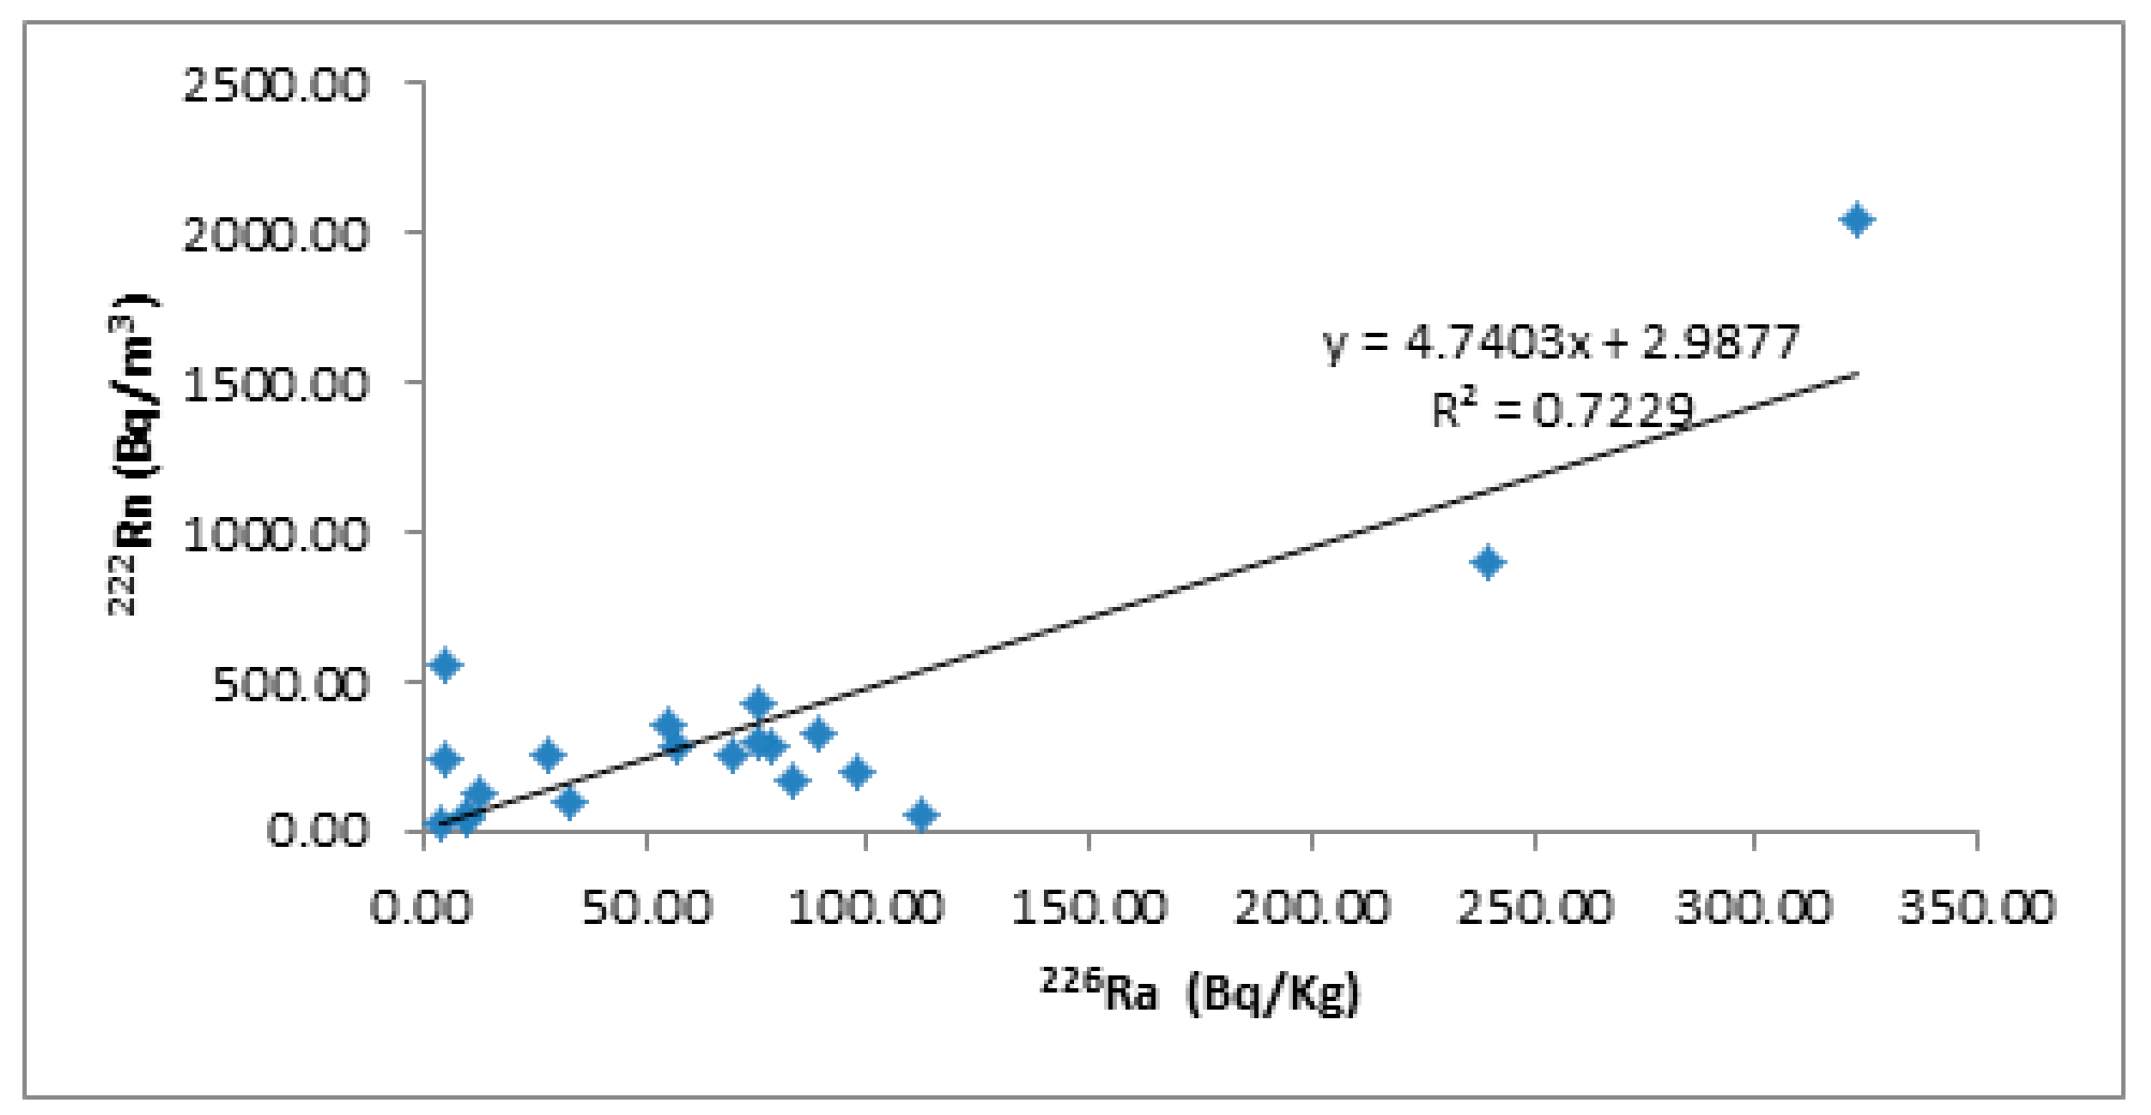
2.4. Radon Measurement

An Alpha-Guard (Saphymo GmbH system, model PQ 2000, AG) is used to analyze radon concentration (Bq m−3) in the rock samples. It operates in the manner of a chamber for pulse ionization, mounted on an emanation container with an Alpha-Pump (AP) (Genitron, Frankfurt, Germany) operated at a particularly low flow rate of 0.05 L min−1. The temporary radon (222Rn) concentrations were recorded in the intervals of one-min for an overall time period of 20 min. The concentration became stable after showing an initial increment. The average values of the final stabilization were considered here as the actual concentration of radon. The contribution of thoron (220Rn, T1/2 = 55 s) at this low flow rate was negligible [17].

2.5. Rare Earth Elements Concentration

The concentrations of REEs were recorded at OMAC lab (in Loughrea, Ireland). In this study, the ICP-mass spectrometer (ICP-MS) and inductively coupled plasma atomic emission spectrometry (ICP-AES) were used. The REE concentrations were measured using ICP-MS (ALS code ME-MS81) following a method of lithium metaborate fusion digestion. The limit for the estimation was set at 0.01–0.5 ppm for the REEs. For the experiments, lithium metaborate flux (0.90 g) was mixed well with 0.2 g of the sample from each batch and then melted at 1000 °C in the furnace. Then, the obtained solution was cooled and further dissolved in a solution of 100 mL containing 2% hydrochloric acid (HCl) or 4% nitric acid (HNO3). The obtained solution was then examined for its concentration using the ICP-MS (ALS code ME-MS81) and ICP-AES (ALS code ME-ICP06) techniques. The obtained results were corrected further for the spectral inter-element interferences [18].

3. Results

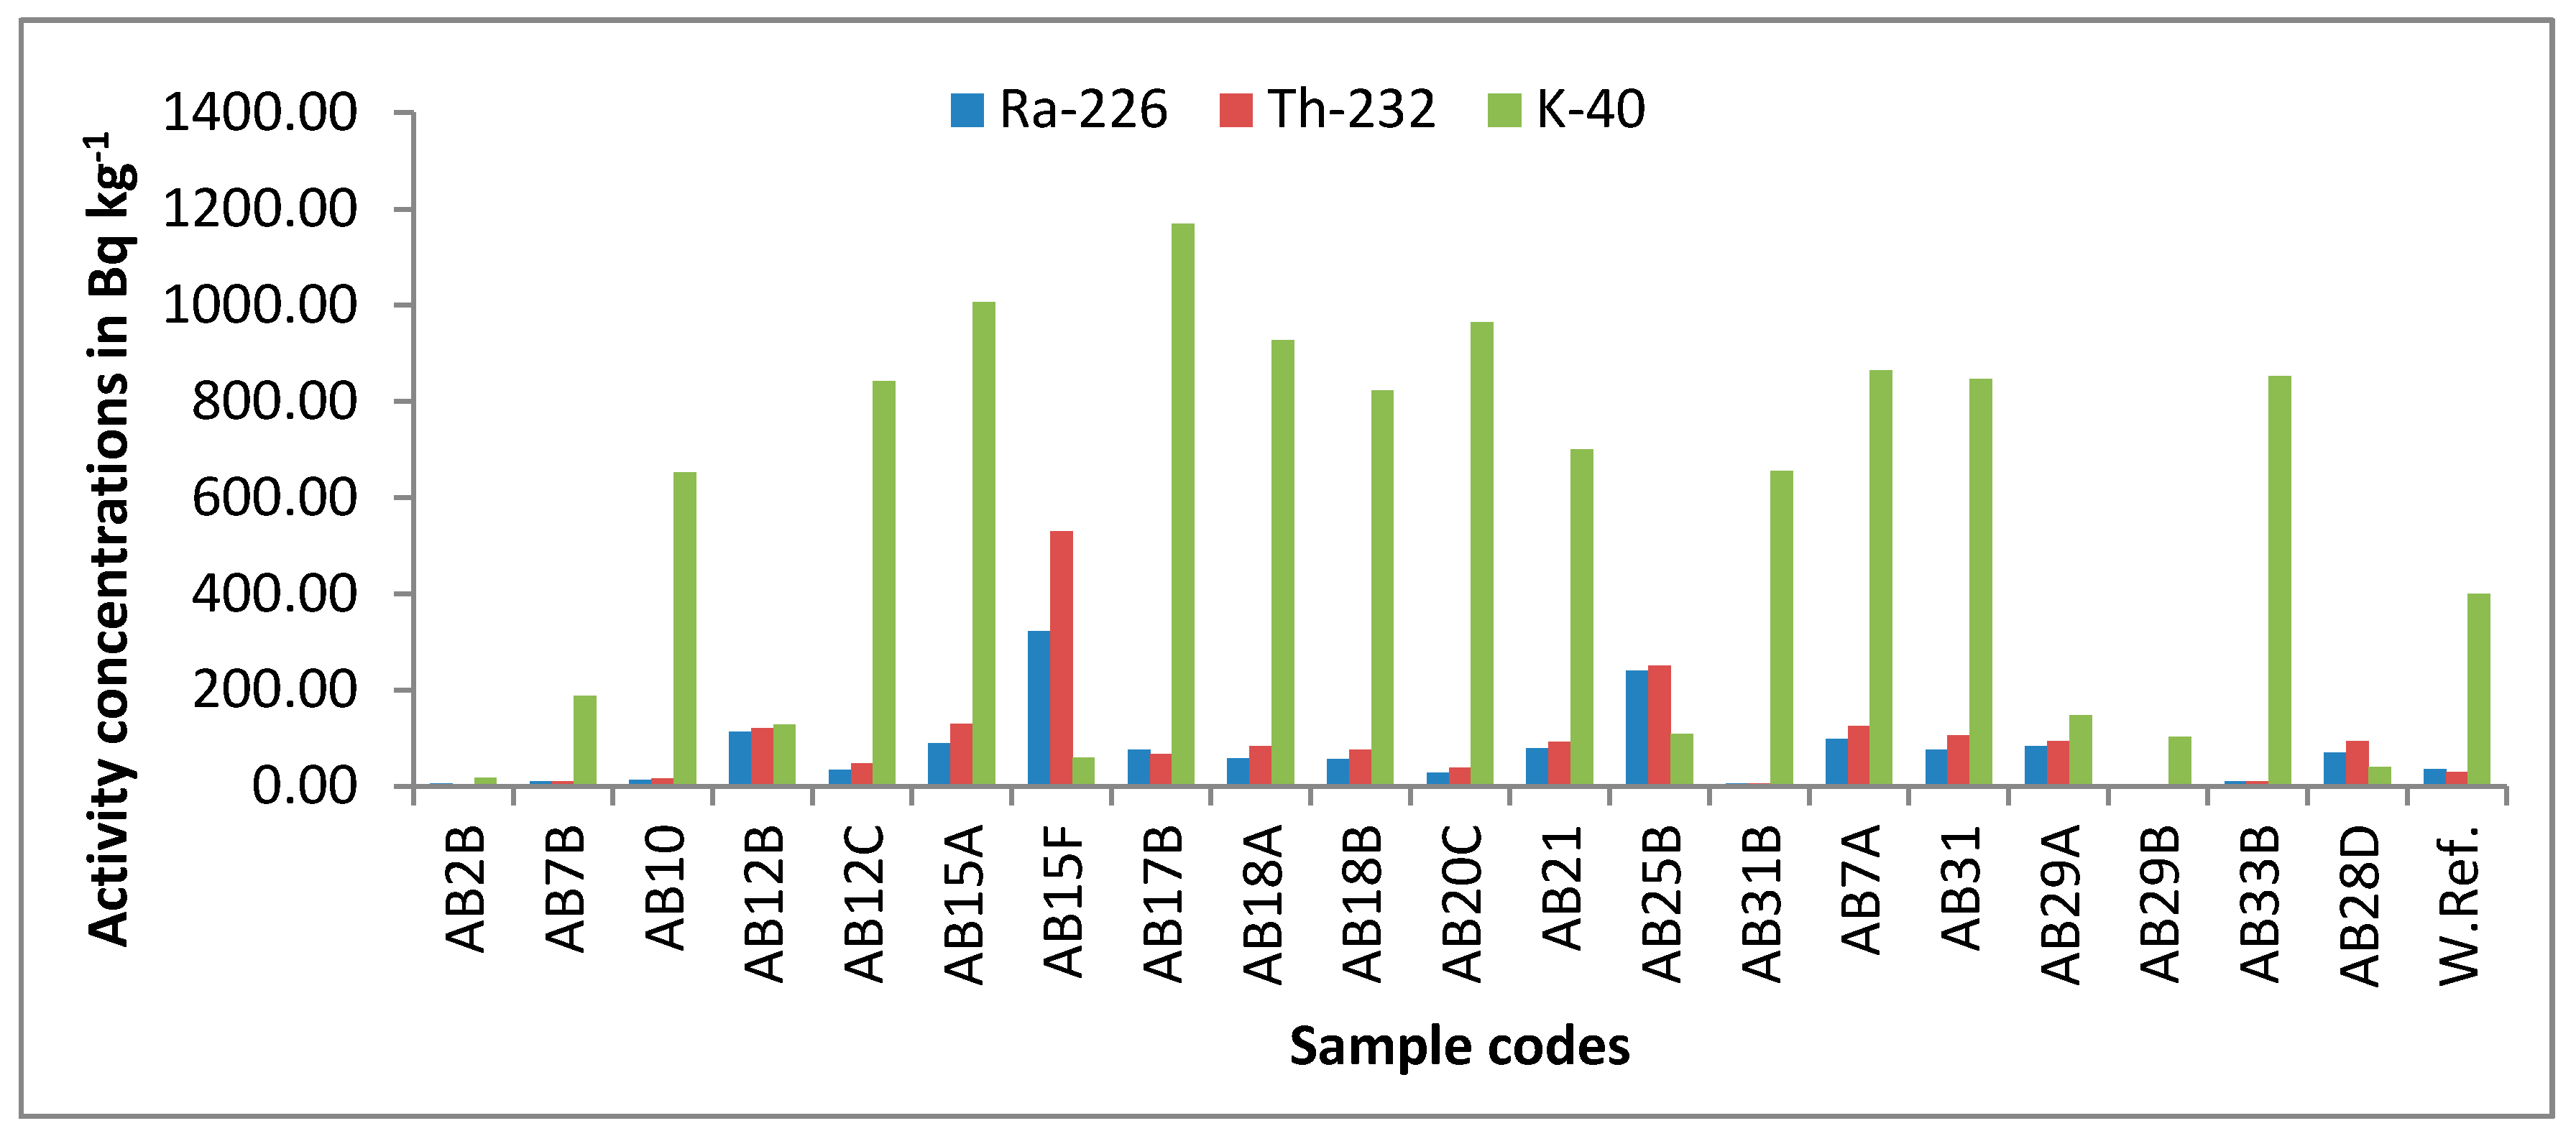
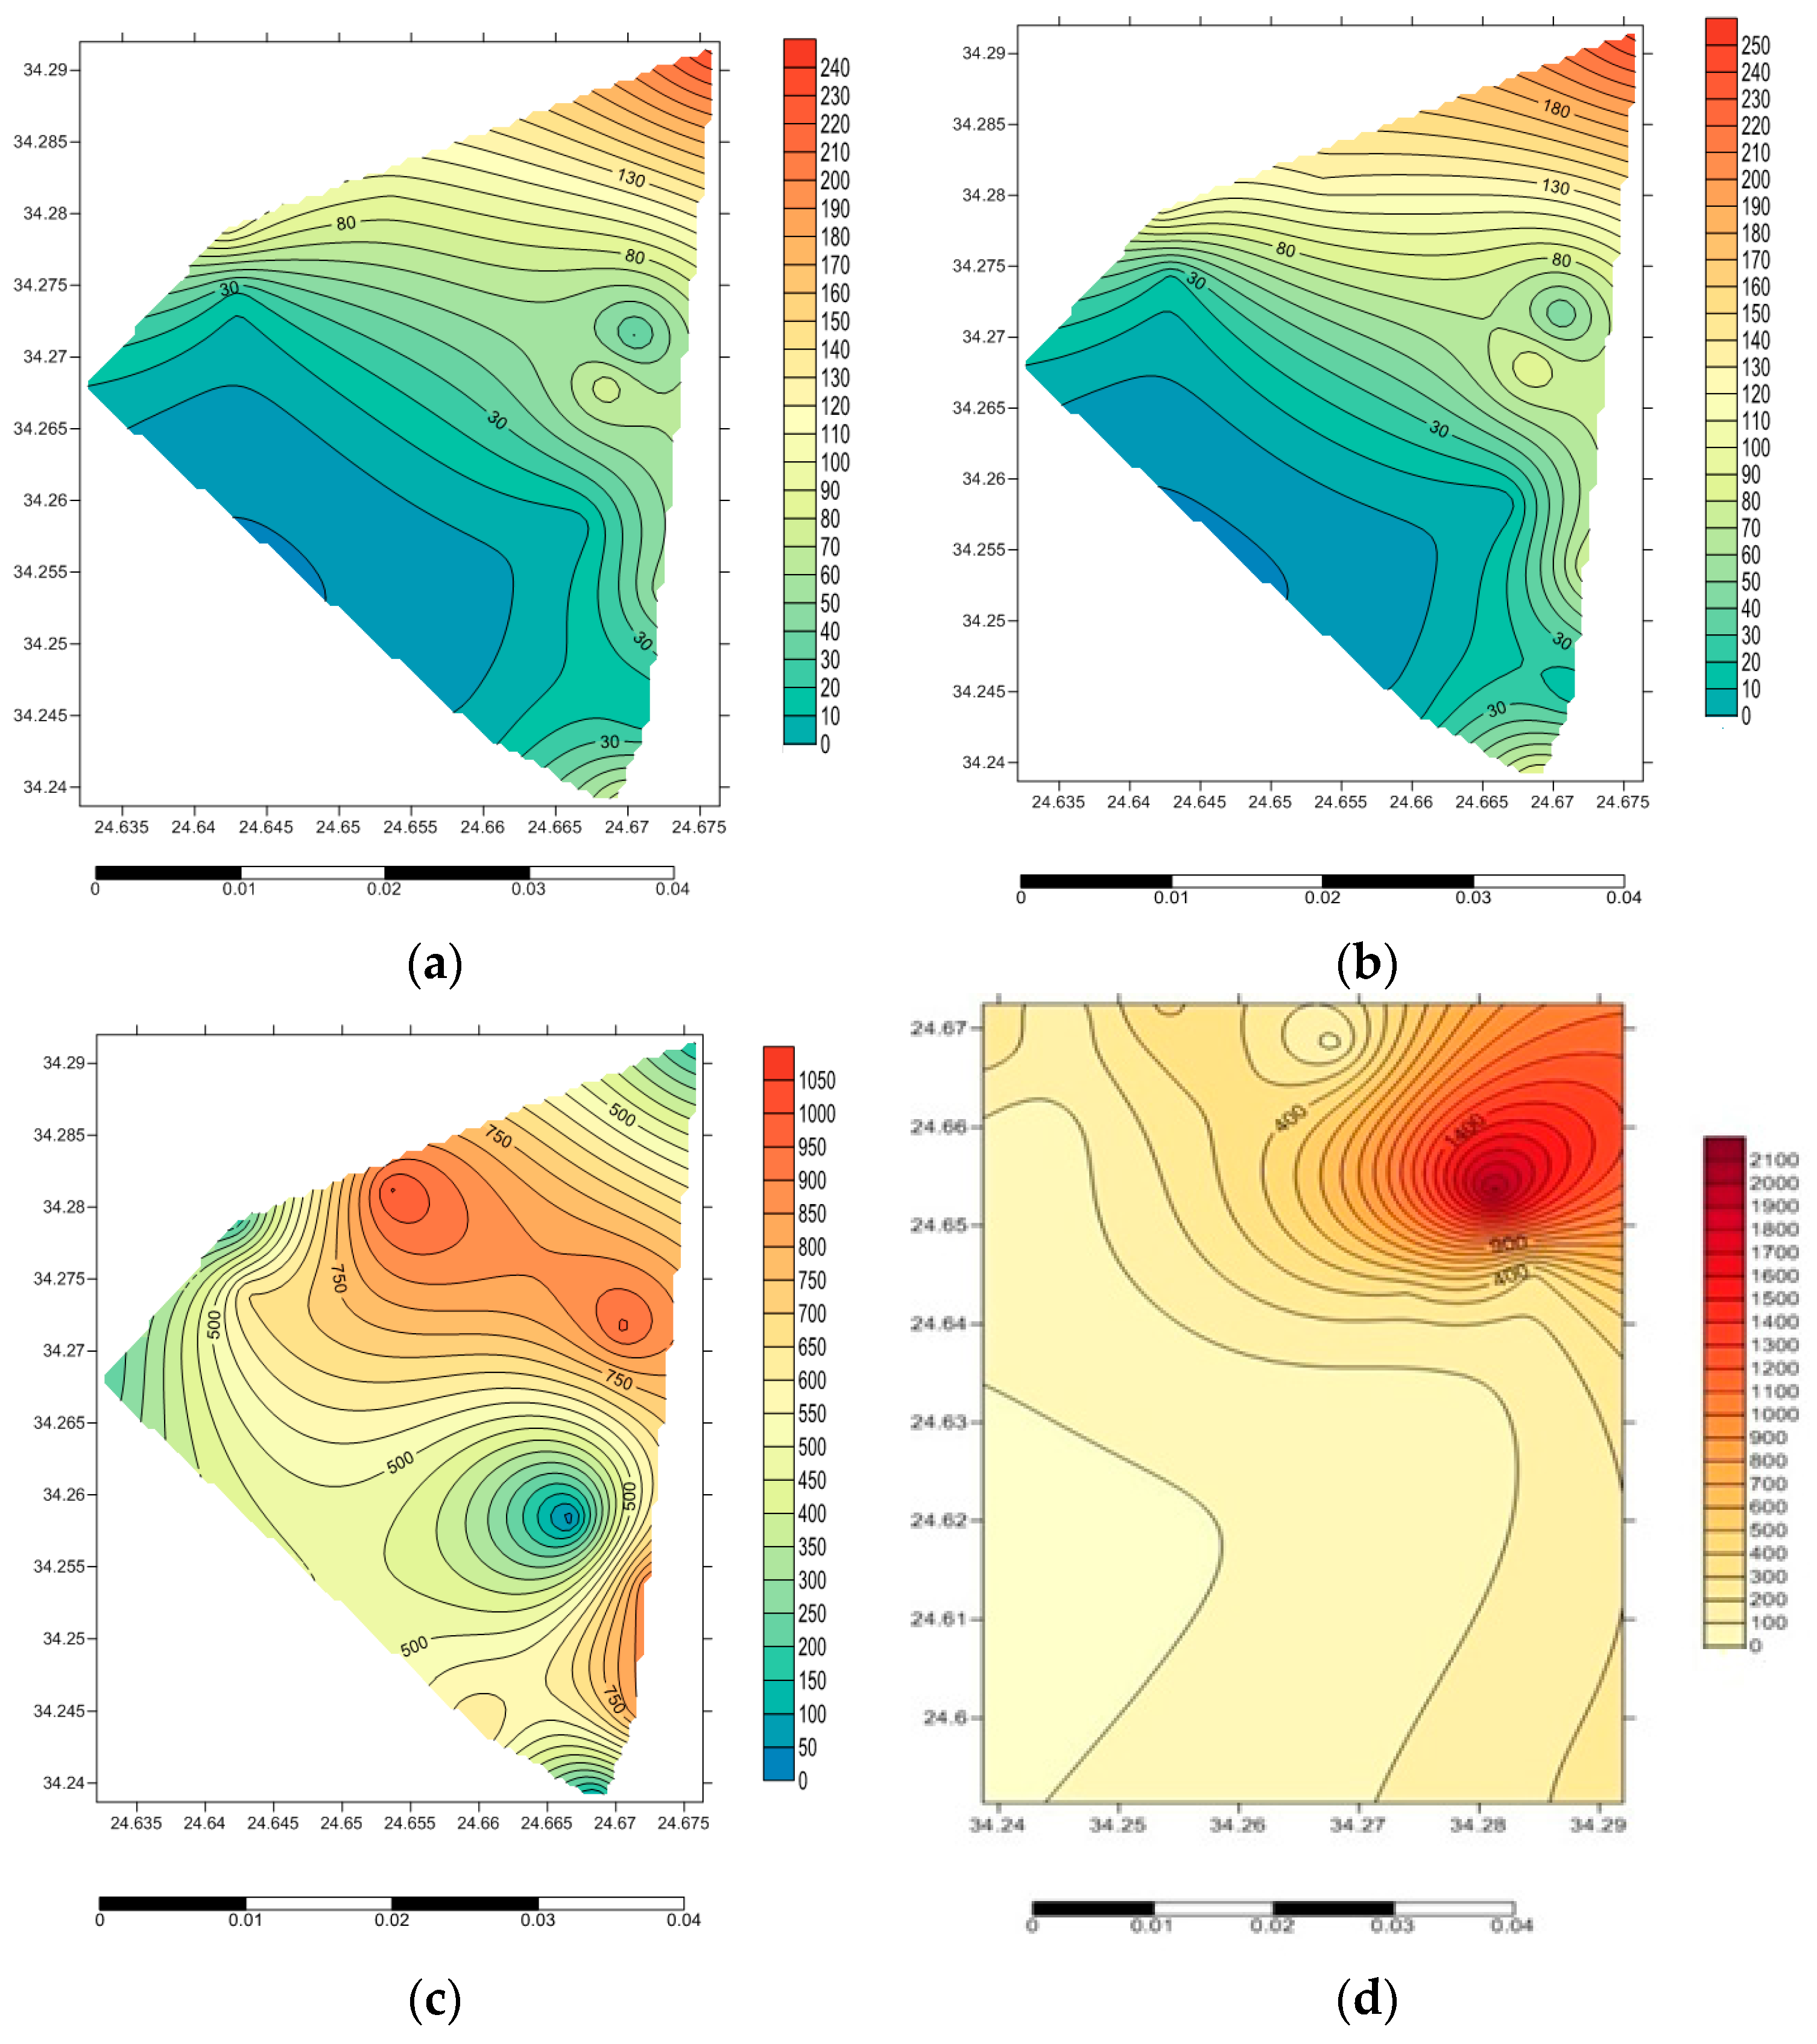
3.1. Activity Concentrations of Radioisotopes in the Investigated Samples

The estimated concentrations of 40K, 226Ra, and 232Th in the investigated rocks are shown in Figure 2. In the samples, 40K, 226Ra, and 232Th showed the highest specific activities at 1170 ± 25.10 Bq kg−1, 322.4 ± 10.53 Bq kg−1, and 530.5 ± 17.76 Bq kg−1, respectively. The lowest values for the three radionuclides were 17.1 ± 1.47 Bq kg−1, 4.46 ± 0.59 Bq kg−1, and 3.44 ± 0.60 Bq kg−1, respectively. 40K showed a mean value of 554.88 ± 15.20 Bq kg−1, whereas 226Ra and 232Th showed mean values of 73.27 ± 2.55 Bq kg−1and 95.04 ± 3.89 Bq kg−1, respectively. The estimated mean values are distinctly higher than the global mean values of 400, 35, and 30 Bq kg−1 by 1.38, 2.09, and 3.16 factors, respectively [1]. Figure 3a–d represents the contour maps of the activity concentrations of the examined radioisotopes (40K, 226Ra, 232Th, and 222Rn), where the highest concentrations were recorded close to the center of the ring.
In the rock samples, the mean concentration of radon was 350.28 Bq m−3 while its concentration range was 26.5 Bq m−3 to 2044 Bq m−3. The mean concentration of radon is extremely higher than the worldwide mean of 40 Bq m−3 [1] and is more than the suggested reference level, i.e., 200–300 Bq m−3 [19] by about 1.16–1.75 times. The maximum radon gas content was recorded close to the center of the ring (2044 Bq m−3) as shown in Figure 3d, while the minimum was the host rock (gabbro) (37 Bq m−3). Uranium mineralization in Abu Khuruq is confined to the accessory minerals bearing uranium (zircon, allanite, etc.). The radon concentration at Abu Khuruq ring is high, possibly because the rocks alkalinity, i.e., phonolite, trachyte, syeno-gabbro, nepheline syenite, essexite, and quartz syenite, and the pegmatites bearing nepheline with high total radiation (counts). However, radon is most commonly generated close to the site of uranium, its ultimate long-lived parent. The highest level of radon concentration was recorded in the nepheline syenite (Sample No. AB 15F) rich in dark xenoliths (2044 Bq m3).
Figure 4 clearly indicates that the linear correlation coefficient between effective radium content and radon concentrations was 0.72; pointing to the strong linear dependency between both contents in the studied rocks.

3.2. Radiological Hazard Parameters

3.2.1. Radium Equivalent Activity Raeq

Globally, granitic rocks are utilized as decorative materials and superior building materials in homes and other construction works. It is, therefore, essential to assess the level of natural radioactivity associated with them.
Several radiation hazard indices have estimated the radiological hazards caused by γ-rays emitted from 40K, 226Ra, and 232Th. In general, any Raeq concentration exceeding 370 Bq Kg−1 may elevate radiation hazards. In our study, radiation equivalent activity was estimated and expressed in Bq kg−1 and represented as Ra eq . It is given by Xinwei et al. [20].
Ra eq ( Bq   kg 1 ) = AC Ra + 1.43 AC Th + 0.077 AC K
where ACK, ACRa, and ACTh denote the specific activities of 40K, 226Ra, and 232Th, respectively.
The obtained Raeq values ranged from 10.94 to 1085.62 Bq kg−1 and had a mean value of 251.89 Bq kg−1. The sample (AB15F) with the highest concentrations of 232Th and 226Ra showed the highest value of 1085.62 Bq kg−1. All the Raeq values were within the recommended level of 370 Bq kg−1 [21], except for samples (AB15F and AB25B). These values are comparatively lower than the accepted maximum value for construction materials (370 Bq kg−1) [21,22]. This indicates the safe use of the rocks of Abu Khuruq with a particular care for the locations of samples AB15F and AB25B.

3.2.2. Absorbed Dose Rates (DR) and Annual Effective Dose Rates (AEDR)

Based on the formulas initiated by United Nations Scientific Committee on the Effect of Atomic Radiation (UNSCEAR) [1] and European Commission (EC) [23], the DR of indoor air (DR in nGy h−1) and the corresponding AEDR in mSv y−1 due to γ-rays emission from 40K, 226Ra, and 232Th were estimated. The European Commission and UNSCEAR reports suggest that the coefficient of dose conversion is determined for the center of a standard room (dimensions 4 m × 5 m × 2.8 m and 3 cm thicknesses of granitic tiles of 2600 kg m−3 density covering all walls of the room). The DR was determined using Equation (2) as provided in UNSCEAR [1] and EC [23].
D R [ nGyh 1 ] = 0.436 AC Ra + 0.599 AC Th + 0.041 AC K
Thus, the AEDR in mSv y−1 due to γ-rays from the studied rock samples were computed as:
AEDR [ mSvy 1 ] = D R ( nGy   h 1 ) × 8766   h × 0.8 × 0.7 SvGy 1 × 10 6
where the indoor occupancy factor is 0.8, the conversion coefficient obtained from the absorbed dose in air (Gy) to effective dose in Sv is 0.7 Sv Gy−1, and the annual time in hours as suggested by UNSCEAR [1] is 8766 h.
Table 1 shows the obtained indoor DR and the AEDR of the investigated samples. The mean value of DR was 112.01 nGy h−1, while it ranged from 4.83 to 460.83 nGy h−1. Here, it should be noted that the global mean value of DR is 84 nGy h−1 [1], which is lower than the obtained mean DR. The AEDR values ranged from 0.02 to 2.26 mSv y−1. Its mean value of 0.55 mSv y−1 is lower than the dose criterion of 1 mSv y−1 [19,24] but slightly higher than the global mean value of 0.41 mSv y−1, as in UNSEAR [1].

3.2.3. External Hazard Index (Hex)

The Hex reflects external exposure or the external risks of gamma rays radiated from natural radionuclides. It is presented as follows UNSCEAR [1]:
H ex = AC Ra 370 + AC Th 259 + AC K 4810 1
To avoid the external risks of gamma-rays (reflecting a neglected external exposure), it is essential that Hex must be less than unity (=370 Bq kg−1) (the upper limit of Raeq criterion).
Table 1 presents the estimated Hex values for the collected samples. The table shows that Hex varies in each sample, and its average value (0.68) is lower than unity (the recommended safety limit).

3.2.4. Internal Hazard Index (Hin)

The internal exposure of the human body to radon and its related elements poses radiological hazards to internal organs and can be examined by Hin, as shown below:
H in = AC Ra 185 + AC Th 259 + AC K 4810 1
Table 1 shows the varied values of Hin in the studied samples. It is obvious that the average value of Hin (0.88) does not go beyond unity. The estimated values of Hin and Hex for the Abu Khuruq samples were below the permissible limit of unity. Hence, the uses of these rocks have no immediate negative health implications, but a warning should be given against long-term cumulative effects.

3.2.5. Alpha and Gamma Indices (Iα & Iγ)

The alpha index (Iα) estimates radon inhalation for the emitted radon from building materials [24,25,26,27]. This index is determined through the specific activity concentration of 226Ra, ACRa which is in Bq kg−1
I α = AC Ra 200 Bq   kg 1
where ACRa is the activity concentration of the alpha emitter 226Ra (Bq kg−1). If the activity concentations of radium in a construction material exceeds 200 Bq kg−1, radon exhalation from a material may have an adverse effect of increase of indoor radon concentrations more than the recommended reference value of 200 Bq m−3 [27,28]; thus, the recommended safe limit is less than or equal to unity.
The values of Iα varied from 0.02 to 1.61, and its average was 0.37, which is well within the recommended upper level. So, these rocks can be considered for use as construction materials.
The potential radiological hazards for using granite samples as superficial building materials (decorative or covering) are assessed by the gamma representative index (Iγ) as given in the equation below [23].
I γ = AC Ra 300 + AC Th 200 + AC K 3000
In the case of popular materials with limited use, e.g., tiles, Iγ ≤ 2 denotes an annual effective dose of ≤0.3 mSv, whereas 2< Iγ ≤ 6 denotes a dose of ≤1 mSv [23]. The computed Iγ values of the studied samples are inserted in Table 1. Its values vary from 0.04 to 3.75 with a mean value of 0.90, which is within the acceptable limit of Iγ < 2 for materials with limited use (e.g., boards, tiles, etc.). This value denotes an indoor annual effective dose <0.3 mSv. So, the investigated rocks are safe for use as superficial materials in construction.

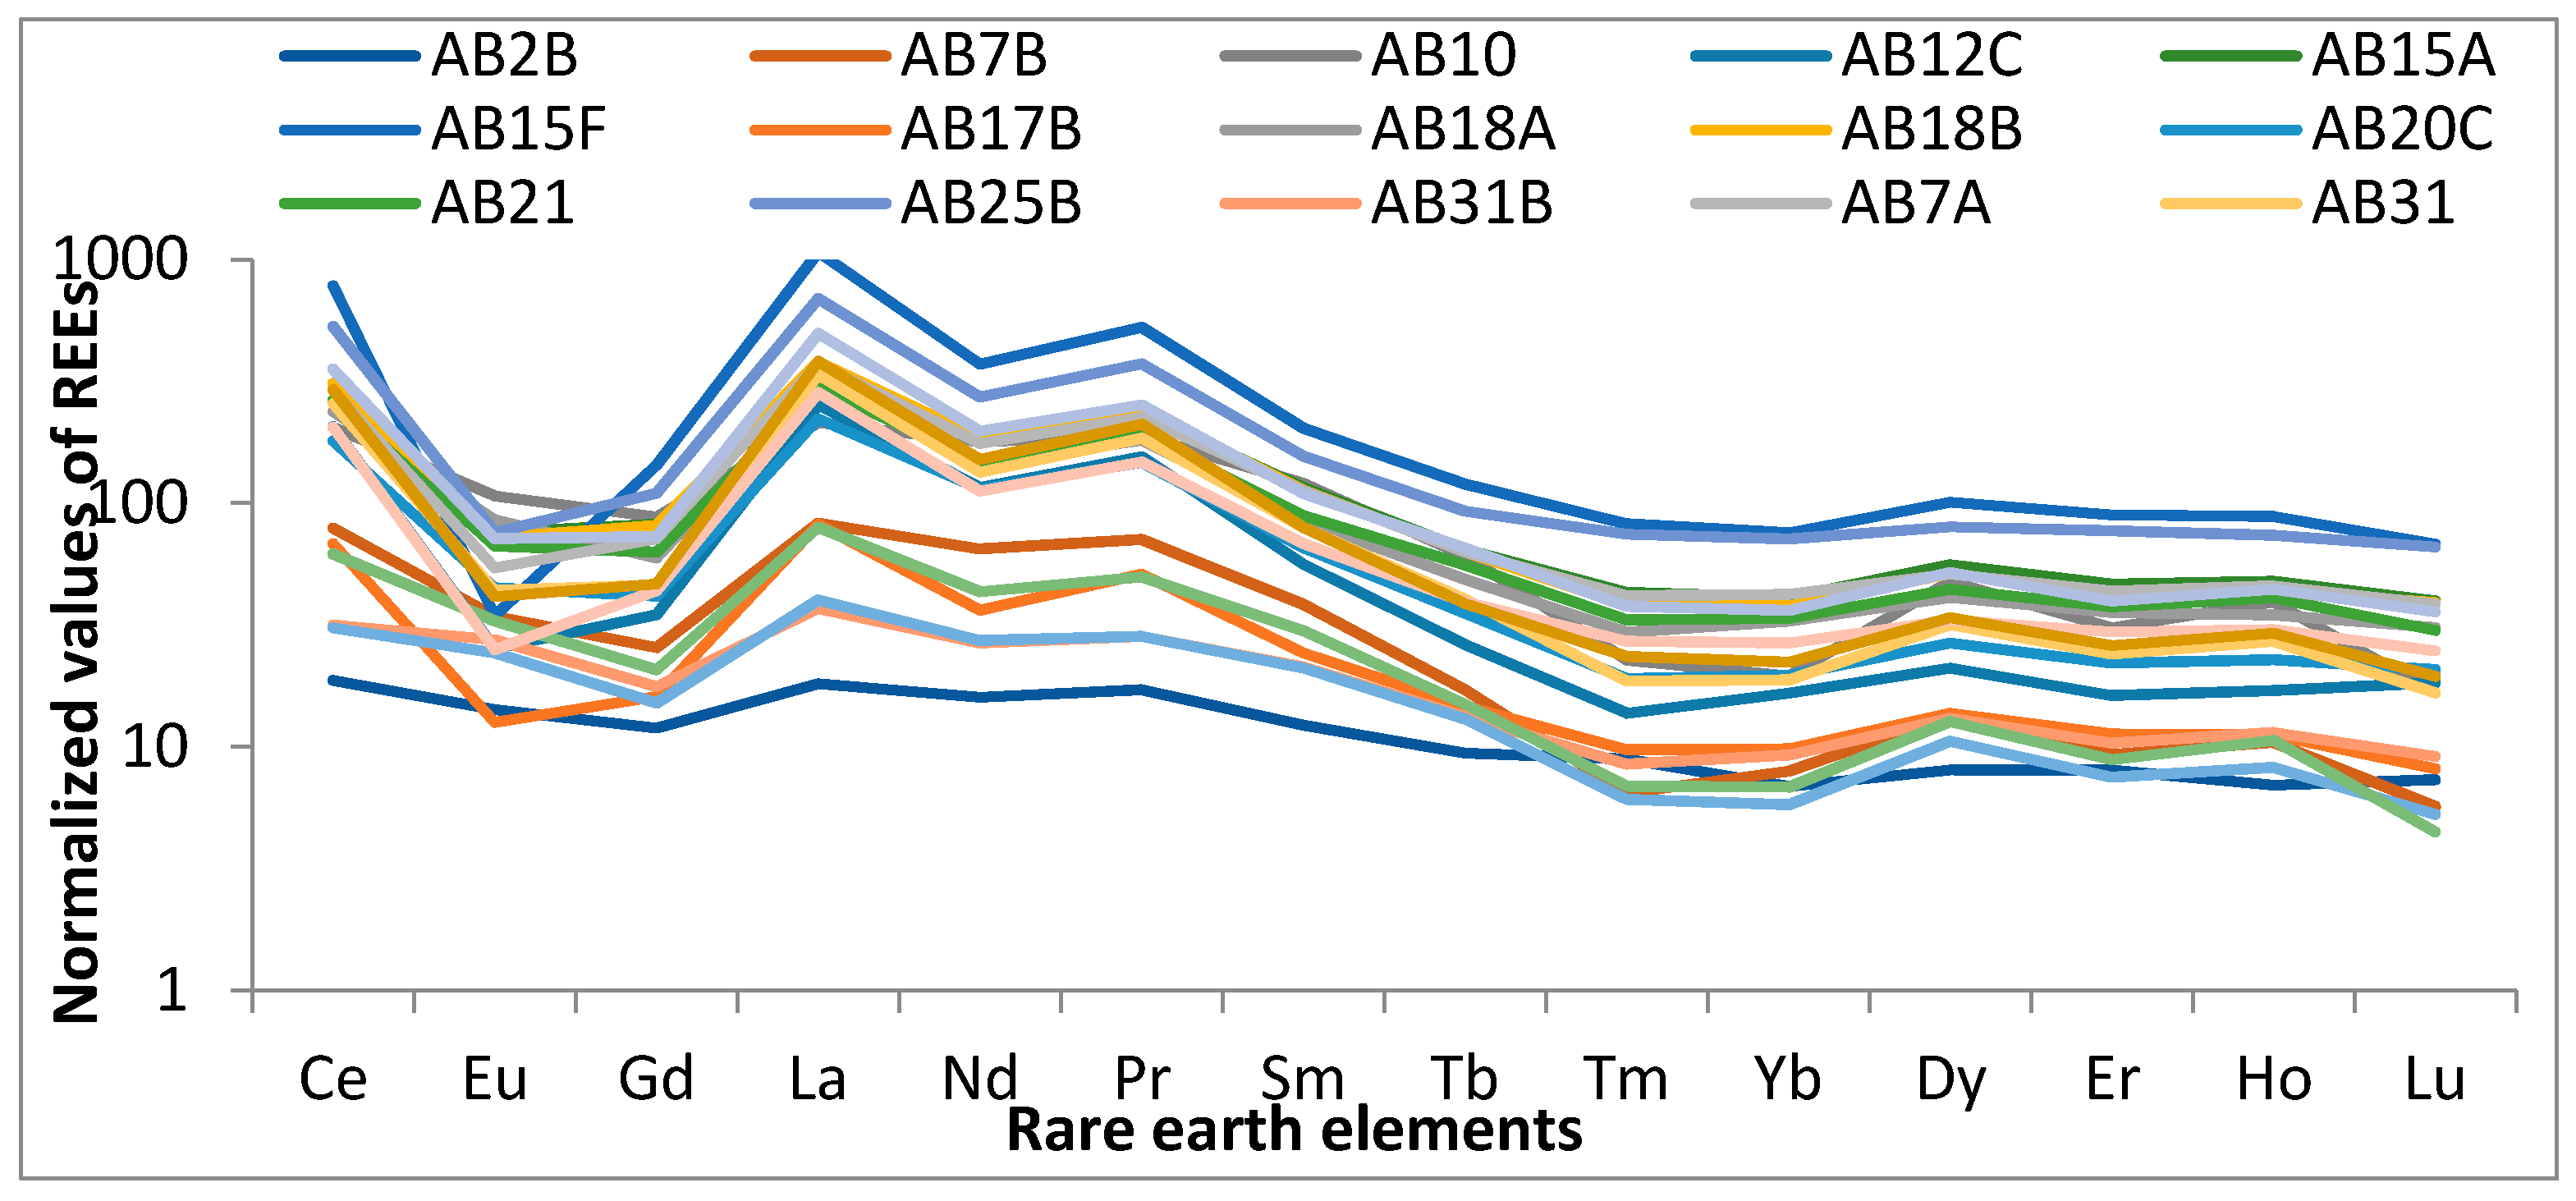
3.3. The Rare Earth Element Concentrations in the Alkaline Rocks of Abu Khuruq

The alkaline rocks of Abu Khuruq are enriched in sodium and potassium minerals (e.g., alkali pyroxenes, feldspathoids, and alkali amphiboles) that are not generally found in other rocks. These rocks mainly contain Na-rich pyroxenes (e.g., aegirine) and Na-rich amphiboles (e.g., riebeckite and arfvedsonite). Feldspathoids such as cancrinite, leucite, nepheline, or sodalite can be an alternative to feldspars. The peralkaline rocks (NK = Na2O + K2O; CNK = CaO + Na2O + K2O; A = Al2O3) contain several rare metals that reflect their mineralogy. These rocks are rich in thorium, uranium, REE), and high-field strength elements (HFSE) including zirconium and niobium. They exist within-plate tectonic and in anorogenic settings, dominantly in crustal extension and/or continental rift zones [29]. The REE in the studied rocks are of economic importance. They are classified into two types: heavy REE (HREE) and light REE (LREE). The LREE possess low atomic weight, i.e., they are in the series of lanthanum to europium. The HREE include gadolinium (or europium) to lutetium. Compared to HREEs, the LREEs possess larger ionic radii and have characteristics that are entirely different during petrogenetic processes. REE are present in minor quantity in mafic rock-forming minerals such as biotite and amphiboles, and they replace the cations of analogous radius and charge. A previous study has showed that REE-bearing minerals are highly over hanged by either LREE or HREE [30]. There are three REE-rich minerals: xenotime (YPO4), monazite (Ce,La,Nd,Th) (PO4,SiO4) and bastnäsite (Ce(CO3)F). Monazite and bastnäsite are the major contributors of LREE, while xenotime is the major contributor of HREE and Y. The chondrite-normalized REE patterns [31] of the studied rocks are presented in Figure 5.
The ΣREE concentrations (Table 2) in the investigated rocks are 12.43 ppm for Lu and 2878.50 ppm for Ce with an average value of 487.81 ppm. The Oddo-Harkins rule [32] state that the concentrations of REE tend to decrease with increase in atomic number:
Ce > La > Pr > Sm > Gd > Dy > Er > Yb > Eu > Tb > Ho > Tm > Lu. The average concentrations of REE in the studied rocks showed a similar order:
Ce > La > Nd > Sm > Pr > Gd > Dy > Er > Yb > Eu > Ho > Tb > Tm > Lu. But, there were a few exceptions (i.e., Dy enrichment and Eu depletion).
The Σ LREE concentrations varied from 54.61 ppm to 2878.50 with a mean of 909.63 ppm. They represent about 93% of the mean REE concentrations in the studied rocks due to the concentration of bastnaesite and monazite. Ce, La, and Nd have the highest concentrations of REEs that account for 42%, 20%, and 18% of the total concentration, respectively. The ΣHREE concentrations ranged from 32.37 ppm to 182.71 ppm, comprising 7% of the total sum.
The Abu Khuruq ring rocks are enclosed with alteration halos because the alkali-rich magmatic fluids escaped into the rocks present in the surrounding country, resulting in alkali metasomatism. The rock minerals of the host are converted to an assemblage consisting mostly of alkali-rich minerals such as albite. The nepheline syenites and syenites are created when the alkaline basaltic magmas undergo extensive fractional crystallization [15]. It is assumed that these melts are generally derived from the partial melting of lithospheric mantle that contains REE, HFSE, U, Th, and halogens [33]. These elements are highly incompatible to mantle and rich in the residual melts formed during crystallization. The crystallization range is moved to low temperatures in the presence of volatile elements such as fluorine [34]. In addition, these volatiles also suppress the crystallization of minerals bearing HFSE and REE until the magma becomes saturated of fluid and contains abundant quantities of rare metals [35].

3.3.1. Major Oxides Contents of Rocks

The major element concentrations investigated in the studied rocks (Table 3) are SiO2: 36.00–77.70% with a mean value of 57.05%; Al2O3: 10.40–21.20% with a mean value of 15.59%; Fe2O3: 0.94–20.95% with a mean value of 8.81%; CaO: 0.19–15.72% with a mean value of 5.29%; MgO: 0.01–9.30% with a mean value of 2.70%; Na2O: 3.04–8.90% with a mean value of 5.25%; K2O: 0.32–4.95% with a mean value of 2.87%; TiO2: 0.07–5.32% with a mean value of 1.29%; MnO: 0.07–0.35% with a mean value of 0.18%; P2O5: 0.02–2.76% with a mean value of 0.36%; BaO: 0.01–0.14 with a mean value of 0.05%; and SrO: 0.01–0.09 with a mean value of 0.03%. Significant variation was noticed between the measured concentrations of major oxides due to the various redox conditions and other factors [36]. The ordering of elements based on their abundance was SiO2 > Al2O3 > Fe2O3 > CaO > Na2O > K2O > MgO > TiO2 > P2O5 > MnO > BaO > Cr2O3.

3.3.2. Pearson’s Correlation Coefficient

Significantly positive correlations were observed among REEs (Table 4), indicating the symmetrical chemical properties and its overall presence in the parent material [37]. The correlations through REEs can be used as tracers [38]. There is no clear correlation among REEs and major oxides in the investigated rock (Table 5), except between REEs and SiO2, Na2O, K2O, and MnO.

4. Conclusions

The activity levels of the natural radioisotopes, such as 40K, 232Th, 226Ra, and 222Rn, and REEs in the alkaline rocks samples from Abu Khuruq ring complex were assessed using different experimental techniques.
Radiologically, a high purity germanium detector (HPGe) was considered to measure the mean concentrations of the investigated radionuclides in the rocks of Abu Khuruq, Egypt. Distinct variations were observed between the calculated radiological hazard indices compared to the worldwide average. Some indices showed greater values compared to the world average, e.g., DR, AEDR, Iα, and Iγ. Hence, protective covering should be used when handling such rocks to prevent excessive exposure to radiation. The remaining indices showed lower values compared to the world average, e.g., Hin, Hex, and Raeq. Thus, the use of these materials presents the least possibility of any immediate health complications, but caution should be taken against long-term cumulative effects.
Geochemically, the rare earth mineralization in the nepheline syenites is found in the highly evolved intrusions. Our study showed that REEs are formed due to magmatic and hydrothermal processes. The primary magmatic mineralization was overprinted by late magmatic to hydrothermal fluids rich in U, Th, HFSE, and REE. It further enriched and remobilized the process of original mineralization during multiple metasomatic circles and formed as secondary phases.

Author Contributions

Conceptualization, H.E.-G. and M.E.-H.; methodology, H.E.-G.; software, H.E.-G.; validation, M.E.-H.; formal analysis, H.E.-G.; investigation, H.E.-G. and M.E.-H.; resources, M.E.-H.; data curation, H.E.-G.; writing—original draft preparation, H.E.-G.; writing—review and editing, M.E.-H., visualization, M.E.-H.; supervision, H.E.-G.; project administration, M.E.-H.; funding acquisition, M.E.-H.

Funding

This research was funded by the Ministry of Higher Education, grant number ASP-015 and the APC was funded by Hany El-Gamal.

Acknowledgments

The authors acknowledge the support of the Physics and Geology Departments, Assiut University, Egypt, for using all the possible facilities when completing this research. We acknowledge the helpful and useful reviews from anonymous reviewers for editing the final text.

Conflicts of Interest

The authors declare no conflict of interest.

References

  1. UNSCEAR. Sources and Effects of Ionizing Radiation. Report to General Assembly, with Scientific; UNSCEAR: New York, NY, USA, 2000. [Google Scholar]
  2. UNSCEAR. United Nations Scientific Committee on the Effect of Atomic Radiation. Sources and Effects of Ionizing Radiation; UNSCEAR: New York, NY, USA, 1993. [Google Scholar]
  3. Bollhoefer, A.; Storm, J.; Martin, P.; Tims, S. Geographic variability in radon exhalation at a rehabilitated uranium mine in the northern territory, Australia. Environ. Monit. Assess. 2006, 114, 313–330. [Google Scholar] [CrossRef] [PubMed]
  4. El-Bahi, S.M. Assessment of radioactivity and radon exhalation rate in Egyptian cement. Health Phys. 2004, 86, 517–522. [Google Scholar] [CrossRef] [PubMed]
  5. Omeje, M.; Adewoyin, O.O.; Emmanuel, S.J.; Ehi-Eromosele, C.O.; Emenike, C.P.; Usikalu, M.R.; Akinwumi, S.A.; Zaidi, E.; Mohammad, A.S. Natural radioactivity concentrations of 226Ra, 232Th and 40K in commercial building materials and their lifetime cancer risk assessment in dwellers. Hum. Ecol. Risk Assess. Int. J. 2018. [Google Scholar] [CrossRef]
  6. Mason, B.; Moore, C. Principles of Geochemistry; Wiley: New York, NY, USA, 1982. [Google Scholar]
  7. Rudnick, R.L.; Gao, S. The Composition of the Continental Crust. In Treatise on Geochemistry; Holland, H.D., Turekian, K.K., Eds.; Elsevier-Pergamon: Oxford, UK, 2003; Volume 3. [Google Scholar]
  8. Me’nager, M.; Heath, M.; Ivanovich, M.; Montjotin, C.; Barillon, C.; Camp, J.; Hasler, S.E. Migration of uranium from uranium mineralised fractures into the rock matrix in granite: Implications for radionuclide transport around a radioactive waste repository. In Proceedings of the 4th International Conference of Chemistry and Migration Behaviour of Actinides and Fission Products in the Geosphere (Migration, 1993), Charleston, SC, USA, 12–17 December 1993; pp. 47–83. [Google Scholar]
  9. Tzortzis, M.; Tsertos, H.; Christofides, S.; Christodoulides, G. Gamma-ray measurements of naturally occurring radioactive samples from Cyprus characteristic geological rocks. Radiat. Meas. 2003, 37, 221–229. [Google Scholar] [CrossRef] [Green Version]
  10. Zhou, B.; Li, Z.; Zhao, Y.; Zhang, C.; Wei, Y. Rare Earth Elements Supply vs. Clean Energy Technologies: New Problems to Solve. Gospod. Surowcami Min. 2016, 32, 29–44. [Google Scholar] [CrossRef]
  11. Zhou, B.; Li, Z.; Chen, C. Global Potential of Rare Earth Resources and Rare Earth Demand from Clean Technologies. Minerals 2017, 7, 203. [Google Scholar] [CrossRef]
  12. U.S. Geological Survey. The Rare-Earth Elements—Vital to Modern Technologies and Lifestyles. Available online: https://pubs.usgs.gov/fs/2014/3078/pdf/fs2014-3078.pdf (accessed on 9 June 2017).
  13. Landoll, J.D.; Foland, K.A.; Henderson, C.M.B. Nd isotopes demonstrate the role of contamination in the formation of coexisting quartz and nephelinesyenites at the Abu Khruq complex, Egypt. Contrib. Miner. Petrol. 1994, 117, 305–329. [Google Scholar] [CrossRef]
  14. El Ramly, M.F.; Hussein, A.A.A. The ring complexes of the eastern desert of Egypt. J. Afa. Earth. Sci. 1985, 3, 77–82. [Google Scholar] [CrossRef]
  15. Obeid, M.A.; Lalonde, A.E. The Geochemistry and Petrogenesis of the Late Cretaceous Abu Khuruq Alkaline Complex, Eastern Desert Egypt. Can. Miner. 2013, 51, 537–558. [Google Scholar] [CrossRef]
  16. Canberra. Germanium Detectors User’s Manual; Canberra Industries, Inc.: Meriden, CT, USA, 2013. [Google Scholar]
  17. Zunic, Z.S.; Kobal, I.; Vaupotic, J.; Kozak, K.; Mazur, J.; Birovl-jev, A.; Janik, M.; Čelikovic, I.; Ujic, P.; Demajo, A.; et al. High natural radia- tion exposure in radon spa areas: A detailed field investigation in NiˇskaBanja (Balkan region). J. Environ. Radioactiv. 2006, 89, 249–260. [Google Scholar] [CrossRef]
  18. El-Gamal, H.; Sidique, E.; El-Haddad, M.; El-Azab Farid, M. Assessment of the natural radioactivity and radiological hazards in granites of Mueilha area (South Eastern Desert, Egypt). Environ. Earth Sci. 2018, 77, 691. [Google Scholar] [CrossRef]
  19. ICRP (Internal Commission on Radiological Protection). Protection against Rn-222 at home and at work. ICRP publication 65. Ann. ICRP 1994, 23, 1–48. [Google Scholar]
  20. Xinwei, L.; Lingqing, W.; Xiaodan, J.; Leipeng, Y.; Gelian, D. Specific activity and hazards of Archeozoic-Cambrian rock samples collected from the Weibei area of Shaanxi, China. Radiat. Prot. Dosimetry 2006, 118, 352–359. [Google Scholar] [CrossRef] [PubMed]
  21. UNSCEAR. Sources, Effects and Risks of Ionizing Radiation; Annex, B., Ed.; UNSCEAR: New York, NY, USA, 1988. [Google Scholar]
  22. Beretka, J.; Mathew, P. Natural radioactivity of Australian building materials, industrial wastes and by-products. Health Phys. 1985, 48, 87–95. [Google Scholar] [CrossRef] [PubMed]
  23. EC (European Commission). Radiological Protection Principles Concerning the Natural Radioactivityof Building Materials. Radiation Protection 112. Directorate General Environment, NuclearSafety and Civil Protection; EC: Geneva, Switzerland, 1999. [Google Scholar]
  24. Papadopoulos, A.; Christofides, G.; Koroneos, A.; Papadopoulou, L.; Papastefanou, C.; Stoulos, S. Natural radioactivity and radiation index of the major plutonic bodies in Greece. J. Environ. Radioactiv. 2013, 124, 227–238. [Google Scholar] [CrossRef] [PubMed]
  25. Aykamış, A.Ş.; Turhan, Ş.; Aysun, U.F.; Baykan, U.N.; Kılıç, A.M. Natural radioactivity, radon exhalation rates and indoor radon concentration of some granite samples used as construction material in Turkey. Radiat. Prot. Dosim. 2013, 157, 105–111. [Google Scholar] [CrossRef] [PubMed]
  26. Righi, S.; Bruzzi, L. Natural radioactivity and radon exhalation in building materials used in Italian dwellings. J. Environ. Radioactiv. 2006, 88, 158–170. [Google Scholar] [CrossRef] [PubMed]
  27. Ravisankar, R.; Raghu, Y.; Chandrasekaran, A.; Gandhi, M.S.; Vijayagopal, P.; Venkatraman, B. Determination of natural radioactivity and the associated radiation hazards in building materials used in Polur, Tiruvannamalai District, Tamilnadu, India using gamma ray spectrometry with statistical approach. J. Geochem. Explor. 2016, 163, 41–52. [Google Scholar] [CrossRef]
  28. Nordic. Naturally Occurring Radiation in the Nordic Countries-Recommendations. 2000. Available online: https://www.gr.is/wp-content/media/2013/07/NaturallyOccurringRadioactivity.pdf (accessed on 18 July 2019).
  29. Richardson, D.G.; Birkett, T.C. Peralkaline rock-associated rare metals. In The Geology of North America; Eckstrand, O.R., Sinclair, W.D., Thorpe, R.I., Eds.; Geological Society of America: Boulder, CO, USA, 1996; pp. 523–540. [Google Scholar]
  30. Dostal, J. Rare Earth Element Deposits of Alkaline Igneous Rocks. Resources 2017, 6, 34. [Google Scholar] [CrossRef]
  31. Sun, S.S.; McDonough, W.F. Chemical and isotopic systematics of oceanic basalts: Implications for mantle composition and processes. Geol. Soc. Lond. Spec. Publ. 1989, 42, 313–345. [Google Scholar] [CrossRef]
  32. Laveuf, C.; Cornu, S. A review on the potentiality of rare earth elements to trace pedogenetic processes. Geoderma 2009, 154, 1–12. [Google Scholar] [CrossRef]
  33. Pilet, S.; Baker, M.B.; Stolper, E.M. Metasomatized lithosphere and the origin of alkaline lavas. Science 2008, 320, 916–919. [Google Scholar] [CrossRef] [PubMed]
  34. Markl, G.; Marks, M.; Schwinn, G.; Sommer, H. Phase equilibrium constraints on intensive crystallization parameters of the Ilmaussaq Complex, South Greenland. J. Petrol. 2001, 42, 2231–2258. [Google Scholar] [CrossRef]
  35. Halter, W.; Webster, J.D. The magmatic to hydrothermal transition and its bearing on ore-forming systems. Chem. Geol. 2004, 210, 1–6. [Google Scholar] [CrossRef]
  36. Şükrü, K.; Ali, S.; Okay, Ç. Major and rare earth element contents in sedimentary rocks of the Haymana formation, Ankara, Turkey. Energy Sources Part A Recovery Util. Environ. Eff. 2016, 38, 1918–1928. [Google Scholar] [CrossRef]
  37. Noack, C.W.; Jain, J.C.; Stegmeier, J.; Hakala, J.A.; Karamalidis, A.K. Rare earth element geochemistry of outcrop and core samples from the Marcellus shale. Geochem. Trans. 2015, 16, 6. [Google Scholar] [CrossRef] [PubMed]
  38. Cunha, C.S.M.; da Silva, Y.J.A.B.; Escobar, M.E.O.; do Nascimento, C.W.A. Spatial variability and geochemistry of rare earth elements in soils from the largest uranium–phosphate deposit of Brazil. Environ. Geochem. Health 2018, 40, 1629–1643. [Google Scholar] [CrossRef] [PubMed]
Figure 1. (A) Geological map of the Abu Khuruq area location, south Eastern Desert, Egypt; (B) A detailed geological map of the Abu Khuruq ring complex [13].
Symmetry 11 01041 g001
Figure 2. Activity concentrations of 226Ra, 232Th, and 40K in Bq kg−1 with their world reference.
Symmetry 11 01041 g002
Figure 3. Contour maps for the activity concentration of the examined radioisotopes 226Ra (a), 232Th (b), 40K (c) and 222Rn (d). (a) 226Ra concentration (Bq kg−1); (b) 232Th concentration (Bq kg−1); (c) 40K concentration (Bq kg−1); (d) 222Rn concentration (Bq m−3).
Symmetry 11 01041 g003
Figure 4. The relation between radium and radon concentrations.
Symmetry 11 01041 g004
Figure 5. The chondrite normalized REEs of the investigated rocks.
Symmetry 11 01041 g005
Table 1. The radium equivalent (Raeq), absorbed dose rates (DR), annual effective dose rates (AEDR), external hazard index (Hex), internal hazard index (Hin) and alpha and gamma indices (Iα and Iγ) of the rocks of Abu Khuruq.
Sample CodeRaeq (Bq kg−1)DR (nGy h−1)AEDR (mSv y−1)Hex (Bq kg−1)Hin (Bq kg−1)Iα Iγ
AB2B10.944.830.020.030.040.020.04
AB7B37.6717.710.090.100.130.050.14
AB1085.1742.030.210.230.260.060.34
AB12B294.57126.520.620.791.100.561.01
AB12C165.1577.710.380.450.540.170.62
AB15A352.92158.880.780.951.190.451.28
AB15F1085.62460.832.262.933.801.613.75
AB17B260.59121.510.590.700.910.380.97
AB18A246.83113.140.550.670.820.290.91
AB18B226.56103.630.510.610.760.280.83
AB20C157.8875.720.370.430.500.140.61
AB21263.99118.540.580.710.920.390.95
AB25B606.94259.361.271.642.291.192.09
AB31B63.5032.880.160.170.180.030.26
AB7A342.54153.320.750.921.190.491.24
AB31291.65131.450.640.790.990.371.06
AB29A228.5998.580.480.620.840.420.79
AB29B19.079.0370.040.050.060.020.07
AB33B90.0945.960.220.240.270.050.37
AB28D207.6388.540.430.560.750.350.72
Min.10.944.830.020.030.040.020.04
Max.1085.62460.832.262.933.801.613.75
Mean251.89112.010.550.680.880.370.90
Table 2. Rare earth elements concentrations (ppm) for the alkaline rocks of Abu Khuruq.
Sample No.CeEuGdLaNdPrSmTbTmYbDyErLuHo∑LREE∑HREE∑REEsLREE/HREE
AB2B11.500.802.384.307.301.591.820.340.221.111.981.280.180.3829.695.4935.185.41
AB7B48.401.935.0919.6029.706.595.680.620.161.283.321.490.140.57116.997.58124.5715.43
AB10125.506.0317.4550.7081.6017.5517.852.190.563.1511.754.920.412.15316.6825.13341.8112.60
AB12B179.502.339.2990.7069.0019.5511.751.400.583.588.364.170.481.60382.1220.17402.2918.94
AB12C126.501.436.9560.0053.0014.408.330.950.342.685.172.600.450.93270.6113.12283.7320.62
AB15A177.504.2616.3078.3086.8021.8017.202.331.066.6113.757.470.982.61402.1634.81436.9711.55
AB15F478.001.9428.50254.00170.0048.9030.104.322.0312.1524.8014.351.674.821011.4464.141075.5815.76
AB17B41.900.713.2019.4016.604.753.600.530.241.583.381.810.200.6190.168.3598.5110.79
AB18A146.004.8211.8572.7065.9016.8512.551.760.735.2810.105.690.761.90330.6726.22356.8912.61
AB18B190.004.0716.1590.1084.8022.4016.702.280.946.0812.656.890.962.37424.2232.17456.3913.187
AB20C110.502.538.2552.7052.3013.659.731.280.473.166.563.530.511.24249.6616.75266.4114.90
AB21162.503.7512.5070.4067.8017.7013.152.010.825.4310.906.000.742.23347.8028.13375.9312.36
AB25B326.004.2721.90164.00124.5034.6023.103.351.8411.4519.6512.301.634.02698.3754.24752.6112.87
AB31B19.401.553.538.7512.202.633.160.480.211.493.231.660.230.6351.217.9259.136.47
AB7A177.503.0614.2088.4080.5020.9016.652.281.036.8012.607.000.952.50401.2133.16434.3712.09
AB31157.002.479.1980.0061.3017.1511.751.460.463.037.823.850.411.48338.8618.51357.3718.31
AB29A18.901.373.019.5012.502.633.120.470.150.932.601.200.130.4551.035.9356.968.60
AB29B37.901.854.1318.9019.804.624.440.540.171.103.131.420.110.5891.647.0598.6912.99
AB33B218.004.0314.50118.0090.2023.5016.202.360.935.8312.806.330.882.42484.4331.55515.9815.35
AB28D126.001.418.7267.3051.2013.7010.101.420.674.308.164.740.611.65278.4321.55299.9812.92
Average143.932.7310.8570.8961.8516.2711.851.620.684.359.144.930.621.76318.3723.10341.4713.78
Table 3. Major oxides in the investigated rocks in %.
Sample CodeSiO2Al2O3Fe2O3CaOMgONa2OK2OCr2O3TiO2MnOP2O5SrOBaO
AB2B46.9019.109.228.858.913.840.430.010.700.110.100.040.01
AB7B49.5013.3510.109.368.673.070.970.071.530.140.330.070.05
AB1036.0010.5219.259.889.304.470.410.015.230.302.760.060.02
AB12B57.7018.405.642.390.727.494.270.010.630.140.180.040.07
AB12C58.0019.005.411.920.328.614.370.010.350.140.120.040.06
AB15A63.8012.109.900.930.126.784.190.010.620.300.060.010.03
AB15F54.9019.556.321.250.268.904.250.010.140.290.060.010.01
AB17B77.7013.250.940.190.143.563.340.010.070.030.020.010.07
AB18A63.5015.906.062.110.466.083.810.010.620.160.140.020.14
AB18B64.0014.603.523.500.425.614.950.010.550.120.050.010.06
AB20C61.5013.4010.051.441.256.754.560.010.540.330.110.010.03
AB2163.7013.858.862.080.185.384.020.010.630.180.110.010.07
AB25B70.5010.407.051.560.164.264.080.010.370.120.020.010.01
AB31B48.9519.458.599.825.443.860.430.031.360.120.190.060.03
AB7A67.9013.454.441.950.014.795.020.010.410.070.020.010.01
AB3157.6018.306.222.990.947.014.110.010.760.140.210.050.09
AB29A45.0017.5512.3511.904.393.040.320.014.070.140.100.070.01
AB29B49.0021.208.9910.303.293.950.550.011.820.100.450.090.03
AB33B63.1015.008.032.440.336.183.880.010.580.210.100.010.09
AB28D42.1413.0220.9515.724.720.000.000.002.100.350.000.000.00
Min36.0010.400.940.190.013.040.320.010.070.070.020.010.01
Max77.7021.2020.9515.729.308.904.950.075.320.352.760.090.14
Average57.0515.598.815.292.705.252.870.021.290.180.360.030.05
STDEV11.823.515.515.073.472.231.930.021.560.090.780.030.04
Table 4. Pearson’s correlation coefficients between REEs.
REECeEuGdLaNdPrSmTbTmYbDyErLuHo
Ce1
Eu0.371
Gd0.930.621
La0.990.310.91
Nd0.970.530.980.951
Pr0.990.450.950.980.991
Sm0.940.60.990.920.990.971
Tb0.950.570.990.930.980.970.991
Tm0.950.430.940.930.940.950.930.961
Yb0.940.450.930.930.930.940.930.960.991
Dy0.960.550.980.940.980.970.980.990.970.971
Er0.950.470.960.940.960.960.950.980.990.990.981
Lu0.930.460.920.920.930.930.920.950.980.990.960.981
Ho0.950.530.980.940.970.970.980.990.980.970.990.990.961
Table 5. Pearson’s correlation coefficients between REEs and major oxides.
OxidesSiO2Al2O3Fe2O3CaOMgONa2OK2OCr2O3TiO2MnOP2O5SrOBaOLREEHREETREE
SiO21
Al2O3−0.261
Fe2O3−0.78−0.271
CaO−0.850.140.751
MgO−0.810.020.630.791
Na2O0.350.29−0.52−0.75−0.551
K2O0.81−0.16−0.67−0.93−0.860.731
Cr2O3−0.15−0.06−0.030.180.45−0.16−0.241
TiO2−0.76−0.140.750.710.66−0.45−0.700.041
MnO−0.36−0.300.680.130.090.09−0.05−0.190.261
P2O5−0.53−0.270.520.290.54−0.07−0.370.030.740.281
SrO−0.620.480.190.550.59−0.17−0.620.420.56−0.290.391
BaO0.410.09−0.45−0.46−0.390.380.410.05−0.33−0.23−0.11−0.081
LREE0.31−0.16−0.16−0.51−0.510.520.59−0.24−0.330.35−0.07−0.54−0.021
HREE0.34−0.31−0.12−0.48−0.490.400.55−0.27−0.290.34−0.05−0.60−0.100.961
TREE0.31−0.17−0.16−0.51−0.510.520.59−0.25−0.330.35−0.07−0.55−0.030.990.971

