Article

Ranking of Normality Tests: An Appraisal through Skewed Alternative Space

Department of Economics, National University of Sciences & Technology, Islamabad 44000, Pakistan
Symmetry 2019, 11(7), 872; https://doi.org/10.3390/sym11070872
Submission received: 14 May 2019 / Revised: 9 June 2019 / Accepted: 18 June 2019 / Published: 3 July 2019

Abstract

:
In social and health sciences, many statistical procedures and estimation techniques rely on the underlying distributional assumption of normality of the data. Non-normality may lead to incorrect statistical inferences. This study evaluates the performance of selected normality tests within the stringency framework for skewed alternative space. The stringency concept allows us to rank the tests uniquely. The Bonett and Seier test (Tw) turns out to represent the best statistics for slightly skewed alternatives and the Anderson–Darling (AD); Chen–Shapiro (CS); Shapiro–Wilk (W); and Bispo, Marques, and Pestana (BCMR) statistics are the best choices for moderately skewed alternative distributions. The maximum loss of Jarque–Bera (JB) and its robust form (RJB), in terms of deviations from the power envelope, is greater than 50%, even for large sample sizes, which makes them less attractive in testing the hypothesis of normality against the moderately skewed alternatives. On balance, all selected normality tests except Tw and Daniele Coin’s COIN-test performed exceptionally well against the highly skewed alternative space.

1. Introduction

Departures from normality can be measured in a variety of ways; however, the most common measures are skewness and kurtosis in this regard. Skewness refers to the symmetry of a distribution and kurtosis refers to the flatness or ‘peakedness’ of a distribution. These two statistics have been widely used to differentiate between distributions. A normal distribution has skewness and kurtosis values of 0 and 3, respectively. If the values of skewness and kurtosis significantly deviate from 0 and 3, it is assumed that the data in hand is not normally distributed. Macroeconomists are always concerned with whether the economic variables exhibit similar behavior during recessions and booms. Delong and Summers [1] applied the skewness measure to GDP, the unemployment rate, and industrial production to study whether the business cycles were symmetric. The experimental data sets generated in clinical chemistry require the use of skewness and kurtosis statistics to determine their shape and normality [2]. Blanca, Arnau, López-Montiel, Bono, and Bendayan [3] analyzed the shape of 693 real data distributions by including the measures of cognitive ability and other psychological variables in terms of skewness and kurtosis. Only 5.5% of the distributions were close to the normality assumption.
Keeping this in mind, the literature has produced few normality tests which are based on skewness and kurtosis [4,5,6,7]. Other than the moment based tests, normality literature also provides tests based on correlation and regression [8,9,10], empirical distribution [11,12,13], and special tests [14,15].
This study is devoted to analyzing the respective impact of change in skewness and kurtosis on the power of normality tests. Normality tests are developed based on the different characteristics of a normal distribution and the power of normality statistics varies, depending on the nature of non-normality [4]. Therefore, comparisons of normality tests yield ambiguous results since all normality statistics critically depend on alternative distributions which cannot be specified [16]. Fifteen normality tests are selected for a comparison of power based on the stringency concept proposed by Islam [16]. The stringency concept allows you to rank the normality tests in a unique fashion. Neyman–Pearson (NP) tests are computed against each alternative distribution to construct the power curve. Relative efficiencies of all the tests in question are computed as the deviations of each test from the power curve. The best test is defined as the test displaying the minimum deviation from the power curve among the maximum deviations of all the tests.

2. Stringency Framework

Islam [16] proposed a new framework to evaluate the performance of normality tests based on the stringency concept introduced by Lehmann and Stein [17].
Let y = ( y 1 ,   y 2 ,   y 3 ,   ,   y n ) be the observations with the density function f ( y , φ ) , where φ belongs to the parameter space . A function h ( y ) which takes the values {0, 1} is called a hypothesis test and belongs to H α , so all such functions are set with α -level of significance.
For any test of size α , maximum achievable power is defined as
M a x h H α β ( h ,   φ ) = S u p [ P ( h ( y ) = 1 | φ ϵ a ) ]
where β ( h ,   φ ) is the power of h ( y ) and a represents the alternative parameter space. Different values of φ yield different optimal test statistics, which provide the power envelope. The relative power performance of a test, h H α , is measured by its deviation from the power envelope as
D ( h ( y ) ,   φ ) = M a x h H α β ( h ,   φ ) β ( h ,   φ )
A test is said to be most stringent if it minimizes the maximum deviation from the power envelope. The stringency of a test is defined as the maximum deviation from the power envelope when evaluated over the entire alternative space.
S ( h ( y ) ) = S u p φ ϵ a D ( h ( y ) ,   φ )
Only the uniformly most powerful test can have zero stringency, which is rarely found; however, slightly compromising on it can give us a test which is as good as the uniformly most powerful test [16]. Evaluating the normality tests based on their stringencies allows us to rank them in a unique manner and helps researchers to find the best test.

3. Tests and Alternative Distributions

Normality tests are based on different characteristics like the empirical distribution, moments, correlation, and regression, and based on special characteristics of the data distribution. Fifteen normality tests were selected (Table 1), which are the most representative of their respective class. The empirical cumulative distribution function (ECDF) class includes Zhang and Wu (Za, Zc), Anderson–Darling (AD), and Kolmogorov–Smirnov (KS) tests. The Jarque–Bera (JB), robust form of Jarque–Bera (RJB), Bowman–Shenton (K), and Bonett and Seier (Tw) test statistics represent the class of moments-based normality tests. The correlation and regression category is comprised of Shapiro–Wilk (W), Shapiro–Francia (Wsf), D’Agostino (D), Shapiro–Chen (CS), Coin (COIN), and Barrio et al. (BCMR) statistics. The Gel and Gastwirth (Rsj) statistic is a special test which focuses on detecting heavy tails and outliers of distributions. Some of our selected normality tests (e.g., Jarque–Bera, Kolmogorov–Smirnov, Anderson–Darling, Shapiro–Wilk, Shapiro–Francia etc.) are also available in popular software like MATLAB, STATA, SPSS, and EViews. Departures from normality (first and second order) depend on the skewness and kurtosis parameters. A mixture of t-distributions allows you to vary these two statistics in a wide range. It also covers the distributions used in the literature in terms of skewness and kurtosis (for details, see [16]).
This study uses a mixture of t-distributions as alternative distributional space (Appendix: Table A1). The alternative distributional space was generated by the following rule:
λ . t ( v 1   ,   μ 1 ) +   ( 1 λ ) . t ( v 2 ,   μ 2 )
where v 1   ,   v 2 ,   μ 1 ,   and   μ 2   are the degrees of freedom and the means of the respective t-distributions. We have divided our alternative space of distributions into the following three groups on the basis of skewness ( β 1 ) : (i) slightly skewed, (ii) moderately skewed, and (iii) highly skewed. In each group, skewness remained within the bounds and we allowed kurtosis to vary. The benchmark value for Group-I (symmetric distributions) was defined by the following [18], and other classes were defined relatively
Group   I :   | β 1 | 0.3 Group   II :   0.3 <   | β 1 |   1.5 Group   III :   | β 1 | > 1.5
Neyman–Pearson (NP) tests were computed against each alternative distribution in each group to construct the power curve. Relative efficiencies of all the tests in question were computed as the deviations of each test from the power curve. The best test was defined as the test displaying the minimum deviation from the power curve among the maximum deviations of all the tests.
Following Islam [16], I group alternative space into three categories based on the power of the NP test: FAR, INTERMEDIATE, and NEAR. The alternative distributions where the power of the NP test is between 90–100%, 40–90%, and 5–40% are categorized as the FAR, INTERMEDIATE, and NEAR group of alternatives, respectively.

4. Discussion of Results

Monte Carlo procedures were employed to investigate the powers of fifteen selected normality tests for sample sizes of 25, 50, and 75, at the 5% level of significance with 100,000 replications.

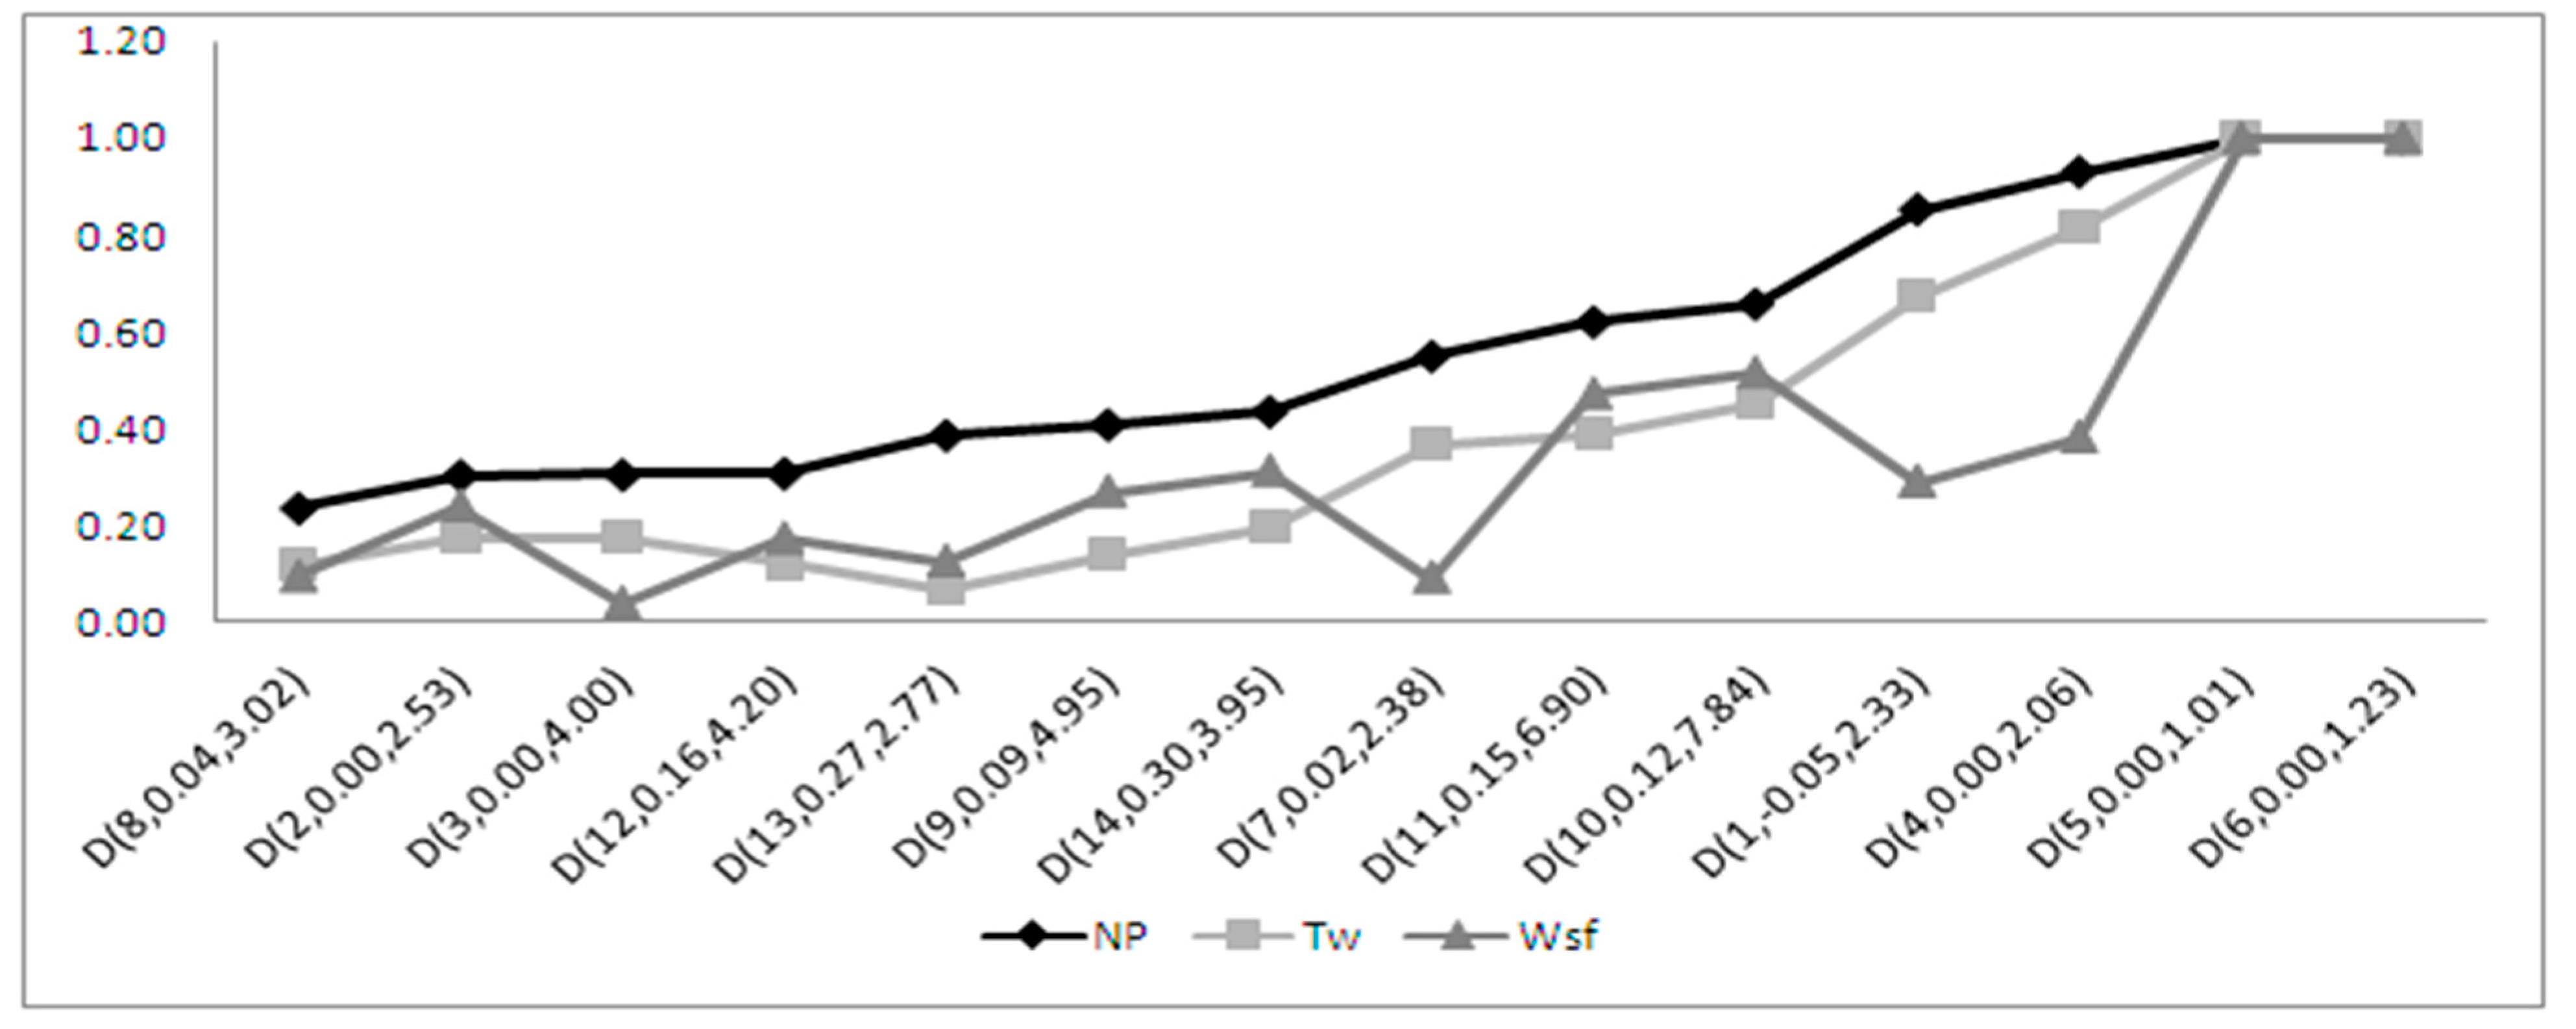
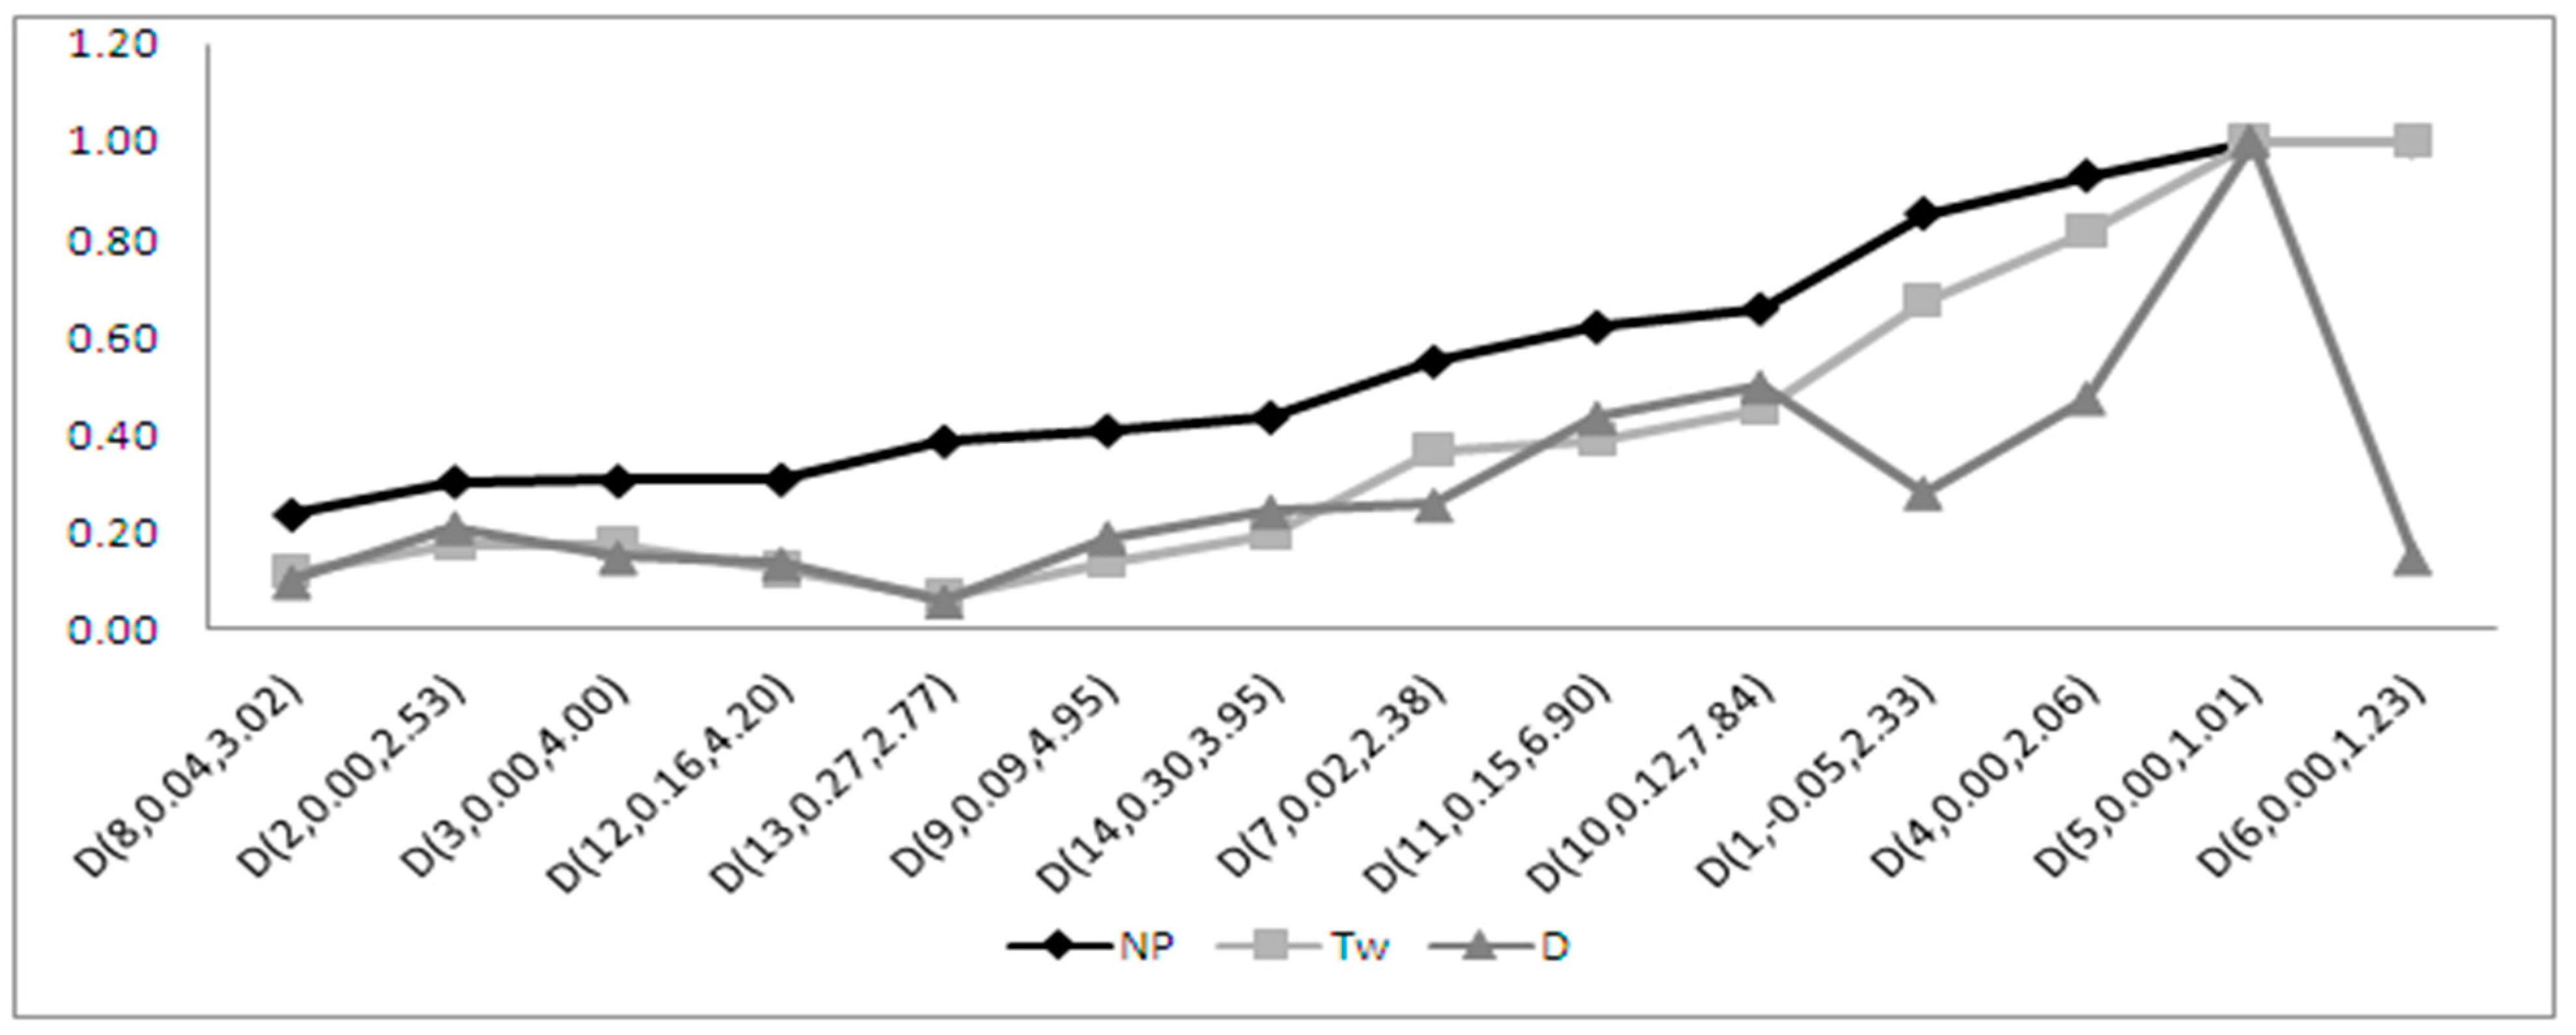
4.1. Slightly Skewed Alternatives

When considering all the selected normality tests, Tw is the best test against the slightly skewed alternatives (Figure A1, Figure A2, Figure A3, Figure A4, Figure A5, Figure A6, Figure A7, Figure A8, Figure A9 and Figure A10 and Table 2) for all sample sizes (n = 25, 50, 75), whereas the performance of JB and RJB tests is very poor, with an 80.5%–99.5% maximum loss of power.

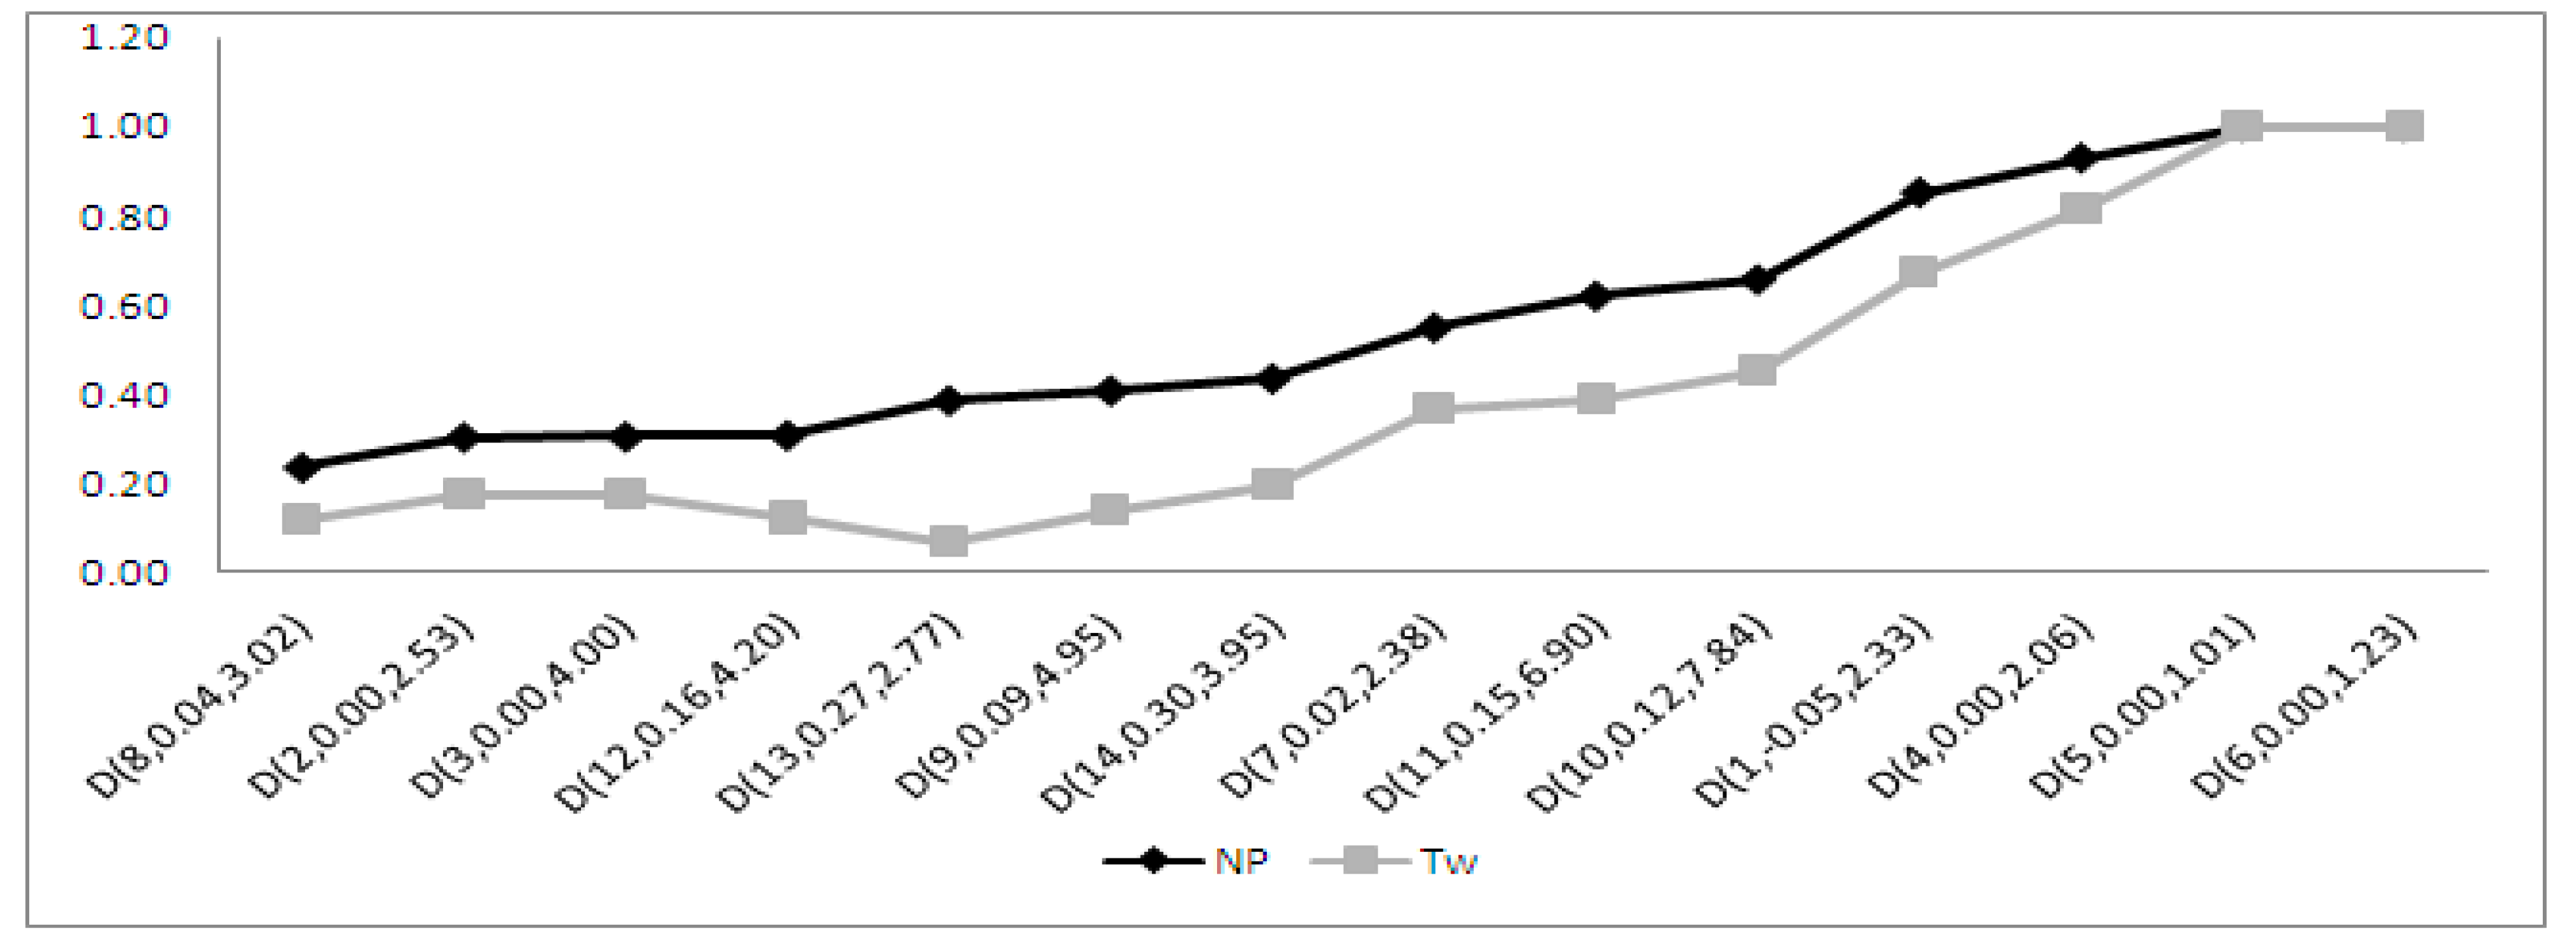
4.1.1. Performance of the Moments-Based Tests

Among the moments-based class of normality tests, Tw is the best test for all sample sizes for slightly skewed alternatives (Table 2 and Figure A1). The K2 test occupies the fourth (for n = 25, 50) and third (for n = 75) rank, with maximum power losses of 42.6%, 44.8%, and 44.7%, respectively (Figure A3).
For all sample sizes, the JB and RJB tests are the least favorable options in terms of their maximum deviations (gaps) from the power curve (Figure A2). The worst distributions for JB and RJB statistics belong to the symmetric and short-tailed class of alternatives (Figure A2 and Appendix Table A2). These results corroborate with the findings in [12,19,20]. To decide about the worst or best performance of a test, we need an invariant benchmark: a power envelope. The worst performances of JB, in the aforementioned studies, have been evaluated by using an arbitrary reference (e.g., W and AD); however, we computed the power curve by using the most powerful NP test, which yielded the exact deviations of the JB test from the power curve.

4.1.2. Performance of the Regression and Correlation Tests

When considering the regression and correlation-based group of normality tests, for small and large sample sizes (n = 25, 75), COIN, W, and BCMR are better choices for the slightly skewed alternatives. Overall, for slightly skewed distributions, COIN and W tests exhibit the same power properties (Figure A5 and Figure A6), whereas Wsf and D statistics do not match the standards set by other members of the group (Figure A7 and Figure A8), with maximum power losses of over 50% (Table 2). Overall, the CS outperforms its competitors in the said group, with maximum power loss ranges within 34.8%–39.8% for slightly skewed alternatives. This result strengthens the findings in [21].

4.1.3. Performance of the ECDF Tests

Among the ECDF class of normality tests, for slightly skewed alternatives, the AD statistic shares the second rank with COIN and CS, third rank with CS, and first rank with Tw and Rsj tests of normality for sample sizes of 25, 50, and 75, respectively (Table 2).
When considering all the selected normality tests for the slightly skewed alternative distributions, KS shares the third rank (maximum loss of power is 38.1%) with W and Zc and sixth rank (maximum loss of power is 49.9%) with Zc and BCMR for sample sizes of 25 and 50, respectively. For a sample size of 75, the KS test again holds the third rank with a 45.1% maximum loss of power, while Za and Zc tests hold the fourth rank with a maximum loss of powers slightly above 50% (Table 2). On balance, when considering the maximum deviations from the power envelope, KS has a slight edge over Za and Zc statistics. In terms of maximum deviations from the power envelope, Zc has a slight edge over Za, but it does not corroborate with the findings in [13] due to the absence of an invariant benchmark, the power envelope, in their comparison.

4.1.4. Performance of the Special Test

This category only includes the Rsj test of normality. The performance of the Rsj test increases with the increase in sample size for the slightly skewed alternatives. It holds the third, second, and first rank for sample sizes of 25, 50, and 75, respectively (Table 2). On balance, Rsj performed well (Figure A10), especially for medium (n = 50) to large (n = 75) sample sizes, against slightly skewed distributions.
Finally, when considering all normality tests for slightly skewed alternatives, Tw is the most stringent test, with Rsj, AD, and CS following closely behind, whereas RJB, JB, and D are the least favorable options.

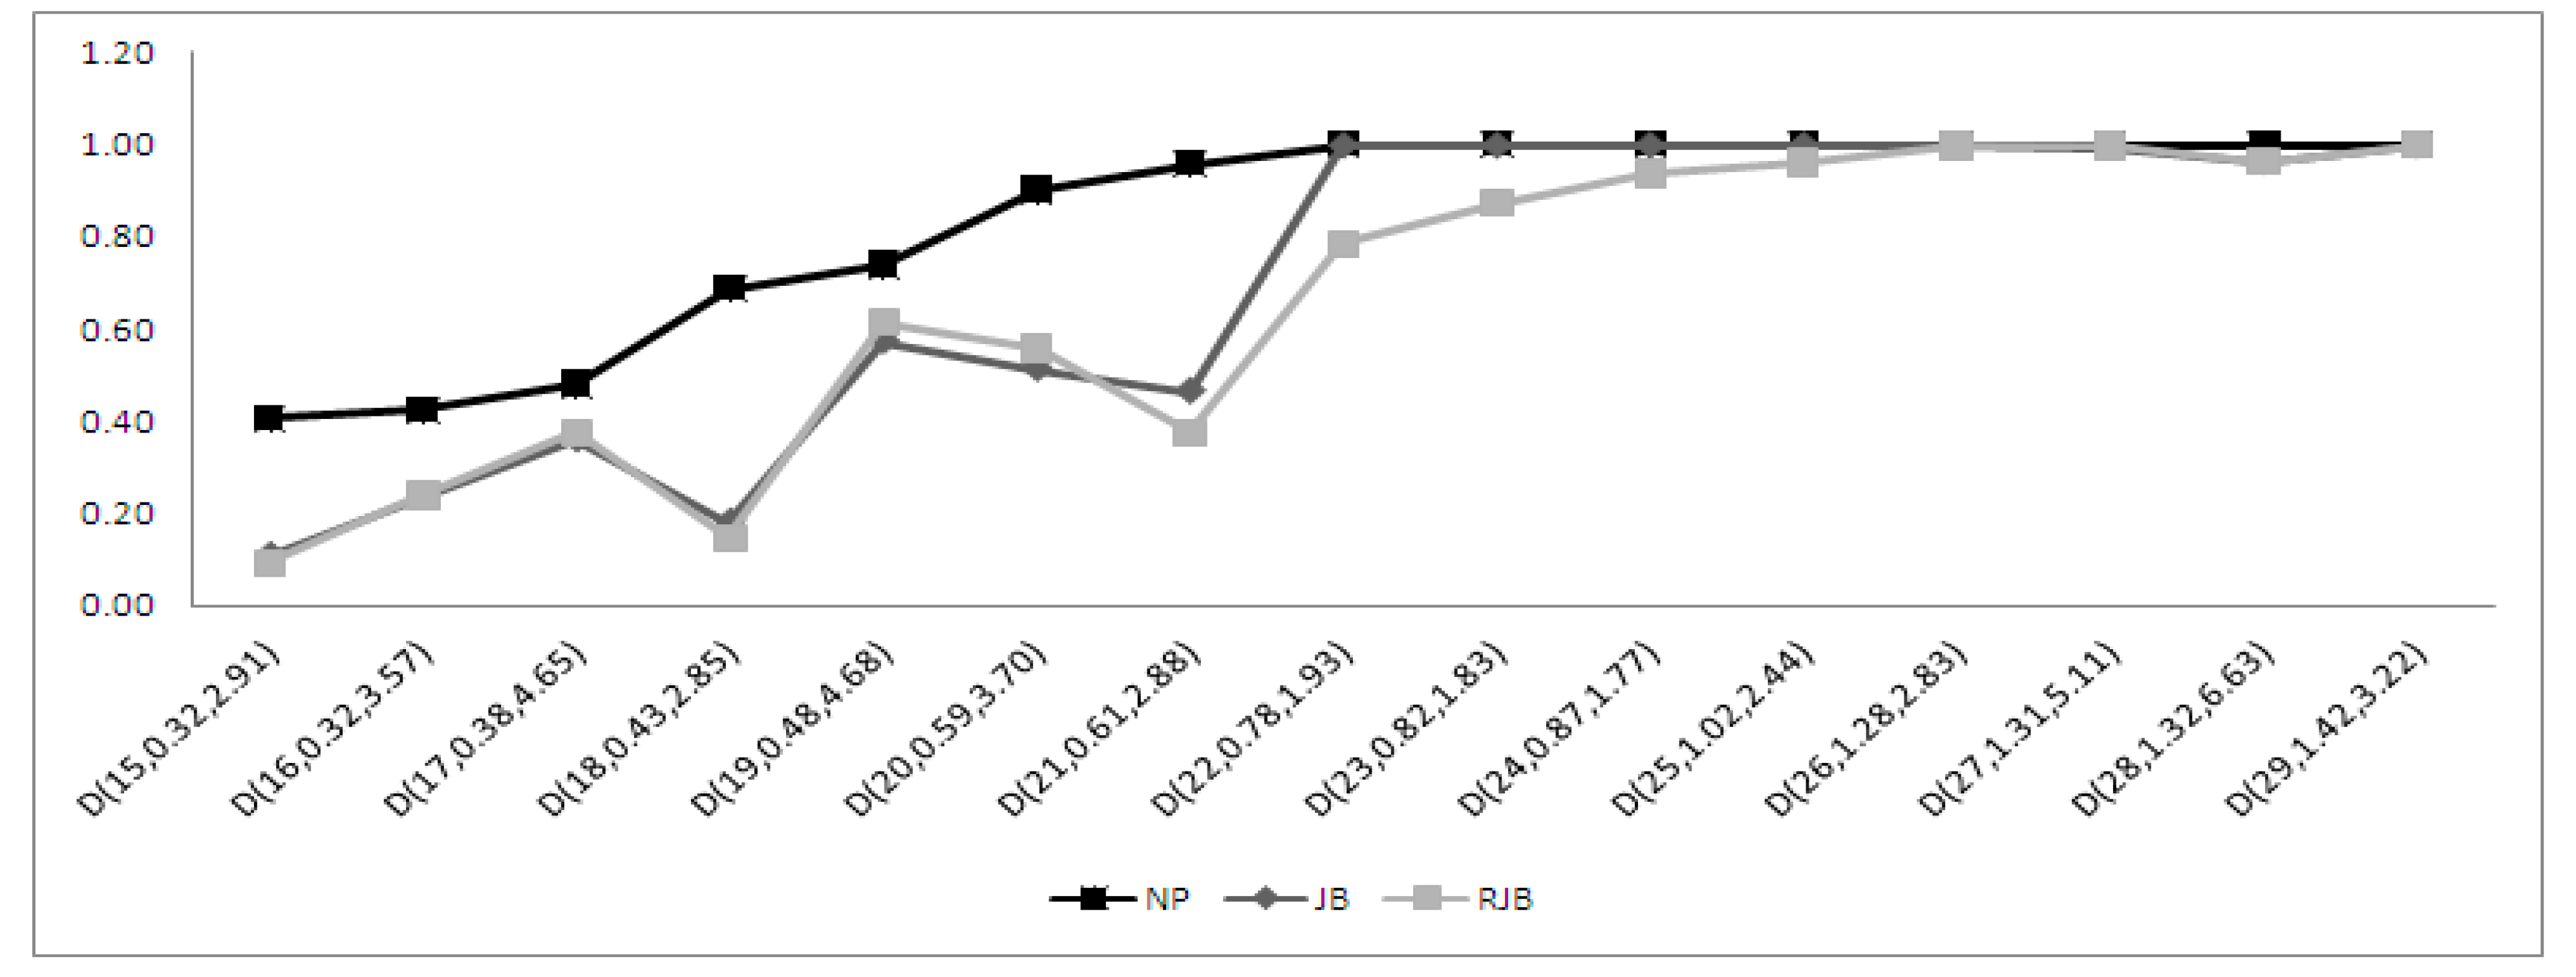
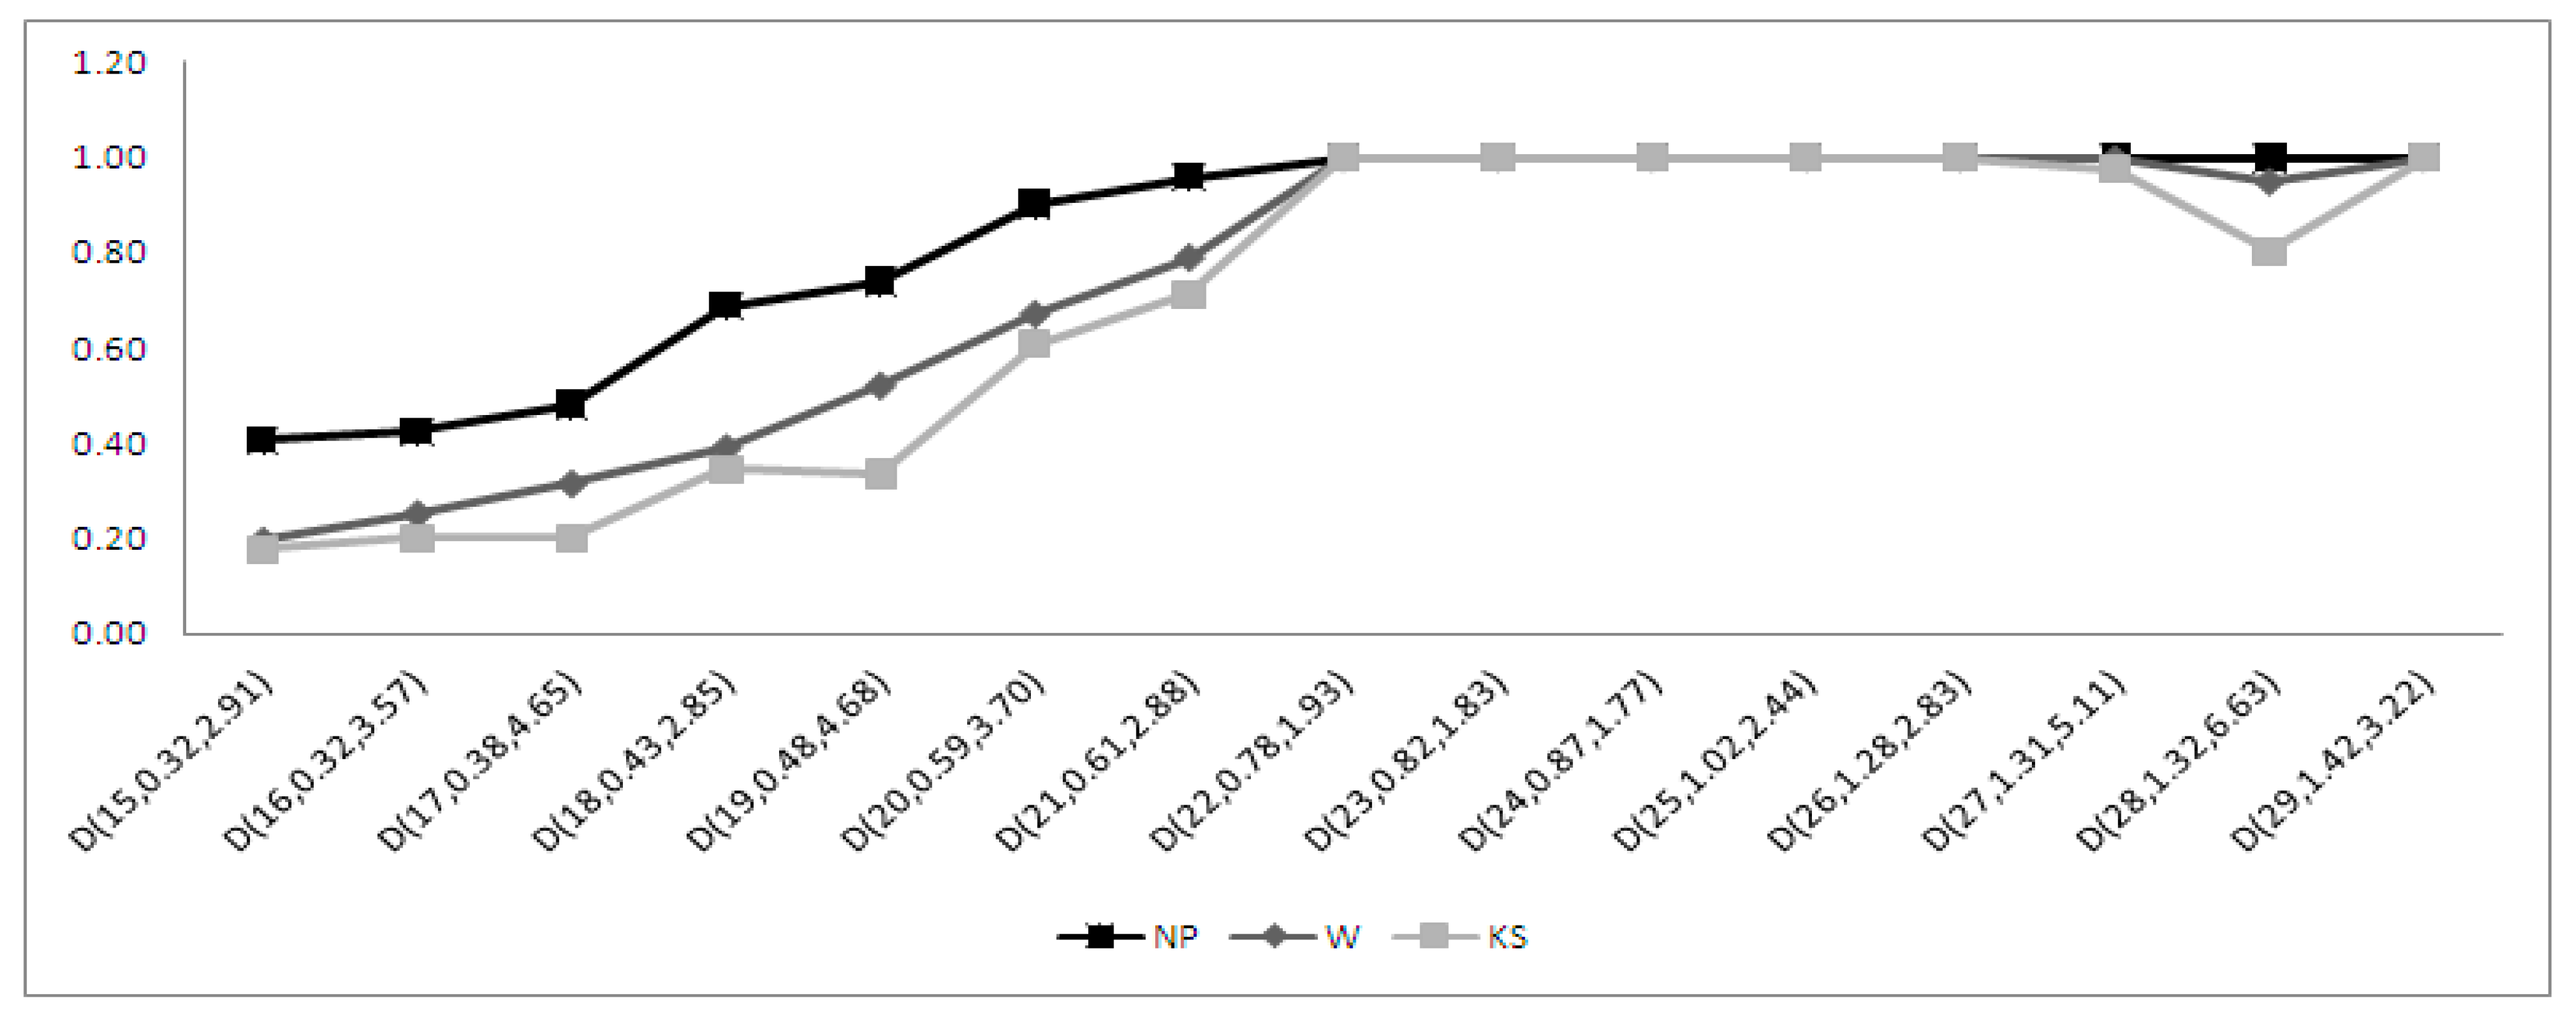
4.2. Moderately Skewed Alternatives

For moderately skewed alternatives, for a smaller sample size, CS, W, AD, and BCMR are the best choices and the COIN test is the least favorable option (Table 3). For a medium sample size, AD is ranked first and the COIN and Tw tests are at the bottom of the ranking table. For a larger sample size, AD, CS, W, and BCMR appear to be the best options, whereas the COIN and Tw tests are the worst options.

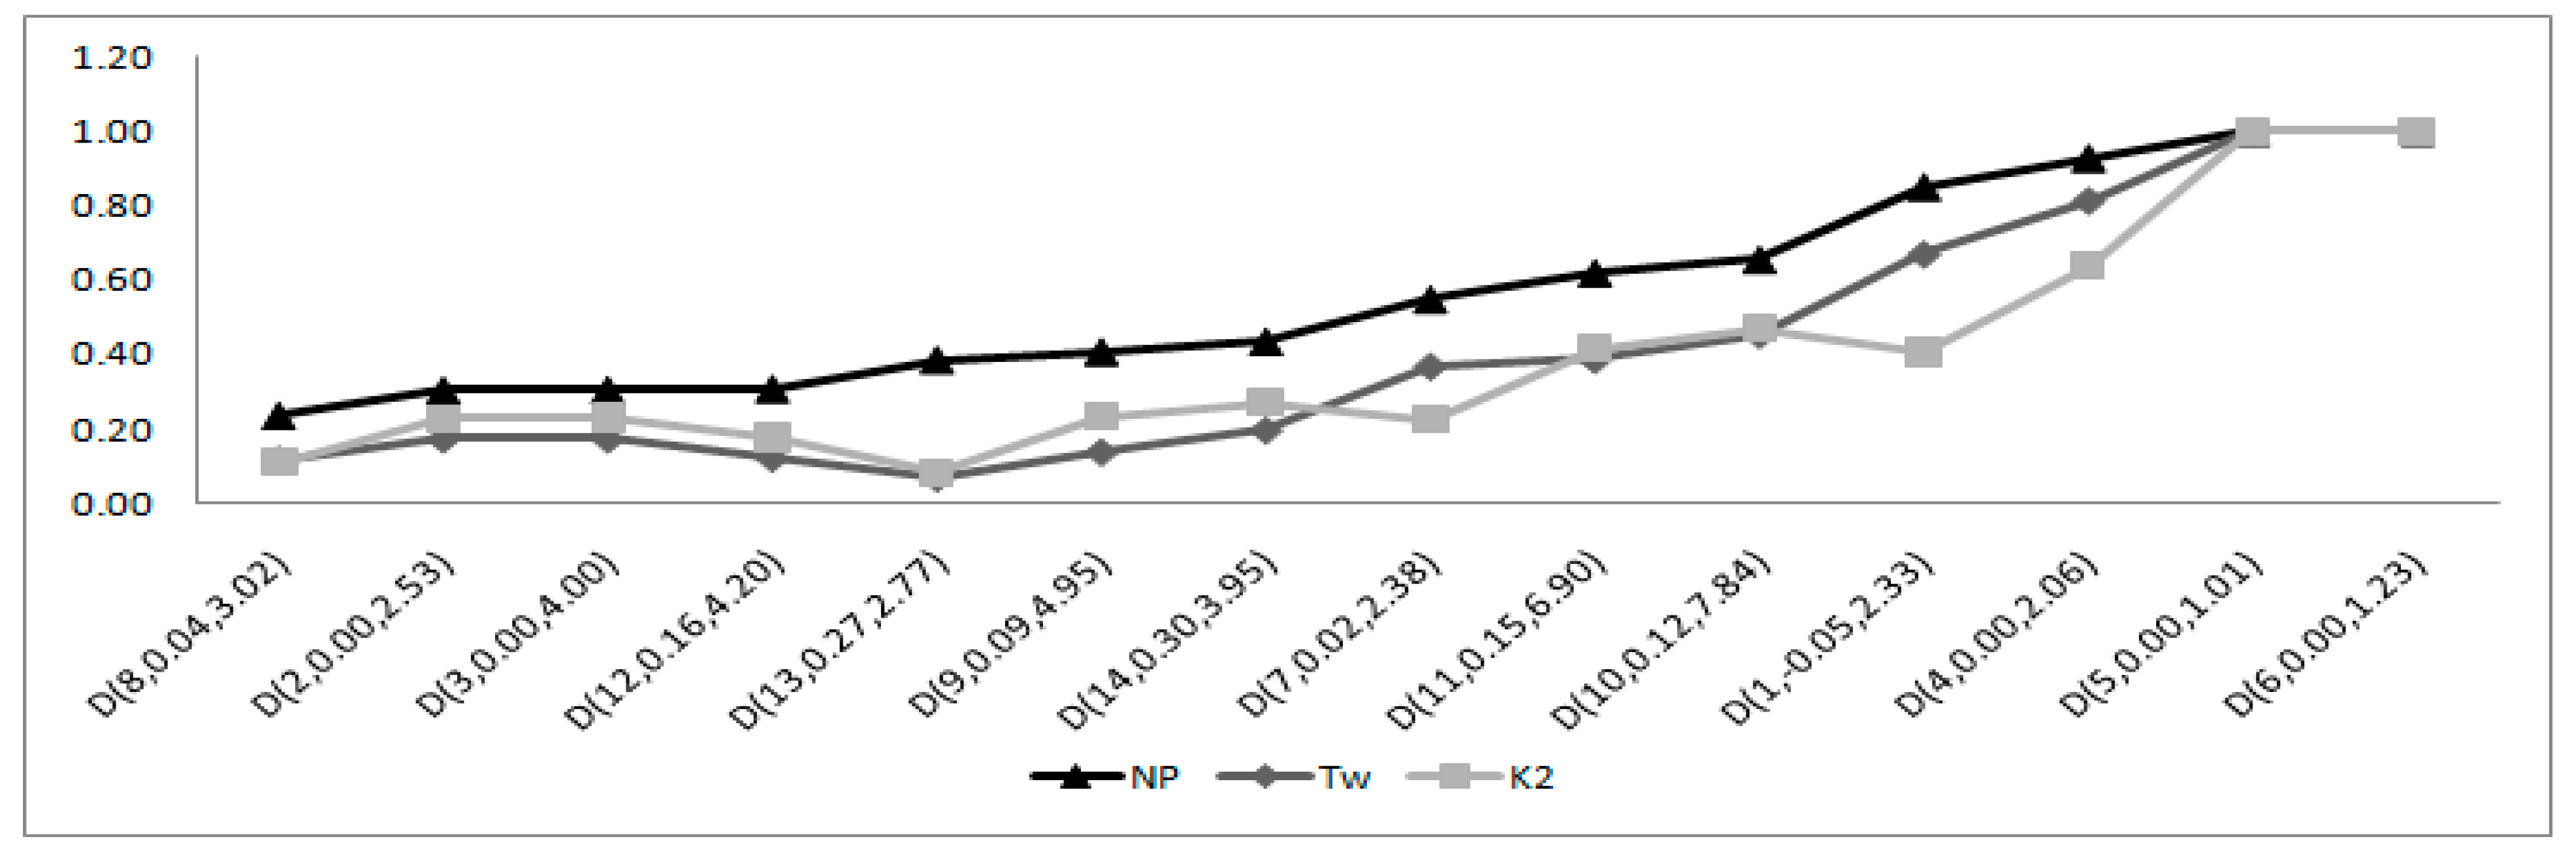
4.2.1. Performance of the Moments-Based Tests

In general, for moderately skewed alternatives, moments-based normality tests perform poorly for all sample sizes. For a smaller sample size, Bowman & Shenton [22] K2-test occupies the fourth rank (with 46.7% maximum power loss) by outperforming the other group members. For a medium sample size, JB and RJB (with power losses above 50.0%) move to fourth place by pushing K2 down to fifth place, whereas Tw shares the seventh rank (maximum power loss is 78.4%) with the COIN test.
With the increase in sample size, both JB and RJB show an improvement in power and ranking, but their maximum power losses are still above 50% (Table 3). Both JB and RJB are good at discriminating the FAR group of distributions (where the power of the NP test is between 90–100%), with JB having a slight edge over RJB, but both suffer when the distributions are from the INTERMEDIATE group of alternatives (Figure A11).

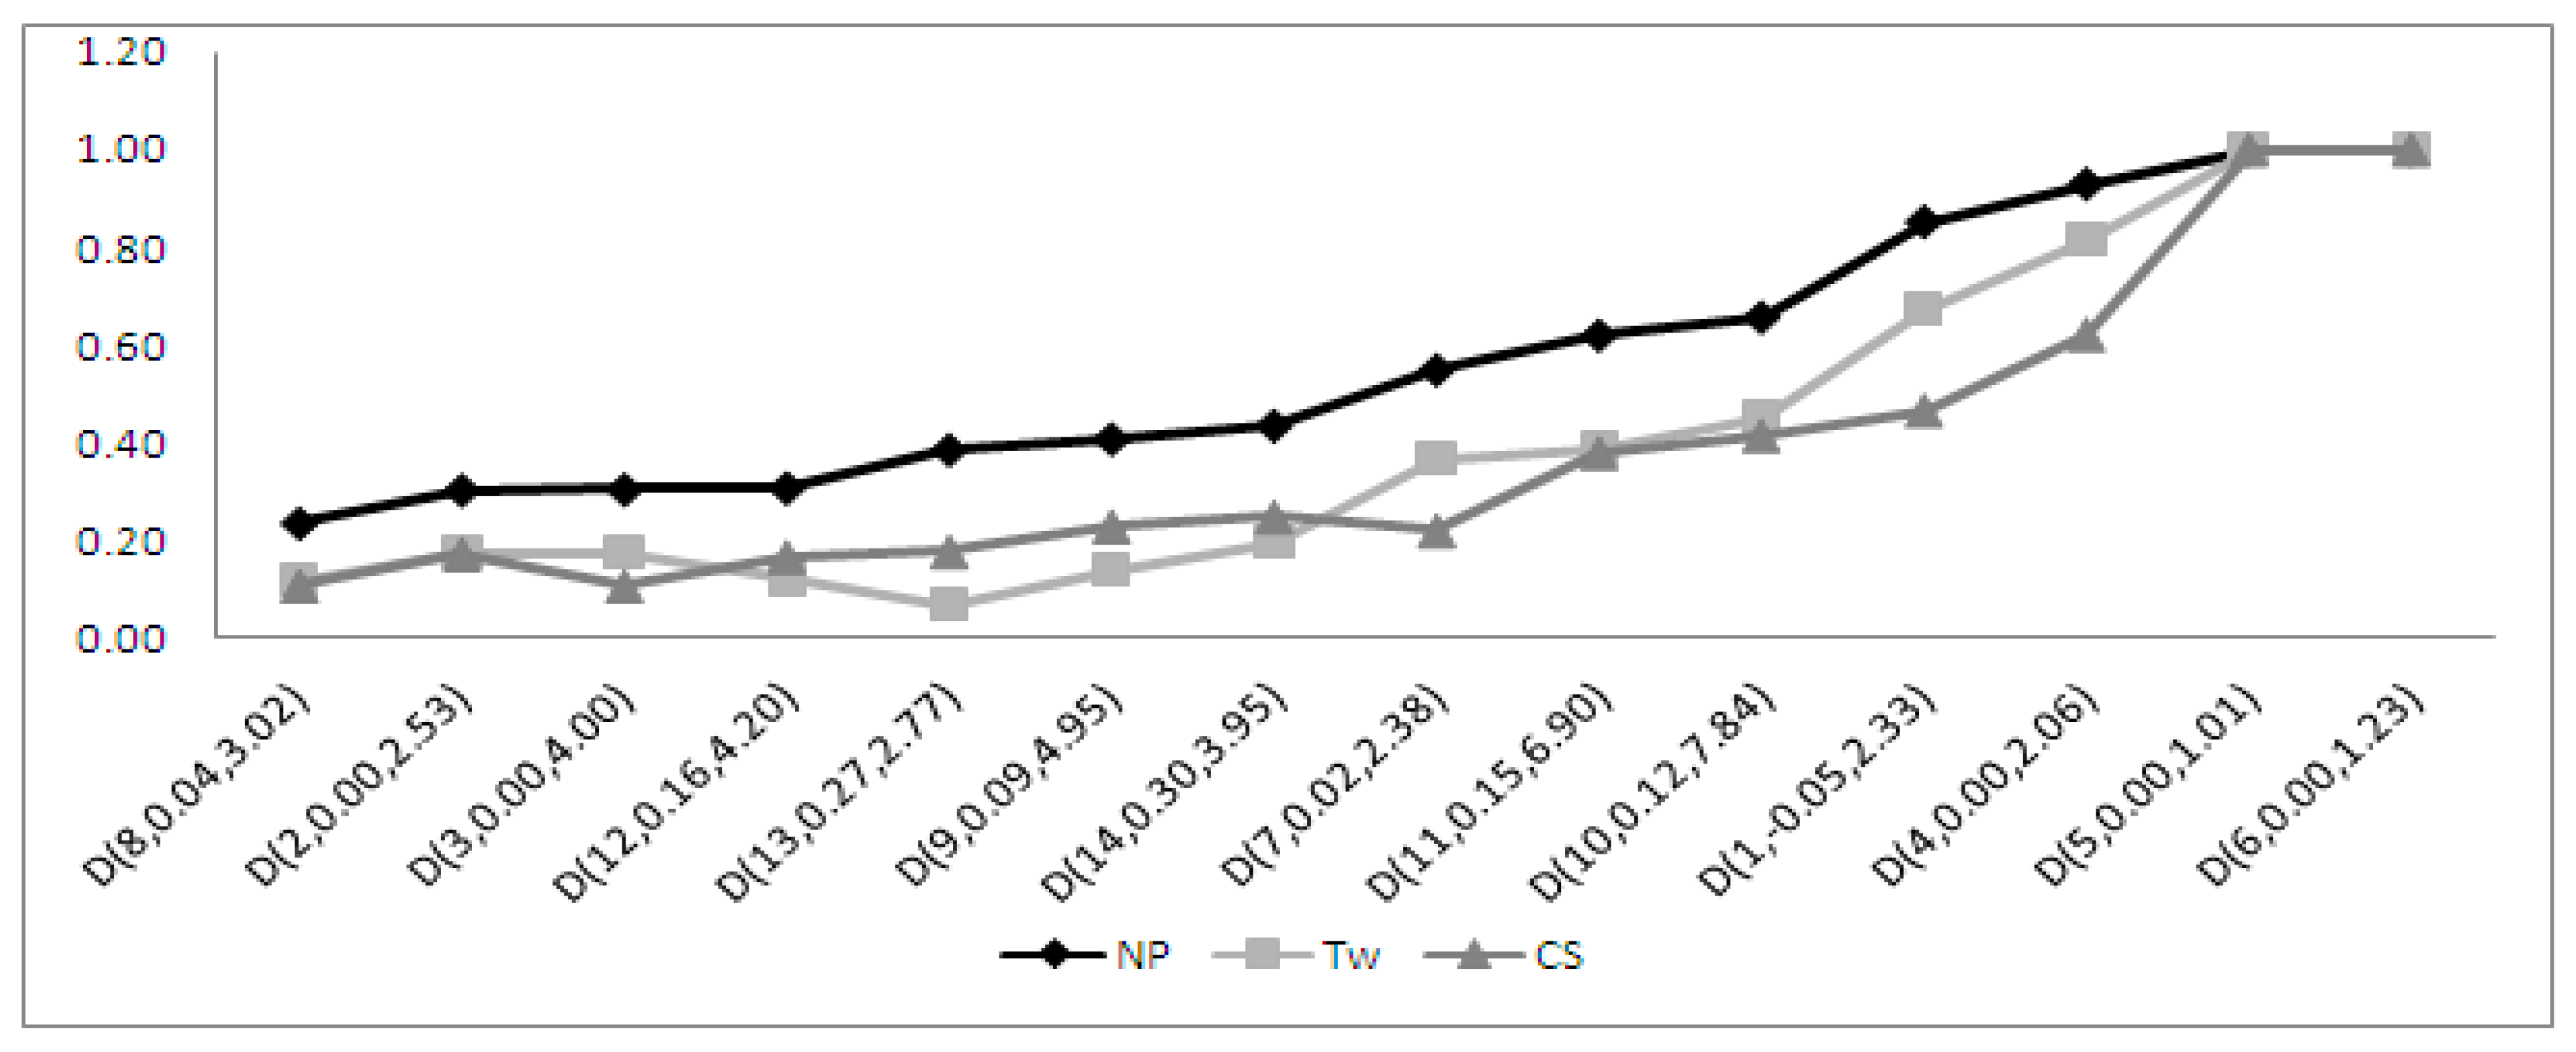
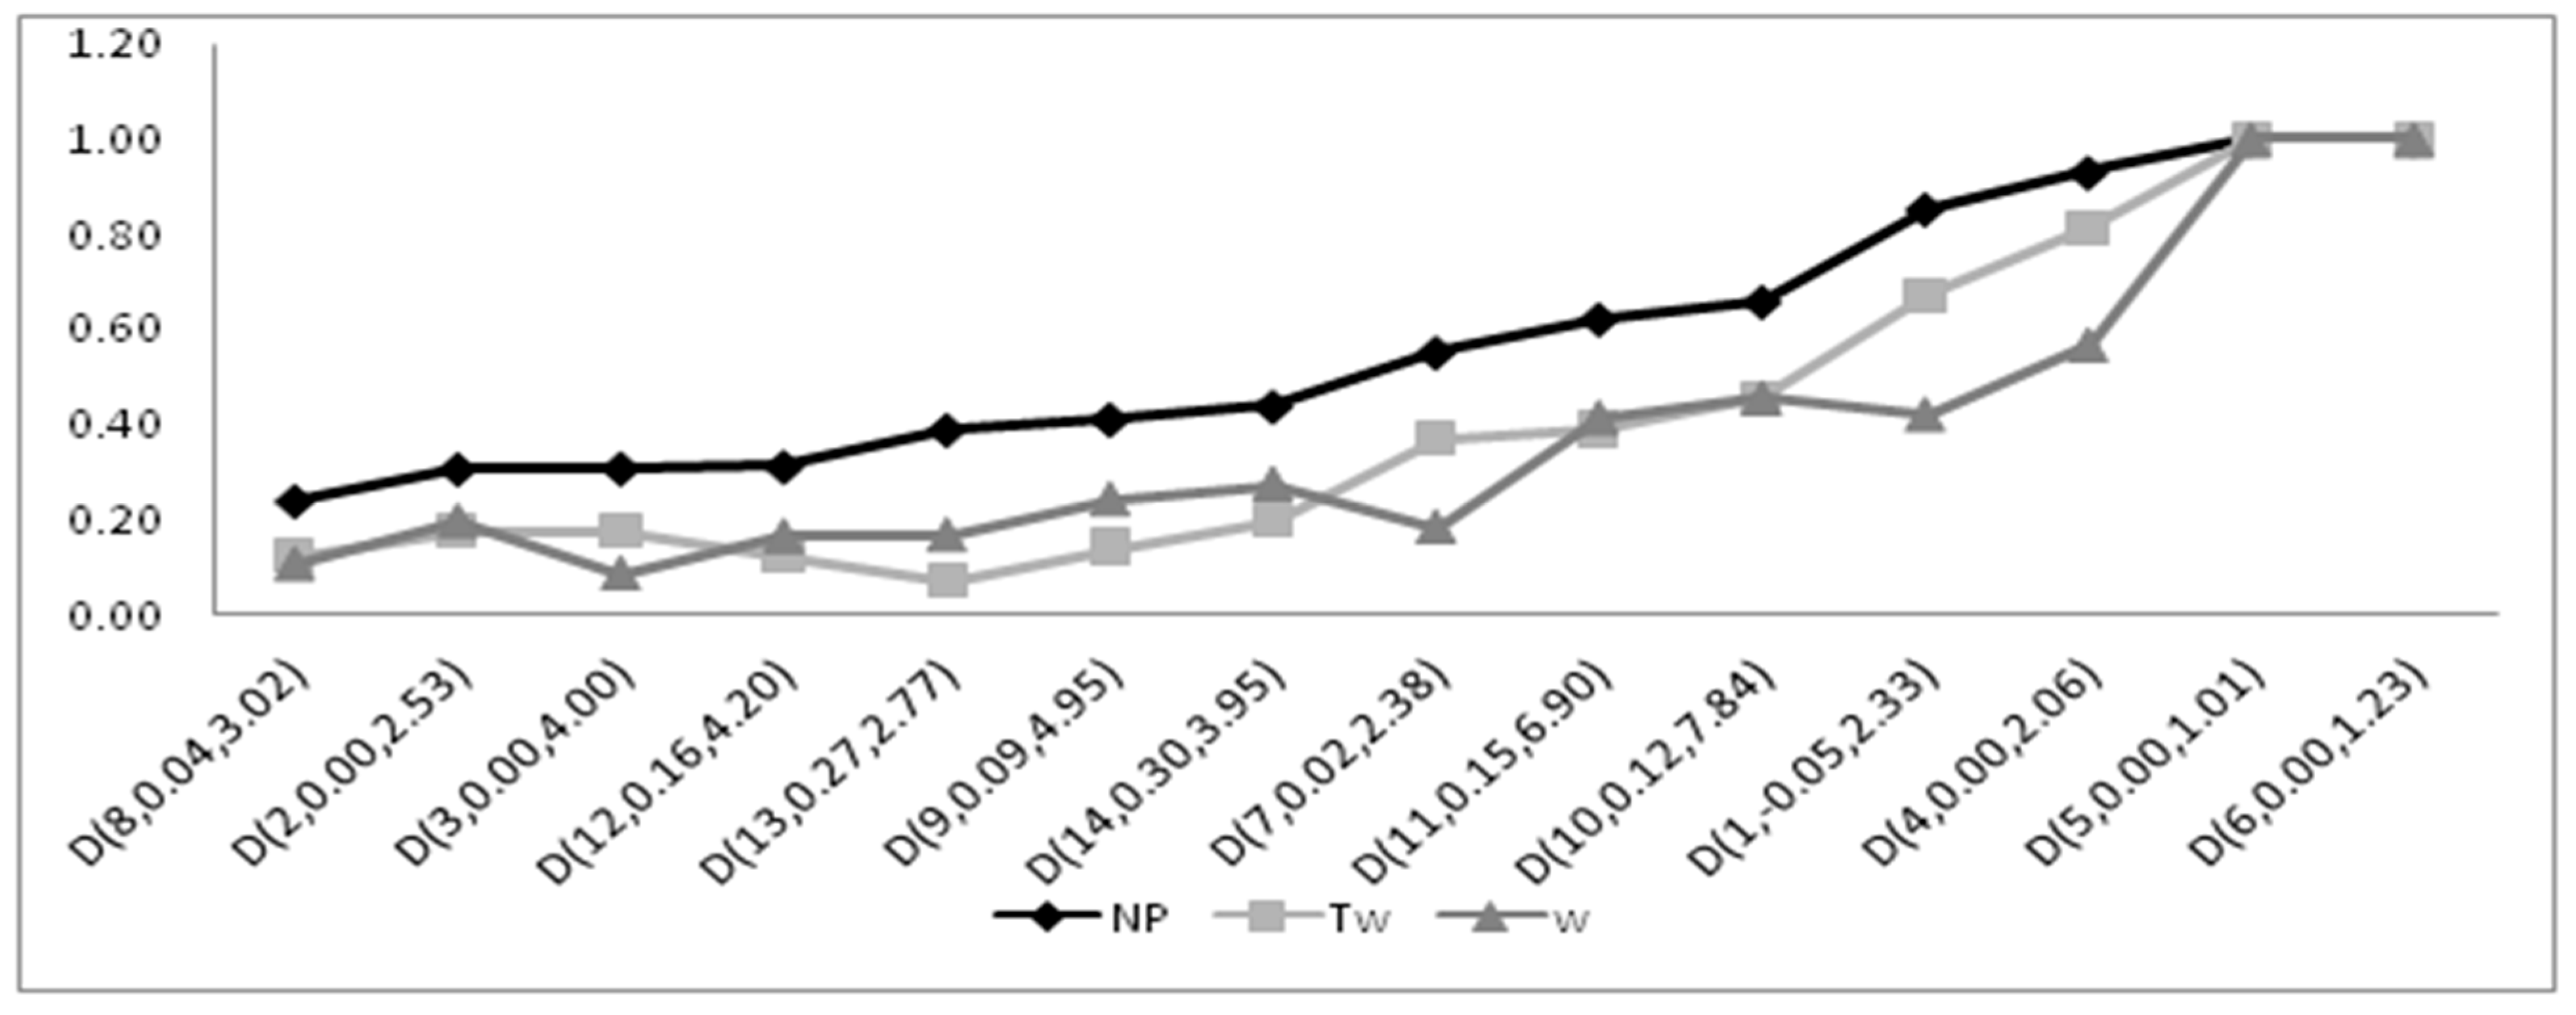
4.2.2. Performance of the Regression and Correlation Tests

Among the regression and correlation-based normality tests, for a smaller sample size, CS, W, and BCMR are the best tests for moderately skewed alternatives, with a loss range of 28.5%–29.8% (Table 3), whereas the COIN test is at the bottom, with a loss range of 68.8–88.7%.
For a medium to large sample size (n = 50, 75), W, BCMR, and CS are the better options, with Wsf following closely behind. The D and COIN tests are the least favorable regression and correlation-based normality statistics for moderately skewed alternatives, which is in line with the findings in [4,22]. It is evident from Figure A12 that Tw and COIN both suffer against the INTERMEDIATE and FAR group of alternative distributions.

4.2.3. Performance of the ECDF Tests

For moderately skewed alternatives, among the ECDF class of normality tests, AD exhibits superior power properties for all sample sizes. When considering all the selected normality tests for moderately skewed alternatives, AD holds the first rank for all sample sizes.
For a smaller and larger sample size, the Za and Zc statistics share the second rank. For a medium sample size, these tests occupy the third rank. For a smaller and medium sample size, the KS test holds the third rank, whereas its position improves to second rank for a larger sample size. The W test turns out to be a better test than KS (Figure A13), which corroborates the findings in Shapiro, Wilk, and Chen [18]. While evaluating the stringencies of the normality statistics for moderately skewed alternatives, we produce the same conclusion, but through a superior and reliable procedure.

4.2.4. Performance of the Other Tests

In general, for moderately skewed alternative distributions, the Rsj test performs poorly, exhibiting more than 50.0% maximum deviation from the power curve for all sample sizes. On balance, the worst performance of the Rsj test is against the INTERMEDIATE and FAR group of alternatives, but it performed well against the NEAR group of alternatives.
Overall, AD, CS, W, and BCMR happen to be the best and JB, RJB, Tw, Rsj, and COIN are the least favorable options for moderately skewed alternatives when considering all the selected normality tests.

4.3. Highly Skewed Alternatives

This group comprises the alternatives from the FAR group only where the most powerful NP test has 100% power. As both skewness and kurtosis are high for this group of alternatives, they are palpable. All normality tests other than the COIN and Tw statistics performed well against highly skewed alternatives (Table 4).
For a smaller sample size, the Wsf, BCMR, W, CS, Za, Zc, AD, RJB, and JB tests performed well, with the maximum power loss ranging between 8.8%–13.9%, followed by the D statistic with maximum power loss of 16.1% (Table 4), while the performance of the COIN and Tw tests was below the mark.
As the sample size increases, it becomes harder to differentiate among the selected tests of normality, excluding Tw and COIN. The results clearly show that the power loss of these statistics decreases with the increase in (i) sample size and (ii) skewness and kurtosis. For all sample sizes, JB and RJB yield good powers for the highly skewed alternatives.
Overall, the performance of the normality tests against the highly skewed and heavy-tailed alternatives is very good. However, the COIN and Tw tests performed poorly compared to other normality statistics. The poor performance of the COIN test is understandable as it is only meant for perfect symmetric cases [21,22]. Bonett and Seier [4] also recommend a standard skewness test along with the Tw statistic when the alternative distribution is skewed. Therefore, the COIN and Tw tests are not recommended for highly skewed alternative distributions.

5. Conclusions

This study shed light on the performance of fifteen normality tests against the three different groups of alternatives. For slightly skewed alternative distributions, Tw is the best test, with COIN, AD, CS, and Rsj following closely behind. On balance, D, JB, RJB, K2, Wsf, and Za did not perform well for the slightly skewed alternatives, especially from medium (n = 50) to large (n = 75) sample sizes, with more than 50% maximum power losses.
When considering all the selected normality tests for the moderately skewed alternatives, AD, CS, W, and BCMR turn out to be the best options for testing the hypothesis of normality of data distribution. In general, JB, RJB, Tw, COIN, Rsj, D, and K2 tests perform poorly against moderately skewed distributions. The performance of JB and RJB increases with the increase in sample size, but their maximum loss, in terms of their deviations from the power envelope, is greater than 50%, even for large sample sizes (n = 75).
On balance, all normality tests except Tw and COIN performed exceptionally well against the highly skewed alternatives, especially from medium to large sample sizes.
The above findings confirm our argument that a comparison of tests against different alternatives yields different statistics as the best tests. The COIN [23] and Tw tests are the best options for slightly skewed alternatives, but these statistics perform poorly for moderately and highly skewed alternative distributions. Therefore, the comparison and ranking of normality tests do not make sense in the absence of an invariant benchmark: the power envelope.

Author Contributions

I.T-U. conceived the idea, conceptualized the methodology and performed the numerical simulations. The author discussed the results with field expert and incorporated the valuable suggestions while writing the original draft. The author reviewed the manuscript under the light of reviewer’s comments.

Funding

This research received no external funding.

Acknowledgments

I would like to thank Asad Zaman for his valuable comments and guidance.

Conflicts of Interest

The authors declare no conflict of interest.

Appendix A

Table A1. Distributions.
Sr. NoStudent t DistributionMixture Distribution
t1t2
d.fMeand.fMeanAlphaMeanSDβ1β2
182.0125.00.503.501.88−0.052.33
21004.0756.00.505.001.420.002.53
3100.0....1.000.001.120.004.00
4100−1.5751.50.500.001.810.002.06
5103.0550.00.5026.5023.530.001.01
6100−4.0754.00.500.004.130.001.23
750−1.2251.20.500.001.580.022.38
885.0103.00.504.001.510.043.02
952.074.00.702.601.560.094.95
10510.0612.00.9510.101.360.127.84
11510.0712.00.9010.201.410.156.90
12105.057.00.506.001.570.164.20
131004.0756.00.704.601.360.272.77
1485.0103.00.103.201.270.303.95
15100−1.0751.00.75−0.501.330.322.91
1685.0103.00.203.401.380.323.57
17105.057.00.905.201.290.384.65
18100−1.2751.20.75−0.601.450.432.85
198−1.0102.00.95−0.851.330.484.68
208−1.0122.00.85−0.551.570.593.70
21100−1.5751.50.77−0.811.620.612.88
22100−4.0754.00.70−1.603.800.781.93
23510.0725.00.7014.506.990.821.83
24103.0550.00.7017.1021.570.871.77
25100−4.0754.00.75−2.003.611.022.44
268−10.0125.00.78−6.706.321.282.83
2780.0125.00.900.501.891.315.11
2880.0125.00.950.251.591.326.63
298−10.0125.00.80−7.006.111.423.22
308−10.0125.00.82−7.305.881.573.71
318−1.0125.00.90−0.402.141.585.60
3255.0715.00.856.503.791.624.45
3355.0615.00.906.003.262.066.73
34100−4.0754.00.90−3.202.602.096.69
35510.0725.00.9011.504.682.367.35
368−10.0125.00.90−8.504.642.427.48
37103.0550.00.907.7014.152.648.06
Note: β1 and β2 represent the skewness and kurtosis of the distribution.
Table A2. Power comparison of symmetric short-tailed alternatives (n = 25, α = 0.05).
DistributionSkewKurtJBRJBBest Test
D(5,0.00,1.01)0.001.010.270.041.00
D(6,0.00,1.23)0.001.230.030.021.00
Beta(0.5,0.5)0.001.500.000.000.91
Beta(1,1)0.001.800.000.000.44
Tukey(2)0.001.800.000.000.44
D(4,0.00,2.06)0.002.060.010.000.54
Tukey(0.5)0.002.080.000.000.14
Beta (2,2)0.002.140.000.000.11
D(2,0.00,2.53)0.002.530.020.010.16
Tukey(5)0.002.900.030.070.14

Appendix B

Figure A1. Power Comparison of NP and Tw Tests ( | β 1 | < 0.3   &   n = 75 ).
Symmetry 11 00872 g0a1
Figure A2. Power Comparison of NP, Tw, RJB, and JB Tests ( | β 1 | < 0.3   &   n = 75 ).
Symmetry 11 00872 g0a2
Figure A3. Power Comparison of NP, Tw, and K2 Tests ( | β 1 | < 0.3   &   n = 75 ).
Symmetry 11 00872 g0a3
Figure A4. Power Comparison of NP, Tw, and CS Tests ( | β 1 | < 0.3   &   n = 75 ).
Symmetry 11 00872 g0a4
Figure A5. Power Comparison of NP, Tw, and COIN Tests ( | β 1 | < 0.3   &   n = 75 ).
Symmetry 11 00872 g0a5
Figure A6. Power Comparison of NP, Tw, and W Tests ( | β 1 | < 0.3   &   n = 75 ).
Symmetry 11 00872 g0a6
Figure A7. Power Comparison of NP, Tw, and Wsf Tests ( | β 1 | < 0.3   &   n = 75 ).
Symmetry 11 00872 g0a7
Figure A8. Power Comparison of NP, Tw, and D Tests ( | β 1 | < 0.3   &   n = 75 ).
Symmetry 11 00872 g0a8
Figure A9. Power Comparison of NP, Tw, and BCMR Tests ( | β 1 | < 0.3   &   n = 75 ).
Symmetry 11 00872 g0a9
Figure A10. Power Comparison of NP, Tw, and Rsj Tests ( | β 1 | < 0.3   &   n = 75 ).
Symmetry 11 00872 g0a10
Figure A11. Power Comparison of NP, Tw, and COIN Tests (0.3 < |β1| ≤ 1.5 & n = 75).
Symmetry 11 00872 g0a11
Figure A12. Power Comparison of NP, JB, and RJB Tests (0.3 < |β1| ≤ 1.5 & n = 75).
Symmetry 11 00872 g0a12
Figure A13. Power Comparison of NP, W, and KS Tests (0.3 < |β1| ≤ 1.5 & n = 75).
Symmetry 11 00872 g0a13

References

  1. Delong, J.B.; Summers, L.H. Are Business Cycle Symmetrical in American Business Cycle: Continuity and Change; University of Chicago Press: Chicago, IL, USA, 1985; pp. 166–178. [Google Scholar]
  2. Henderson, A.R. Testing experimental data for univariate normality. Clin. Chim. Acta 2006, 366, 112–129. [Google Scholar] [CrossRef]
  3. Blanca, M.J.; Arnau, J.; López-Montiel, D.; Bono, R.; Bendayan, R. Skewness and Kurtosis in Real Data Samples. Methodology 2013, 9, 78–84. [Google Scholar] [CrossRef]
  4. Bonett, D.G.; Seier, E. A test of normality with high uniform power. Comput. Stat. Data Anal. 2002, 40, 435–445. [Google Scholar] [CrossRef]
  5. D’Agostino, R.; Pearson, E.S. Tests for departure from normality. Empirical results for the distributions of b2 and b1. Biometrika 1973, 60, 613–622. [Google Scholar] [CrossRef]
  6. Gel, Y.R.; Gastwirth, J.L. A robust modification of the Jarque–Bera test of normality. Econ. Lett. 2008, 99, 30–32. [Google Scholar] [CrossRef]
  7. Jarque, C.M.; Bera, A.K. A Test for Normality of Observations and Regression Residuals. Int. Stat. Rev. 1987, 55, 163–172. [Google Scholar] [CrossRef]
  8. Bispo, R.; Marques, T.A.; Pestana, D. Statistical power of goodness-of-fit tests based on the empirical distribution function for type_I right-censored data. J. Stat. Comput. Simul. 2012, 82, 21–38. [Google Scholar] [CrossRef]
  9. Shapiro, S.S.; Francia, R.S. An approximate analysis of variance test for normality. J. Am. Stat. Assoc. 1972, 67, 215–216. [Google Scholar] [CrossRef]
  10. Shapiro, S.S.; Wilk, M.B. An analysis of variance test for the exponential distribution (Complete samples). Biometrika 1965, 54, 591–611. [Google Scholar] [CrossRef]
  11. Anderson, T.W.; Darling, D.A. A test of goodness of fit. J. Am. Stat. Assoc. 1954, 49, 765–769. [Google Scholar] [CrossRef]
  12. Yazici, B.; Yolacan, S. A comparison of various tests of normality. J. Stat. Comput. Simul. 2007, 77, 175–183. [Google Scholar] [CrossRef]
  13. Zhang, J.; Wu, Y. Likelihood-ration tests for normality. Comput. Stat. Data Anal. 2005, 49, 709–721. [Google Scholar] [CrossRef]
  14. Gel, Y.R.; Miao, W.; Gastwirth, J.L. Robust directed tests of normality against heavy-tailed alternatives. Comput. Stat. Data Anal. 2007, 51, 2734–2746. [Google Scholar] [CrossRef]
  15. Önder, A.Ö.; Zaman, A. Robust tests for normality of errors in regression models. Econ. Lett. 2005, 86, 63–68. [Google Scholar] [CrossRef]
  16. Islam, T.U. Stringency-based ranking of normality tests. Commun. Stat. Simul. Comput. 2017, 46, 655–668. [Google Scholar] [CrossRef]
  17. Lehmann, E.L.; Stein, C. On the Theory of Some Non-Parametric Hypotheses. Ann. Math. Stat. 1949, 20, 28–45. [Google Scholar] [CrossRef]
  18. Shapiro, S.S.; Wilk, M.B.; Chen, H.J. A comparative study of various tests for normality. J. Am. Stat. Assoc. 1968, 63, 1343–1372. [Google Scholar] [CrossRef]
  19. Thorsten, T.; Buning, H. Jarque-Bera Test and its Competitors for Testing Normality-A Power Comparison. J. Appl. Stat. 2007, 34, 87–105. [Google Scholar]
  20. Yap, B.W.; Sim, C.H. Comparisons of various types of normality tests. J. Stat. Comput. Simul. 2011, 81, 1–15. [Google Scholar] [CrossRef]
  21. Romao, X.; Delgado, R.; Costa, A. An empirical power comparison of univariate goodness-of-fit tests for normality. J. Stat. Comput. Simul. 2010, 80, 1–47. [Google Scholar] [CrossRef]
  22. Bowman, K.O.; Shenton, L.R. Omnibus test contours for departures from normality based on b1 and b2. Biometrika 1975, 62, 243–250. [Google Scholar] [CrossRef]
  23. Coin, D. A goodness-of-fit test for normality based on polynomial regression. Comput. Stat. Data Anal. 2008, 52, 2185–2198. [Google Scholar] [CrossRef]
Table 1. Normality tests.
Test Class of Test
Za, Zc, AD, and KSECDF
JB, RJB, K, and TwMoments
W, Wsf, D, CS, BCMR, and COINCorrelation and Regression
RsjSpecial
Table 2. Ranking of the normality tests (|β1|<0.3).
n = 25n = 50n = 75
Test RankGapTest RankGapTest RankGap
Tw124.0%Tw122.9%Tw131.8%
COIN234.6%Rsj 226.4%Rsj 132.4%
AD234.7%AD338.0%AD132.6%
CS234.8%CS339.8%CS238.6%
Rsj 336.1%COIN442.5%W343.3%
W337.5%K2444.8%K2344.7%
KS338.1%W445.5%KS345.1%
Zc339.0%Zc548.0%COIN345.2%
BCMR339.9%BCMR548.3%BCMR346.1%
K2442.6%KS549.9%Zc450.5%
Za443.1%Za651.9%Za451.4%
Wsf446.5%Wsf761.3%Wsf556.2%
D591.6%JB880.5%D685.3%
JB697.2%D990.9%JB788.0%
RJB698.2%RJB1099.5%RJB892.9%
Table 3. Ranking of the normality tests (0.3 < |β1| ≤ 1.5).
n = 25n = 50n = 75
TestsRankGapTestRankGapTestRankGap
CS128.5%AD125.0%AD126.7%
W129.0%W228.3%CS128.9%
AD129.5%BCMR228.7%W129.5%
BCMR129.8%CS229.8%BCMR131.4%
Za232.8%Wsf334.9%Wsf235.8%
Wsf233.5%KS335.2%Za236.2%
Zc233.5%Za336.5%Zc238.2%
KS342.2%Zc338.3%KS240.4%
K2446.7%JB459.8%JB350.6%
D549.8%RJB461.9%K2457.9%
Rsj 655.5%K2564.6%RJB458.0%
Tw655.7%D674.6%D581.3%
JB759.0%Rsj 675.6%Rsj 583.9%
RJB864.4%Tw778.4%Tw688.0%
COIN968.8%COIN779.8%COIN688.7%
Table 4. Normality tests for highly skewed alternatives (|β1| > 1.5).
n = 25n = 50n = 75
TestRankGapTestRankGapTestRankGap
Wsf18.8%Wsf10.6%RJB10.0%
BCMR19.3%BCMR10.7%Zc10.0%
W110.1%Zc10.7%JB10.0%
CS110.4%W10.7%Wsf10.0%
Za110.9%JB10.7%W10.1%
Zc111.0%RJB10.7%CS10.1%
AD111.9%CS10.8%D10.1%
RJB112.5%Za10.9%BCMR10.1%
JB113.9%D11.0%K210.1%
D216.1%K211.2%Za10.1%
K2320.4%AD11.3%AD10.2%
KS321.2%Rsj 12.1%Rsj 10.2%
Rsj 321.5%KS13.6%KS10.5%
Tw446.9%Tw245.3%Tw242.5%
COIN561.4%COIN369.1%COIN372.0%

