1. Introduction
Multiple criteria analysis and optimization is, in our opinion, a perspective approach to support investment decisions based on discovering relations between the macroeconomic development of countries and the investment attractiveness of their government bonds. Koukouritakis [
1] examines the convergence of 10-year bond yields between each of the new EU countries and Germany. Empirical results provide clear evidence of strong monetary policy convergence of the Czech Republic, Lithuania, and Slovakia with Germany. Croatia and Romania have a weak monetary policy convergence with Germany; in contrast Bulgaria, Cyprus, Hungary, Latvia, Malta, Poland, and Slovenia prove monetary policy divergence. Koukouritakis discussed that for Cyprus, Latvia, and Slovenia, the empirical evidence could be attributed to the increased sovereign default risk of these countries and led to large risk premia. Hu, Hu, and Tsai [
2] used the MCDM (multiple criteria decision making) approach to identify the influential factors on S&P 500 Index Futures. They grouped the factors into two main groups: macroeconomic and technical. Empirical results show that the explanatory power of macro factors exceeds the influence of the technical indicators. The US dollar index, ISM manufacturing purchasing managers’ index, interest rate, volatility index, and unemployment rate have the strongest effect on the fluctuations of the S&P 500 Index. Doumpos and Zopounidis [
3] propose an alternative approach of measurement of financial risk based on multidimensionality. The multi-group hierarchical discrimination method constructs a set of additive utility functions classifying alternatives into predefined risk classes. Andriosopoulos et al. [
4] applied the multi-criteria decision aid model in the prediction of open market share repurchases. They separately used two models, UTADIS and ELECTRE TRI through a ten-fold cross validation approach for German, United Kingdom, and French repurchasing and non-repurchasing firms. The results imply that firm characteristics vary among the countries and methods used. The two used models performed better than a naïve model based on random assignment to outcomes based on prior probabilities. Dym [
5] deals with developing countries’ credit risk analysis, in which the interest rate of these countries’ bonds consist of a risk-free rate on US treasuries and are spread. The spread reflects the credit risk premium of the borrower. He uses six variables for sovereign risk analysis and categorizes them into three categories of risk: serviceability (reserves coverage, ratio of current account deficit to gross domestic product, external borrowing to GDP ratio), solvency (again external borrowing to GDP ratio, ratio of budget deficit to GDP, percent of real GDP growth) and structural (inflation rate). He chooses these variables for their spanning to categories, non-redundancy, and availability, and combines them to build up a new measure of risk. The z-score is calculated for each variable in each country as “a deviation from average value of the group countries and scaled by the standard deviation”. By summing up the individual z-scores, the overall z-score of a country is obtained. The higher the z-score is, the higher the country risk related to other countries. The risk-adjusted spread is the ratio of yield spread and z-score (divided by 100, added 1). The data are not hindsight data. The allocation is based on the relative z-scores calculated before the month began. Chen and Pan [
6] developed two models for portfolio consisting of two opposing assets: the first one with the Shanghai–Shenzhen 300 index and national debt, and the second one with a set of 18 Chinese stock sector indices and national debt. The model uses the dynamic portfolio theory in which the Markowitz mean-variance analysis is replaced by the minimum semi-absolute deviations criterion on a moving window. The weights in portfolio in
t + 1 depend on macroeconomic factors dependent on the Chinese market and its underlying economies: gross domestic product, sum of investments in fixed assets used, balance of import and export commodities, money in circulation M0 balance, China consumer price index, and the general price index of production. As part of the experiment, the stop loss control strategy was used. Basilio et al. [
7] used principal component analysis (PCA) and the Promethee II method to form a portfolio of the Sao Paulo Stock Exchange assets. Based on data from January 2011 to November 2016, they concluded that 100% of portfolios showed positive returns on investment. The result of the portfolios’ group, composed of assets based on the 21 financial indicators, was higher than the other one formed from PCA criteria. Albadvi, Chaharsooghi, and Esfahanipour [
8] apply the Promethee method to the Teheran Stock Exchange (TSE) using industry evaluation and company evaluation. The effective criteria are based on a literature survey and observations in the TSE, where the preference function of criteria was identified by the experts in an investment company. With the exception of industry investments’ share of GNP, no macroeconomic criteria were used. The authors conclude that the results were largely dependent on the preference functions and types of some criteria used. Bouri, Martel, and Chabchoub [
9] use two categories of criteria: accounting criteria (profitability ratios, liquidity and solvency ratios, and the ratios of financial structure) and market criteria (mean return, total risk—variance, systematic risk—beta, size measured by stock capitalization, the price earnings ratio and stock liquidity). In contrast to [
8], the authors demonstrate (on the application to the Tunisian Stock Market) that the optimal portfolio does not depend on criteria weights. Bilbao-Terol et al. [
10] use the MCDM technique TOPSIS to assess the sustainability of government bond funds. The method ranks the finite set of alternatives based on the minimization of distance from an ideal point and the maximization of distance from an anti-ideal point. Vetschera and de Almeida [
11] use a Promethee-based approach to portfolio selection problems based on the concepts of boundary portfolios and c-optimal portfolios. The research demonstrates—using 300,000 portfolios—that the developed methods provide a sufficient approximation of the total ranking. The systematic overview of multiple criteria decision methods, focusing on Promethee in portfolio selection problems, may be found in numerous works, e.g., Spronk et al. [
12], Salo et al. [
13], and Kornfeld and Kara [
14]. As criteria weights constitute a relevant problem in MCDM, many works focus on them, see, e.g. Chatterjee et al. [
15], Vinogradova et al. [
16], Pamucar et al. [
17]. The
Table 1 synthetizes the past research in the field of multiple criteria decision making as applied to the identification of investment opportunities.
Based on this literature review, we can identify a gap in the current research in various aspects of synthesis or confrontation of the research field. The main aim of the research is to develop an algorithmic methodology for investment opportunities identification among government bonds, which synthetizes countries’ macroeconomic development characteristics and relative government bonds historical yields, and implements the “learning approach” using a criteria weights optimization principle. In general, there are many applications of multiple criteria decision making (MCDM) techniques that offer an outranking of examined variants or alternatives as the main and only result; however, the stability of the results is not provided in many cases. The extended version of the model presented in [
18] is developed in this paper. Such techniques are used to rank countries on the base of their macroeconomic characteristics, the results of which are confronted with the spreads of the countries with the goal to identify promising investment opportunities among government bonds. The paper also suggests an optimization approach to criteria weights modeling and confronts its investment recommendation with known actual government bond yields as well, also providing a sensitivity analysis on changes in inputs. This paper has the following structure: In the introduction, research dealing with the multiple criteria decision making problems focused on investment opportunities is mentioned. In the methodology part, a model for investment opportunities identification based on historical confrontation is developed. The third part presents the model application to government bonds in European countries and investment opportunities are identified; the sensitivity analysis shows the consequences of changes in macroeconomic criteria weights and illustrates the stability of the solution. In the final part of the paper, conclusions are made together with clear investment recommendations for the near future. The
Appendix A consists of the methodology of outranking.
2. Materials and Methods
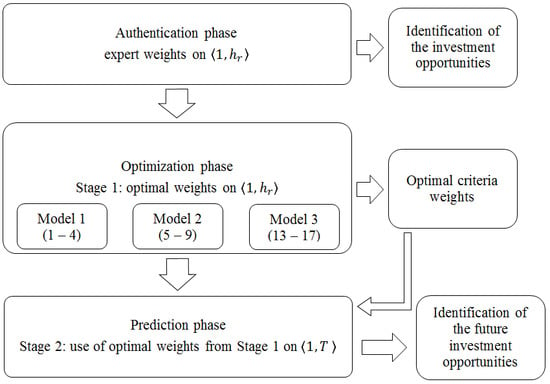
The process of investment opportunities identification in this work is established on the MCDM’s ranking of countries based on their macroeconomic development. It uses the idea of persistence of macroeconomic development and divides the process into two stages: in the first stage, the optimal weights based on the first period of time are set by three different models and, in the second stage, these weights are used for the whole period to identify future investment opportunities. Moreover, the sensitivity analysis for the weights is suggested to confirm the stability of the suggested solution.
Firstly, a countries outrank should be done. To rank the alternatives, some known methods can be used, e.g., the well-known works of Brans, Mareschal, and Vincke [
19] and Brans and Vincke [
20]. The Promethee methods, used in this research, outrank variants by dominance relation enrichment such that a preference function for each criterion is selected. The outranking relation is defined by multiple criteria preference indices, and this relation is evaluated by input flows, output flows, and net flows. Promethee II, as one of the results, provides the division countries into two groups, the so-called “good” and “bad” countries. i.e., in the case of a group of 10 countries in which there are 5 equally “good” and 5 equally “bad”, the method of assigns identical values of positive flows to “good” countries and symmetrical values of negative flows to “bad” countries with zero value of their sum. This concept of symmetry holds true, in general, in the sense that “good” countries have positive net flows and “bad” countries negative net flows with a zero value of their sum. In this application, we suggest use of the so-called z-scores instead of level and trend values of criteria. The advantage of such an approach is the fact that not only are the criteria values taken into account but also their variability. The methodology was presented in previous work [
21] and may be found in
Appendix A. By contrast, a different principle of criteria importance weights optimization was implemented in this paper.
Although Promethee II provides an analytical tool for the analysis of weights sensitivity [
22], the specific values of weights are still questionable. A naïve approach with all weights equal or expert values of the weights lack analytical support. Next, we suggest a two-stage approach to the investment strategy construction based on the optimization approach to weights specification, which allows the model to “learn” from the first period and provide better yields from government bonds in the next period. We suggest three different approaches to this optimization.
Stage 1: Suppose, firstly, that for the first period
, where
the investment opportunities are identified and we know the that
ri, where
i = 1, …,
m, is the yield of government bonds of the country
i in the next period
, while (A12) holds true. Then, for the period from 1 to
hr, the criterion weights can be found as solution to the following optimization problem as Model 1:
subject to
where the net flow of country
m with the highest yield is maximized so that the net flow of the country is lower than the net flow of the next country with a higher value of spread, and the sum of the non-negative level and trend macroeconomic criteria weights equals exactly one.
It may be the case that the problem in Model 1 has no feasible solution; one can use a goal programming approach in the following form as Model 2:
subject to
where the sum of deviation parameters of net flows
is minimized so that the net flow of the country is lower than the net flow of the next country with a higher value of spread, the sum of the non-negative level and trend macroeconomic criteria weights equals exactly one, and the values of the deviations are non-negative.
Even in this situation, the positive values of deviation variables can significantly affect net flow relations among individual countries. Therefore, as a third facility, the following model structure in Model 3 is offered. Let A be the set of indices of the countries whose government bonds have reached relatively high yields in period hr to T; N be the set of indices of the countries whose government bonds reach relatively low returns in this period; ; and the remaining countries can be named as investment neutral. In the more strict formulation,
Let
be the value of the net flow of the country from
A on the ultimate position, and
be the value of the net flow of the country from
N on the first position. Then, for the period from 1 to
hr, the criterion weights can be found as a solution for the following optimization problem as Model 3:
subject to
where the deviation from the residuum between the net flow of a country from
A and maximal net flow of a country from Set
N is minimized.
Stage 2: In our opinion, there is a certain persistence in macroeconomic developments described by the selected macroeconomic criteria. Let the model use the knowledge acquired in the past (the first period 1 to
hr), and the resulting optimal criteria weights from the optimization phase are then used for macroeconomic analysis for the whole period from 1 to
T for the identification of attractive investment opportunities in the year
T. The final country order according to net flows is confronted with the values of spreads at the end of
T (the end of the second stage) results in the rational investment strategy to government bonds, so called macroeconomic momentum, for the period of several years after
T. Finally, good investment opportunities will be sought among countries with positive net flows and high spread values over the period
T. The whole process may be illustrated by the diagram in
Figure 1.
3. Results
The decision support system was developed in the MS Excel environment. The system requires a database of 16 macroeconomic criteria in the structure of six blocks, following the Statistical Annex of the Economic Outlook online database provided yearly by the OECD [
23] (two blocks are omitted here). The criteria were selected according to recommendations of experts in the field of pension funds. The database used in this research contains the following data for the period from 2000 to 2018:
C1: Real gross domestic product expenditure-based (percentage changes);
C2: Real public consumption expenditure is the final consumption expenditure of general government (percentage changes);
C3: Real total gross fixed capital formation is the outlays (purchases and own-account production) of industries, producers of government services, and producers of private non-profit services to households, on additions of new durable goods (commodities) to their stocks of fixed assets less their net sales of similar second-hand and scrapped goods (percentage changes).
Inflation, wages, costs, unemployment, and labor market
C4: Unemployment rates: national definitions (percent of labor force);
C5: Consumer price indices measures change over time in the general level of prices of goods and services that a reference population acquires, uses or pays for consumption (percentage changes).
C6: Household saving rates is defined as household disposable income less consumption plus the change in net equity of households in pension funds. The sector refers, in most cases, to the household sector plus the non-profit institutions serving households (percent of disposable household income);
C7: Gross national saving defined as gross national income less private and public consumption (percent of nominal GDP).
C8: General government total outlays defined as the figures for total outlays which consist of current outlays plus capital outlays. Current outlays are the sum of current consumption, transfer payments, subsidies and property income paid, including interest payments. Data refer to the general government sector, which is a consolidation of accounts for the central, state and local government plus social security (percent of nominal GDP);
C9: General government financial balances are general government current tax and non-tax receipts less general government total outlays. The definition does not include streams of payments and receipts from swap agreements and forward rate agreements (surplus or deficit as a per cent of nominal GDP);
C10: General government net debt interest payments are interests paid for general government debt net of interest received for general government assets (percent of nominal GDP);
C11: General government gross financial liabilities are defined as the debt and other short and long-term liabilities of all the institutions in the general government sector (percent of nominal GDP).
C12: Long-term interest rates are based on the 10-year benchmark government bond yields, where available, or yield on similar financial instruments. Some series are not strictly comparable over time due to changes in definitions or in institutional arrangements (percent, per annum).
C13: Export volumes of goods and services in constant price value of exported goods and services (national accounts basis, percentage changes from previous period);
C14: Import volumes of goods and services in constant price value of imported goods and services (national accounts basis, percentage changes from previous period);
C15: Current account balances in local currency divided by nominal GDP (percentage of GDP);
C16: Export market growth in goods and services represents the potential export growth for a country, assuming that its market shares remain unchanged. Market growth indicators are calculated as a weighted average of import volume growth in all its markets, with the weighting pattern being derived from the share of its exports going to that market in a chosen base year. Indicators of export performance are calculated by comparing the growth of its export volumes with that of its export market. This shows whether the country’s exports grow faster or slower than its market, i.e., if over time it is experiencing market share gains or losses (percentage changes from previous period).
The decision support system developed in Excel uses Premium Solver Platform and allows flexibility in the number of countries and for the user to select criteria from the list. For this research the modeled countries were Austria, Belgium, the Czech Republic, Denmark, Finland, France, Germany, Ireland, Italy, the Netherlands, Poland, Portugal, Slovakia, Slovenia, Spain, Sweden, and the United Kingdom, and all of the 16 criteria listed above were used. The relatively conservative selection of countries respects the recommendation given by the group of portfolio managers of Slovak pension funds who consider them as key European economies, with Germany as a benchmark among them. The periods for level and trend criteria, the control parameters, and the importance weights for the Promethee II outranking method and the preference function are then assigned in each of the authentication, optimization, and prediction phases. The sixth criterion of the Gaussian type was used in this research. The importance weights are then set as the result of the optimization problems described by Equations (1)–(4) for Model 1, (5)–(9) for Model 2, or (13)–(17) for Model 3.
Authentication phase: The weights for the level and trend criteria for the period 2000–2011 were set by experts in the pension funds investment strategies (
Table 2). A 60% weight was assigned to the level criteria and 40% to the trend criteria. In this case, only seven macroeconomic criteria influence the countries outranking by the multiple criteria decision making procedure. The level (18%) and trend (12%) criteria for GDP, the level criteria for government financial balances and government gross financial liabilities (both 9%) are considered the most influential.
Promethee II was used to obtain the net flows of the countries according to the macroeconomic criteria in the first period 2000–2010. The net flow values, the values of the spreads (Spreads), and the values of 10-year government bonds yields in the next period, 2010–2018 (GB10YR), are presented in
Table 3 and
Figure 2. The spread is defined as the difference between the yield to maturity of the 10-year government bond of a country and the Germany government bond with the same maturity. Germany is considered as a neutral economy in terms of yields and can therefore serve as a benchmark. The higher the value of the net flow, the better the country is outranked according to its macroeconomic characteristics, and a positive value leads to a “good” rating, and negative to a “bad” one.
According to the selected criteria, Denmark is ranked highest with the best macroeconomic performance signaling a stable and safe environment even with low spreads. On the contrary, the Czech Republic, as the worst ranked, may be considered an unstable country with weak macroeconomic results. The Spreads column shows the difference between the yield to maturity of the government bond and Germany government bond with the same maturity where, e.g., the value of the Slovak spread at 117.5 is calculated, based on the Bloomberg data [
24], as follows:
In this stage of research, the conclusion is the identified investment opportunity in Poland, Portugal, and Ireland, as those countries have the highest spreads and good performance according to macroeconomic criteria. Comparing countries with good performance with their yields in 10-year government bonds 8 years later gives reasonable grounds to the idea that there is a good correlation between macroeconomic performance and the government bond yields of a given country (see
Figure 2).
The sensitivity analysis (
Table 4) shows the weight bounds for non-zero criteria and indicates the stability of the solution. Within these bounds, the country order does not change and, out of the threshold, the country improves its position in the order (increases the value of the net flow); i.e., for the level criterion C1, the gross domestic product, the expert weight is set as 18%; within the interval (17.70%–19.63%) the countries hold their position. The lower bound for this criterion, 17.7%, means that Italy changes its position upwards, above Slovakia, and the upper bound of 19.63% means that Poland improves its position above Portugal.
Optimization phase: The three identified countries in the authentication phase have good macroeconomic performance as well as high future government bond yields; however, there were also countries with better results. The weights optimization approach (13–17) was used for the macroeconomic criteria. Let us pick out countries with future government bond yields higher than Germany (Set A: Slovakia, Slovenia, Austria, the Netherlands, and Ireland), lower than Germany (Set N: Czech Republic, Denmark, Italy, Spain, and Finland) and the rest neutral countries with yields similar to Germany (Belgium, Portugal, United Kingdom, Sweden, France, and Poland). The goal in this step is to find the optimal weights for macroeconomic criteria so that neither country of Set
N nor neutral gain a higher net flow than any country of Set
A. Based on the macroeconomic data of the first period 1 −
hr (years 2000 to 2010), the optimal weights permits the choice of countries with better yields of government bonds for the next period of time (
hr −
T, 2011 to 2018). The results are shown in
Table 5.
The optimal weights preferences the trend criteria (87.47%) against the level criteria (12.53%) and gives the greatest relevance to the trend criteria of the government gross financial liabilities (26.22%), for the household saving rate (14.02%) and for the gross domestic product (12.99%). The use of optimal weights results in the country order as shown in
Table 6 and
Figure 3. The first five out of six countries with the highest net flow are the countries from the abovementioned Set A and represent the countries with the good macroeconomic performance and high future yields; from the neutral set, only Belgium reaches that group.
The sensitivity analysis (
Table 7) shows the intervals for optimal criteria weights for the first 10 variants according to the Promethee II method. The C11 trend criterion for the government gross financial liabilities lower bound is 10.91%, breaking this bound causes Germany to go up in position above Portugal and the upper bound for this criterion is 26.31%, breaking this bound causes Finland to shift above Denmark. Neither bound break causes violation of the group of countries in Set A, what means that, ceteris paribus, neither non-zero parameter bounds violation causes breakage of Set A integrity.
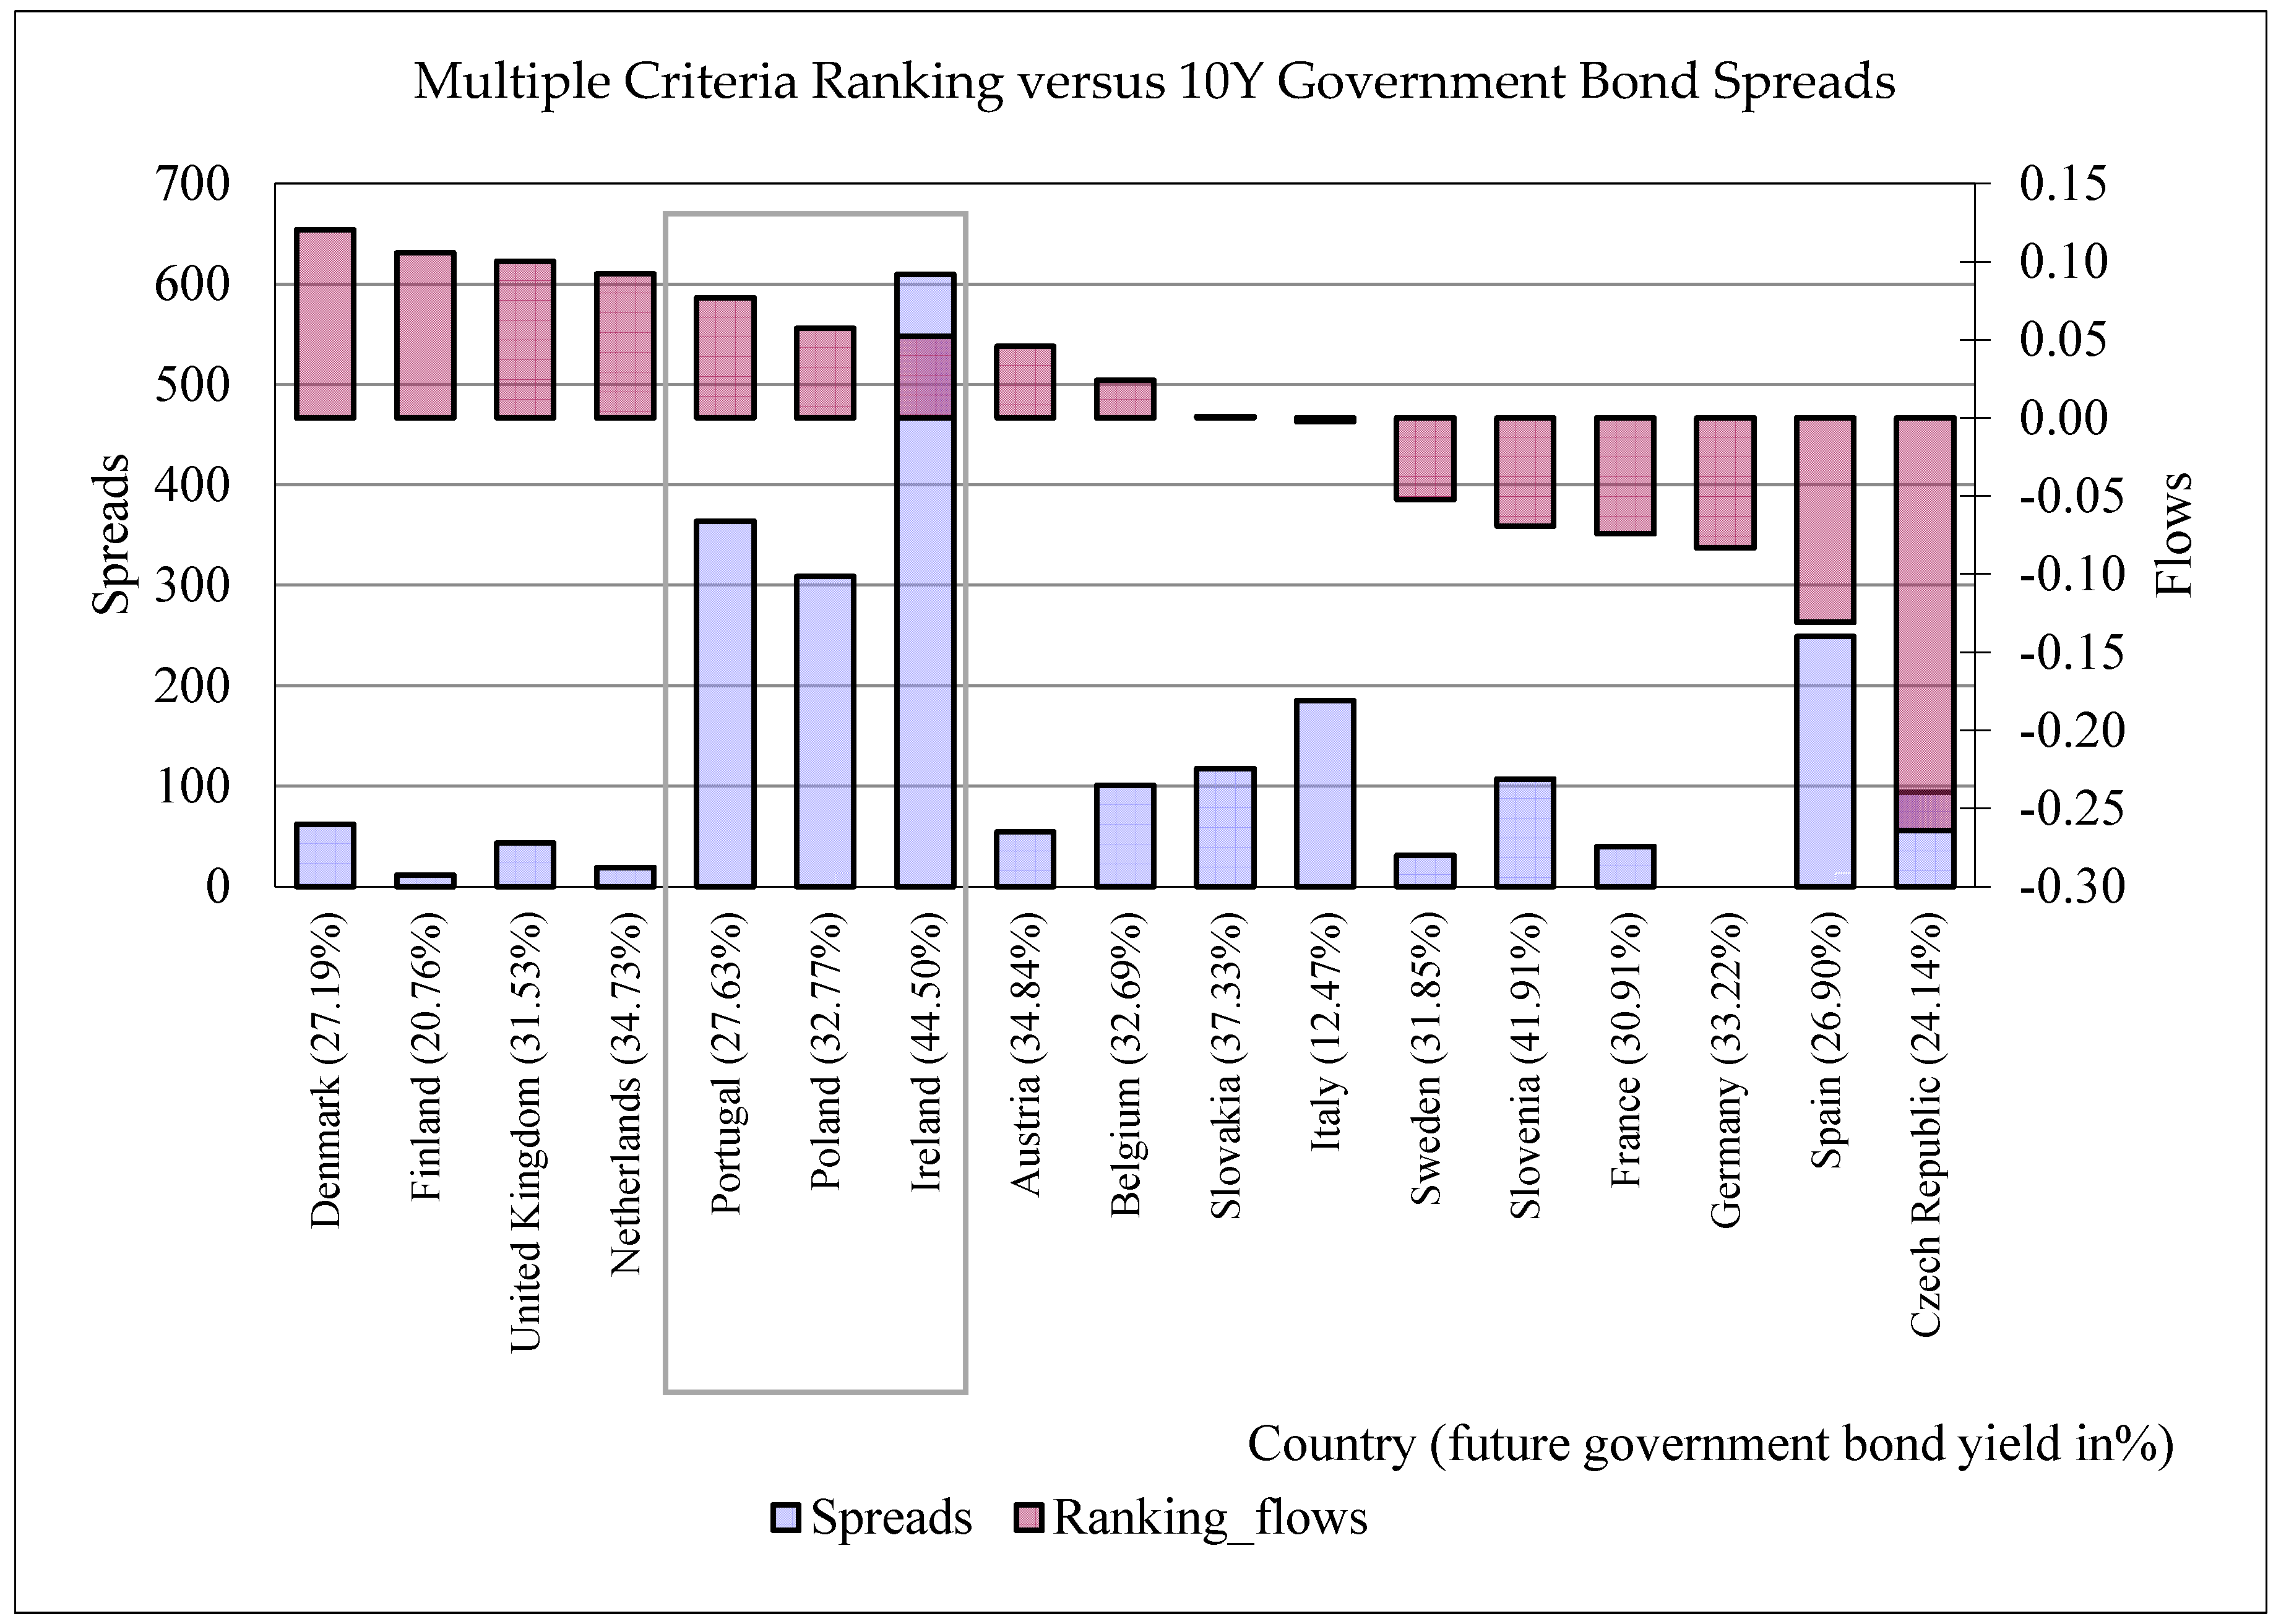
Prediction phase: In this phase, the model uses the knowledge acquired in the first stage. Let the period for level criteria be 2015–2018 and the period for trend criteria 2000–2018; the predicted results for the optimal weights (from the optimization stage) are shown in
Table 8 and
Figure 4. The values of the spreads are up to 31.12.2018.
The 10-year government bond of the Czech Republic and Poland was evaluated as the best investment opportunity for the future. The sensitivity analysis shows the stability intervals for optimal criteria weights for the first 10 variants according to the Promethee II method applied to the whole period of time. The trend criterion for government gross financial liabilities, as the most influential macroeconomic parameter, has a very tight threshold with the lower bound of 25.43% and upper bound of 27.61%. Breaking the lower bound in government gross financial liabilities or imports trend weights, ceteris paribus, causes Slovenia to move up before France and results in attractivity of the country’s government bonds. Breaking the lower bounds in government consumption level criteria or GDP, or household saving rate trend criteria weights, or upper bounds in capital formation level or trend, government financial balances, government net debt, or government gross financial liabilities trend criteria weights causes Italy overtakes Portugal, and may even cause a positive net flow leading to positive investment opportunity because of the very high Italian spread.
The frontier between positive and negative macroeconomic stability may be considered between the groups of countries Ireland–Slovenia and Portugal–Belgium. Portugal, with its high spreads, may present an interesting investment opportunity in the case of a positive net flow.
Table 9 shows that this situation never occurs at current criteria weights, even if they are broken, i.e., for C7 level criterion, Portugal may improve its position when breaking the lower bound. Since the value of this bound is 0.0%, this situation never occurs. This holds true for every weight criterion with Portugal on the lower bound (C15 level, C5 trend, C9 trend, and C10 trend); concluding that this country will never gain a positive macroeconomic environment at such criteria weights, ceteris paribus.
4. Discussion and Conclusions
The paper presents a technique for the evaluation of investment opportunities based on a combination of multiple criteria macroeconomic analysis with criteria weights optimization and historical government bond yields in the form of spreads via a benchmark. The process consists of three phases, two steps; in the authentication phase, the subject of research is a correlation among the countries with a macroeconomically stable environment and high yields of government bonds in the first period. Proving this phase, the optimization phase follows, in which macroeconomic criteria weights are set by the Promethee II method for the first period so that the outrank locates the “good” countries to high positions. Three models for the outrank were designed; the first optimization model maximizes the net flows, the second model of goal programming minimizes the sum of deviation parameters of net flows and, in the third model, the deviation from the residuum between the net flows among “good” as well as “bad” countries is minimized. Applying the optimal weights in the prediction phase for the whole period, the countries outranking with the government bond yields are obtained, and the investment opportunities are formulated.
Based on the presented methodology, the decision support system for investment opportunities was developed in an Excel environment. This system allows not only selection of the number of criteria and countries but, also, defining owns, obtaining the countries outrank together with the sensitivity analysis. The system provides an alternative useful tool for decision makers.
The methodology was applied on the European government bonds market in which 17 countries’ bonds were examined under 16 macroeconomic criteria. In the period 2000–2010, such country outranks that respect stable macroeconomic environments, as well as high spreads, were identified: Slovakia, Slovenia, Austria, the Netherlands, and Ireland (Belgium reached this group too, even though it has a lower spread). The sensitivity analysis shows that neither criteria bound break violates the integrity of this group. Applying the optimal criteria weights to the period 2000–2018, the Czech Republic and Poland are unambiguously evaluated as countries with good investment opportunities, and the sensitivity analysis demonstrated that for Italy and Slovenia, a positive recommendation may be formulated with some minor macroeconomic criteria (almost all concerning government performance) weights change.
One of the most recent studies by Rapacki and Czerniak [
25] defines the financial intermediation clusters in European countries; two of them very similar to the ranking based on spreads in our research (
Figure 4): the first named bank-based cluster includes Germany, Italy, Austria, and Finland, and the second named market-based cluster consists of Denmark, the Netherlands, Spain, Sweden, and United Kingdom. The only exception is Italy, with extremely high spread values.
Based on the methodology application to the data from 2000 to 2018, the most important macroeconomic criteria were evaluated: the trend criteria for government gross financial liabilities (over 26% weight), household saving rate (over 14%), GDP (near 13%), private consumption (near 12%), and CPI (near 9%). All the level criteria, except for government consumption (over 7%), show up as not significant. Compared to the expert recommendations, the optimal criteria include trend criteria of CPI and household savings rate, and do not consider criteria as capital formation, unemployment rate, and government financial balances. The policy makers should be concerned with future investments in the government bonds of countries with a very low percentage rate of general government debt and long-term liabilities share of nominal GDP, high household saving as a percent of disposable household income, high growth of the real gross domestic product, low percentage growth of the consumer price index and low share of general government current consumption, transfer payments, subsidies, and property income paid on nominal GDP.


