Article

Influence of Symmetric and Asymmetric Voids on Mechanical Behaviors of Tunnel Linings: Model Tests and Numerical Simulations

1
Faculty of Civil Engineering and Mechanics, Kunming University of Science and Technology, Kunming 650500, China
2
Yunnan Research Institute of Highway Science and Technology, Kunming 650051, China
*
Author to whom correspondence should be addressed.
Symmetry 2019, 11(6), 802; https://doi.org/10.3390/sym11060802
Submission received: 3 April 2019 / Revised: 12 June 2019 / Accepted: 14 June 2019 / Published: 17 June 2019

Abstract

:
The presence of symmetric and asymmetric voids directly affects the mechanical behaviors of tunnel linings and further induces tunnel diseases among influence factors. In this paper, 1:5-scale model tests were carried out to study the mechanical behaviors of reinforced concrete (RC) linings considering the voids located at the crown and at the spandrel. Based on the experimental results and concrete plastic damage (CDP) model, the effects of void (i.e., location and size), subgrade stiffness, and lining size on bearing capacity of RC lining were investigated using numerical simulation. The results of model test and parametric analysis showed that the existence of voids significantly affected the mechanical behavior of the lining during inelastic deformation period. The lining with a larger void size corresponded to low bearing capacity and larger deformation around the void, thus increasing the damage possibility of linings. The influence of voids on the bearing capacity of linings varied with the void location, load direction (especially under horizontal symmetrical loads), and subgrade stiffness. High soil stiffness corresponded to a great influence of the void size on the lining bearing capacity. In addition, the lining strength increased inconsistently with the increase of model size. On the basis of parameter sensitivity analysis, the Levenberg–Marquardt (L-M) optimization algorithm and Logistic model were used to establish the equation of lining bearing capacity loss rate considering the void effect.

1. Introduction

With the rapid development of traffic construction in China, the number of operational tunnels is increasing rapidly. By the end of 2017, the total mileage of road tunnels and railway tunnels in China reached 15,000 and 15,300 km, respectively [1]. However, in the rapid development process, the complex geological environment and limitations due to the technical level of tunnel design, construction and monitoring have resulted in unsatisfactory service status of the operating tunnels, especially in early construction, which is marked by serious tunnel defects [2,3]. Most tunnels have defects such as voids behind the lining, insufficient lining thickness, low concrete strength, tunnel leakage, lining crack and corrosion, which can directly affect the safety and durability of the structures. These have become problems that plague domestic and foreign traffic operation management departments, attracting widespread attention [4,5,6,7,8].
A considerable amount of research on tunnel diseases such as lining cracks and leakage has been conducted from the aspects of disease characteristics, disease formation mechanism, mechanical properties under the influence of diseases, and reinforcement treatment techniques, achieving rich results [9,10,11]. Voids behind the lining are typical quality defects of tunnels. The existence of voids does not directly lead to structural damage, but it is a typical incentive for many other quality defects and diseases [12]. The voids cause the earth pressure redistribution on existing tunnel linings, which in turn changes the internal force state of the tunnel linings [13]. Stress concentration tends to occur at the edge of the voids, causes structural crack, leads to other diseases, and weakens the lining near the voids [14]. The location and range of voids considerably affect the internal force distribution of the lining [15]. The influence of the safety factor of the lining is greatest when the voids at the crown [16]. The lining bending moment, stress concentration of the surrounding rocks, and the safety factors are greatly affected by the range of voids, and the axial force is less affected by the void range [17]. As the size of the void increases, the axial force of the lining decreases and the bending moment of the lining in the void range increase markedly, resulting in deterioration of the structural stress state and reduction of load carrying capacity [18]. On the basis of the standard section of the tunnel in the Shinkansen project, Japanese scholars developed a direct loading device to perform many 1:30-scale model tests on the model linings; the model tests investigated the bearing capacity and failure characteristics of the linings under the condition of voids and lining thinning [19].
The conclusions from existing research furthers our understanding of the interaction between the lining and surrounding rocks considering the influence of local contact loss. However, previous studies had mainly evaluated the void effects from the changes of lining internal force; only elasticity with no plasticity was considered [15,17,20]. The existence of a void will cause the soil pressure to concentrate near the void, leading to cracking and even destruction of the lining in extreme cases. The bearing capacity and deformation performance of the lining considering the voids needed to be clear in this situation. The most existing tests used small-scale model tests [18,19,20], which often led to a reliability problem due to the difficulty of similar design. Moreover, normal concrete (NC) lining was often used in the tests [19] and the mechanical properties of the reinforced concrete (RC) lining under void defects were not yet available in related research reports. This paper develops a lining horizontal loading device, which adopts a 1:5-scale lining model loading test to study the load carrying capacity, crack distribution, and failure modes of RC lining with voids at the crown and spandrel. On the basis of the reasonable description of the material constitutive model, a numerical calculation model of RC lining is established to perform sensitivity analysis of parameters such as void location, void size, soil stiffness, and model size. Defining the loss rate of the lining load carrying capacity and using the Levenberg–Marquardt optimization algorithm obtains the quantitative evaluation equation of the bearing capacity of the lining considering the effect of void. This equation can provide a theoretical basis for the safety evaluation and strengthening design of defective lining.

2. Model Test Scheme

Taking the existing lining loading test device as the reference [21], a lining loading test setup was developed, as shown in Figure 1. The model test setup includes a reaction steel frame, nine electro-hydraulic jacks, and equivalent subgrade setup. The size of the loading device was designed according to the 1:5-scale of the section of a two-lane highway tunnel in China. The reaction steel frame was assembled by M30 bolts with 9 H-shaped steel members, with dimensions of 3950 mm (width) × 2610 mm (height) × 300 mm (thickness). Nine loading points were set around the lining: one active loading point and eight passive loading points. Active load was applied by setting an electro-hydraulic jack at the active loading point, such as vertical loading at the crown (Figure 1a) and oblique loading at the spandrel (Figure 1b). Rubber plates were installed at the remaining passive loading points and were used to simulate subgrade reaction. The size of a single rubber plate was 0.3 m × 0.3 m, and the thickness was 100 mm. Uniaxial compression test of the rubber plate indicated that the compressive stiffness of the rubber plate was 3.38 MN/m. A total of eight rubber plates were used to simulate the formation constraints of the lining model test and the equivalent formation resistance coefficient was calculated to be 27.9 MPa/m [22,23,24].
To investigate the effect of voids on mechanical properties of tunnel linings, five model test conditions were set up as follows. (1) Three sizes of voids at the crown include 0° (no void), 30°, and 60° (Figure 2a). (2) Two sizes of voids at the spandrel include 0° (no void) and 60° (Figure 2b). The void location and void size were simulated by removing the rubber plates behind the lining in the corresponding position. Referring to the loading mode of existing tests [25,26]. Oblique (45°) loading direction was used to simulate the unbalanced soil pressure on lining for the cases of the voids at the crown, and vertical (90°) loading direction was used to simulate the loosening vertical soil pressure on lining for the voids at the spandrel.
When the influence of self-weight on the structure is not considered and the external load is concentrated, the prototype material can be used for the model test [27]. Therefore, this test used prototype materials to make the lining members. The lining member was based on a common two-lane road tunnel lining in China. It was made according to the 1:5-scale. The lining member was 2.3 m wide, 1.56 m high, 80 mm thick, and 300 mm long longitudinally. The reinforcement ratio of the prototype lining was 0.7%. The conversion was conducted according to the principle of equal reinforcement ratio. The model lining adopted the steel bars with a diameter of 4 mm and the distance between two steel bars is 40 mm, also the distributed steel bars with the diameter of 2 mm, and the distance of 50 mm between two steel bars. The dimensions and reinforcement drawings of the lining member are shown in Figure 3. After 28 days of maintenance, the lining members were moved into the loading setup where the test sensors, rubber plates, and loading jacks were arranged.
The values of load, displacement, and strain during the loading process of the lining were collected by using pressure sensors, strain gauges, and displacement transducers in this test. Taking the vertical loading at the crown as an example, the arrangements of this test are shown in Figure 4. The displacement control loading mode with loading rate of 0.5 mm/min was adopted. Crack distribution and crack width were recorded before the lining was broken.

3. Analysis of Test Results

3.1. Bearing Capacity of Lining Under the Influence of Voids

The load–displacement curves of the RC lining with the voids at crown and voids at spandrel are shown in Figure 5a,b, respectively. Figure 5 shows that the load–displacement curves under different position and size voids can be divided into elastic deformation (OC), elastoplastic deformation (CP), and plastic development (PF) stages. The OC stage was a linear portion of the curve from the beginning of loading to the appearance of cracking point. As the load increased, the slope of the load–displacement curve reduced stably and monotonously, and the deformation of lining increased nonlinearly until it reached the peak load. With the expansion of lining cracks, the deformation of the lining increased continuously until spalling and crushing occurred. Whether voids were at the crown or the spandrel, the OC stage changed smaller with the increase of void size, while the slope of the CP curve section declined, and the projection area of the curve section decreased, which indicates that the lining stiffness decreased in this stage. Further, the peak load and the corresponding displacement decreased rapidly and the brittleness of the lining increased. With a larger void, the PF curve section showed a slowdown in the rate of decline after reaching the peak load, indicating an increase in ductility after the lining reached its peak load. This finding shows that the presence of voids considerably affected the morphology of load–displacement response and the mechanical behaviors of the lining, especially the deformation behaviors of the lining after the initial cracking and the post-peak load.
When the voids at the crown were in the size of 0°, 30°, and 60°, the peak loads of the lining were 78.6, 62.2, and 39.9 kN, respectively. Further, the displacements at the peak loads were 44.4, 35.0, and 18.2 mm, respectively. Compared with the no void case, the load carrying capacities reduced by 20.9% and 49.2%, respectively, and the corresponding displacements reduced by 21.2% and 59.0%, respectively. When the void was at the spandrel and its size range from 0° to 60°, the peak loads of the lining were 77.1 and 46.1 kN, respectively, and the displacements at the peak loads were 36.0 and 25.3 mm, respectively. Compared to the case with no void, the load carrying capacity and the corresponding displacement reduced by 40.2% and 29.7%, respectively. Voids at the spandrel showed a similar variation pattern with those at the crown. A larger void behind the lining corresponded to the lower bearing capacity of the lining and a smaller displacement at the peak load, therefore the lining damage could occur more easily. However, the existence of the void increased the post-peak deformability of the lining.

3.2. Failure Modes of Lining Under the Influence of Voids

The cracks, deformation distribution and failure modes of RC lining under different size of voids are shown in Figure 6, where “○” symbolizes the tensile cracks, “●” symbolizes the compression fracture, numbers 1–x stand for the orders of cracking, and the dotted lines indicates lining deformation. Photographs of the deformation and the cracks distribution void size 30° at the crown and void size 60° at the spandrel are shown in Figure 6a,b, respectively. For the 45° oblique load, the RC linings under different size of voids at the crown had similar failure patterns (Figure 6c–e). First cracking was observed inside the lining of the loading point, then the outer lining at the edge of the void, and at the springline began to crack; with the propagation and expansion of cracks in the spandrel and the crushing of the lining in the range of the void and the springline, three plastic hinges were formed to destroy the lining completely. As the void size in the crown increased, the lining deformation within the range of the void became larger and the lining damage was concentrated on the void. For the case of the void at the spandrel, the failure pattern was similar to that of the void at the crown (Figure 6f–g). The lining was destroyed by the penetration of cracks at the crown and the collapse of both sides of the spandrel. Consistent with the influence of void at the crown, the lining deformation increased by 3.8 times with the increase of the void at the spandrel ranging from 0° up to 60°. As a result of the voids, the lining lost the restriction of surrounding rocks and was more easily deformed under load. A larger void corresponded to the larger deformation and the easier occurrence of damage of the lining at the void.

4. Numerical Model

4.1. Material Model and Parameters

4.1.1. Modeling of Concrete

Concrete was modeled using the concrete plastic damage model (CDP model) in ABAQUS, which was proposed by Lee and Fenves and is suitable for simulating the mechanical behaviors of concrete under monotonic and cyclic loading [28,29]. To avoid the influence of size effect in element mesh, the plastic behaviors of concrete were described by defining fracture energy. The compressive stress–strain curve and tensile stress–crack displacement curve of concrete were calculated according to the recommended formulas in the Code for Design of Concrete Structures GB50010-2010 and the relevant literature [30], respectively. The tensile and compressive energies of concrete were calculated as follows [31,32,33]:
G F = 0.073 ( f c m ) 0.18
G c = ( f c m f t m ) 2 G F
where f c m and f t m are the average compressive strength and tensile strength of concrete, respectively; the unit is MPa; G F and G c are the fracture energy of concrete under tension and compression in units of N/mm, respectively.
According to Sidiroff’s energy equivalence principle [34], the damage factor of the CDP model can be expressed as:
d t = 1 ( σ t l c E 0 ω ) 0.5
d c = 1 ( σ c E 0 ε c ) 0.5
where d t and d c are the tensile and compressive damage factors, respectively; σ t and σ c are the tensile and compressive stress of concrete, respectively; l c is the characteristic length of concrete integral element, which is l c = 2 A ; A is the element area; w is the cracking displacement of concrete; E 0 is the initial elastic modulus of concrete; and ε c is the compressive strain.
In this paper, monotonic loading was used in numerical simulation, and the restoring stiffness weight factor was ω c = 1 , ω t = 0 . The plastic parameters of the CDP model are shown in Table 1.

4.1.2. Modeling of Steel Bar

The constitutive behavior of steel bars was modeled using a piecewise linear model which obey the Von Mises yield criterion [35,36,37]. The stress–strain curves are shown in Figure 7 and the calculation parameters are shown in Table 2.

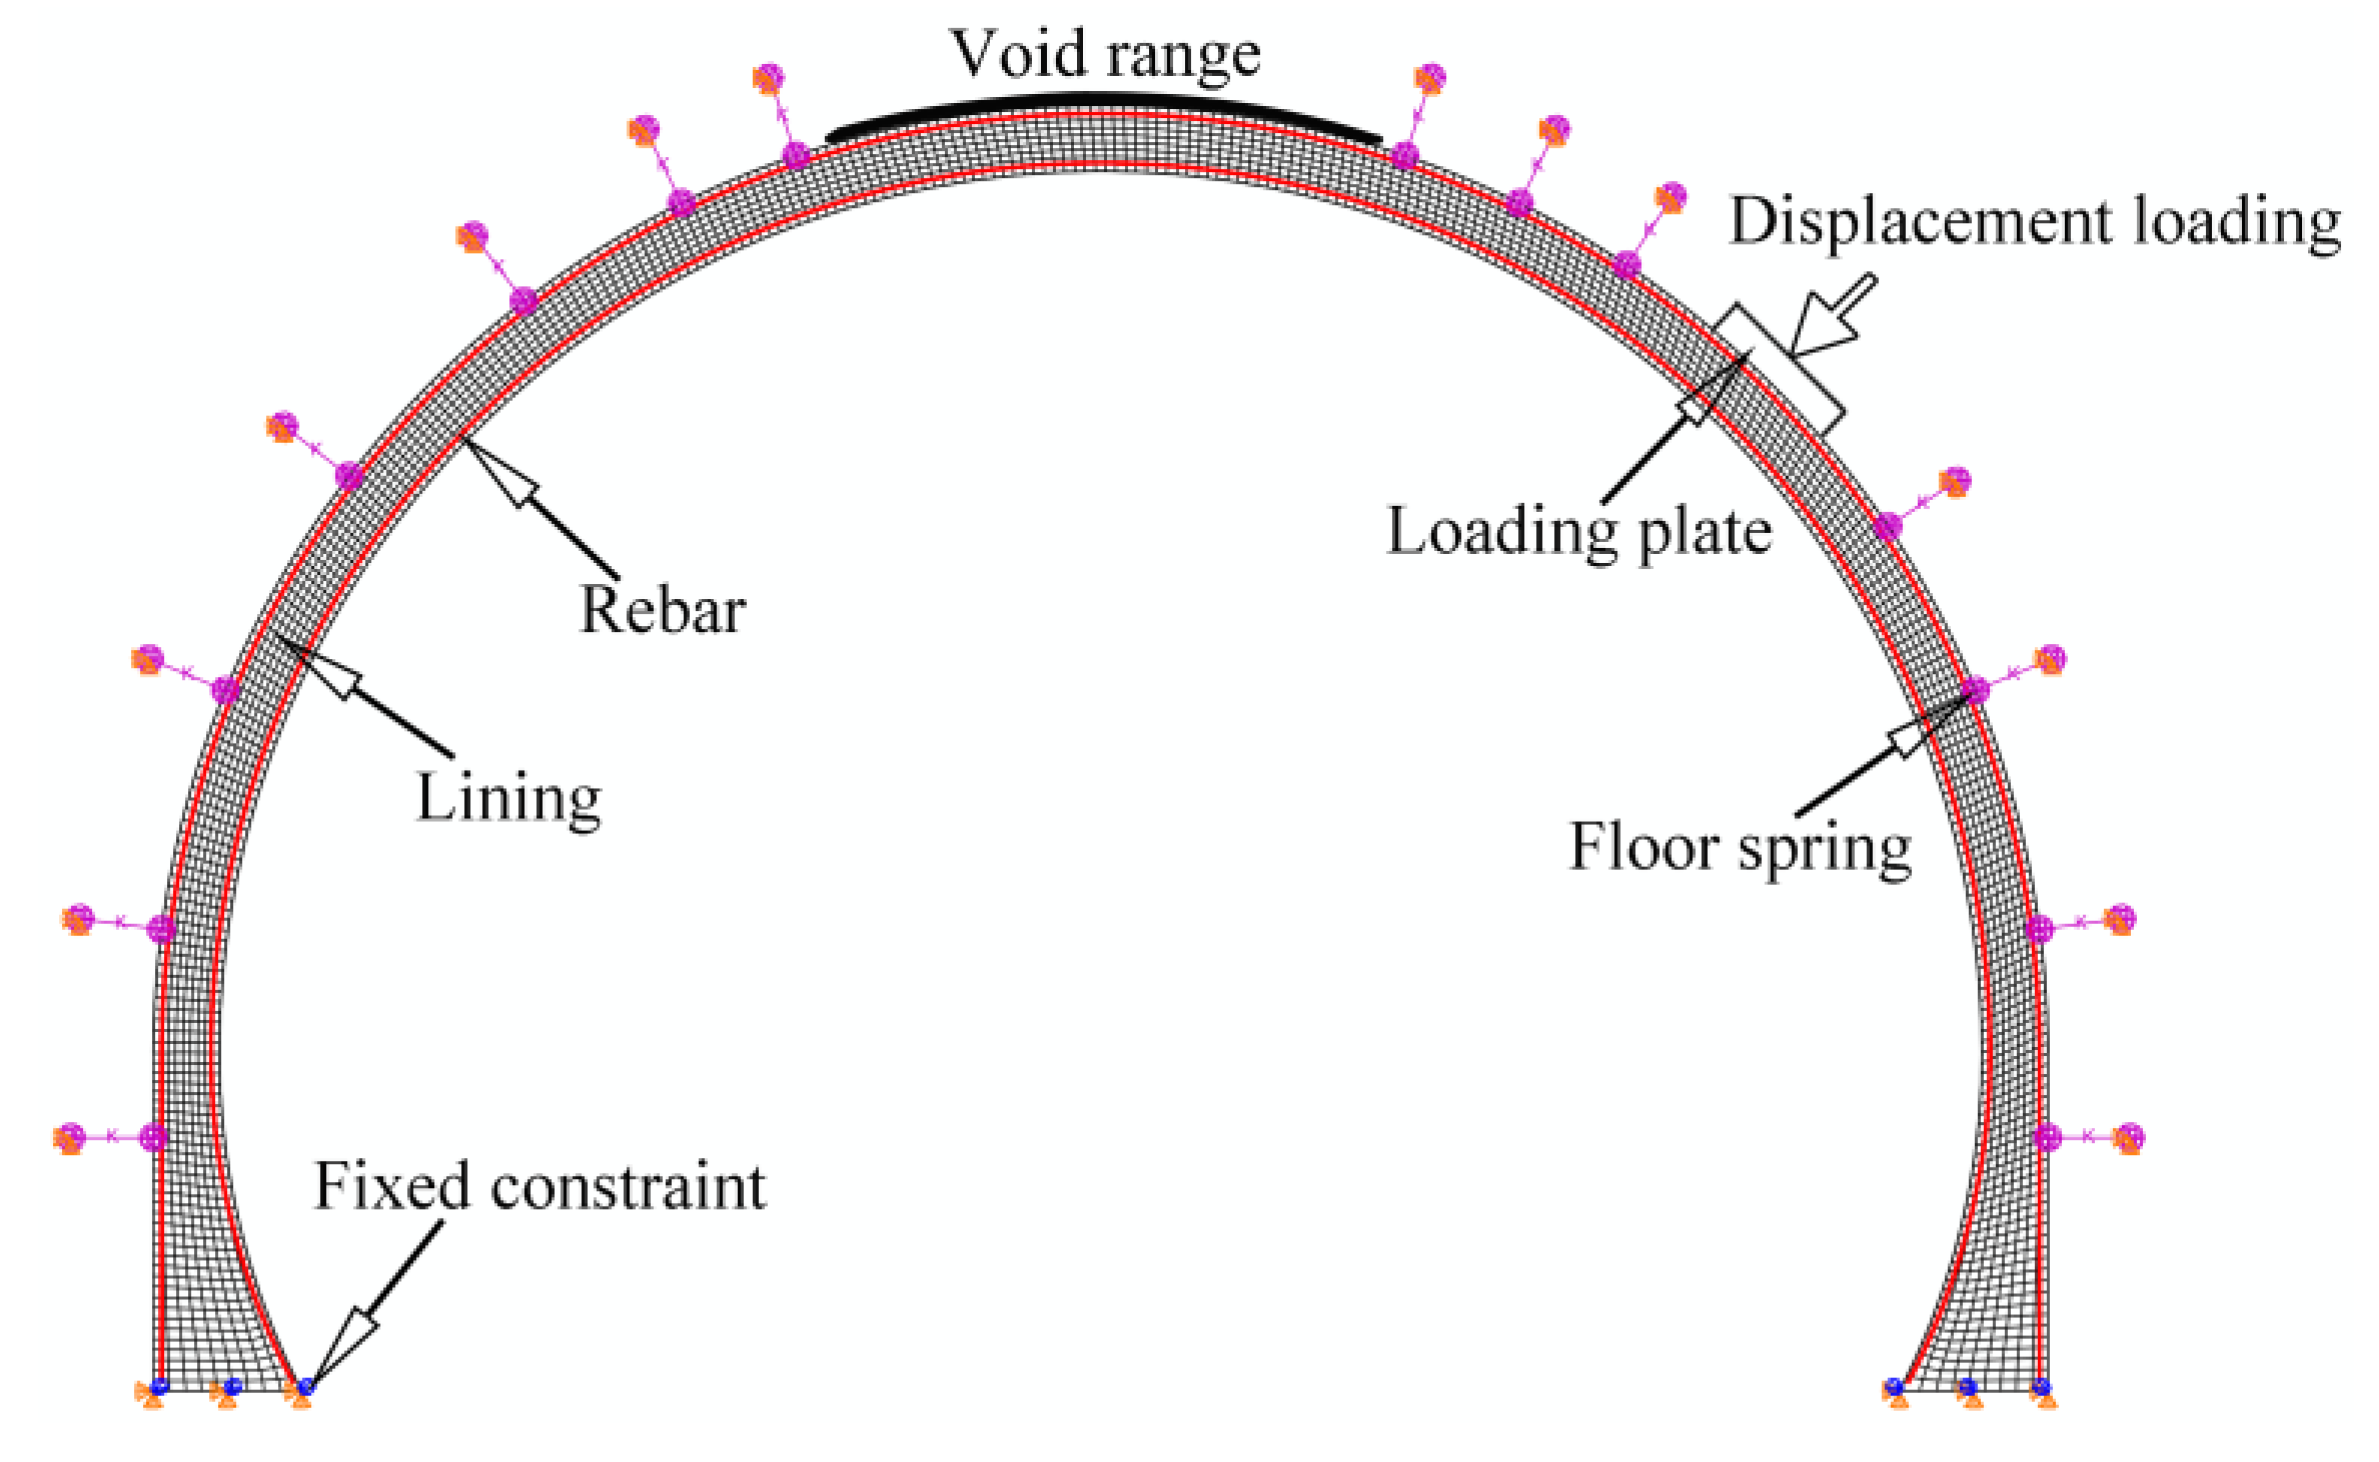
4.2. Structural Computational Model

ABAQUS was used to establish the calculation model for the lining under the five test cases. The lining and the loading plate were simulated by the CDP model and linear elastic model in this numerical model, respectively. Tunnel lining concrete was meshed with 4-node reduced integration quadratic plane strain elements (CPE4R), truss element T2D2 for stimulating the reinforcement bar, and compressive spring element for surrounding rocks. The number of cells of lining and steel bars is 7020 and 1076 respectively for the numerical model with the case of no defects. According to the boundary conditions of model tests, fixed constraints (U1 = U2 = UR3 = 0) were applied at the bottom of the lining and displacement loading was applied. The typical finite element model is shown in Figure 8.

5. Verification of Numerical Models

A comparison of the calculation results of the RC lining with no void under mesh sizes of 5, 10, and 20 mm found that the load–displacement curves and peak loads under the three mesh sizes were close, indicating that the simulation results of lining under different mesh sizes converged. Compared with the 10mm mesh model, the calculation of using the 5 mm mesh model will be time-consuming due to the large number of elements; and that of the 20 mm mesh size will be too rough. Considering the computational efficiency and simulation effect comprehensively, subsequent calculations were performed on 10 mm meshes. The tests and calculation results of the load–displacement responses of lining under different size of voids (Figure 9) show that the shape of the load–displacement curves and the variation with the void ranges were the same. When the size of the void at the crown was 0°, 30°, and 60° (Figure 9a), the peak loads obtained by numerical simulation were 77.0, 64.1, and 37.4 kN, respectively, which were 2.0%, 3.1%, and 6.2% different from the trial values, respectively. When the size of the void at the spandrel was 0° and 60° (Figure 9b), the peak loads obtained by numerical simulation were 80.4 and 46.8 kN, respectively, which were 4.3% and 2.0% different from the trial values, respectively. A comparison of the simulated damage distribution chart (Figure 10) and the experimental damage pattern chart (Figure 6) shows that the failure patterns of the two were consistent and the failure locations of the lining were identical. These findings show that the finite element simulation results are reliable and can reflect the main stress characteristics of the lining considering the influence of the void.
The jump phenomena of the load-displacement curve obtained by numerical simulation were observed in Figure 9. Some physical explanations for jump phenomena were analyzed as follows: (1) The damage model was adopted for the concrete in the numerical simulation. The presence of lining damage leads to the decrease of load carrying capacity, which is manifested by the sudden drop of the curve. With the increase of the surrounding constraints, the bearing capacity of the damaged lining will rise again until the lining is destroyed. Similar jump phenomena of the lining load-displacement curve by using concrete smeared crack model were also obtained in the literature [25]. (2) The bond-slip between steel bars and concrete doesn’t being considered in this paper. As the increase of loading, concrete cracking and steel bars fracture may also cause the jump phenomena.

6. Parameter Analysis

On the basis of the above model tests and numerical models, the three following aspects were discussed for the voids at the crown and spandrel: void size, soil stiffness, and model size effect. (1) The sizes of voids at the crown and spandrel were 0°, 15°, 30°, 45°, and 60°. The 45° oblique load and the 0° horizontal load on both sides (Figure 11a) were investigated for voids at the crown. The 90° vertical load and the 0° horizontal load on both sides (Figure 11b) were investigated for voids at the spandrel. Thus, three typical soil pressures, i.e. loosening vertical soil pressure, unbalanced soil pressure, and horizontal plastic soil pressure, were simulated. (2) The selection of soil stiffness referred to the Code for Design of Railway Tunnel TB-10003-2016 [38]. The analysis used 27.9 (test), 150, 400, and 850 MPa/m to simulate the elastic resistance under different grades of surrounding rocks. (3) The sizes of tunnel lining were analyzed with scale ratios of 1:5, 1:2 and 1:1(full size).

6.1. Effect of Void Location and Size

The load–displacement responses of the lining with different size of voids at the crown and spandrel are shown in Figure 12 and Figure 13, respectively. The relation curves between load carrying capacity of the lining and the void size are shown in Figure 14.
Under the oblique and vertical loads (Figure 12a and Figure 13a), the lining load–displacement curves of different void sizes were similar. However, as the void size increased, the slope of the curve decreased before the peak load, and the peak load and its corresponding displacement also declined. This finding shows that the existence of voids did not change the morphology of the load–displacement curve but reduced the mechanical properties of the lining considerably. Under the horizontal load (Figure 12b and Figure 13b), the lining load–displacement curves of different void sizes were markedly different. With the increase of the void size, the last part of the load–displacement curve showed a sudden drop, and the failure displacement of the lining was small, showing brittle failure characteristics. Compared with that under the oblique and vertical loads, the bearing capacity of the RC lining under horizontal load was considerably higher because the position of the horizontal load was close to the bottom of sidewall, and its restraining effect of the fixed constraint caused the lining to have a larger bearing capacity, smaller failure displacement, and more concentrated failure locations.
Figure 14a shows that the lining bearing capacity decreased linearly with the increase of the void size at the crown. When the void size increased from 0° to 60°, the load carrying capacity at 45° load reduced by 51.3%, and at the horizontal load reduced by 65.1%. In comparison, the bearing capacity of the lining under horizontal load was greatly affected by the void size and the declining rate of the bearing capacity was larger. As the void size at the spandrel increased, the bearing capacity of the lining decreased in a two-stage development (Figure 14b), and the bearing capacity dropped rapidly first and then tended to be flat. With the void size at the spandrel ranging from 0° up to 30°, the bearing capacity under vertical load reduced by 34.3%. While when the void size increased from 30° to 60°, the bearing capacity reduced by only 13.7%. The bearing capacity of the lining under horizontal load was more affected by the void size at the spandrel, which is similar to the case of the void at the crown. Results show that the mechanical behaviors of the lining in the vertical and oblique load were the same. The voids can impair the bearing performance of the lining considerably, but the different location of the voids will have different effects on the bearing capacity of the lining.

6.2. Effect of Soil Stiffness

Soil stiffness has a substantial effect on the mechanical behaviors of the lining [39]. In this paper, combined with the recommended values of the elastic resistance coefficient of the surrounding rocks of Grade III–V [38], four types of soil stiffness such as k = 27.9 MPa/m (test), 150 MPa/m, 400 MPa/m, and 850 MPa/m were selected to analyze the effects of the void on the bearing capacity of the lining with different soil constraints. Taking the vertical and oblique loads as an example, the relation curves between the peak load of the RC lining and the void size under different soil stiffness were obtained, as shown in Figure 15.
Figure 15 shows that under different soil stiffness, the load carrying capacity of the lining decreased with the increase of the void size, but the rates of declining were different. When the soil stiffness was small (k = 27.9 MPa/m), the peak load of the lining was linear with the void size. When the soil stiffness was between 150–850 MPa/m, the peak load of the lining under different void size could be presented as the three-stage development law. When the void size was 0°–15°, the peak load decreased slowly. When the size was 15°–45°, the peak load decreased rapidly. When the size was greater than 45°, the peak load reduced slowly and tended to be flat. Higher soil stiffness corresponded to more apparent three-stage characteristics of the peak load curve of the lining. Taking the void at the crown as an example for the cases of k = 27.9 MPa/m and k = 850 MPa/m, when the void size increased from 0° to 15°, the bearing capacity reduced by 13.8% and 4.8%, respectively; when the void size increased from 15° to 45°, the bearing capacity decreased by 37.5% and 71.1%, respectively; when the void size increased from 45° to 60°, the bearing capacity decreased by 9.7% and 25.4%, respectively. The higher soil stiffness, the influences of the void size on the lining bearing capacity were larger. These findings show that a strong constraint effect around the lining corresponded to considerable loss of the lining bearing capacity once part of the soil constraint was lost. When the void size was greater than 45°, the lining was close to an arched structure on the ground, and its interaction with the surrounding rocks was lost. At this time, the bearing performance of the lining manifested as the self-strength of the concrete structure. Under different soil stiffness, the influence of the void at the spandrel was similar to that at the crown.

6.3. Effect of Tunnel Lining Size

The occurrence of concrete cracks can cause energy dissipation, thereby resulting in size effect. To analyze the size effect on the mechanical properties of RC lining, this calculation simulated three sizes of tunnel lining, namely, 1:5, 1:2, and 1:1 (full size), which obtained the lining load–displacement curve with no void under two load directions, as shown in Figure 16. The load–displacement curves of full-size lining and the relationship between peak load and void size under different void sizes are shown in Figure 17 and Figure 18, respectively.
Figure 16 shows that the load–displacement curves of different lining sizes were similar in shape; as the lining size increased, the peak load and the corresponding displacement increased rapidly and the load carrying capacities of different-sized linings were not size proportional. When the soil stiffness was k = 27.9 MPa/m, compared with 1:5-scale model lining, the bearing capacity of the full-size tunnel lining increased from 80.4 kN to 414.1 kN under vertical load, which increased by 4.2 times, and the corresponding displacement of peak load increased from 45.8 mm to 236.7 mm, which was also 4.2 times higher. Under full-size conditions, the morphology of the lining load–displacement curve (Figure 17) and the variation law of the peak load with void size (Figure 18) under different voids were similar to those of the 1:5-scale model lining. Taking the full-size lining as an example (k = 850 MPa/m), the void size at the crown increased from 0° to 45°, and the lining load carrying capacity reduced from 725.9 kN to 164.8 kN with the drop of 77.3%; the void size increased from 45° to 60° with a slight decrease in bearing capacity. Similarly, the void size at the spandrel increased from 0° to 45° and the bearing capacity of the lining decreased from 978.5 kN to 221.7 kN, which dropped by 78.4%. Later, the change in the void size had a minimal effect on the bearing capacity.

6.4. Analysis of Load-Carrying Capacity Loss Rate of RC Lining Considering the Void

6.4.1. Determination of Regression Equation

The results of model tests and numerical calculations show that the existence of voids weakened the constraint effect of surrounding rocks on the lining and deteriorated the stress state of the lining, resulting in decreased structural bearing capacity. To describe the influence of voids on the bearing capacity of the lining quantitatively, the loss rate of load carrying capacity α was introduced as:
α = 1 P P o
where P is the load carrying capacity of the lining with voids and P o is the load carrying capacity of the lining with no void.
The void size was nondimensionalized for calculation convenience and the void ratio η described the void size, which is expressed as:
η = L V π D
where L V is the arc length corresponding to the void range, and D is the diameter of the lining arch ring.
According to the above definition and combined with the numerical simulation results, the scatterplot of the relationship between the loss rate of lining bearing capacity and the void ratio was obtained, as shown in Figure 18a. The scatter data were fitted by a curve, and the shape was similar to the S-shaped growth curve. Thus, the logistic model was selected to describe the loss rate of bearing capacity of lining under different void ratios, and its expression is as follows [40,41]:
α = a a 1 + ( η / b ) p
where a , b , and p are fitting coefficients; p is a power value and greater than 0.
Figure 19a shows that the variation of bearing capacity loss rate with void ratio is consistent with the fitting result of the logistic model. Further considering the influence of soil stiffness, the scatterplot of the relationship between the loss rate of bearing capacity of lining and soil stiffness was obtained, as shown in Figure 19b. When the void ratio η was less than 0.17, the change in soil constraint had a minimal effect on the loss rate of the bearing capacity. When the void ratio η was greater than 0.17, the loss rate of the bearing capacity increased with the soil stiffness. The fitting found that the power function can describe the relationship between the loss rate of the bearing capacity and the soil stiffness well. The expression is as follows:
α = m k n
where m and n are fitting parameters.
Combining the logistic model with the power function model, the expression of the bearing capacity loss rate of the lining considering the coupling effects of the void ratio and the soil stiffness can be established as follows:
α = [ a a 1 + ( η / b ) p ] m k n

6.4.2. Determination of Model Parameters

Taking the 90° and 45° loads as an example, the Levenberg–Marquardt algorithm was used to fit the calculated data of the voids at crown and at spandrel according to the bearing capacity loss rate model proposed in this paper [42]. The fitting results are shown in Table 3. Under the crown and spandrel voids, the correlation coefficients obtained by the fitting were 0.974 and 0.985, respectively. The results show the good correlation of the fitting results. The model in this paper can describe the changes of the load carrying capacity loss rate with the void ratio and the soil stiffness well. Thus, the influence of voids on the bearing performance of lining under different surrounding rock conditions can be quantitatively evaluated to solve the shortcomings of the existing qualitative evaluation.

7. Conclusions

The 1:5-scale model tests under the crown and spandrel voids obtained the mechanical responses and failure modes of the RC linings. The numerical calculation model of RC lining was established and compared with the experimental results. Sensitivity analysis of void location and size, soil stiffness, and lining size was conducted, and the equation of lining bearing capacity loss rate was established. The main conclusions are as follows:
(1) The existence of voids considerably affected the mechanical behavior of the lining, especially the inelastic period of lining structure. The failure modes of RC linings were similar under different void sizes, but a large void size corresponded to low bearing capacity of the lining, small displacement required to reach the peak load, and large deformation of the lining at the void; the lining at the void was more likely to be destroyed.
(2) The bearing capacity of the lining decreased linearly with the increase of the void size at the crown and decreased rapidly with the increase of the void at the spandrel and tended to change gently in two-stage development. The void size affected the bearing capacity of the lining varied with the void location. The mechanical behaviors of the lining under the vertical and oblique loads were the same and the lining had higher bearing capacity, less failure displacement, and more concentrated damage under horizontal load.
(3) When the soil stiffness was small, the bearing capacity of the lining decreased linearly with the increase in the void size. When the soil stiffness was higher than 150 MPa/m, the bearing capacity of the lining showed a three-stage variation law. High soil stiffness corresponded to the great influence of the void size on the lining bearing capacity.
(4) As the lining size increased, the peak load of the lining and its corresponding displacement increased inconsistently. The full-size and 1:5-scale model linings exhibited similar load–displacement responses and loss laws of the load carrying capacities under different void sizes.
(5) Combining the logistic model and the power function model, the equation of lining bearing capacity loss rate was established to realize the quantitative evaluation of the influence of voids on the bearing capacity of lining under different surrounding rock conditions.

Author Contributions

Z.D. took the problem and wrote the manuscript. X.J. conducted model tests and numerical simulations. X.L. guided the establishment of numerical simulation and revised the manuscript. Z.R. and S.Z. developed test equipment and discussed the result. All authors finalized the manuscript after its internal evaluation.

Funding

This research was funded by the National Natural Science Foundation of China (No. 51768028) and the transportation science and technology project of Yunnan province (No. 2016A01) for providing research funding.

Acknowledgments

The authors are deeply thankful to the reviewers and editor for their valuable suggestions to improve the quality of the paper.

Conflicts of Interest

The authors declare no conflicts of interest.

References

  1. Zhao, Y. Tunnel Design Theory and Method; China Communications Press: Beijing, China, 2018; pp. 16–18. [Google Scholar]
  2. Inokuma, A.; Inano, S. Road tunnels in Japan: Deterioration and countermeasures. Tunn. Undergr. Space Technol. 1996, 11, 305–309. [Google Scholar] [CrossRef]
  3. Wang, H.; Huang, H.; Feng, Y.; Zhang, D. Characterization of Crack and Leakage Defects of Concrete Linings of Road Tunnels in China. J. Risk Uncertain. Eng. Syst. Part A Civ. Eng. 2018, 4, 1–14. [Google Scholar] [CrossRef]
  4. Amorim, D.L.N.F.; Proenca, S.P.B.; Florez-Lopez, J. Simplified modeling of cracking in concrete: Application in tunnel linings. Eng. Struct. 2014, 70, 23–35. [Google Scholar] [CrossRef]
  5. Mashimo, H.; Isago, N.; Kitani, T. Effect of fiber reinforced concrete on shrinkage crack of tunnel lining. Tunn. Undergr. Space Technol. 2006, 21, 382–383. [Google Scholar] [CrossRef]
  6. Vallini, P.; Chiaia, B.; Fantilli, A.P. Evaluation of crack width in FRC structures and application to tunnel linings. Mater. Struct. 2009, 42, 339–351. [Google Scholar]
  7. Gao, Y.; Jiang, Y.; Li, B. Voids delineation behind tunnel lining based on the vibration intensity of microtremors. Tunn. Undergr. Space Technol. 2015, 51, 338–345. [Google Scholar] [CrossRef]
  8. Huang, H.W.; Liu, D.J.; Xue, Y.D. Numerical analysis of cracking of tunnel linings based on extended finite element. Chin. J. Geotech. Eng. 2013, 35, 266–275. [Google Scholar]
  9. Empel, W.H.N.C.V.; Sip, J.W.; Haring, F.P. Design of repair measures of a damaged shield driven tunnel. Tunn. Undergr. Space Technol. 2006, 21, 338–339. [Google Scholar] [CrossRef]
  10. Pintado, X.; Barragán, B.E. Homogeneity of self-compacting concretes used in tunnel strengthening—A case study. Tunn. Undergr. Space Technol. 2009, 24, 647–653. [Google Scholar] [CrossRef]
  11. Zhang, S.L.; Zhang, D.L.; Liu, S.C. Discovering the main causes of tunnel lining damage based on correspondence analysis model. China Railw. Sci. 2012, 33, 54–58. [Google Scholar]
  12. Wang, Z.Z.; Jiang, Y.J.; Zhu, C.A. Shaking table tests of tunnel linings in progressive states of damage. Tunn. Undergr. Space Technol. 2015, 50, 109–117. [Google Scholar] [CrossRef]
  13. Leung, C.; Meguid, M.A. An experimental study of the effect of local contact loss on the earth pressure distribution on existing tunnel linings. Tunn. Undergr. Space Technol. 2011, 26, 139–145. [Google Scholar] [CrossRef]
  14. Yasuda, Y.; Tsukada, K.; Asakura, T. Elastic solutions for circular tunnel with void behind lining. Tunn. Undergr. Space Technol. 2017, 70, 274–285. [Google Scholar] [CrossRef]
  15. Wang, J.F.; Huang, H.W.; Xie, X.Y. Void-induced liner deformation and stress redistribution. Tunn. Undergr. Space Technol. 2014, 40, 263–276. [Google Scholar] [CrossRef]
  16. Peng, Y.; Wang, G.L.; Zhang, Y.X. Research about effect of cavity behind lining on structural safety of tunnel in active service. Chin. J. Undergr. Space Eng. 2008, 4, 1101–1104. [Google Scholar]
  17. Meguid, M.A.; Dang, H.K. The effect of erosion voids on existing tunnel linings. Tunn. Undergr. Space Technol. 2009, 24, 278–286. [Google Scholar] [CrossRef]
  18. Zhang, X.; Zhang, C.P.; Feng, G. Experimental studies on effect of voids behind tunnel linings on progressive failure process of tunnel structures. Chin. J. Geotech. Eng. 2017, 39, 1137–1144. [Google Scholar]
  19. Mashimo, H. State of the road tunnel safety technology in Japan. Tunn. Undergr. Space Technol. 2002, 17, 145–152. [Google Scholar] [CrossRef]
  20. Min, B.; Zhang, X.; Zhang, C.; Gong, Y.; Yuan, T. Mechanical behavior of double-arch tunnels under the effect of voids on the top of the middle wall. Symmetry 2018, 10, 703. [Google Scholar] [CrossRef]
  21. Okano, N. Development of a testing machine with a large tunnel lining model. Railw. Technol. Avalanche 2007, 19, 110. [Google Scholar]
  22. Huang, X.; Zhu, Y.; Zhang, Z. Mechanical behaviour of segmental lining of a sub-rectangular shield tunnel under self-weight. Tunn. Undergr. Space Technol. 2018, 74, 131–144. [Google Scholar] [CrossRef]
  23. Ding, Z.D.; Fu, J.; Li, X.Q. Mechanical behavior and its influencing factors on engineered cementitious composite linings. Adv. Mater. Sci. Eng. under review.
  24. Ding, Z.D.; Wen, J.C.; Li, X.Q.; Fu, J.; Ji, X.F. Mechanical behaviour of polyvinyl alcohol-engineered cementitious composite (PVA-ECC) tunnel linings subjected to vertical load. Tunn. Undergr. Space Technol. under review.
  25. He, W.; Wu, Z.; Kojima, Y. Failure mechanism of deformed concrete tunnels subject to diagonally concentrated loads. Comput.-Aided Civ. Infrastruct. Eng. 2010, 24, 416–431. [Google Scholar] [CrossRef]
  26. Yashiro, K.; Hirata, R.; Okano, N. Study on deformation and failure behavior of mountain tunnel linings which consist of various materials. J. Jpn. Soc. Civil Eng. Ser. F1 2015, 71, 78–94. [Google Scholar]
  27. Yuan, W.Z. Similarity Theory and Static Model Test; Southwest Jiaotong University Press: Leshan, China, 1998. [Google Scholar]
  28. Lee, J.; Fenves, G.L. Plastic-damage model for cyclic loading of concrete structures. J. Eng. Mech. 1998, 124, 892–900. [Google Scholar] [CrossRef]
  29. Lubliner, J.; Oliver, J.; Oller, S. A plastic-damage model for concrete. Int. J. Solids Struct. 1989, 25, 299–326. [Google Scholar] [CrossRef]
  30. Ministry of Housing and Urban-rural Development of the People’s Republic of China. GB50010-2010, Code for Design of Concrete Structures; China Architecture and Building Press: Beijing, China, 2011.
  31. Hordijk, D.A. Tensile and tensile fatigue behaviour of concrete; experiments, modelling and analyses. Heron 1992, 37, 1–79. [Google Scholar]
  32. Betonbau. Fib Model Code for Concrete Structures; Wiley: Hoboken, NJ, USA, 2013. [Google Scholar]
  33. Oller, J.A. Continuous Damage Model for Frictional Materials. Ph.D. Thesis, Technical University of Catalonia, Catalonia, Spain, 1998. [Google Scholar]
  34. Cao, M. Research on damage plastic calculation method of ABAQUS concrete damaged plasticity model. Transport. Res. 2012, 2, 51–54. [Google Scholar]
  35. Cai, J.M.; Pan, J.L.; Yuan, F. Experimental and numerical study on flexural behaviors of steel reinforced engineered cementitious composite beams. J. Southeast. Univ. 2014, 30, 330–335. [Google Scholar]
  36. Zhou, J.J.; Pan, J.L.; Leung, C.K.Y. Mechanical behavior of fiber reinforced engineered cementitious composites in uniaxial compression. J. Mater. Civ. Eng. 2015, 27, 1–10. [Google Scholar] [CrossRef]
  37. Yuan, F.; Pan, J.L.; Wu, Y.F. Numerical study on flexural behaviors of steel reinforced engineered cementitious composite (ECC) and ECC/concrete composite beams. Sci. China-Technol. Sci. 2014, 57, 637–645. [Google Scholar] [CrossRef]
  38. TB10003-2016, Code for Design on Tunnel of Railway; China Railway Publishing House: Beijing, China, 2016.
  39. Bazant, Z.P. Size effect in blunt fracture: Concrete, rock, metal. J. Eng. Mech. 1984, 110, 518–535. [Google Scholar] [CrossRef]
  40. Yang, T.; Li, G.W.; Yang, W.Q. Settlement prediction of stage construction embankment on soft ground based on the hyperbola method. Rock Soil Mech. 2004, 25, 1551–1554. [Google Scholar]
  41. Xu, H.Z.; Shi, B.; Li, X.H. Logistic growth model and its applicability for predicting settlement during the whole process. Rock Soil Mech. 2005, 26, 387–391. [Google Scholar]
  42. Kleefeld, A.; Martin, R. The Levenberg-Marquardt method applied to a parameter estimation problem arising from electrical resistivity tomography. Appl. Math. Comput. 2011, 217, 4490–4501. [Google Scholar] [CrossRef]
Figure 1. Schematic illustration of the testing setup (unit: mm): (a) Vertical loading; (b) oblique loading.
Symmetry 11 00802 g001
Figure 2. Common soil pressure modes causing deformation and failure of lining: (a) Void at crown, oblique loading (45°); (b) void at spandrel, vertical loading (90°).
Symmetry 11 00802 g002
Figure 3. Geometry and reinforcement configuration details of lining member (unit: mm).
Symmetry 11 00802 g003
Figure 4. Test arrangements.
Symmetry 11 00802 g004
Figure 5. Load-displacement responses: (a) Void at the crown; (b) void at spandrel.
Symmetry 11 00802 g005
Figure 6. State of cracking, deformation, and failure patterns: (a) Photographs of the deformation and the cracks distribution void size 30° at the crown; (b) photographs of the deformation and the cracks distribution void size 60° at the spandrel (c,d,e); failure patterns of lining with void at the crown, (f); and (g) failure patterns of lining with void at the spandrel.
Symmetry 11 00802 g006aSymmetry 11 00802 g006b
Figure 7. Stress–strain relationship of steel bars.
Symmetry 11 00802 g007
Figure 8. Numerical model.
Symmetry 11 00802 g008
Figure 9. Load-displacement responses: (a) Void at the crown; (b) void at the spandrel.
Symmetry 11 00802 g009
Figure 10. Deformation and damage distribution of tunnel lining: (a) Void size 0° at the crown; (b) void size 30° at the crown; (c) void size 60° at the crown; (d) void size 0° at the spandrel; (e) void size 60° at the spandrel.
Symmetry 11 00802 g010aSymmetry 11 00802 g010b
Figure 11. Void location and loading direction: (a) at the crown; (b) at the spandrel.
Symmetry 11 00802 g011
Figure 12. Load-displacement responses with different void sizes at the crown: (a) Oblique loading (45°); (b) horizontal loading (0°).
Symmetry 11 00802 g012
Figure 13. Load-displacement responses with different void sizes at the spandrel: (a) Vertical loading (90°); (b) horizontal loading (0°).
Symmetry 11 00802 g013
Figure 14. Lining load carrying capacity with void size: (a) Void at the crown; (b) void at the spandrel.
Symmetry 11 00802 g014
Figure 15. Peak load-void size curves of the lining under different soil stiffness: (a) Void at the crown; (b) void at the spandrel.
Symmetry 11 00802 g015
Figure 16. Load-displacement curves at different scales: (a) Vertical loading (90°); (b) oblique loading (45°).
Symmetry 11 00802 g016
Figure 17. Load-displacement curves for different void sizes (full size): (a) Void at the crown; (b) void at the spandrel.
Symmetry 11 00802 g017
Figure 18. Peak load-void size curves of the lining under different soil stiffness (full size): (a) Void at the crown; (b) void at the spandrel.
Symmetry 11 00802 g018
Figure 19. Relationships of loss rate of load carrying capacity and void ratio and subgrade stiffness: (a) Void ratio; (b) subgrade stiffness.
Symmetry 11 00802 g019
Table 1. Values of the plastic parameters for concrete plastic damage (CDP) model.
Dilation Angle/ψEccentricity/eThe Ratio of Yield Stress fb0/fc0The Ratio of the Second Stress Invariant on the Tensile meridian/KViscosity Parameter/ν
30°0.11.160.6671 × 10−5
Table 2. Physical and mechanical parameters of steel.
Elastic Modulus
Es/GPa
Poisson Ratio
μ
Yield Strength
fy/MPa
Yield Strength
Tensile Strain
εy
Ultimate Strength
fu/MPa
Ultimate Tensile Strain
εu
2000.33000.016754200.025
Table 3. Fitting parameters of lining bearing capacity loss rate.
Fitting ParametersabpmnR2
Void at the crown0.5070.1802.2591.3330.0670.974
Void at the spandrel0.5470.1422.8710.9210.0750.985

