Article

Missing Data Calculation Using the Antioxidant Activity in Selected Herbs

by
Donatella Bálint
1,* and
Lorentz Jäntschi
1,2,*
1
Faculty of Chemistry and Chemical Engineering, Babeş-Bolyai University, 11 Arany Janos, 400082 Cluj-Napoca, Romania
2
Technical University of Cluj-Napoca, Department of Physics and Chemistry, 103-105 Muncii Blvd., 400641 Cluj-Napoca, Romania
*
Authors to whom correspondence should be addressed.
Symmetry 2019, 11(6), 779; https://doi.org/10.3390/sym11060779
Submission received: 21 May 2019 / Accepted: 5 June 2019 / Published: 12 June 2019

Abstract

:
In this paper, a model has been developed that can estimate the composition of the phenol compounds, based on censored data and the total equivalent antioxidant capacity (TEAC) measured by three different methods. A contingency of 32 plants was analyzed: total phenolic content (TPC), caffeic acid, p-coumaric acid, ferulic acid, neochlorogenic acid and TEAC. They were measured by three different methods: ABTS (2,20-azinobis-(3-ethylbenzthiazoline- 6-sulfonic acid)), DPPH (1,1-diphenyl-2-picrylhydrazyl radical) and FRAP (ferric reducing/antioxidant power). Five values of caffeic-, thirteen of p-coumaric-, seven of ferulic-, and nineteen neochlorogenic acids were missing. Due to the complexity of the compounds, data mining and computational methods are required to determine the missing data. The method developed for independent variables was used to estimate the missing data. The contingency was filled with the calculated values obtained with all alternatives. The performance of each approach is shown in the estimation and/or prediction of the phenolic composition compared to the approaches used. The results indicated a strong correlation and mutual influence between the data analyzed.

1. Introduction

Plants (fruits, vegetables, herbs, etc.) contain a wide variety of free radical scavenging molecules such as phenolic compounds (e.g., phenolic acids, flavonoids, quinones), nitrogen compounds (e.g., alkaloids, amines), vitamins and terpenoids [1,2,3].
These natural products [4] are used to provide proactive support to various physiological systems. They can cure or prevent diseases (atherosclerosis, cancer, diabetes, degenerative diseases) [5,6].
Natural antioxidants can help preventing oxidation and regulate the immune function [7]. Overproduction of free radicals can cause oxidative damage to biomolecules. This can ultimately lead to many chronic and acute illnesses. Nowadays, examining the antioxidant capacity of plants has become an important subject [8].
Phenolic compounds are the subject to various studies because of their antioxidant activity. These chemical compounds have a complex structure, with multiple aromatic rings in the same molecule. Antioxidant activity can be measured by different methods. The most commonly used methods are ABTS (2,20-azinobis-(3-ethylbenzthiazoline- 6-sulfonic acid)) and DPPH (1,1-diphenyl-2-picrylhydrazyl radical). Several studies compare the methods of determining the antioxidant effect to find the most accurate one [9,10].
Managing missing data is a common challenge in all areas of science. In recent years, serious research has been carried out on the analysis of censored data. To make the best use of existing data without adding or deleting, methods of data mining based on the missing dataset have also been proposed [11]. For example, after reviewing 100 articles from cancer magazines, 81 of them included analyzes with missing covariate data [12]. There are many possibilities to estimate missing values. Popular approaches include regression (conditional mean) and variants of nearest neighbor matching. The imputation methods confirm the initial estimation equation with an imputation model. This way they predict the value of missing data. After replacing the missing data with estimated values, the original model is assessed based on the total sample.
Regression imputation receives predicted values for missing data based on total observations. The estimated regression function is calculated using the assumed conditional average. Nearest neighbor matching is done by replacing the missing data based on “closest” values [13].
The χ2 test was introduced by Karl Pearson [14]. It is used to determine whether the analyzed data is identically distributed across different populations/sub-groups of the same population [15,16]. Two significant modifications to Pearson’s test were introduced by Ronald Aylmer Fisher [17]. First, the degree of freedom was decreased by one unit when applied to a contingency table. The other considered the number of unknown parameters associated with the theoretical distribution. The parameters are estimated from central moments [18]. The Chi-square test has been applied in all research areas, its main uses being goodness-of-fit [19], association/independence [20], homogeneity [21] or classification [22,23].
The correlation coefficient is a statistical measure of the relationship between one dependent and one or more independent variables [24]. Several correlation coefficients based on different statistical hypothesis are known and frequently used: Pearson correlation coefficient, Spearman rank correlation coefficient and semi-quantitative correlation coefficient, Kendall tau-a, -b and -c correlation coefficients, Gamma correlation coefficient [25].
There is no guidance on managing censored values or missing data methods. In this paper, we have developed an iterative algorithm that can identify the most likely missing values of the phenolic content (predictive power).
The rest of the paper is organized as follows. In Section 2, the proposed methods are explained. Section 3 covers the obtained results and their discussion. Finally, Section 4 draws general conclusions.

2. Materials and Methods

2.1. Measurement Methods

The antioxidant activity of the 32 selected herbs was reported by Wojdyło et al. 2007 [26]. All plant materials (0.5 kg each sample) were collected in 2005 by Polish Pharmaceutical Enterprises ‘‘JURBOAGRO” from Grabowo Wielkie. We used this research as the input data for our study (Table S1-Supplementary Material).
Phenolic acids were the subject of many studies because of their antioxidant activity [27,28,29]. The total antioxidant capacity expressed as TEAC was estimated by the following methods: ABTS, DPPH and ferric reducing/antioxidant power (FRAP) [30]. DPPH radical-scavenging activity was determined using the method [31]. The free radical-scavenging activity was determined by ABTS radical cation decolorization assay [32].
The DPPH free radical (DPPH) does not require any special preparation, while the ABTS radical cation (ABTS•+) must be generated by enzymes or chemical reactions [33]. The FRAP method is based on the reduction of a ferroin analog. Total polyphenol content was measured using Folin-Ciocalteu colorimetric method [34]. The results were corrected for dilution and expressed in μM Trolox per 100 g dry weight.
Four phenolic acid compounds were identified in the PubChem Compound Database. Further, the compounds are associated with their CID (the permanent compound identifier for a unique chemical structure) number for more simple use, as: caffeic acid-689043 [35], p-coumaric acid-637542 [36], ferulic acid-445858 [37] and neochlorogenic acid-5280633 [38]. Further analysis can be conducted strictly with the chemical structure of the compounds, but they require more investigations.

2.2. Primary Data

The results [26], our input data, with the missing places (in red) are presented in Table S1 (see Supplementary Material).
Table S1 lists the results of a quantitative analysis of the major phenolic compounds identified in the 32 herbs. The mean values are associated with the standard deviations calculated after the analysis.

2.3. Evaluation Methods

The method reported by Jäntschi [39] was adapted and modified to our experimental values. Homemade *.php programs were used to do all the calculations. The relationship between the four chemical compounds and their antioxidant activity (Table 1) using the Chi-square (χ2) test was investigated.
The values regarding the antioxidant activity and the phenolic compounds were transformed to logarithmic ones. The χ2 method requires normally distributed data. This method is preferred because it is a natural transformation that also appears in the environment (e.g., pH determination). The nature of the plants, the compounds structure and the antioxidant activity are influencing each other.
The steps applied in our missing data analysis were as follows (Figure 1):
  • Check that the linearity between antioxidant activity and phenol content is true of the experimental data in the analysis.
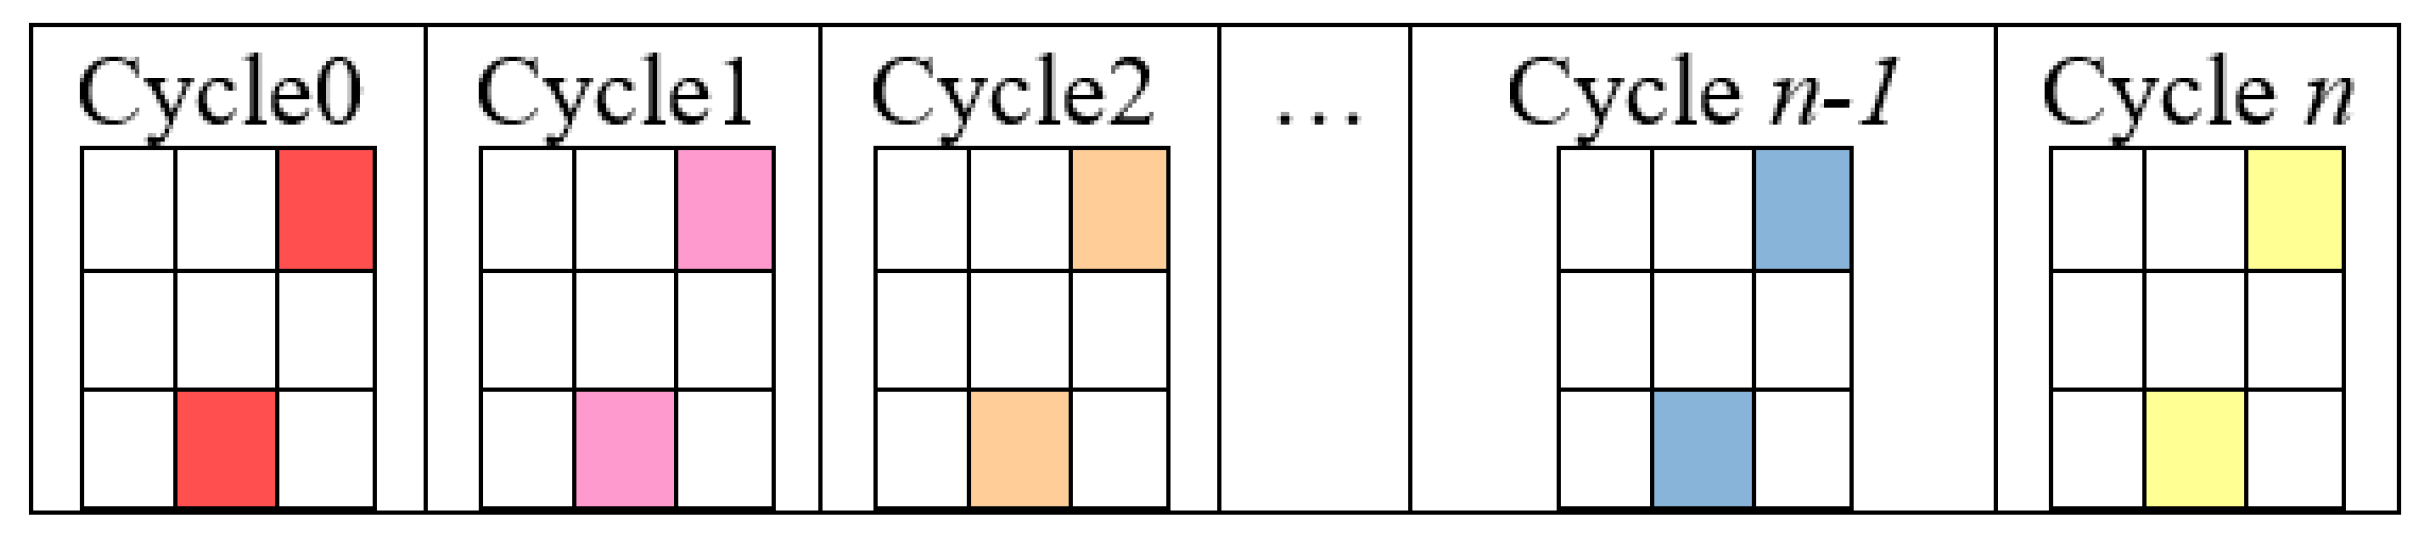
  • Three alternatives were taken into consideration. The experimental values were introduced in the algorithm in the first step.
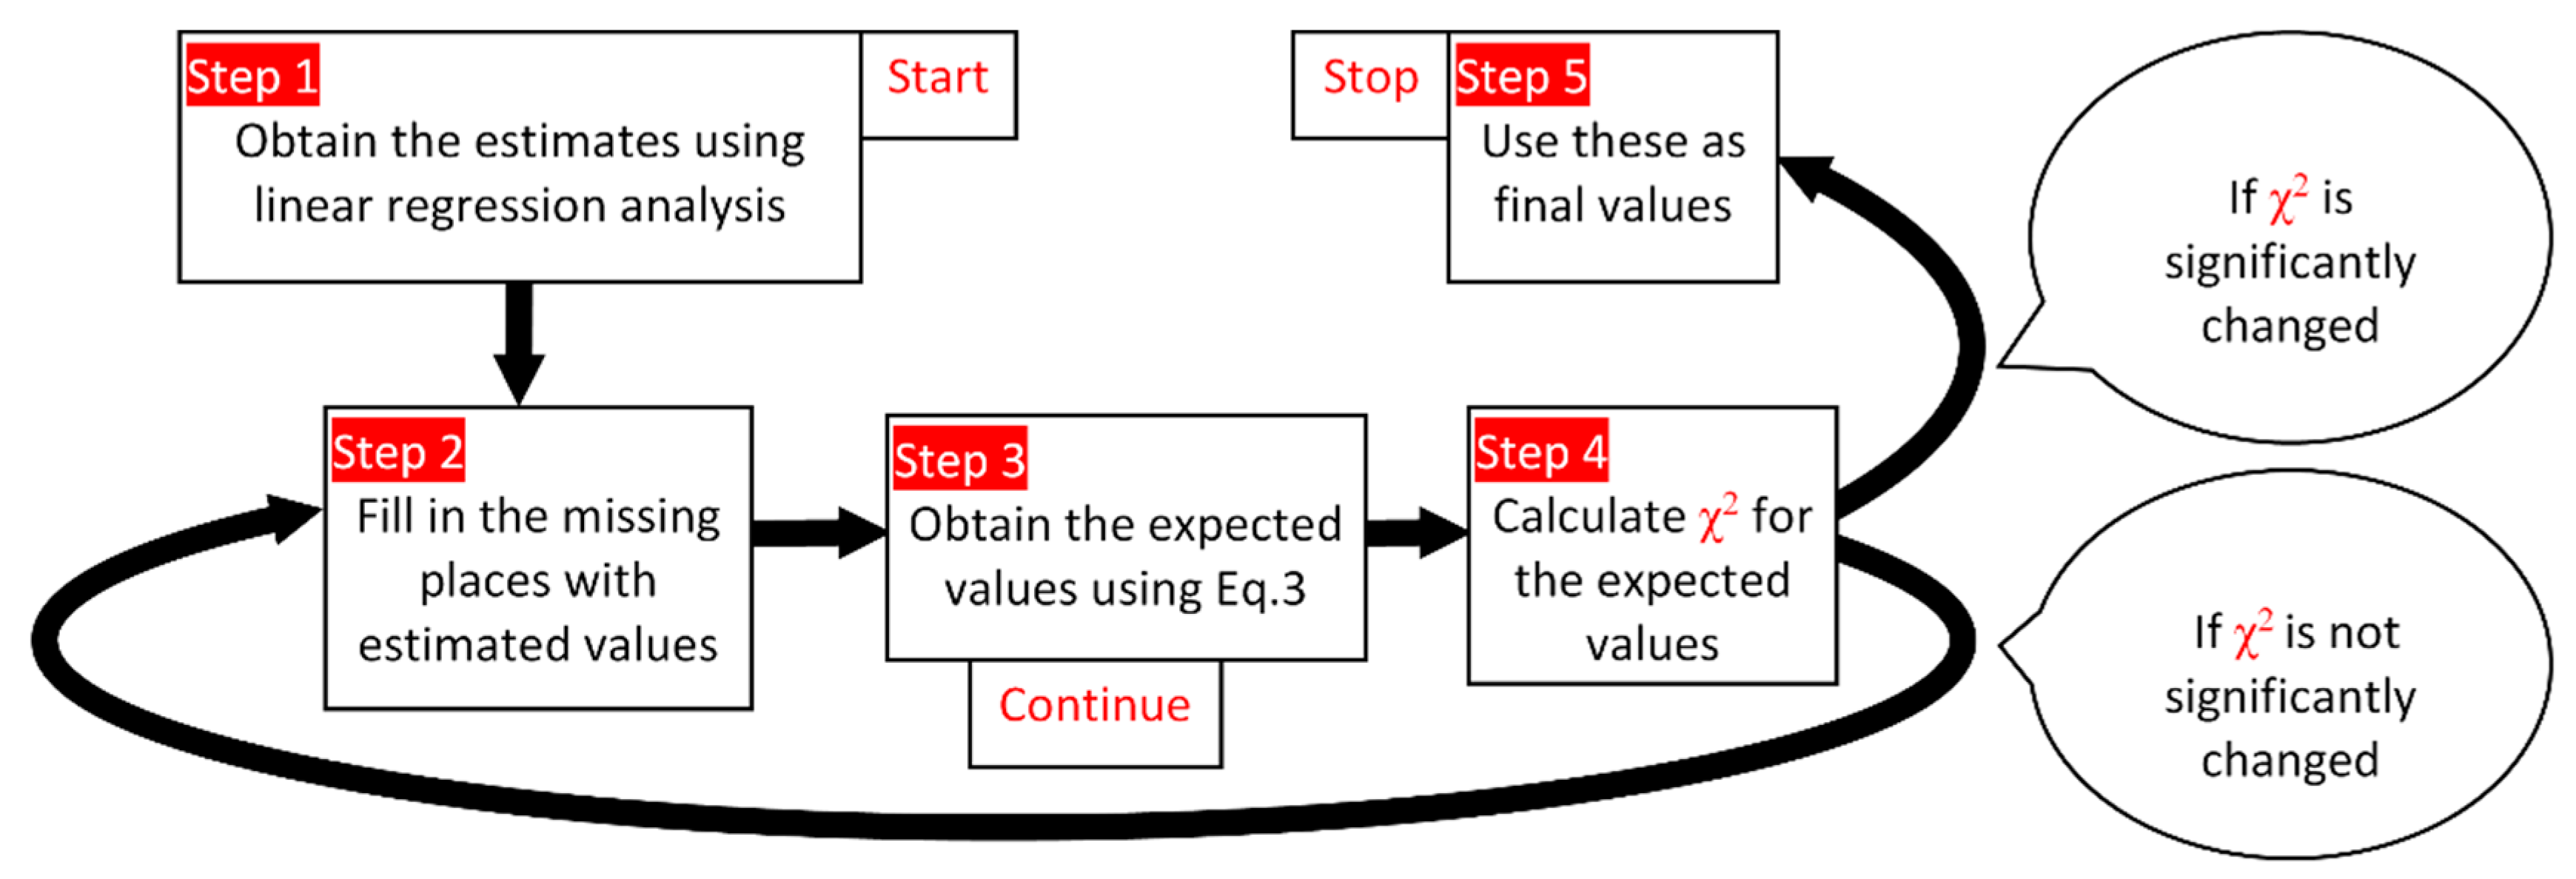
  • Obtaining the coefficients using linear regression analysis (Equations (1) and (2)); using these to make estimations in the first cycle.
  • Fill in the missing places with estimated values.
  • Repeat:
    • Obtain (new) expected values (Equation (3))
    • Calculate χ2 using observed and expected values
    • Insert in the missing places the (new) expected values
    • Until the value of χ2 is not significantly changed (e.g., convergence)
In step 1, using linear regression analysis model function (Equation (1)), the linearity is verified; the regression coefficients are calculated (Equation (2)):
y = α +   β x
where, β is the slope of the line and α is the intercept.
The value of α and β can be defined as:
α = y ¯ β x ¯ β = i = 1 n ( x i x ¯ )   ( y i y ¯ ) i = 1 n ( x i x ¯ ) 2
where, and y ¯ as the average of the xi and yi; n is the number of points taken into consideration, {(xi, yi), i = 1, …, n}.
After filling the missing places with values (step 2), the next mathematical model (Equation (3)) was applied to estimate the phenolic content. This was calculated based on available experimental data and estimated values (step 3).
E i , j = ( j = 1 n O i , j ) · ( i = 1 m O i , j ) i = 1 m j = 1 n O i , j
where, Oi,j = mean of the observed value for (i,j) pair of factors; Ei,j = mean of the expected value for (i,j) pair of factors; X2 = the value of Chi-square statistic; m = number of rows; n = number of columns ; 1 ≤ i ≤ m = indices of observations associated to the first factor; 1 ≤ j ≤ n = indices of observations associated to the second factor.
One hypothesis is that the Oi,j observations are the result of multiplying two factors (repeated observations approximate better the effect of multiplication) [40].
Three mathematical assumptions could be formulated in terms of square error ((Oi,j − Ei,j)2) of observation. The measurement is affected by chance errors:
  • on a scale with values (X2, Equation (4)) between absolute and relative errors (step 4);
  • absolute values (S2, Equation (5));
  • relative values (Cv2, Equation (5));
In our study, the first hypothesis (minimization of the χ2 statistic) (Equation (4)) was used:
X 2 = i = 1 r j = 1 c ( O i , j E i , j ) 2 E i , j = min .
Two other hypotheses exist: the minimization of the variance (S2) obtained between the model and the observation; and minimization of the squared coefficient of variation (Cv2):
S 2 = i = 1 r j = 1 c ( O i , j E i , j ) 2 = min . Cv 2 = i = 1 r j = 1 c ( O i , j E i , j ) 2 ( E i , j ) 2 = min .
where 1 ≤ i ≤ r = contribution of the first factor to the expected value Ei,j; 1 ≤ j ≤ c = contribution of the second factor to the expected value Ei,j;
A graphical representation of the algorithm cycles is presented in Figure 2. The variation of the colors suggests the modification of the values in the missing places (in red). Each cycle also includes a whole set of estimates and expected values, X2 calculations. Different colors indicate changes in data in missing places; these reach their final values in the Cycle n, after X2 is not significantly changed compared to Cycle n1.
Using this method, three alternatives were applied to complete the missing places in Table S1 (See Supplementary Material). The first option is to use the ABTS values, the second the DPPH values and the third the FRAP values to estimate the phenolic acid content. The hypothesis lay on the presumption that each value from the columns influences each value from the rows.
After fulfilling the missing places from Table 1, correlation coefficients were calculated (Pearson, Spearman, semi-quantitative, see below).
The following formula was used to calculate Pearson’s quantitative correlation:
cov   ( Y , Y ^ ) = i = 1 n ( y i y ¯ ) ( y ^ i y ^ ¯ )
r Prs ( Y ,   Y ^ ) = cov   ( Y ,   Y ^ ) cov   ( Y , Y ) cov   ( Y ^ ,   Y ^ )
where, rPrs = the Pearson correlation coefficient; n = number of samples; datasets {y1 … yn} containing n values and another dataset { y ^ 1 y ^ n} containing n values.
Using Equation (6), the strength and direction of the linear relationship between two quantitative variables are measured. This way we described the direction and degree to which one variable is linearly related to another [41]. Student t-test was used to determine if the value of the Pearson correlation coefficient is statistically significant, at a significance level of 5%.
Spearman’s qualitative rank correlation (Equation (7)) explains a non-parametric measure of the correlation between variables. It represents how well an arbitrary monotonic function could describe the relationship between two variables, without making any assumptions about their frequency distribution [42].
Spearman’s coefficient is appropriate for both continuous, ordinal and discrete variables.
r Spm ( Y , Y ^ ) = r Prs ( Rk ( Y ) , Rk ( Y ^ ) )
where rSpm = the Spearman rank correlation coefficient; n- number of samples; Rk(Y), Rk( Y ^ ) = the rank of the datasets {y1 … yn} containing n values and another dataset { y ^ 1 y ^ n} containing n values.
Also, semi-quantitative coefficient (Equation (8)) was calculated:
r Sq 2 ( Y ,   Y ^ ) = r Prs ( Y ,   Y ^ ) · r Spm ( Y ,   Y ^ )
where rSq = semi-quantitative correlation coefficient.
The semi-quantitative coefficient is a combination between Pearson’s quantitative and Spearman’s rank qualitative coefficient.
These coefficients were calculated to quantify the degree of the monotonic non-linear inference (such as sigmoidal extremal deviations).

3. Results and Discussion

The TEAC experimental values were excluded from further calculations because their χ2 were outliers. The experimental data from the plant Acorus calamus was excluded due to its outlier χ2 results (Table 1 see below). The four phenolic acids relationship with the antioxidant capacity in the remained plants were analyzed.
Table S1 (see Supplementary Material) shows the observed experimental values (obs.), the estimated, which fill the missing places (in bold), and the expected values (exp.) calculated from the regression. The values are the results of the analysis following the logarithmic transformation of the data.
Note that the values of each plant are representative because the experimental data and the set values are evolving in the same direction. The results do not indicate whether phenolic acid accurately determines the antioxidant activity. Each compound has a role in the delivery of its effect.
After collecting the results, correlation analysis was made to decide which phenolic compound influence the antioxidant activity. The statistical analysis was necessary because each phenolic acid contributes to the antioxidant capacity in a different measure.
The correlation coefficients calculated based on Equations (6)–(8), are included in Table 2 (see below). They revealed that the difference between Pearson’s and Spearman’s correlation coefficient was not notable. Both almost have the same significance. The only difference is that Spearman’s correlation uses ranks instead of x and y values that are used by Pearson.
In Table 2, the correlation coefficients indicated a strong correlation between the results. The coefficients can take values between −1 and +1. In this case, the average value of 0.75 showed that the variables are linearly related by an increasing relationship. The Student’s t-test revealed that there is a statistically significant linear relationship between the variables. Each correlation coefficient explains a measure of association between variables. Also describes the relationship between the two of these. When the difference between them is not significant, each coefficient evolves in the same direction.
X2 as a function of iteration was also investigated after running the algorithm. This showed, as the statistical analysis, that the variables are close to each other. The evolution of X2 as a function of iteration is presented in the next Figure 3.
After implying the algorithm (Figure 1) on the experimental data set, the resulted values of the X2 fast converged to a minimum after different numbers of cycles. The minimum was reached within a few iterations.
A non-significant difference between consecutive X2 values led to the stop of the algorithm. 12 iteration in case of ABTS, 10 iterations in case of DPPH, and 11 iterations in case of FRAP values were observed.
Other possibilities to fill the contingency table such as Monte Carlo methods were reported in the scientific literature. The basic idea of most Monte Carlo simulations is to iteratively propose a small random change in a configuration [42]. One of the Monte Carlo methods would fit our data set, the Bootstrap method. This method gives the estimates from a repeated resampling with replacement [43,44]. Taking into consideration the Monte Carlo methods, the results from these would not give additional information according to the variables. Also, a disadvantage of the Bootstrap method is that ignores the known variables, even if a linear relationship exists between them. The contingency table with our presented method is filled once, and after that, the X2 operates on the variables. With the Monte Carlo methods, the table is filled several times, modifying the original variables.
Multiple studies [1,3,4,26,27] provided complex and diverse results on the same topic. The determined compounds have different characteristics, geometry and symmetry. The key to resolve the censored data problem is to find the most fitting one. After all, we used our methods to fill the contingency table, because gives the fastest way to the solution of the problem.
The application of the given algorithm is found in several scientific areas where missing data after the experiments are displayed. Censored data are widespread in epidemiological studies and clinical trials. They occur in large-scale studies in which the event typically is associated with an infection, disease or some other failure. The novelty of our study relies on the promptness and fastness of the algorithm.

4. Conclusions

Our algorithm proved able to operate on a contingency table with gaps (missing data). In the process, the X2 statistic is minimized. The results indicate that phenolic compounds influence each other. A linear relationship between all analyzed datasets can be observed. All the three methods (ABTS, DPPH, FRAP) which were used to determine the antioxidant capacity gave comparable results. This is expected based on the experimental data and literature reviews. The estimated values for missing places fit into experimental data. The correlation between the numbers is clearly visible.
Further research of other chemical or biological substances may reveal if there is a relationship between antioxidant activity and the structure of the compounds.

Supplementary Materials

The file contains the input data and the numerical results of the research. The following are available online at https://www.mdpi.com/2073-8994/11/6/779/s1.

Author Contributions

L.J. implemented the method, supervised the whole study and the writing of the paper. D.B. collected the data, run the analysis, obtained the results and wrote the paper.

Funding

The financial support for presenting the research at Conferentia Chemometrica (CC2017) Hungary was provided by University of “Babes-Bolyai” Cluj-Napoca doctoral scholarship.

Acknowledgments

The authors would like to thank Conferentia Chemometrica (CC2017) Hungary for the opportunity and support to present this research.

Conflicts of Interest

The authors declare no conflict of interest.

References

  1. Zheng, W.; Wang, S.Y. Antioxidant activity and phenolic compounds in selected herbs. J. Agric. Food Chem. 2001, 49, 5165–5170. [Google Scholar] [CrossRef] [PubMed]
  2. Cai, Y.Z.; Sun, M.; Corke, H. Antioxidant activity of betalains from plants of the Amaranthaceae. J. Agric. Food Chem. 2003, 51, 2288–2294. [Google Scholar] [CrossRef] [PubMed]
  3. Zhao, C.; Xia, T.; Du, P.; Duan, W.; Zhang, B.; Zhang, J.; Zhu, S.; Zheng, Y.; Wang, M.; Yu, Y. Chemical Composition and Antioxidant Characteristic of Traditional and Industrial Zhenjiang Aromatic Vinegars during the Aging Process. Molecules 2018, 23, 2949. [Google Scholar] [CrossRef] [PubMed]
  4. Xiao, Z.; Luo, J.; Niu, Y.; Wu, M. Characterization of key aroma compounds from different rose essential oils using gas chromatography-mass spectrometry, gas chromatography–olfactometry and partial least squares regression. Nat. Prod. Res. 2017, 32, 1567–1572. [Google Scholar] [CrossRef] [PubMed]
  5. Gurib-Fakim, A. Medicinal plants: traditions of yesterday and drugs of tomorrow. Mol. Asp. Med. 2006, 27, 1–93. [Google Scholar] [CrossRef]
  6. Sui, X.; Shi, S.; Muge, Q.; Zhengxi, Z.; Yuyao, Y.; Haibo, W.; Linfeng, L.; Wenshu, W.; Anmin, H. Terpenoids from the barks of Magnolia maudiae (Dunn) Figlar. Nat. Prod. Res. 2017, 32, 1518–1524. [Google Scholar]
  7. Dong, L.-M.; Jia, X.-C.; Luo, Q.-W.; Zhang, Q.; Luo, B.; Liu, W.-B.; Zhang, X.; Xu, Q.-L.; Tan, J.-W. Phenolics from Mikania micrantha and Their Antioxidant Activity. Molecules 2017, 22, 1140. [Google Scholar] [CrossRef]
  8. Li, Z.; Lee, H.W.; Liang, X.; Liang, D.; Wang, Q.; Huang, D.; Ong, C.N. Profiling of Phenolic Compounds and Antioxidant Activity of 12 Cruciferous Vegetables. Molecules 2018, 23, 1139. [Google Scholar] [CrossRef]
  9. Rácz, A.; Papp, N.; Balogh, E.; Fodora, M.; Hèberger, K. Comparison of antioxidant capacity assays with chemometric methods. Anal. Meth. 2015, 7, 4216. [Google Scholar] [CrossRef]
  10. Bellili, S.; Aouadhi, C.; Dhifi, W.; Ghazghazi, H.; Jlassi, C.; Sadaka, C.; Beyrouthy, M.E.; Maaroufi, A.; Cherif, A.; Mnif, W. The Influence of Organs on Biochemical Properties of Tunisian Thuja occidentalis Essential Oils. Symmetry 2018, 10, 649. [Google Scholar] [CrossRef]
  11. Tian, Y.; Yin, Z.; Huang, M. Missing Data Probability Estimation-Based Bayesian Outlier Detection for Plant-Wide Processes with Multisampling Rates. Symmetry 2018, 10, 475. [Google Scholar] [CrossRef]
  12. Burton, A.; Altman, D.G. Missing covariate data within cancer prognostic studies: A review of current reporting and proposed guidelines. Br. J. Cancer 2004, 91, 4–8. [Google Scholar] [CrossRef] [PubMed]
  13. McDonough, I.K.; Millimet, D.L. Missing data, imputation, and endogeneity. J. Econ. 2017, 199, 141–155. [Google Scholar] [CrossRef] [Green Version]
  14. Pearson, K. On the criterion that a given system of deviations from the probable in the case of a correlated system of variables is such that it can be reasonably supposed to have arisen from random sampling. Philos. Mag. 1900, 50, 157–175. [Google Scholar] [CrossRef]
  15. Fisher, R.A.; Mackenzie, W.A. Studies in crop variation. The manorial response of different potato varieties. J. Agric. Sci. 1923, 13, 311–320. [Google Scholar] [CrossRef]
  16. Glass, G.V.; Hopkins, K.D. Statistical Methods in Education and Psychology, 3rd ed.; Allyn & Bacon: Needham Heights, MA, USA, 1996. [Google Scholar]
  17. Fisher, R.A. On the interpretation of X2 from contingency tables, and the calculation of P. J. R. Stat. Soc. 1922, 85, 87–94. [Google Scholar] [CrossRef]
  18. Fisher, R.A. The conditions under which X2 measures the discrepancy between observation and hypothesis. J. R. Stat. Soc. 1924, 87, 442–450. [Google Scholar]
  19. Li, G.; Doss, H. Generalized Pearson-fisher Chi-square goodness-of-fit tests, with applications to models with life history data. Ann. Stat. 1993, 21, 772–797. [Google Scholar] [CrossRef]
  20. Mantel, N. Chi-square tests with one degree of freedom; extension of the mantel-haenszel procedure. J. Am. Stat. Assoc. 1963, 58, 690–700. [Google Scholar]
  21. Pardo, L.; Martín, N. Omogeneity/heterogeneity hypotheses for standardized mortality ratios based on minimum power-divergence estimators. Biom. J. 2009, 51, 819–836. [Google Scholar] [CrossRef]
  22. Gagunashvili, N.D. Chi-square tests for comparing weighted histograms. Nucl. Instrum. Methods Phys. Res. A 2010, 614, 287–296. [Google Scholar] [CrossRef] [Green Version]
  23. Jäntschi, L.; Sestraş, R.E.; Bolboacă, S.D. Modeling the antioxidant capacity of red wine from different production years and sources under censoring. Comput. Math. Methods Med. 2013, 267360. [Google Scholar] [CrossRef] [PubMed]
  24. Rosner, B. Fundamentals of Biostatistics; Duxbury Press: Belmont, CA, USA, 1995. [Google Scholar]
  25. Bolboacă, S.D.; Jäntschi, L. Pearson versus Spearman, Kendall's Tau Correlation Analysis on Structure-Activity Relationships of Biologic Active Compounds. Leonardo J. Sci. 2006, 5, 179–200. [Google Scholar]
  26. Wojdyło, A.; Oszmian´ski, J.; Czemerys, R. Antioxidant activity and phenolic compounds in 32 selected herbs. Food Chem. 2007, 105, 940–949. [Google Scholar] [CrossRef]
  27. Aaby, K.; Hvattum, E.; Skrede, G. Analysis of flavonoids and other phenolic compounds using high-performance liquid chromatography with coulometric array detection: Relationship to antioxidant activity. J. Agric. Food Chem. 2004, 52, 4595–4603. [Google Scholar] [CrossRef] [PubMed]
  28. Luo, Y.; Cai, Q.; Sun, M.; Corke, H. Antioxidant activity and phenolic compounds of 112 traditional Chinese medicinal plants associated with anticancer. Life Sci. 2004, 74, 2157–2184. [Google Scholar]
  29. Ivanova, D.; Gerova, D.; Chervenkov, T.; Yankova, T. Polyphenols and antioxidant capacity of Bulgarian medicinal plants. J. Ethnopharmacol. 2005, 96, 145–150. [Google Scholar] [CrossRef] [PubMed]
  30. Benzie, I.F.F.; Strain, J.J. The ferric reducing ability of plasma (FRAP) as a measure of ‘‘antioxidant power”: The FRAP assay. Anal. Biochem. 1996, 239, 70–76. [Google Scholar] [CrossRef] [PubMed]
  31. Yen, G.C.; Chen, H.Y. Antioxidant activity of various tea extracts in relation to their antimutagenicity. J. Agric. Food Chem. 1995, 43, 27–32. [Google Scholar] [CrossRef]
  32. Pellegrini, R.; Proteggente, N.A.; Yang, A.M.; Rice- Evans, C. Antioxidant activity applying an improved ABTS radical cation decolorization assay. Free Radic. Biol. Medic. 1999, 26, 1231–1237. [Google Scholar]
  33. Arnao, M.B. Some methodological problems in the determination of antioxidant activity using chromogen radicals: A practical case. Trends Food Sci. Tech. 2000, 11, 419–421. [Google Scholar] [CrossRef]
  34. Gao, X.; Ohlander, M.; Jeppsson, N.; Bjork, L.; Trajkovski, V. Changes in antioxidant effects and their relationship to phytonutrients in fruits of sea buckthorn (Hippophae rhamnoides L.) during maturation. J. Agric. Food Chem. 2000, 48, 1485–1490. [Google Scholar] [CrossRef] [PubMed]
  35. National Center for Biotechnology Information. PubChem Compound Database; CID=689043. Available online: https://pubchem.ncbi.nlm.nih.gov/compound/689043 (accessed on 10 April 2019).
  36. National Center for Biotechnology Information. PubChem Compound Database; CID=637542. Available online: https://pubchem.ncbi.nlm.nih.gov/compound/637542 (accessed on 10 April 2019).
  37. National Center for Biotechnology Information. PubChem Compound Database; CID=445858. Available online: https://pubchem.ncbi.nlm.nih.gov/compound/445858 (accessed on 10 April 2019).
  38. National Center for Biotechnology Information. PubChem Compound Database; CID=5280633. Available online: https://pubchem.ncbi.nlm.nih.gov/compound/5280633 (accessed on 10 April 2019).
  39. Jäntschi, L. Distribution Fitting 16. How Many Colors are actually in the Field? Bul. Univ. Agric. Sci. Vet. Med. Cluj-Napoca Hortic. 2012, 69. [Google Scholar] [CrossRef]
  40. Bolboacă, S.D.; Jäntschi, L.; Sestraş, F.A.; Sestraş, R.E.; Pamfil, D.C. Pearson-Fisher Chi-Square Statistic Revisited. Information 2011, 2, 528–545. [Google Scholar] [CrossRef] [Green Version]
  41. Kenney, J.F.; Keeping, E.S. Linear Regression and Correlation. In Mathematics and Statistics, Chapter 15, Part 1, 3rd ed.; Van Nostrand: Princeton, NJ, USA, 1962; pp. 252–285. [Google Scholar]
  42. Bland, M. Methods based on rank order. In An Introduction to Medical Statistics; Oxford University Press: Oxford, UK, 1995; pp. 205–225. [Google Scholar]
  43. Walter, J.C.; Barkema, G.T. An introduction to Monte Carlo methods. Phys. A. 2015, 418, 78–87. [Google Scholar] [CrossRef] [Green Version]
  44. Efron, B. “Bootstrap methods: another looks at the jackknife. Ann. Stat. 1979, 7, 1–26. [Google Scholar] [CrossRef]
Figure 1. The algorithm used to fill the Table S1 (see the Supplementary Material) censored data.
Symmetry 11 00779 g001
Figure 2. Evolution of estimating the missing values.
Symmetry 11 00779 g002
Figure 3. Evolution of X2 statistic as a function of iteration.
Symmetry 11 00779 g003
Table 1. Outlier and average χ2 value for the plant Acorus calamus.
Acorus Calamusχ2 (Outlier) Valueχ2 (Average) Value
ABTS4.67880.1057
DPPH4.80170.1045
FRAP4.80000.0989
Table 2. Calculated correlation coefficients.
Pearson’s quantitative correlation and significance levels from Student’s t ABTSDPPHFRAP
ABTS-0.77460.7587
DPPH4.8812∙10−26-0.6696
FRAP1.8376∙10−241.8583∙10−17-
Spearman’s qualitative correlation and significance levels from Student’s t ABTSDPPHFRAP
ABTS-0.77430.7544
DPPH3.3332∙10−26-0.6684
FRAP3.0492∙10−241.6377∙10−17-
Semi-quantitative correlation and significance levels from Student’s t ABTSDPPHFRAP
ABTS-0.77450.7566
DPPH4.0330∙10−26-0.669
FRAP2.3699∙10−241.7441∙10−17-

