Missing Data Calculation Using the Antioxidant Activity in Selected Herbs
Abstract
1. Introduction
2. Materials and Methods
2.1. Measurement Methods
2.2. Primary Data
2.3. Evaluation Methods
- Check that the linearity between antioxidant activity and phenol content is true of the experimental data in the analysis.
- Three alternatives were taken into consideration. The experimental values were introduced in the algorithm in the first step.
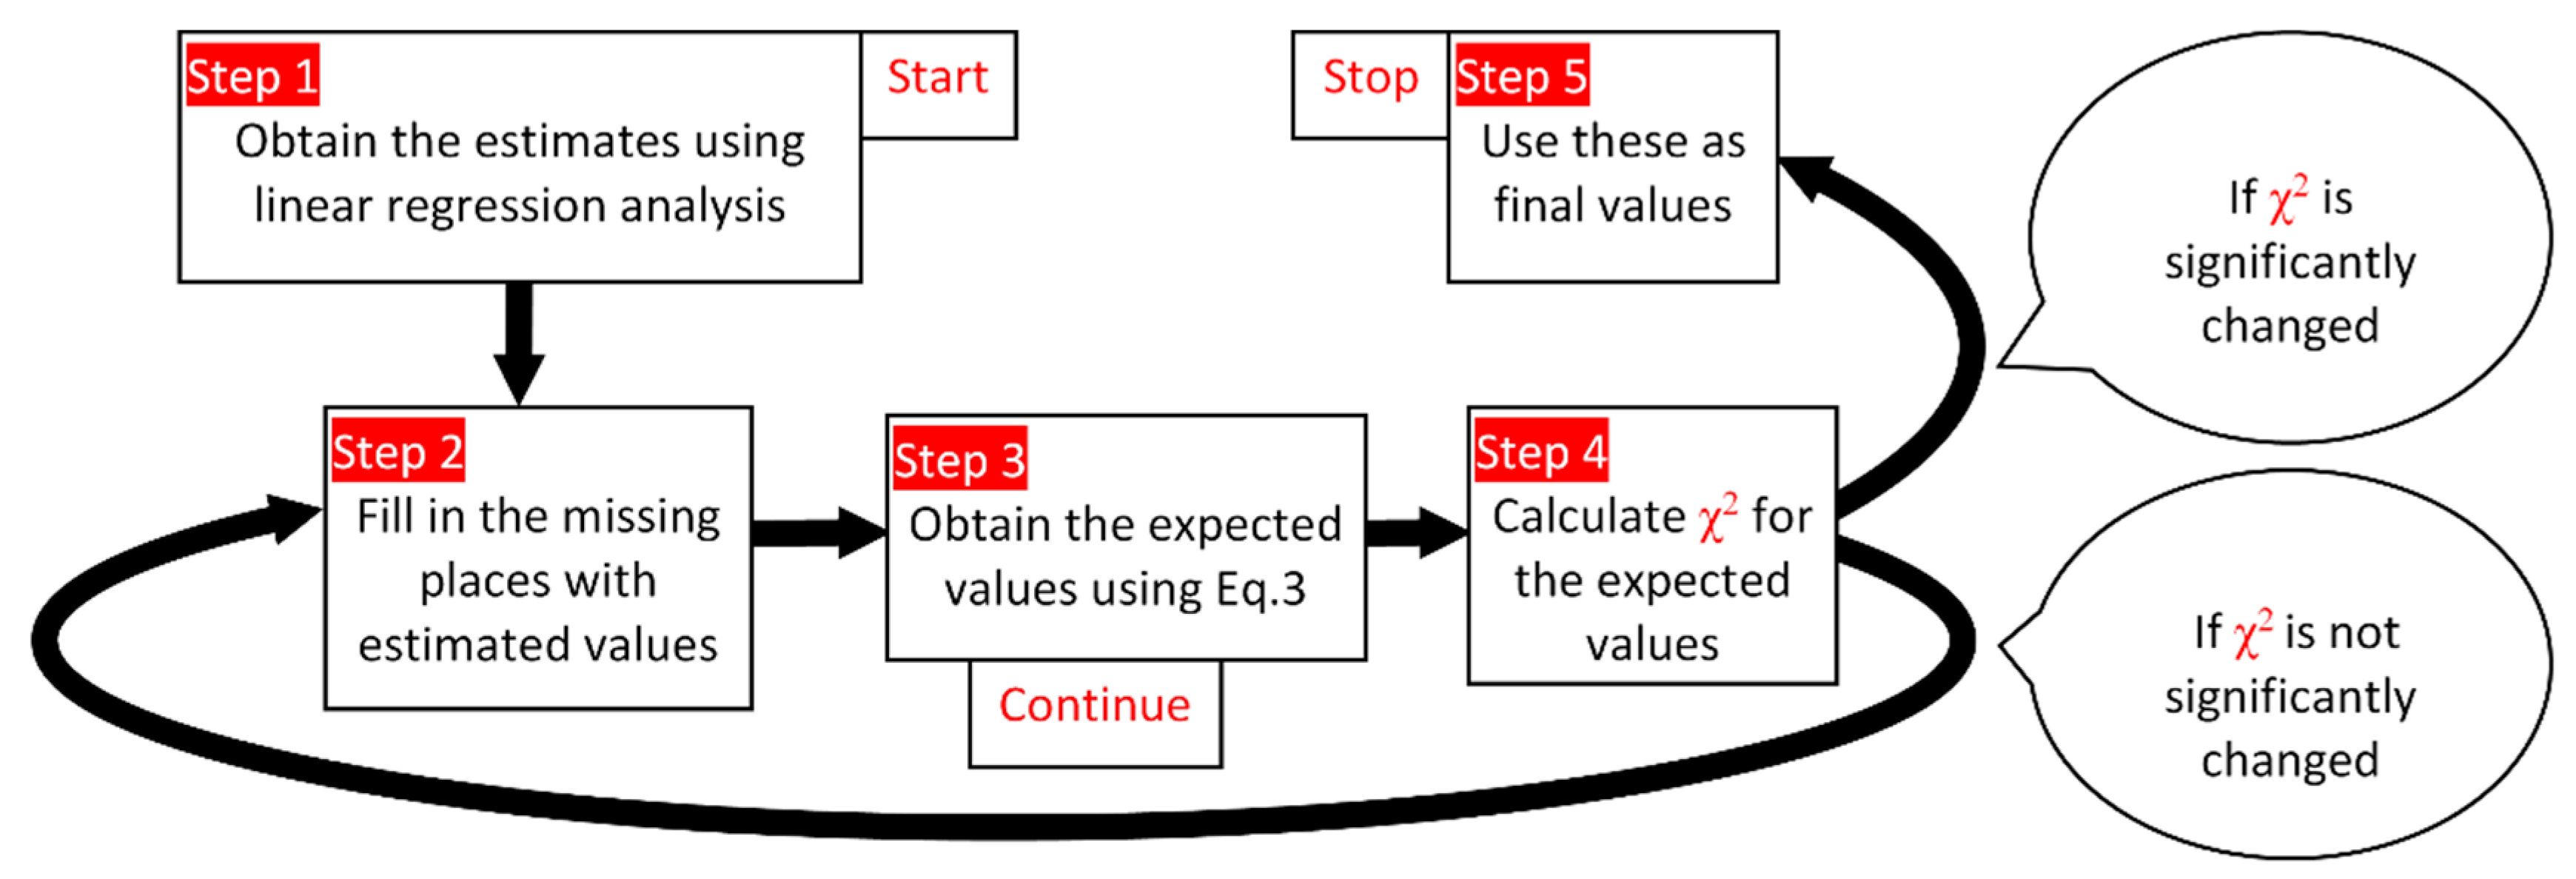
- Obtaining the coefficients using linear regression analysis (Equations (1) and (2)); using these to make estimations in the first cycle.
- Fill in the missing places with estimated values.
- Repeat:
- Obtain (new) expected values (Equation (3))
- Calculate χ2 using observed and expected values
- Insert in the missing places the (new) expected values
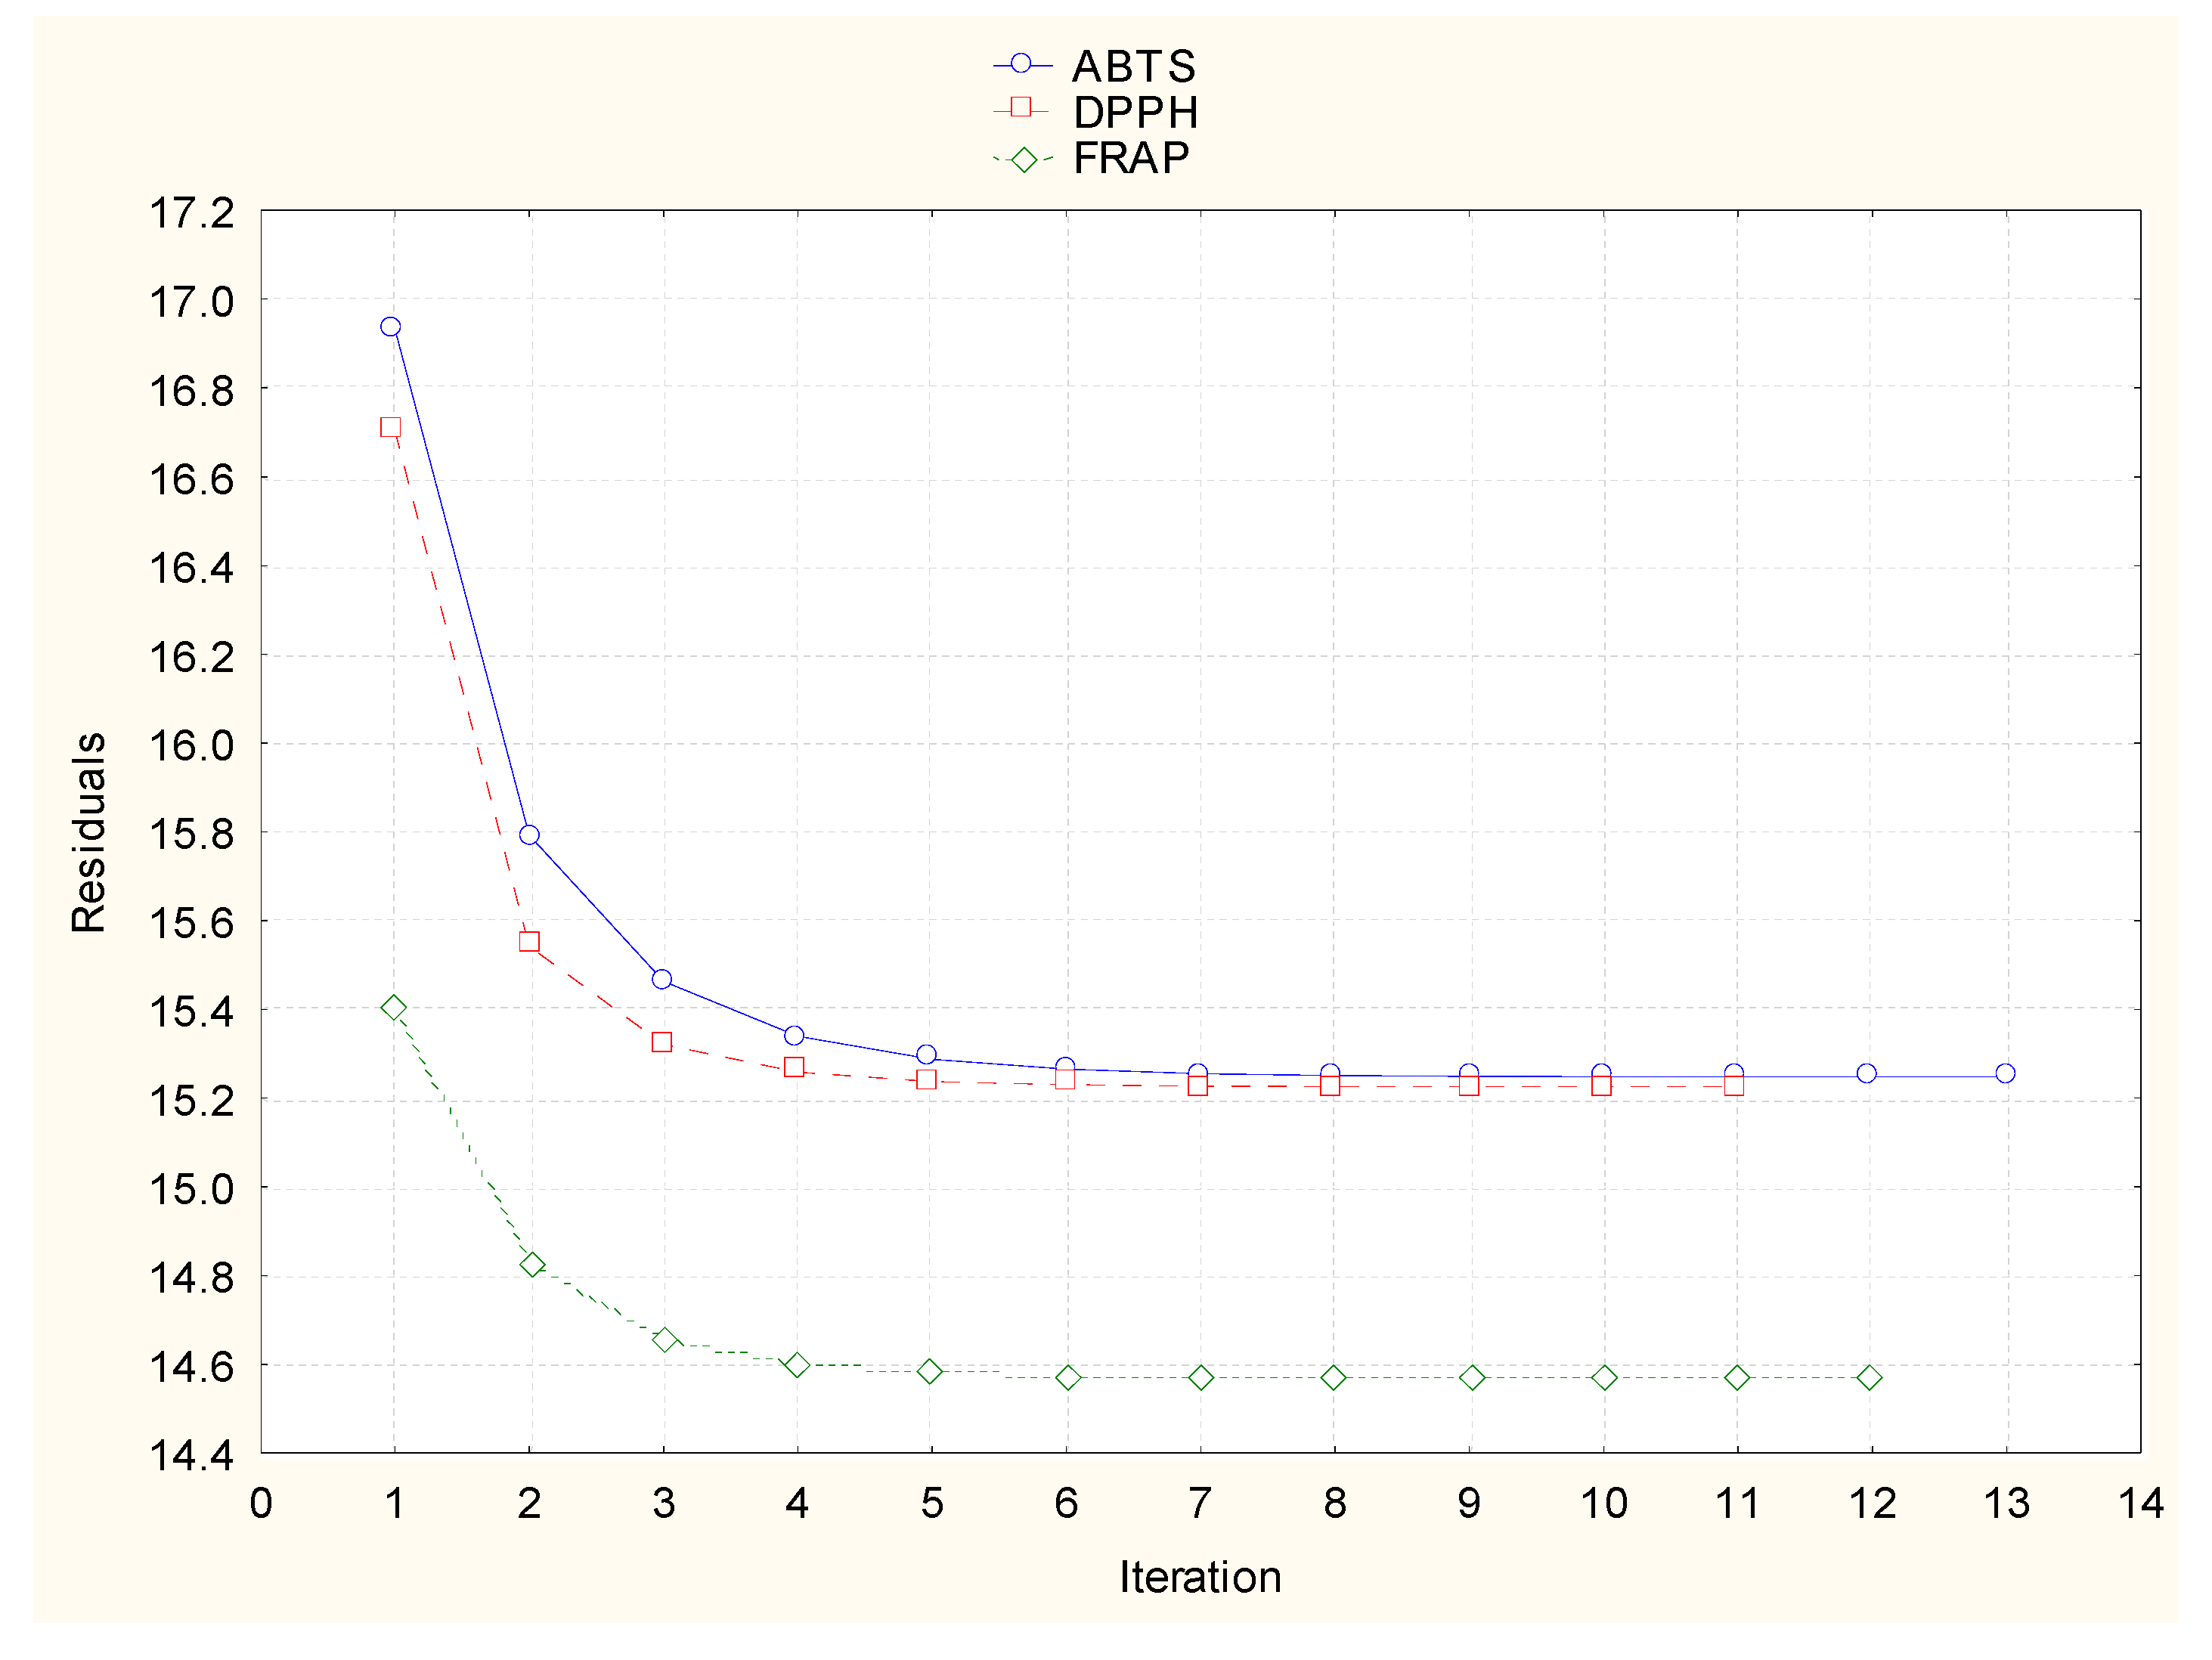
- Until the value of χ2 is not significantly changed (e.g., convergence)
- on a scale with values (X2, Equation (4)) between absolute and relative errors (step 4);
- absolute values (S2, Equation (5));
- relative values (Cv2, Equation (5));
3. Results and Discussion
4. Conclusions
Supplementary Materials
Author Contributions
Funding
Acknowledgments
Conflicts of Interest
References
- Zheng, W.; Wang, S.Y. Antioxidant activity and phenolic compounds in selected herbs. J. Agric. Food Chem. 2001, 49, 5165–5170. [Google Scholar] [CrossRef] [PubMed]
- Cai, Y.Z.; Sun, M.; Corke, H. Antioxidant activity of betalains from plants of the Amaranthaceae. J. Agric. Food Chem. 2003, 51, 2288–2294. [Google Scholar] [CrossRef] [PubMed]
- Zhao, C.; Xia, T.; Du, P.; Duan, W.; Zhang, B.; Zhang, J.; Zhu, S.; Zheng, Y.; Wang, M.; Yu, Y. Chemical Composition and Antioxidant Characteristic of Traditional and Industrial Zhenjiang Aromatic Vinegars during the Aging Process. Molecules 2018, 23, 2949. [Google Scholar] [CrossRef] [PubMed]
- Xiao, Z.; Luo, J.; Niu, Y.; Wu, M. Characterization of key aroma compounds from different rose essential oils using gas chromatography-mass spectrometry, gas chromatography–olfactometry and partial least squares regression. Nat. Prod. Res. 2017, 32, 1567–1572. [Google Scholar] [CrossRef] [PubMed]
- Gurib-Fakim, A. Medicinal plants: traditions of yesterday and drugs of tomorrow. Mol. Asp. Med. 2006, 27, 1–93. [Google Scholar] [CrossRef]
- Sui, X.; Shi, S.; Muge, Q.; Zhengxi, Z.; Yuyao, Y.; Haibo, W.; Linfeng, L.; Wenshu, W.; Anmin, H. Terpenoids from the barks of Magnolia maudiae (Dunn) Figlar. Nat. Prod. Res. 2017, 32, 1518–1524. [Google Scholar]
- Dong, L.-M.; Jia, X.-C.; Luo, Q.-W.; Zhang, Q.; Luo, B.; Liu, W.-B.; Zhang, X.; Xu, Q.-L.; Tan, J.-W. Phenolics from Mikania micrantha and Their Antioxidant Activity. Molecules 2017, 22, 1140. [Google Scholar] [CrossRef]
- Li, Z.; Lee, H.W.; Liang, X.; Liang, D.; Wang, Q.; Huang, D.; Ong, C.N. Profiling of Phenolic Compounds and Antioxidant Activity of 12 Cruciferous Vegetables. Molecules 2018, 23, 1139. [Google Scholar] [CrossRef]
- Rácz, A.; Papp, N.; Balogh, E.; Fodora, M.; Hèberger, K. Comparison of antioxidant capacity assays with chemometric methods. Anal. Meth. 2015, 7, 4216. [Google Scholar] [CrossRef]
- Bellili, S.; Aouadhi, C.; Dhifi, W.; Ghazghazi, H.; Jlassi, C.; Sadaka, C.; Beyrouthy, M.E.; Maaroufi, A.; Cherif, A.; Mnif, W. The Influence of Organs on Biochemical Properties of Tunisian Thuja occidentalis Essential Oils. Symmetry 2018, 10, 649. [Google Scholar] [CrossRef]
- Tian, Y.; Yin, Z.; Huang, M. Missing Data Probability Estimation-Based Bayesian Outlier Detection for Plant-Wide Processes with Multisampling Rates. Symmetry 2018, 10, 475. [Google Scholar] [CrossRef]
- Burton, A.; Altman, D.G. Missing covariate data within cancer prognostic studies: A review of current reporting and proposed guidelines. Br. J. Cancer 2004, 91, 4–8. [Google Scholar] [CrossRef] [PubMed]
- McDonough, I.K.; Millimet, D.L. Missing data, imputation, and endogeneity. J. Econ. 2017, 199, 141–155. [Google Scholar] [CrossRef]
- Pearson, K. On the criterion that a given system of deviations from the probable in the case of a correlated system of variables is such that it can be reasonably supposed to have arisen from random sampling. Philos. Mag. 1900, 50, 157–175. [Google Scholar] [CrossRef]
- Fisher, R.A.; Mackenzie, W.A. Studies in crop variation. The manorial response of different potato varieties. J. Agric. Sci. 1923, 13, 311–320. [Google Scholar] [CrossRef]
- Glass, G.V.; Hopkins, K.D. Statistical Methods in Education and Psychology, 3rd ed.; Allyn & Bacon: Needham Heights, MA, USA, 1996. [Google Scholar]
- Fisher, R.A. On the interpretation of X2 from contingency tables, and the calculation of P. J. R. Stat. Soc. 1922, 85, 87–94. [Google Scholar] [CrossRef]
- Fisher, R.A. The conditions under which X2 measures the discrepancy between observation and hypothesis. J. R. Stat. Soc. 1924, 87, 442–450. [Google Scholar]
- Li, G.; Doss, H. Generalized Pearson-fisher Chi-square goodness-of-fit tests, with applications to models with life history data. Ann. Stat. 1993, 21, 772–797. [Google Scholar] [CrossRef]
- Mantel, N. Chi-square tests with one degree of freedom; extension of the mantel-haenszel procedure. J. Am. Stat. Assoc. 1963, 58, 690–700. [Google Scholar]
- Pardo, L.; Martín, N. Omogeneity/heterogeneity hypotheses for standardized mortality ratios based on minimum power-divergence estimators. Biom. J. 2009, 51, 819–836. [Google Scholar] [CrossRef]
- Gagunashvili, N.D. Chi-square tests for comparing weighted histograms. Nucl. Instrum. Methods Phys. Res. A 2010, 614, 287–296. [Google Scholar] [CrossRef]
- Jäntschi, L.; Sestraş, R.E.; Bolboacă, S.D. Modeling the antioxidant capacity of red wine from different production years and sources under censoring. Comput. Math. Methods Med. 2013, 267360. [Google Scholar] [CrossRef] [PubMed]
- Rosner, B. Fundamentals of Biostatistics; Duxbury Press: Belmont, CA, USA, 1995. [Google Scholar]
- Bolboacă, S.D.; Jäntschi, L. Pearson versus Spearman, Kendall's Tau Correlation Analysis on Structure-Activity Relationships of Biologic Active Compounds. Leonardo J. Sci. 2006, 5, 179–200. [Google Scholar]
- Wojdyło, A.; Oszmian´ski, J.; Czemerys, R. Antioxidant activity and phenolic compounds in 32 selected herbs. Food Chem. 2007, 105, 940–949. [Google Scholar] [CrossRef]
- Aaby, K.; Hvattum, E.; Skrede, G. Analysis of flavonoids and other phenolic compounds using high-performance liquid chromatography with coulometric array detection: Relationship to antioxidant activity. J. Agric. Food Chem. 2004, 52, 4595–4603. [Google Scholar] [CrossRef] [PubMed]
- Luo, Y.; Cai, Q.; Sun, M.; Corke, H. Antioxidant activity and phenolic compounds of 112 traditional Chinese medicinal plants associated with anticancer. Life Sci. 2004, 74, 2157–2184. [Google Scholar]
- Ivanova, D.; Gerova, D.; Chervenkov, T.; Yankova, T. Polyphenols and antioxidant capacity of Bulgarian medicinal plants. J. Ethnopharmacol. 2005, 96, 145–150. [Google Scholar] [CrossRef] [PubMed]
- Benzie, I.F.F.; Strain, J.J. The ferric reducing ability of plasma (FRAP) as a measure of ‘‘antioxidant power”: The FRAP assay. Anal. Biochem. 1996, 239, 70–76. [Google Scholar] [CrossRef] [PubMed]
- Yen, G.C.; Chen, H.Y. Antioxidant activity of various tea extracts in relation to their antimutagenicity. J. Agric. Food Chem. 1995, 43, 27–32. [Google Scholar] [CrossRef]
- Pellegrini, R.; Proteggente, N.A.; Yang, A.M.; Rice- Evans, C. Antioxidant activity applying an improved ABTS radical cation decolorization assay. Free Radic. Biol. Medic. 1999, 26, 1231–1237. [Google Scholar]
- Arnao, M.B. Some methodological problems in the determination of antioxidant activity using chromogen radicals: A practical case. Trends Food Sci. Tech. 2000, 11, 419–421. [Google Scholar] [CrossRef]
- Gao, X.; Ohlander, M.; Jeppsson, N.; Bjork, L.; Trajkovski, V. Changes in antioxidant effects and their relationship to phytonutrients in fruits of sea buckthorn (Hippophae rhamnoides L.) during maturation. J. Agric. Food Chem. 2000, 48, 1485–1490. [Google Scholar] [CrossRef] [PubMed]
- National Center for Biotechnology Information. PubChem Compound Database; CID=689043. Available online: https://pubchem.ncbi.nlm.nih.gov/compound/689043 (accessed on 10 April 2019).
- National Center for Biotechnology Information. PubChem Compound Database; CID=637542. Available online: https://pubchem.ncbi.nlm.nih.gov/compound/637542 (accessed on 10 April 2019).
- National Center for Biotechnology Information. PubChem Compound Database; CID=445858. Available online: https://pubchem.ncbi.nlm.nih.gov/compound/445858 (accessed on 10 April 2019).
- National Center for Biotechnology Information. PubChem Compound Database; CID=5280633. Available online: https://pubchem.ncbi.nlm.nih.gov/compound/5280633 (accessed on 10 April 2019).
- Jäntschi, L. Distribution Fitting 16. How Many Colors are actually in the Field? Bul. Univ. Agric. Sci. Vet. Med. Cluj-Napoca Hortic. 2012, 69. [Google Scholar] [CrossRef]
- Bolboacă, S.D.; Jäntschi, L.; Sestraş, F.A.; Sestraş, R.E.; Pamfil, D.C. Pearson-Fisher Chi-Square Statistic Revisited. Information 2011, 2, 528–545. [Google Scholar] [CrossRef]
- Kenney, J.F.; Keeping, E.S. Linear Regression and Correlation. In Mathematics and Statistics, Chapter 15, Part 1, 3rd ed.; Van Nostrand: Princeton, NJ, USA, 1962; pp. 252–285. [Google Scholar]
- Bland, M. Methods based on rank order. In An Introduction to Medical Statistics; Oxford University Press: Oxford, UK, 1995; pp. 205–225. [Google Scholar]
- Walter, J.C.; Barkema, G.T. An introduction to Monte Carlo methods. Phys. A. 2015, 418, 78–87. [Google Scholar] [CrossRef]
- Efron, B. “Bootstrap methods: another looks at the jackknife. Ann. Stat. 1979, 7, 1–26. [Google Scholar] [CrossRef]


| Acorus Calamus | χ2 (Outlier) Value | χ2 (Average) Value |
|---|---|---|
| ABTS | 4.6788 | 0.1057 |
| DPPH | 4.8017 | 0.1045 |
| FRAP | 4.8000 | 0.0989 |
| Pearson’s quantitative correlation and significance levels from Student’s t | ABTS | DPPH | FRAP | |
| ABTS | - | 0.7746 | 0.7587 | |
| DPPH | 4.8812∙10−26 | - | 0.6696 | |
| FRAP | 1.8376∙10−24 | 1.8583∙10−17 | - | |
| Spearman’s qualitative correlation and significance levels from Student’s t | ABTS | DPPH | FRAP | |
| ABTS | - | 0.7743 | 0.7544 | |
| DPPH | 3.3332∙10−26 | - | 0.6684 | |
| FRAP | 3.0492∙10−24 | 1.6377∙10−17 | - | |
| Semi-quantitative correlation and significance levels from Student’s t | ABTS | DPPH | FRAP | |
| ABTS | - | 0.7745 | 0.7566 | |
| DPPH | 4.0330∙10−26 | - | 0.669 | |
| FRAP | 2.3699∙10−24 | 1.7441∙10−17 | - |
© 2019 by the authors. Licensee MDPI, Basel, Switzerland. This article is an open access article distributed under the terms and conditions of the Creative Commons Attribution (CC BY) license (http://creativecommons.org/licenses/by/4.0/).
Share and Cite
Bálint, D.; Jäntschi, L. Missing Data Calculation Using the Antioxidant Activity in Selected Herbs. Symmetry 2019, 11, 779. https://doi.org/10.3390/sym11060779
Bálint D, Jäntschi L. Missing Data Calculation Using the Antioxidant Activity in Selected Herbs. Symmetry. 2019; 11(6):779. https://doi.org/10.3390/sym11060779
Chicago/Turabian StyleBálint, Donatella, and Lorentz Jäntschi. 2019. "Missing Data Calculation Using the Antioxidant Activity in Selected Herbs" Symmetry 11, no. 6: 779. https://doi.org/10.3390/sym11060779
APA StyleBálint, D., & Jäntschi, L. (2019). Missing Data Calculation Using the Antioxidant Activity in Selected Herbs. Symmetry, 11(6), 779. https://doi.org/10.3390/sym11060779


