Review

Recent Development on Detection Methods for the Diagnosis of Diabetic Retinopathy

1
Intelligent Media Research Center (iLEARN), School of Computer Science and Technology, Shandong University, Binhailu 72, Jimo, Qingdao 266237, China
2
Department of Computer Science, Al Imam Mohammad Ibn Saud Islamic University (IMSIU), Riyadh 11432, Saudi Arabia
*
Author to whom correspondence should be addressed.
Symmetry 2019, 11(6), 749; https://doi.org/10.3390/sym11060749
Submission received: 10 April 2019 / Revised: 27 May 2019 / Accepted: 27 May 2019 / Published: 3 June 2019

Abstract

:
Diabetic retinopathy (DR) is a complication of diabetes that exists throughout the world. DR occurs due to a high ratio of glucose in the blood, which causes alterations in the retinal microvasculature. Without preemptive symptoms of DR, it leads to complete vision loss. However, early screening through computer-assisted diagnosis (CAD) tools and proper treatment have the ability to control the prevalence of DR. Manual inspection of morphological changes in retinal anatomic parts are tedious and challenging tasks. Therefore, many CAD systems were developed in the past to assist ophthalmologists for observing inter- and intra-variations. In this paper, a recent review of state-of-the-art CAD systems for diagnosis of DR is presented. We describe all those CAD systems that have been developed by various computational intelligence and image processing techniques. The limitations and future trends of current CAD systems are also described in detail to help researchers. Moreover, potential CAD systems are also compared in terms of statistical parameters to quantitatively evaluate them. The comparison results indicate that there is still a need for accurate development of CAD systems to assist in the clinical diagnosis of diabetic retinopathy.

Graphical Abstract

1. Introduction

Diabetes mellitus (DM) is specified by a group of unhinging metamorphoses caused by insulin resistance [1]. Insulin resistance leads to a high ratio of glucose in the blood (hyperglycemia), which may eventually ensue to macro (stroke, heart attack) and micro (neuropathy, retinopathy, and nephropathy) vascular pathologies [2]. According to recent statistics [3], there are about 382 million people diagnosed as diabetic patients and this number is expected to increase to reach 592 million by 2030. DM has two main clinical types, including type1 diabetes (T1D) and type 2 diabetes (T2D). About 90% of diabetic patients across the globe have T2D diabetes, which is stimulated by the resistance of insulin. Diabetic retinopathy (DR) is one of the significant ramifications of DM and creates a progressive visual illness in the adult population characterized by the deterioration of tinny retinal vessels [4,5,6]. However, early screening and treatment through computer-aided diagnostic (CAD) programs can assist patients to prevent complete blindness occurring.
Several clinical studies show that the presence of microaneurysms (MAs), soft/hard exudates (EXs), and hemorrhages (HMs) in the fundus image are pathognomonic signs of diabetic retinopathy. MAs are bulges of thin vessels and appear as small and sharp borders of red spots on the retinal surface whereas EXs exist in the retinal region due to the leakage of proteins from vessels and appear as white/yellowish-white spots of a small size. HMs look like red deposits with non-uniform margins and are caused by the leaking of weak capillaries. Furthermore, DR is broadly classified into two stages based on vessel degeneration and ischemic change, including non-proliferative diabetic retinopathy (NPDR) and proliferative diabetic retinopathy (PDR). NPDR is further subdivided in to mild (presence of MAs), moderate (advance than mid-level), and severe (venous beading in at least two quadrants, MA, HM in four retina quadrants) stages, while PDR is an advanced stage of DR. Moreover, NPDR is clinically recommended for the detection of the severity level of DR [7,8,9,10].
CAD programs are used to symmetrically analyze and segment basic retinal (optic disc, cup, macula, and vessels) components and abnormal (EXs, HMs, MAs, and fovea) lesions within the retinal image for the early screening of DR. A clinically recommended protocol followed by the current CAD methods for DR assessment exists, as given in Table 1. It describes the DR classes with their clinical definitions.
Innovation in the field of science and technology has made human life healthier, secure, and more livable. For instance, automated medical imaging analysis is a novel area of research that identifies serious diseases by utilizing imaging technology. Those automated diagnosis systems (ADSs) are called computer-aided systems (CADs), which provide services for the ease of humanity. The role of CAD systems has been recognized in the diverse range of medical diagnoses, such as brain tumor detection, glaucoma detection, diabetic retinopathy detection, gastrointestinal detection, macular edema, cardiac grading, Alzheimer’s and Parkinson’s assessment, breast cancer diagnosis, and many more [11]. Those CAD systems have produced similar results with human observations. The development of CAD devices relies on the image features extracted from images using computational methods [12]. Manual inspection of retinal anatomic (e.g., optic disc, cup, fovea, macula, and vascular structure) features and DR lesions is a tedious and repetitive task for clinical personnel. Moreover, human analysis of DR is subjective and requires technical domain knowledge to observe inter- or intra-changes in retinal components. As a result, computer-aided diagnostic (CAD) systems are required to execute early DR screening programs using color fundus images. These CAD systems may reduce the time, cost, and efforts of clinicians in the manual analysis of retinal images [13,14].
In past studies, several authors have reviewed different retinal image analysis algorithms and their applications [15,16,17] for CAD-based DR screening. A comprehensive review of the image segmentation methods for optic disc, cup, and DR detection is presented in [15]. Another study in [16] highlighted image preprocessing, segmentation of basic and abnormal retinal features, and DR detection methods. Patton et al. in [17] presented a review on the image registration, preprocessing, segmentation of pathological features, and different imaging modalities for DR diagnosis. However, none of them compared and reviewed recent state-of-the-art machine learning algorithms. Accordingly, in this article, an extensive overview of recent state-of-the-art CAD systems for the detection of normal and abnormal retinal features is summarized. Specifically, advanced deep learning, image processing, machine learning, and computer vision-based methods are described for the early grading of DR using color fundus images.

1.1. Digital Fundus Imaging

Fundus imaging has enabled computerized screening tools to deal and document many retinal diseases without the intervention of clinical experts. In general, the acquisition of a fundus image is done by the fundus camera, which consists of a low power microscope capable of capturing an inner side of the retinal structure, such as the optic disc, cup, macula, or posterior pole. An example of a typical fundus image is given in Figure 1, which shows the basic fundus structure and NPDR stages with lesions. Fundus imaging has been found to be a simple and cost-effective technique, facilitating ophthalmologists to quickly analyze and screen images received from a diverse range of locations, e.g., rural or urban areas, and then providing possible clinical suggestions. It is worth noting that fundus angiography undergoes DR screening using three kinds of image modalities: (i) An RGB, (ii) red free channel, and (iii) fluorescent images [18]. Samples of these channels can be observed in the STARE, MESSIDOR, DRIVE, DIARETDB, and HRF datasets [19,20]. These clinical materials have often been adopted by the research community to develop DR-based CAD systems.

1.2. Performance Measure

The advantage of DR-based CAD methods is that they can generate a real-time DR screening mechanism to respond to both patients and doctors in minimal time. To evaluate and test the performance of those CAD methods against the ground truth (i.e., manual notions of retinal features provided by clinicians) labels, various statistical parameters, such as the sensitivity (SE), specificity (SP), accuracy, precision, F1-score, and area under the curve (AUC), are utilized to provide an objective comparability among these approaches. These parameters are based on true positives, true negatives, false positives, and false negatives. The formulas used for the measurement of SE, SP, accuracy, and precision are: TP/(TP + FN), TN/(TN + FP), (TP + TN)/(TP + FP + TN + FN), and TP/(TP + FP), respectively. The F1-score can be calculated as an equal weight of both SE and precision: 2TP/(2TP + FP + FN). In addition, an AUC of 1 indicates a good performance of the method while an AUC of 0.5 shows a moderate performance [21,22].
  • TP (true positives), indicates accurate classification of a disease subject.
  • TN (true negatives), means a normal subject is correctly classified.
  • FP (false positives), denotes an incorrect classification of a normal subject as a disease subject.
  • FN (false negatives), means a disease subject is incorrectly detected as a normal subject.
The aim of this review is to investigate and demonstrate the recent automated scientific algorithms, i.e., deep learning, and traditional methods for DR-based CAD systems. An investigation into the framework, datasets, and experimental results, including any key gaps in these topics, is provided in detail. Finally, the review is concluded with some solutions to the discussed algorithms’ limitation and future trends in the designing and training of more powerful deep learning models for DR diagnosis.

1.3. Paper Organization

This article has the following five main sections. Section 2 provides segmentation and extraction methods using image acquisition, preprocessing, enhancement, and segmentation techniques. In Section 3, we briefly explain the latest trends in popular deep learning methods for DR. Section 4 provides a survey on the current DR-based screening systems. A discussion is also given in Section 4 that addresses the objective of the article with major challenges of the reviewed methods and some proposed solutions outlined. This section also provides comparisons between the hand-crafted and deep features used in the past to detect DR. Finally, the paper is concluded in Section 5.

2. Detection Methods of DR

The following sections provide an extensive study of computational segmentation and classification algorithms implemented for the detection of retinal anatomic landmarks with DR lesions using fundus images. For clarity, Figure 2 depicts a graphical representation of these detection methods.

2.1. Optic Disc and Cup Segmentation

The optic disc (OD) is a clinical intense fundus feature and is considered as a preliminary indicator of retinal vessel, optic cup (OC), macula, and fovea detection in fundus photographs. Localization and segmentation of the OD boundary indicates a disc contour and center. Most OD extraction approaches in the literature are based on morphological and geometrical-based methods, as explained in the subsequent paragraphs.
Considering the significance of optic disc segmentation for reliable glaucoma and DR screening, the author in [23] considered morphological features to segment the OD boundary. The finite impulse response (FIR) filter was applied to remove retinal vessels and to extract morphological features for disc extraction. The author reported an average accuracy of 98.95% using a small set of images. However, the algorithm was unsuccessful on low bright disc color images. Similarly, Alshayeji et al. in [24] applied an edge detection algorithm based on a gravitational law followed by pre- and post-processing steps for OD segmentation. They showed an accuracy of 95.91% with a cost of high running time. A real-time approach was developed in [25] for OD segmentation, in which the disc boundary was extracted after the removal of vessels using a region growing adaptive threshold and ellipse fitting methods. They obtained an accuracy of 91%.
The authors in [26] used the green plane of a fundus image for OD detection because it provides much higher information. They determined an accuracy of 94.7%. Abed et al. in [27] presented a hybrid nature-inspired model named swarm intelligence with a pre-processing stage for OD segmentation. The authors obtained an average accuracy of 98.45% with less running time than other published methods. However, this model is highly dependent on preprocessing steps and algorithm parameters. Some other CAD algorithms have been developed based on the geometrical principle for OD segmentation with higher accuracy, such as the Hough circle cloud [28], ensemble of probability models [29], sliding band filter [30], and active contour models [31,32]. In a previous study [28], a fully automated software called Hough circle cloud was developed for OD localization. This yielded an average accuracy of 99.6%. However, the software was tested on a small dataset and was implemented on powerful graphical processing units (GPUs) instead of local computers. The system proposed in [29] addressed the strengths of different object detection methods for OD segmentation. The authors achieved an accuracy of 98.91%. Nevertheless, the application was computationally expensive, i.e., based on pre-/post-processing steps and dependencies of each algorithm member existed.
A multi-resolution sliding band filter (SBF) was employed by [30] to locate the OD area. After the elimination of the vessel structure, a low resolution SBF was used on the cropped images and achieved an initial estimation of the disc. High resolution SBF was then applied on the initial disc points to obtain a final approximation of the OD. The final disc area was selected by obtaining the maximum number of responses from a high resolution SBF and smoothing method, and obtained an average overlapping area of 85.66%. However, this scheme was noticeably less competitive on a complex pattern of a few retinal samples. The studies reported in [31,32] presented a performance comparison of 10 region-based active contour models (ACMs) for OD localization. Among these methods, the gradient vector flow (GVF)-ACM was found to be superior regarding the OD segmentation with a 97% accuracy. However, both these methods were evaluated on small datasets followed by pre-/post-processing steps. To detect the disc area, the authors of [33] used the vessel direction, intensity, and bright area of the disc. These features were extracted using geometric methods and then combined through the confidence score method. The highest confidence value indicates accurate OD segmentation. The algorithm was tested on a small number of images and was reported as being robust in the presence of other bright lesions, with, on average, a 98.2% accuracy.
Optic cup boundary extraction is also a tedious task because of the interweavement of blood vessels around the cup region. In addition, OC is a brightest yellowish feature of fundus images that resides within the disc region and is a preliminary sign of glaucoma retinopathy [34,35]. OC segmentation methods in the literature can be categorized into machine learning and pixel-based classification schemes, as covered in the following subsection.
Tan et al. in [36] developed a fully automated OC detection algorithm based on a multiscale super-pixel classification model. They employed different ranges of multi-scale pixel approaches for retinal vessel removal and image normalization. Finally, the cup area was localized using a combination of sparsity-based multiscale super-pixel models. The authors obtained significant results (7.12% higher rate than other methods) for OC localization. However, the scheme was computationally expensive and was tested on a small number of images. The authors in [37] suggested entropy sampling and a convolutional neural network (CNN) for cup segmentation using a small amount of images. The authors yielded a classification accuracy of 94.1%. Although, the method was unsuccessful in translating the sampling points to obtain more reliable results. Chakravarty and Sivaswamy in [38] proposed a joint segmentation model for disc and cup boundary extraction. Textural features of the disc and cup were extracted using the coupled and sparse dictionary approaches. These selected features were finally applied for cup detection. Their system achieved 0.85 of the area under the receiving operating curve (AUC) in the optic cup boundary extraction. Nevertheless, their proposed application was less impressive in estimating the cup-to-disc (CDR). In a previous study [39], an ant colony optimization (ACO) algorithm was considered for OC segmentation. Their software reported an AUC of 0.79. However, the method was unsuccessful on few samples to characterize the cup boundary. Complementary features of both the disc and cup from the fundus and spectral domain optical coherence tomography (SD-OCT) modalities have shown great potential for OC extraction [
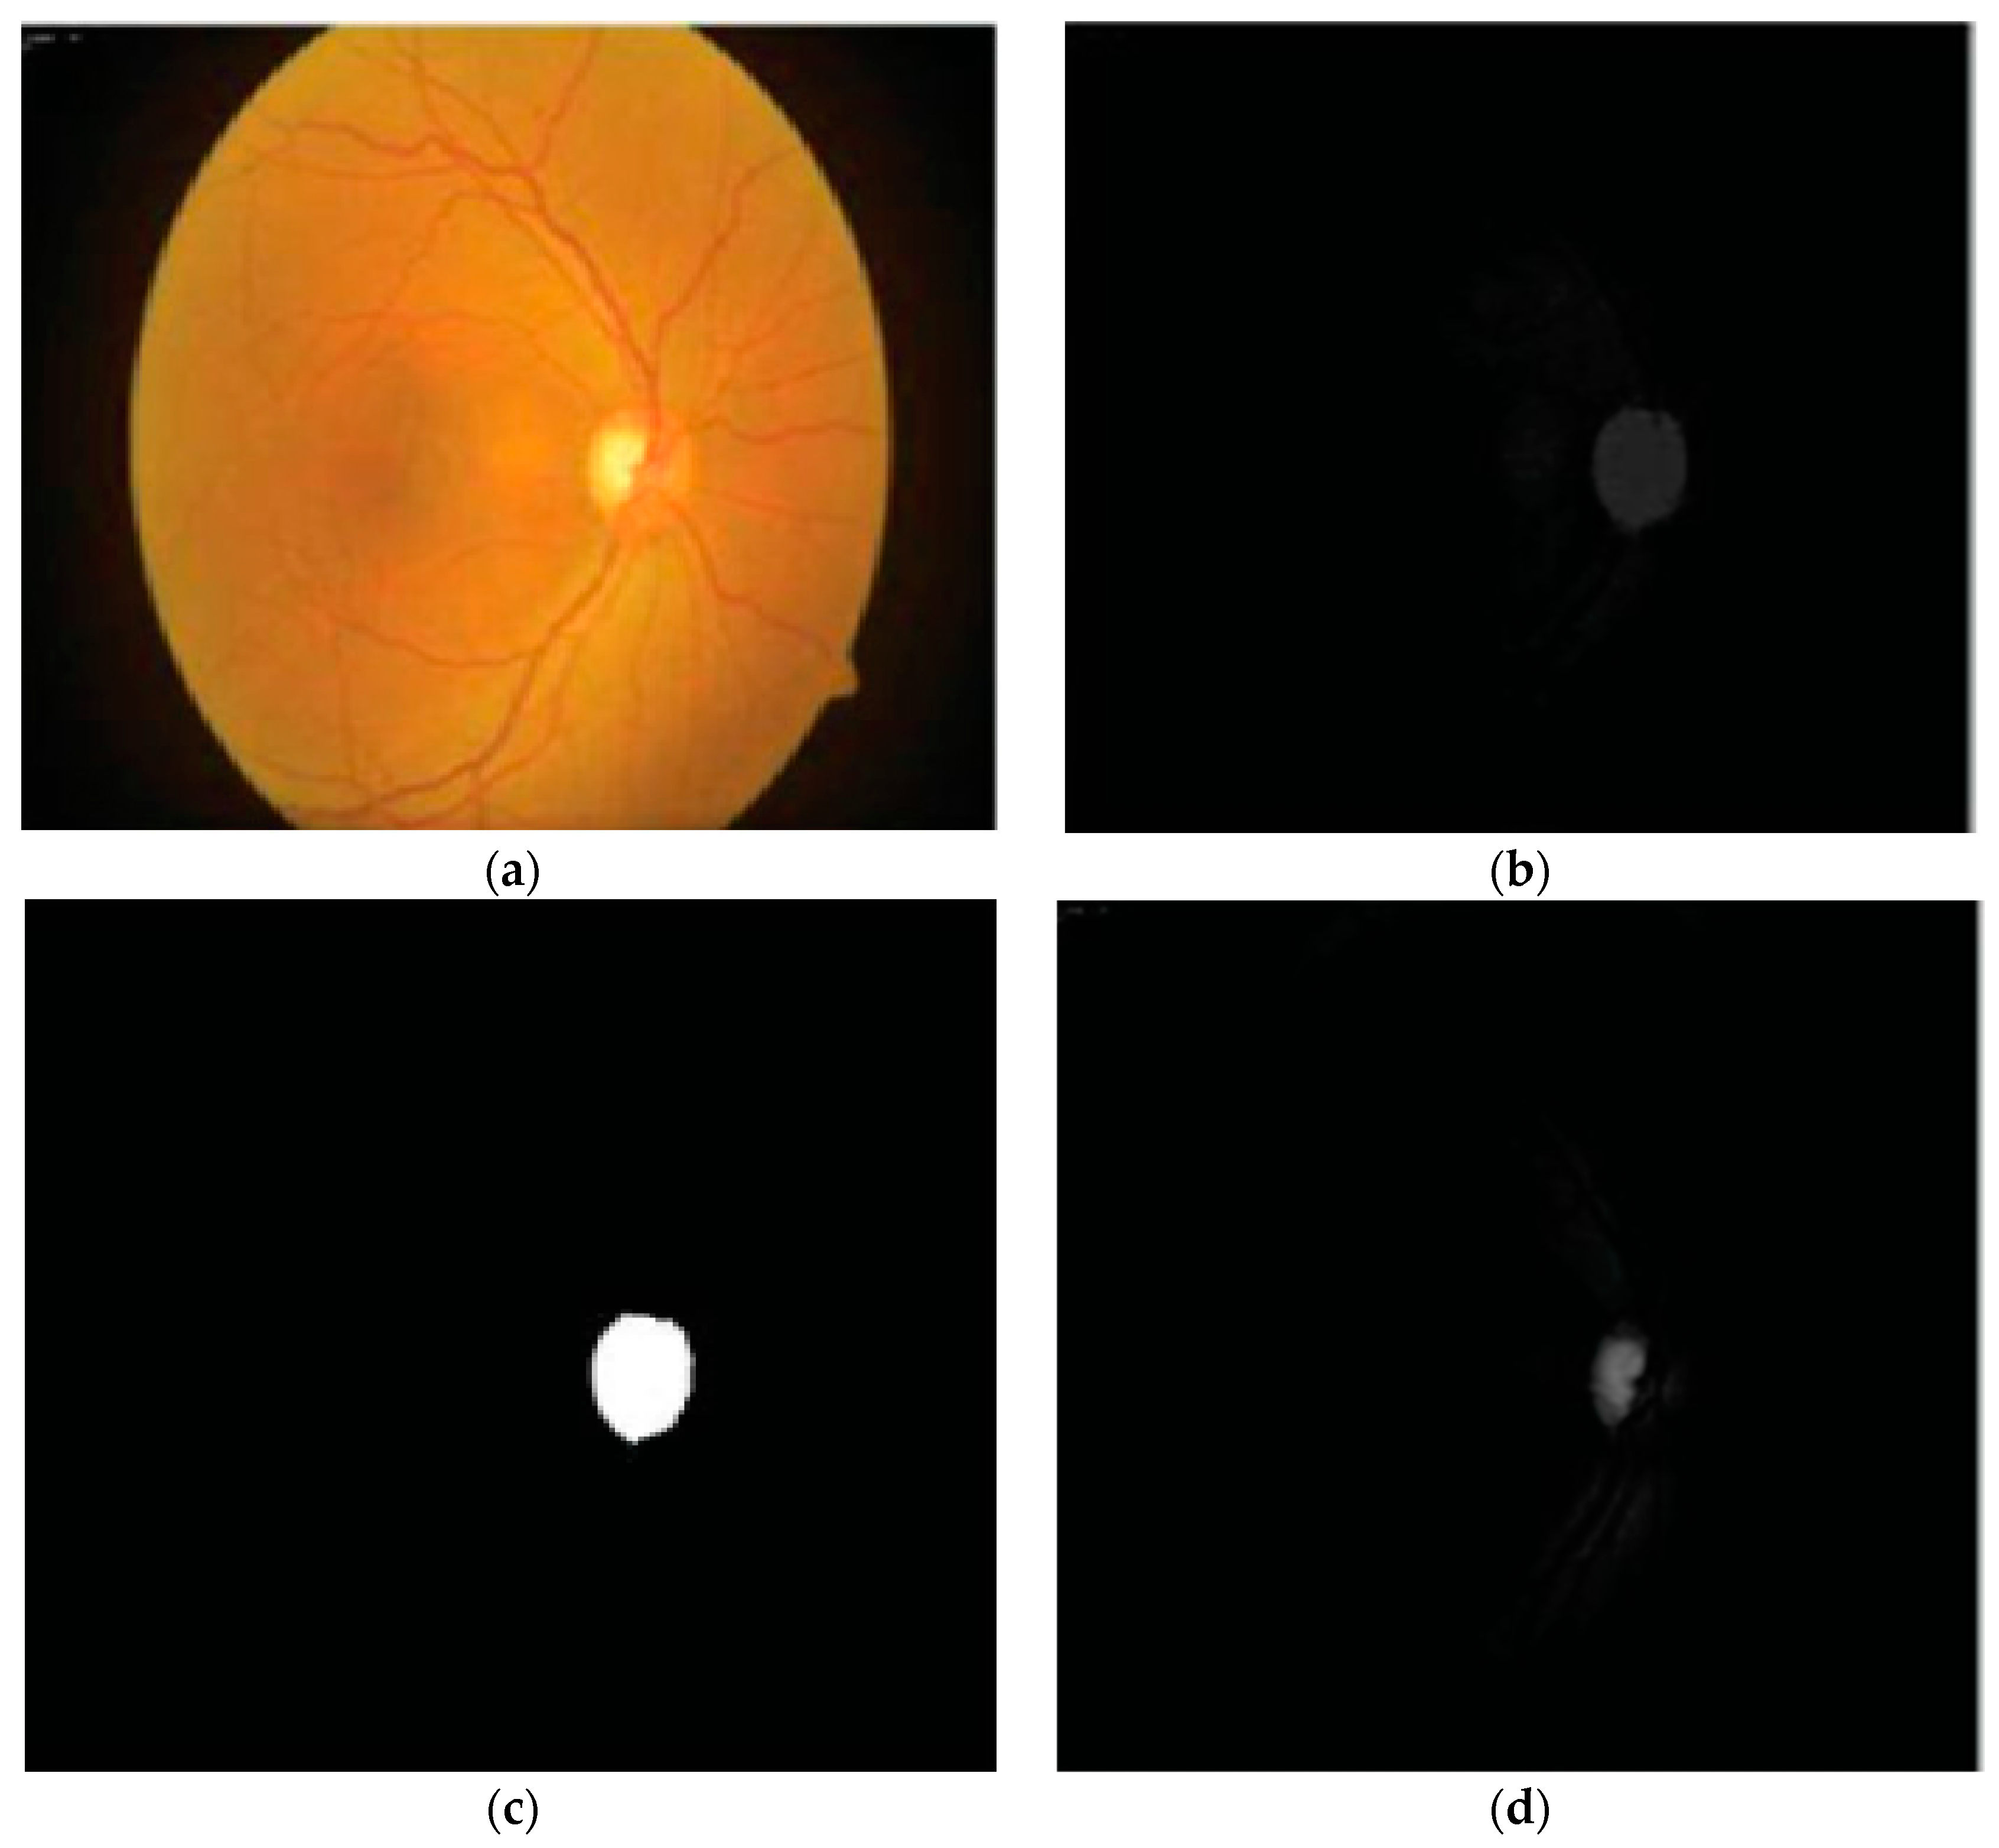
40]. An adaptive threshold approach was applied by Issac et al. in [41] for disc and cup segmentation. Color features, e.g., mean and standard deviation, were computed from the fundus image and then applied for the subtraction of background parts of the OD and OC. Finally, OD and OC boundaries were extracted from the red and green channels, as shown in Figure 3. The authors reported an accuracy of 92%. However, their scheme was tested on a small dataset and failed on low contrast images. A summary of the aforementioned disc and cup extraction approaches is given in Table 2, illustrating the particular method, datasets used, and the number of images.

2.2. Blood Vessel Extraction

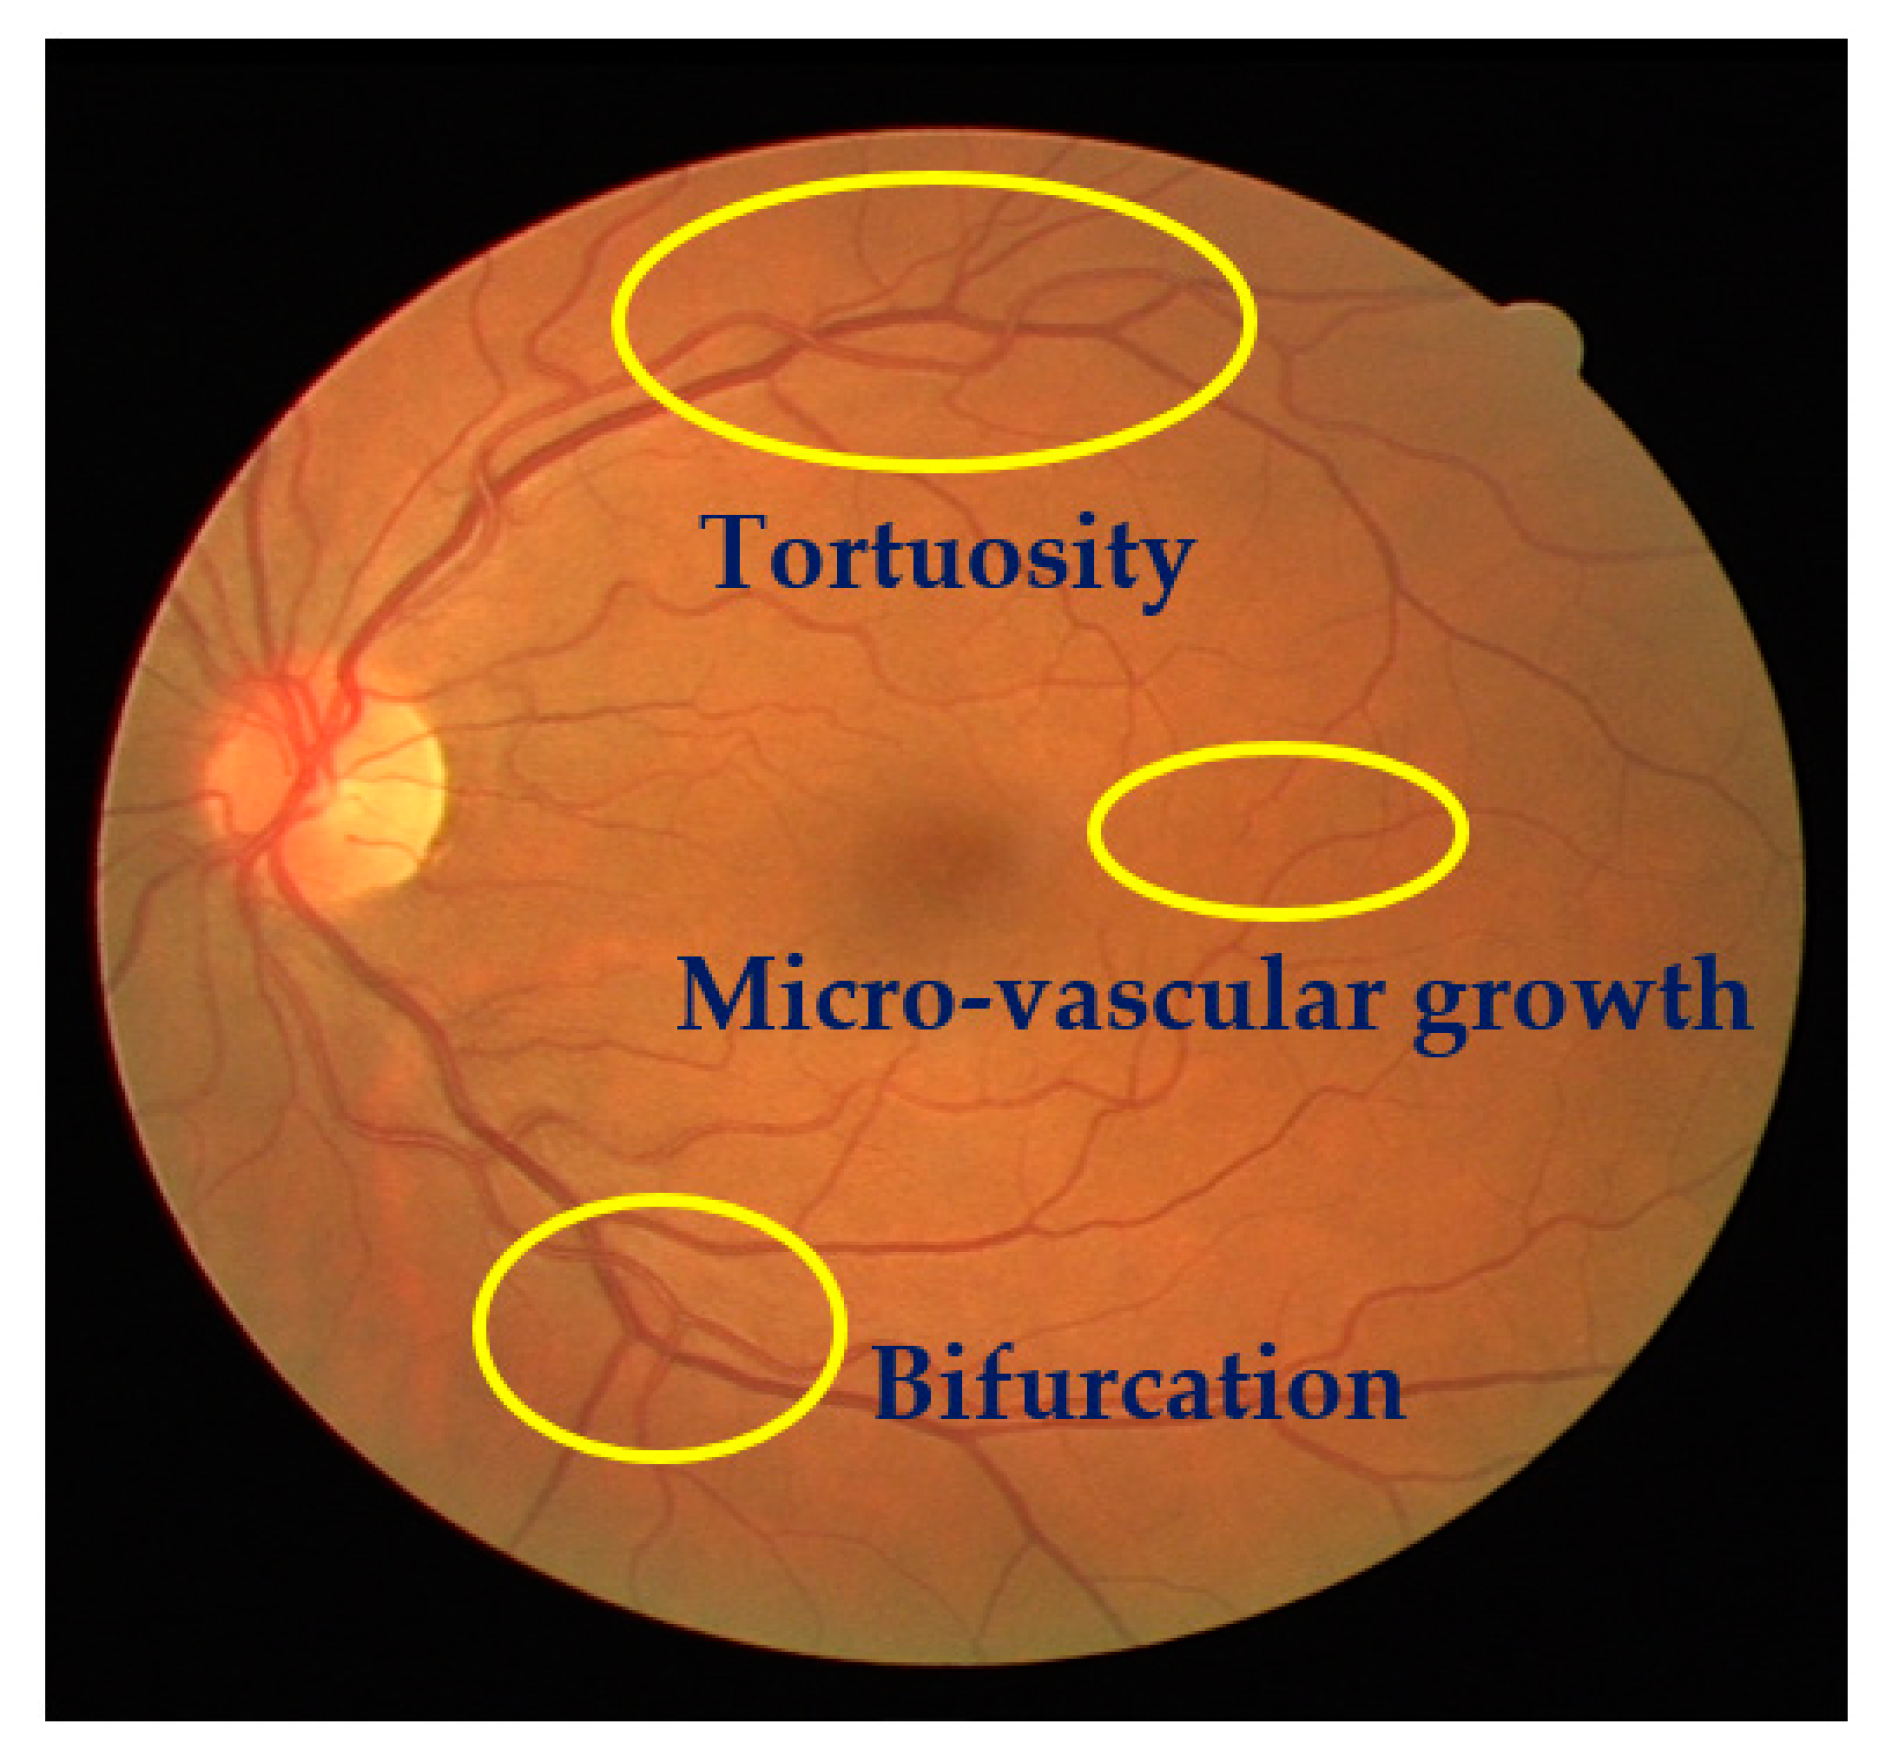
The detection of structural changes of the retinal vascularization system in color fundus angiography is a critical and repetitive task for clinical personnel. Accurate vessel segmentation leads to fast and reliable assessment by the DR-CAD system. Additionally, the detection of geometrical-based vessel features and secular changes of vessels, as shown in Figure 4, assists less experienced doctors in the accurate diagnosis of DR. Retinal vessel segmentation methods in the literature can be divided into three groups: Supervised-based, unsupervised-based, and mathematical morphology-based methods.
Kaur and Mittal in [42] developed a vascular detection system using fundus images. Preprocessing was initially done to normalize the images from low contrast and non-uniform illumination. They extracted the pixel intensity and geometric features using a matched filter and then fed these to a neural network classifier to classify vessels from a non-vascular region. The authors obtained an accuracy of 95.45%. Their intermediate results are shown in Figure 5. However, the approach had less significance in the detection of lesions that contribute to an incorrect vascular structure. Neto et al. in [43] presented an unsupervised coarse segmentation approach for vessel detection with an average accuracy of 87%. They incorporated multiple concepts, i.e., mathematical morphology, curvature, and spatial dependency, with the coarse-to-fine method to accurately define thin and elongated vessels from vessel pixels. However, the algorithm was unsuccessful in the determination of the vessel diameter and was also found to be less satisfactory at segmenting vessel structures on low contrast images. To detect changes in the structural and micro-pattern of vessels, several textural descriptors were applied to extract vascular features. These features were fed into a forest classifier to classify true vessel points from non-vessel patterns [44]. A sensitivity (SE) of 96.1% and specificity (SP) of 92.2% in the classification of true vessel points was reported. A comprehensive review of supervised-related, unsupervised-related, image processing-related, and data mining-related algorithms is presented in [45,46,47] with high vessel segmentation results.
The study in [46] combined normal and abnormal retinal features with the patient’s contextual information at adaptive granularity levels through data mining methods to segment retinal vessels. The authors obtained more significant results than existing methods on larger datasets for the detection of vessels and other retinal pathologies. However, the system running time was highly expensive. Another study in [47] used the sequential application of image pre-/post-processing and data mining methods for vessel segmentation. Their framework reported an accuracy of 95.36% at the cost of a long processing time and low specificity (SP) for vessel segmentation. Zhang et al. [48] proposed an unsupervised vessel segmentation approach in which labelling inconsistencies from ground truth labels were optimized. Key point descriptors were furnished to generate a texton dictionary to distinguish vessel pixels from on-vessel intensities. The approach yielded an accuracy of 95.05%. However, this method suffers from false positive results around the disc and the left part of the peripheral region. These limitations can be overcome by utilizing some pre-processing steps in the future. Tan et al. [49] implemented a seven-layer-based convolutional neural network (CNN) for the segmentation of retinal vessels and reported a classification accuracy of 94.54%. Wang et al. [50] also used a CNN model with ensemble learning for vessel segmentation. They employed two classifiers, including CNN and random forest classifier, after image normalization to classify vessel parts from non-vessel structures. They obtained a classification accuracy of 97.5% at the cost of a long training time. Few machine learning techniques have been shown to have an excellent performance in vessel detection using retinal angiography, e.g., hybrid feature vector and random forest classifier [51], gumbel probability distribution (GPD) [52], and direction map [53]. The tool in [51] incorporated robust features from various algorithms into a 17-dimensional feature vector for vessel pixel characterization. This feature vector was then processed by the random forest classifier to distinguish vessel pixels from non-vessel pixels, and yielded an accuracy of 96%. Their proposed method was found to be computationally expensive because it followed 13 gabor filters to extract vessel features.
In a previous study [52], a novel matched filter named GPD was implemented after image contrast enhancement using PCA greyscale conversion and adaptive local contrast enhancement methods. A sequence of experiments was executed to select an optimal parameter that was then used to design a GDP filter. Finally, clearer vessel structures were extracted after post-processing followed by thresholding and length filtering with a 0.91 AUC. The authors in [53] recommended a direction map strategy called SEVERE (segmenting vessels in retina images) for vessel segmentation. They considered a green channel image from the color RGB image without following any preprocessing steps, and then direction maps were utilized for the segmentation of vessel patterns within images. Their method achieved an accuracy of 97%. Hassan et al. [54] used mathematical morphology for the accurate segmentation of retinal vessels. A smoothing operation was applied to enhance the vessel structure, and then vessel classification was performed using the K-means algorithm, with a 96.25% accuracy. Eysteinn et al. [55] applied an unsupervised model followed by a morphological approach and fuzzy classification for retinal vessel classification. The model achieved a classification accuracy of 94%. However, their method was computationally expensive and depended on human labeled data.
Differentiation among thin and thick retinal vessels has become a challenging task due to the existence of low contrast, the illumination of images, and the existence of bright lesions. For this reason, hybrid methods, like the phase-preserving denoising method, fuzzy conditional entropy (FCE) techniques, and saliency with active contour models, were exploited in [56,57,58] to detect thin and thick vessels. The authors in [56] recommended a multimodal mechanism for thin and thick vessel segmentation. Thin vessels were identified by using a phase-preserving line detection method after the subtraction of poor image quality, while the approximate level of thick vessels was identified using a maximum entropy thresholding method. Their application was noticeably powerful in the discrimination of thin and thick vessel structures in retinal images, with a 0.95 AUC. In a previous study [57], an integrated system was designed for the automatic extraction of diverse structures of blood vessels from fundus images. Original images were normalized using curvelet denoising and a band pass filter (BPF) to remove noise and enhance the contrast of thin vessels. A matched filter response was considered as a dataset by the FCE algorithm to identify the best thresholds. The differential evolution method was utilized on the best thresholds for the extraction of different vessel outlines, like thin, thick, and medium vessels, with an average accuracy of 96.22%. The multiplication of reflection and illumination components, called retinex theory, was applied to stable thin vessel contrast and global image quality. Afterwards, an image was divided into super-pixels and given to the saliency method to find interesting vessel regions. To refine the vessel detection results, an infinite ACM was considered to distinguish the complex patterns of vessels, yielding a 0.8 AUC [58].
Line detection and pixel-based techniques were applied in [59] for the segmentation of small vessels. After preprocessing, the line detection method was implemented for image segmentation. Long and medium size vessels were then localized using the adaptive thresholding method. Finally, the pixel-based tensor voting procedure was applied by for small vessel extraction. Farokhian et al. in [60] considered a bank of 180 Gabor filters followed by the optimization method, called an imperialism competitive algorithm, for vessel segmentation and reported a 93% precision. A Gabor filter is designed on the rotation degree of 1 scale to detect image and vessel edges. Next, an optimization method was then employed for accurate vessel segmentation. Similarly, a template matching approach using a Gabor function for the detection of the center of vessel lines after specification of the region of interest was considered in [61] for low contrast thin vessel structure extraction and presented a 96% accuracy. The template matching method was used to produce a binary segmented image and then binary image contours were reconstructed to match the image characteristics with the manually annotated contours in the training dataset. Eventually, low contrast thin vessels were extracted using a large dataset. All these mathematical morphology-based methods are reported as being less satisfactory based on the following reasons: (i) A large number of pre-/post-processing steps were utilized to extract the vessel tree; (ii) methods were tested on a small set of retinal images and had limited cover of the varied-sized locations of an image; and (iii) reported a much higher running time during the detection of vessel patterns, which, in practice, are less reliable in screening programs.
Kar and Maity [62] proposed a vessel extraction system based on the matched filter followed by curvelet and fuzzy c-mean algorithms. Initially, a curvelet transformation was applied to detect an object’s edges and lines. Further, a fuzzy c-mean algorithm was incorporated for vessel tree extraction, yielding an accuracy of 96.75%. Their method was unable to achieve a higher true positive rate. Zhao et al. [63] suggested a level set and region growing method for the segmentation of retinal vessels. They achieved an accuracy of 94.93%. A hardware-based portable application was proposed by Koukounis et al.
In [64], for the accurate segmentation of blood vessels., a proposed tool was used to segment vessels in three steps: First, a green channel of an RGB image was selected in the preprocessing step to improve the image quality; second, a matched filter was utilized on the normalized image to highlight the vessel points; and finally, different thresholds were applied for accurate vessel segmentation. However, the scheme was expensive regarding the capturing and loading of images. Imani et al. [65] presented a morphological component analysis (MCA) model for vessel segmentation, which showed a 95% accuracy. Contrast improvement of vessels was first completed and then MCA was employed for vessel and lesion segmentation. However, the approach was limited to the detection of complex components of an image, like large lesions and vessel tortuosity. A summary of the blood vessel detection algorithms is shown in Table 3, highlighting the utilized methods and databases and their size.

2.3. DR-Related Lesion Detection Methods

MA and HM localization and extraction is a challenging job due to varied size, color, and textural features on the fundus angiography. Therefore, the development of fast and reliable automated DR lesion detection tools is still a hot research area. Few recent studies regarding accurate MA and HM detection were encountered in the literature. MA assessment methods are divided into mathematical morphology, supervised-, and unsupervised-based methods, while HM segmentation methods are based on mathematical morphology, image processing, and machine learning-based methods, as described in the following subsections.
Habib et al. in [66] developed an intelligent MA detection application using color fundus images. They extracted MA features using the Gaussian matched filter and fed these to a tree ensemble classifier to classify true MA points from false MA pixels. The authors achieved a receiver operating curve score (ROC) of 0.415. The disadvantage of their proposed method is that it does not avoid the overfitting problem and is unable to define a standard feature selection principle. Kumar et al. in [67] also considered a Gaussian filter to extract MA features from images. A green channel was selected for further processing, i.e., the removal of vessels and the optic disc using a watershed transformation method to localize the MA region. Finally, microaneurysms were segmented using a Gaussian matched filter with an accuracy of 93.41%. Similarly, canny edge and maximum entropy-based methods were utilized by Sreng et al. in [68] to detect MAs in fundus images. After the removal of vessels and the disc area in the image normalization step, MA patterns were segmented using canny edge and entropy methods. To obtain prominent MA marks within the image, a morphological operation followed by erosion was employed to identify MA patterns, obtaining an accuracy of 90%. Both these methods [67,68] were unsuccessful in overcoming spurious signals during micro-aneurysm detection. The authors in [69] applied Gaussian, median, and kirsch filters to the green component of an RGB image to extract MA features. Those MA features were then fed to a multi-agent model to discriminate true MA pixels from non-MA pixels, yielding an ROC of 0.24. They did not evaluate all possible image locations for optimum MA detection.
In a previous study [70], a series of image processing techniques, such as contrast enhancement and feature extraction, were used to present some novel hypotheses for improved MA detection software. Wu et al. in [71] considered some local and profile features for MA detection. First, images were processed to reduce noise and other image artifacts to enhance the MA region. Further, a K-mean-based neural network classifier was utilized on the image features to classify MA pixels from non-MA pixels. The authors obtained an ROC of 0.202. Nevertheless, use of the approach on the very noisy images failed to localize MA pixels. Romero et al. in [72] recommended bottom-hat and hit-or-miss transform methods for MA extraction after normalization of the gray contents of an image. To obtain an intact reddish region with a brighter part, a bottom-hat transformation was applied on the gray scale image. Blood vessel elimination was done using a hit/miss transformation application and finally, principal component analysis (PCA) and radon transform (RT) were applied to detect true MA points. They achieved a classification accuracy of 95.93%. Similarly, a top-hat transformation and an average-based filter was applied in [73] for the elimination of retinal anatomic components with a 100% specificity. Afterwards, a Radon transform (RT) and multi-overlapping window were utilized for the cleavage of an optic nerve head (ONH) and MAs. The authors achieved an SE of 94%. However, the methods in [72,73] were computationally expensive and could not locate MA points in the low contrast MA pixels. For the segmentation of tiny and poor contrast MA features, a naïve Bayes classifier and location-based contrast enhancement were implemented in [74,75], with significant MA results.
The authors in [74] considered a coarse segmentation method to initially localize the MA candidate region. Further, a naïve Bayes classifier was applied to extracted MA pixels and discriminated true MA points from non-MA points, yielding a classification accuracy of 99.99% and an SE of 82.64%. However, their classifier, i.e., naïve Bayes, was computationally expensive during training and was also limited on faint and blur MA pixels. To solve this problem, a contrast limited adaptive histogram equalization (CLAHE) technique was implemented in [75] to detect poor contrast and blurry MA pixels. They divided input images into small and contextual tiles in order to detect tiny and low contrast MA pixels. They obtained an SE of 85.68%. However, their approach was only tested on 47 images, which limits its generalizability to other medical ailments. A sparse representation classifier (SRC) was applied in [76] followed by dictionary learning (DL) to detect MA pixels. Initially, a Gaussian correlation filter was incorporated to localize the MA region. Further, those MA features were given to the SRC to classify true MA points from non-MA pixels. The authors achieved an SE of a 0.8% increase rate. However, their proposed dictionaries were generated artificially, thus lacking discriminative power in MA detection. Akram et al. in [77] implemented a system to grade whether retina images belong to MA or non-MA regions. The authors obtained an accuracy of 99.40%. However, the method was computationally expensive, but presented better features for improving the discriminative performance of the classifier. In that line, sparse principal component analysis (SPCA) and ensemble-based adaptive over-sampling approaches also reduced false positives in MA detection and eliminated the class imbalance problem in color fundus images with an average 0.90 AUC score [78,79]. Javidi et al. in [
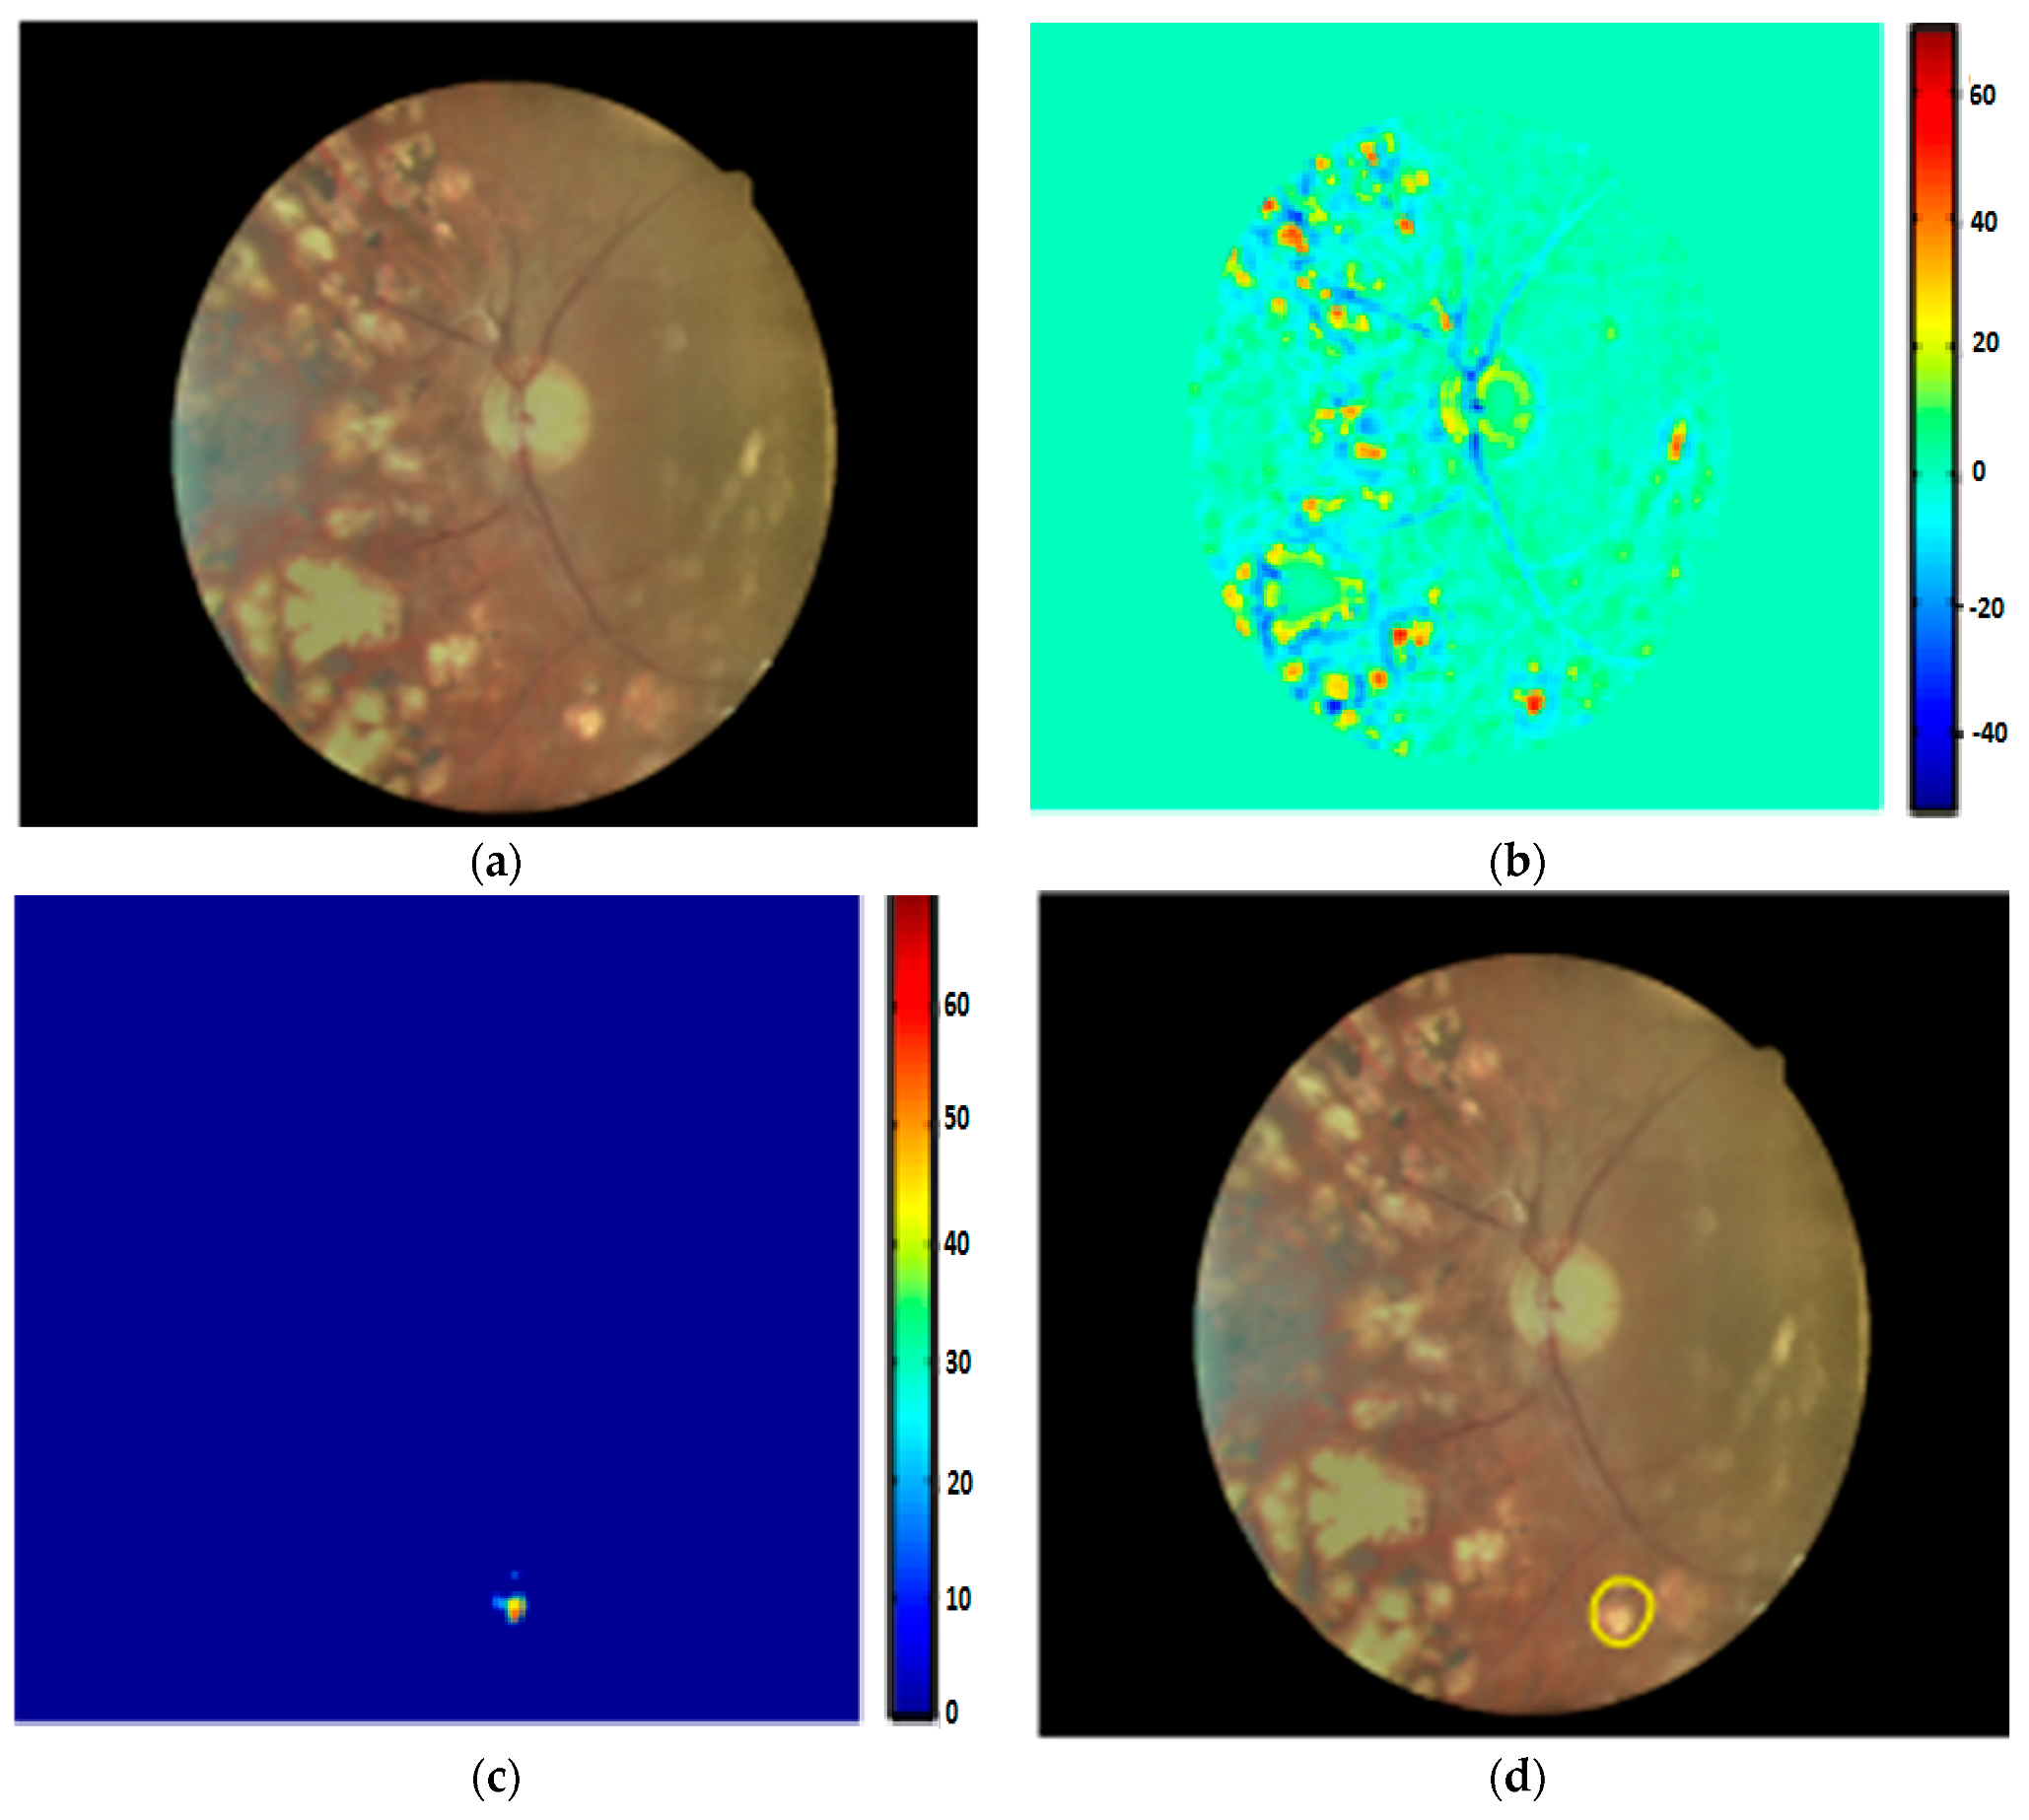
80] considered morphological analysis and two dictionaries for MA detection using fundus images. The MA candidate region was initially localized using the morelet-based wavelet algorithm. The MA extracted features were then evaluated by binary dictionaries to classify the true MA region from non-MA pixels. The authors obtained an ROC of 0.267. Their proposed MA detection results are shown in Figure 6.
Nevertheless, the method was expensive in terms of the execution time and was unable to detect MA pixels on faint and poor contrast images. A deep learning strategy called stacked sparse auto encoder (SSAE) was applied by Shan et al. in [81] for MA detection. Initially, images were cropped into small patches. These patches were then processed by the SSAE model to learn high-level features from patches. Finally, a soft max classifier was used in the output layer to give a patch probability of being a true MA or false MA. They reported an AUC of 96.2%. Another study in [82] proposed a two-layer approach called multiple kernel filtering for MA and HM segmentation. Small patches were used instead of the whole image to deal with the varied size of lesions, and finally, a support vector machine (SVM) was applied on selected candidates to distinguish true MA and HM patterns from other parts of an image. They achieved an AUC of 0.97. Adal et al. in [83] presented a machine learning algorithm for MA detection. Input image was first normalized and then different scale-based descriptors were applied for feature extraction. Finally, a semi-supervised algorithm was trained on the extracted candidate features to classify MA points from non-MA intensities, obtaining an AUC of 0.36. The methods in [81,82,83] were found to be unable to address the over fitting problem for much larger datasets and contained low discriminative power. A summary of MA detection methods is given in Table 4. It describes the respective methods with their utilized dataset and size.
Kaur et al. in [84] implemented a supervised model for hemorrhage detection using 50 retinal images. A morphological closing operation was initially applied for the removal of anatomic components, such as fovea and vessels. HM points were then extracted using an adaption of Otsu’s thresholding-based method. These features were fed to a random forest classifier to distinguish HM and non-HM candidates with an SE of 90.40% and an SP of 93.53%. Their visual HM detection results are shown in Figure 7. Another study in [85] also used Otsu’s approach to suppress the vascular structure before hemorrhage extraction. The authors achieved an SE of 92.6% and an SP of 94% using 219 fundus images. However, hemorrhages near the border of the image aperture were not detected in [84,85], with some bifurcation of vessels present after vascular tree extraction. The detection of HM patterns that are very close to the vascular structure is observed to be a time consuming and difficult task for clinical practitioners. To deal with this issue, rule-based mask detection [86], splat-based segmentation algorithms [87,88,89], and basic knowledge of inter-/intra-retinal structures [90] have produced impressive quantitative results.
In a previous study [86], an image normalization step was applied to remove the normal features, i.e., blood vessels, disc, and fovea, and to improve the contrast of an input image. To localize the HM region, three Gaussian templates were employed, yielding an SE of 93.3% and an SP of 88%. The authors in [87,88,89] considered splat-based HM segmentation methods with different configurations. Despite the better visual HM detection results, they did not present numerical measures when using a large number of tested images. The authors in [90] utilized mathematical morphology and template matching methods to detect HMs in images, obtaining an accuracy of 97.70%. Some machine learning and pixel-based approaches for the detection of HMs were highlighted in [91,92,93,94]. In a previous study [91], a number of the automated DR screening and monitoring methods for HM detection were discussed regarding their basic framework, problems, datasets, and solutions. This review facilitated the authors’ understanding of the role of automated screening tools in DR grading. The automated HM detection tools in [92,93] utilized an illumination equalization method on the green channel to localize white and HM pixels. Support vector machine (SVM) was then applied onto the localized region and HM features were classified from normal pixels. Another image processing based software for HM detection using 89 retinal images was reported in [94], where dynamic thresholding with morphological operations were employed to estimate the HM region in the retinal image. Their application obtained an accuracy of 90%. Nevertheless, the methods [92,93,94] are computationally expensive and are limited to covering all possible locations of an image. Similarly, in a previous study [95], a three steps-based HM detection system using 108 images was proposed. Brightest features were initially localized based on the varied intensities of fundus components. Four texture forms were then extracted from the bright pixels and eventually, a classifier was trained using the textural descriptors to separate HM pixels from non-HM pixels. The authors achieved an accuracy of 100%.

2.4. Exudate Detection Methods

Exudate is a prime sign of DR, appearing as a bright white/yellowish blob shape on the retinal surface. In the literature, EX extraction techniques are categorized into three parts: Pixel-based, mathematical morphology, and machine learning. The following section discusses these EX detection methods.
Anatomic retinal landmarks, such as an elongated vascular system and optic disc, lead to the production of false positives in the automated detection of exudates. Therefore, a morphological matched filter and saliency methods were employed by Liu et al. in [96] to eliminate vessels and the optic disc before EX detection. Initially, an input RGB image was preprocessed to visualize retinal anatomic features and to enhance image contrast. Next, vessel and disc components were removed using a matched filter and saliency techniques to localize the EX area in the image. Finally, the random forest classifier was applied on the extracted features, i.e., size, color, and contrast of exudates, and an SE of 83% and an accuracy of 79% was reported using 136 fundus images. Imani et al. [97] considered a morphological component analysis (MCA) model to separate retinal vessels from the exudate region using 340 images. Afterwards, mathematical morphology and dynamic thresholding methods were incorporated for the distinguishing of EXs from normal features, yielding AUC of 0.961 score.
In a previous study [98], a multiprocessing scheme was introduced for EX detection using 83 retinal images. First, an exudate candidate region was extracted by applying grey morphology and then the boundaries of these candidates were segmented using an ACM model. Lastly, the features computed by the ACM were fed to the naïve Bayes classifier, and classified exudate features with an SE of 86% and an accuracy of 85%. Zhang et al. in [99] developed an EX segmentation method based on mathematical morphology using 47 images. After image normalization, classical and textural features were employed using mathematical morphology and then EX features were segmented with an AUC score of 0.95. The authors in [100] also applied mathematical morphology for EX extraction using 149 images. The final EX classification was performed using the SVM classifier, obtaining an accuracy of 90.54%. Akram et al. in [101] recommended a mean-variance approach for vessel and disc removal using 1410 images. Bank filters were utilized for the selection of EX points and finally, images were classified into EX and non-EX pixels by utilizing a Gaussian mixture with an integration of the m-mediods model, achieving a 0.97 AUC score. Region-based local binary pattern features were suggested by Omar et al.
In [102], using 130 images, the image quality was enhanced for EX detection, with a 96.73% accuracy. Morphological operations, like mean shift, normalized cut, and cannys, have presented better performance in EX extraction [103]. Several machine learning principles have shown better sensitivity results for EX segmentation [104,105,106,107,108,109,110,111]. Fraz et al. in [104] applied morphological reconstruction and a Gabor filter for EX candidate extraction using 498 images. Initially, false positives were reduced in selected candidates using contextual cues. Region-based features, computed from the candidate area, were then fed to an ensemble classifier for the detection of true and false EXs, yielding a 0.99 ROC score. Prentasic et al. in [105] proposed a deep CNN for exudate segmentation using 50 images. The optic disc was segmented based on the probability maps of different algorithms. The Frangi filter was then implemented for vessel segmentation. Finally, the performance of the DCNN was combined with the disc and vessel results to segment true EX pixels, obtaining a 0.78 F-score. Similarly, SVM classifiers with sparse coded features, K-means, scale invariant feature transform, and visual dictionaries were exploited in [22,106,107] to distinguish non-EX from EX points. Logistic regression followed by multilayer perceptron and radial basis function classifiers successfully classified hard exudates using 130 images with a 96% sensitivity [108]. Ground truth data usually have an inaccuracy problem that directly affects the final classification output of an algorithm. Therefore, in a previous study [109], image features were evaluated for the elimination of inaccuracy in clinical data and the segmentation of exudates. Pereira et al. in [110] utilized an ant colony optimization (ACO) technique to extract EX edges using 169 low contrast images. The green channel was selected because of its higher intensity of EX lesions compared to the background part of an image. Next, a median filter with kernel size of 50 x 50 was utilized to normalize and balance the intensity space. A double threshold was applied to extract EX points and then ACO was employed to detect the borders of bright lesions, yielding a 97% accuracy. Figueiredo et al. in [111] applied wavelet band analysis on the green channel to learn the whole image’s features. Hybrid approaches, like Hessian multiscale analysis, variation, and cartoon with texture decomposition, were then applied on the learned features to discriminate EXs from other bright lesions. They achieved an SE of 90% and an SP of 97% using 45,770 fundus images. Their EX segmentation results are shown in Figure 8.
Despite the highly significant results of the EX detection methods in [96,97,98,99,100,101,102,103,104,105,106,107,108,109,110,111], some weaknesses exist that need to be addressed in the future to provide the best possible EX detection systems: (I) Most methods were evaluated on small datasets, which limit theirs performance ability to detect other pathological features, e.g., dark lesions; (II) only bright lesions, i.e., EXs were detected followed by preprocessing steps, which is expensive in terms of processing; (III) high accuracy was achieved at the cost of a low SE rate; and (IV) it is difficult to detect EXs in low contrast areas.

2.5. Diabetic Retinopathy Detection Systems

CAD tools have been successfully applied to identify the five stages of DR and produce similar results to human experts. The fundamental goal of CAD systems in DR is to distinguish retinal anatomic components from DR-related lesions. To address this, some recent DR-based CAD studies are highlighted in the subsequent paragraph with their results and challenges.
Kaur et al. [112] proposed a DR screening tool to detect exudates using 1307 images. Their algorithm segmented exudates with a mean accuracy of 93.46%. Bander et al. [113] developed a computer-aided diagnosis (CAD) system to segment OD and fovea using 11,200 retinal images acquired from the MESSIDOR and Kaggle datasets. The OD and fovea were detected by employing a multiscale deep learning model with an accuracy of 97% and 96.7% on the MESSIDOR and 96.6% and 95.6% on the kaggle databases, respectively. Gargeya et al. [114] also proposed a deep learning model for the grading of DR and no-DR cases. Their model evaluated the color features of 75,137 images obtained from the MESSIDOR2 and e-OPTHA datasets and achieved an AUC of 0.94 and 0.95, respectively. Silva et al. [115] evaluated 126 images from 69 patients for the early screening of DR. Their application detected MA and HM features with a kappa value of a 0.10 ratio. Dash et al. [116] developed a DR screening tool based on the segmentation of vascular structures. Their software used 58 images obtained from the DRIVE and CHASE_DB1 datasets and achieved a 0.955 and 0.954 accuracy, respectively.
Leontidis [117] presented a DR-CAD system to detect vessels. Vessels were classified based on geometric vessel features with a classification accuracy of 0.821 and 0.968, respectively. Koh et al. [118] presented an automated DR tool to identify normal and pathological images based on energy and entropies with a sensitivity and specificity of 89.37% and 95.58%, respectively. A comprehensive study about the causes and automated screening of different retinal pathologies, like DR, cataract, and glaucoma, in a younger and adult population were discussed in [119]. Their review may be useful in finding a novel hypothesis for the screening of retinopathies. Barua et al. [120] developed a DR screening tool to extract retinal vessels using 45 images acquired from the HRF database. Image features were classified by applying ANN with classification accuracy of 97%. R et al. [121] presented a machine learning algorithm for DR screening to locate EXs and HMs using 767 patches with an accuracy of 96% and 85%, respectively. Several deep learning, machine learning, and data mining approaches were discussed in [122,123] for the the segmentation and classification of anatomic and DR lesions, image quality assessment, and registration. Devarakonda et al. [124] also applied ANN and SVM classifiers to extracted features for the identification of normal and DR parts. Their system achieved an accuracy of 99% using 338 images acquired from a local dataset.
Vo et al. [125] developed a deep learning model for DR screening using 91,402 images obtained from the EyePACS and MESSIDOR datasets. Their software utilized two deep networks and hybrid color space features and achieved ROC values of 0.891 and 0.887, respectively. Lahiri et al. [126] also proposed deep neural networks for DR screening to detect blood vessels using 40 images obtained from the DRIVE dataset. Their model achieved an average accuracy of 95.33%. In [127], a two-step deep convolutional neural network was presented for lesion detection and DR grading using 23,595 images from the Kaggle dataset. Their proposed architecture obtained an AUC of 0.9687. Wang et al. [128] utilized a deep convolutional neural network to detect lesions and screen DR severity stages using 90,200 images from the EyePACS and MESSIDOR data sources with specialists’ labels. Their system identified the severity levels of DR with AUC values of 0.865 and 0.957, respectively. Another deep learning-based study, termed the AlexNet deep convolutional neural network, was employed by [129] to classify the five classes of DR using 35,126 images selected from the Kaggle dataset. Their method achieved a diabetic retinopathy classification accuracy of 97.93%. Lachure et al. [130] utilized morphological operations and SVM classifiers to detect MA and EX lesions using color fundus angiographies. Their application successfully detected MA and EX regions with a specificity of 100% and a sensitivity of 90%.
Nijalingappa et al. [131] applied a machine learning model to detect EX features using 85 images from the MESSIDOR and DIARETDB0 datasets. Initially, image preprocessing followed by RGB to green plane conversion and contrast enhancement were performed. The K-nn classifier was used on extracted features to classify EX regions with an accuracy of 95% on MESSIDOR and 87% on DIARETDB0. Kunwar et al. [132] proposed a CAD tool for the recognition of the severity level of DR using 60 subjects acquired from the MESSIDOR dataset. Textural features of MAs and EXs with the SVM classifier were applied to classify DR and normal lesions with a sensitivity of 91%. A real time, web-based platform was introduced by [133] for the recognition of DR levels. Their system achieved a sensitivity and specificity of 91.9% and 65.2% in the detection of NPDR lesions. However, the DR-based CAD methods in [112,113,114,115,116,117,118,119,120,121,122,123,124,125,126,127,128,129,130,131,132,133] mainly focused on the detection of DR-related lesions and were limited by the severity category of DR. The DR severity level, i.e., PDR, has been addressed rarely by the CAD systems. They only produced a contribution to differentiate between NPDR and PDR. Moreover, these CAD studies were found to be less applicable to the classification of the five stages of DR.

3. Latest Trends

Deep learning (DL) is a novel approach to machine learning and is applied in a diverse range of computer vision and biomedical imaging analysis tasks, such as image classification, face recognition, semantic segmentation, and many more, with remarkable results. It can be thought of as a multilayered hierarchical architecture that attempts to learn high level abstractions in the data. There are three main reasons for the popularity of deep learning: (I) A rapid degree of improvement in the chip processing power, e.g., graphical processing units (GPUs); (II) lowered cost of computing hardware availability; and (III) considerable innovations in the machine learning methods [134,135].
To date, standard organizations, i.e., Google and Microsoft, use deep learning-based schemes to solve challenging problems, e.g., object detection, speech recognition, etc. Moreover, deep learning methods contain a significant number of advantages, such as they can learn low level features from data using minimal processing, an ability to work with unlabeled data, high cardinality with class memberships, ability to identify interactions among features, and can jointly learn feature extraction with discriminative power. The learning mechanism of deep learning models is usually operated in a multilayered fashion. It uses multiple techniques to process input data and automatically convert it into decent representations. Initially, the first layer extracts pixels from the input image. Next, these pixels are grouped into the second layer to identify edges within an image. These edges are then divided by the third layer into small segments. Finally, some other layers convert these segments into the classification/recognition of images. All these layers learn features from the input data using learning procedures and without expert intervention [135,136,137,138].
It is evident that deep learning is a powerful tool in today’s artificial intelligence-based tasks. Recently, one deep learning method, i.e., convolutional neural network (CNN), has produced impressive results in biomedical imaging and CAD systems, e.g., cancer, brain tumor, and retinopathy detection [139,140]. Since DR is a life-threatening disease and requires early diagnosis to control its prevalence in patients, computerized tools have proven to be effective in early DR assessment, however, a gap remains regarding fast and real time solutions for DR prediction. To overcome this gap, deep learning algorithms have been recently employed in DR-telemedicine programs and have outperformed human observations. The most important deep learning algorithms are described in Table 5.
To date, the convolutional neural network (CNN) is a leading deep learning scheme that mainly contains convolutional, pooling, and fully connected layers. These layers are often trained in a robust manner and play different roles. CNN is a feed forward neural network type and has been found to be effective in the classification of DR stages using fundus images. Each layer of the CNN has a collection of neurons that process input data into parts called centripetal areas. Each neuron outcome is then mixed to maintain overlapping among input areas to better represent the original image information. This procedure is pursued for all layers until desirable results are achieved [135,136,137,138,139,140,141,142].
Usually, a convolutional layer consists of filters, F, with K channels and a size, C X D, against a small set of L images with K channels and a size, A X B. To present filter components as E f, h, I, o, and image factors as Gm, h, p + I, q + o, the output of a single convolution layer, Z m, f, p, q, w.r.t time t is calculated by Equation (1):
Z m ,   f ,   p ,   q = [ k = 1 K o = 1 C i = 1 D   G m ,   h ,   p + I ,   q + o   E f ,   h ,   I ,   o ] t
Equation (2) represents the entire output of an image in 2D structure as follows:
Z m ,   f = k = 1 K G m ,   h E f ,   h ,
where ∗ indicates a 2D association. The typical CNN pipeline is given in Figure 9.
CNN is widely adopted by researchers due to its enormous potential, such as it employs a shared weight mechanism in the convolution layer to locate each pixel using a single filter. The CNN model requires a small number of preprocessing steps because it can learn features by itself. During the training of the CNN model, human intervention and previous knowledge is not required to design the model features. The CNN can represent an image in two-dimensional form followed by shared weights and the relationship among neurons. The convolution layer output is found as being invariance to the object location. CNN is observed to be more computationally efficient than fully connected networks, because it uses fewer parameters with the same number of hidden layers to run multiple experiments. Moreover, it represent neurons in the three-dimensional form, namely weight, height, and depth. Back propagation and gradient descent methods are commonly applied to train CNNs and to make them faster at learning and convergence. The main demerit of CNNs is that it needs a large amount of memory to store the results of the convolutional layer that finally forwards to the back propagation layer to compute gradients [143,144,145,146,147,148,149]. Some of the other variants of CNN networks, like Alexnet (https://github.com/BVLC/caffe/tree/master/models/bvlcalexnet), Lenet (http://deeplearning.net/ tutorial/lenet.html), faster R-CNN (https://github.com/ShaoqingRen/fasterrcnn), googlenet (https://github.com/BVLC/caffe/tree/master/models/bvlcgooglenet), Resnet (https://github.com/gcr/ torch-residual-networks), and VGGnet (http://www.robots.ox.ac.uk/vgg/research/verydeep/), were recently implemented by the authors and found to be highly effective in traditional artificial intelligence applications with competitive results [24].
Besides the success of CNN in DR assessment, Prentasic [150] reports a study on the handcrafted-based image classification methods used to automatically detect DR in retinal images. These methods only rely on the preprocessing, localization, and segmentation of basic and DR pathological retinal feature steps to grade DR. Likewise, [151] proposed a DR screening system where features, like the area of vessels and MAs, were initially extracted from the fundus image. Those selected features were then fed to a naïve Bayes classifier to recognize the three severity levels of DR, such as normal, NPDR, and PDR. Moreover, in the study of [152], a color normalization and image segmentation method was applied to detect blood vessels, EXs, and MAs for DR diagnosis. To gain more insight into the handcrafted-based DR screening methods, an extensive literature is given in Section 2, respectively.

4. Discussion

Digital fundus photography is a screening tool for diabetic retinopathy. Most clinical principles recommend this examination throughout the lives of diabetic patients especially those with mild and moderate retinopathy. It is noticed that per annum, 50% of diabetic patients in the US and 30% in France are recommended for DR screening. Due to this factor, the proper checkup of patients has become an exhaustive and polemic job for clinical experts. However, computerized screening programs have the ability to perform fast classification of DR stages using fundus images.
This review presents the significance of various computational deep learning, image processing, and machine learning algorithms in CAD systems to identify DR stages using fundus images. Those CAD systems are based on the correct segmentation of DR-related lesions, such as microaneurysms, hemorrhages, and exudates, within the fundus images. All these computational methods were published from 2013 to 2019, and collected from the most prestigious and popular databases, such as the Institute of Electrical and Electronics Engineers (IEEE), the association of computing machinery (ACM), Mendeley, Elsevier, and PubMed.
From the development view of DR-based CAD methods, few facts are highlighted. The efficiency of DR-CAD systems relies on the direct segmentation of certain DR-related structures within color fundus images, something that is prone to error and is computationally expensive. This step can make the complete system less reliable. Some other methods have used outdated machine learning and image processing techniques without quantitative measurements using an adequate amount of images. Regarding DR diagnosis, most DR screening tools are based on the identification of DR and non-DR classes, which in practice are not acceptable in the real-time detection of the five stages of the DR severity level. Some CAD studies are devoted to the five stages of DR assessment. Still, those CAD systems are dependent on the domain expert knowledge to observe inter/intra variations of retinal features. Most machine learning methods have been recognized in DR grading, but do not cover all symptoms of DR.
In future, the performance of the reviewed DR-CAD methods can be improved by incorporating the following solutions: (I) Provide a much larger dataset of high resolution images, collected from a diverse range of ethnicities; (II) utilize a combination of dynamic features, such as hand-engineered and non-hand engineered, with robust classifiers to get a higher classification performance, especially in the national criteria of DR severity levels; (III) employ some novel color space/appearance models need to provide better characterization of image complex patterns, (IV) overcome the four levels of the DR database issue with five DR levels; and (V) identify severe DR in four quadrants using a larger dataset. Moreover, the assessment of diabetic macular edema (DME) should be examined in the future because it damages the vision of diabetic patients at a rapid rate, and thus requires an immediate treatment of patients. Recently, ophthalmologists have introduced two diagnosis parameters, i.e., DRRI and standard index (STARD), extracted from the clinical features. It is a numeric value consisting of different thresholds used to detect disease levels. Therefore, it can be a useful option for clinicians to employ them in the measurement of DR classification results [153,154,155,156].

4.1. Deep Learning-Based Methods

Deep learning has achieved promising performances in various computer vision and healthcare tasks especially in the detection of diabetic retinopathy (DR). However, there are some significant challenges and underlying trends of deep learning, as covered in the following paragraphs.
Deep learning has proven to be a revolutionary scheme in addressing computer vision applications, however, the theoretical background behind the DL remains to be determined. For example, how many layers should be convolutional and pooling/recurrent, how many nodes per layer to perform certain task, and which structure should be better than another? The human vision system (HVS) has performed remarkably in computer vision tasks, even in the presence of geometric transformations, occlusion, and background variation problems. Due to this reason, HVS is considered a more powerful choice than deep learning methods. To overcome this gap, human brain studies should be incorporated into deep learning methods to improve their performance. Moreover, the number of layers should be increased for the selection of middle/high-level features to understand human brain structure.
Deep learning models demonstrate a significant potential capacity, once trained on a large datasets. It is noticed that the shortage of datasets limits and harshly affects the training and learning accuracy of DL networks. In the reviewed studies, two commonly used solutions are proposed to maximize the training data: The first remedy is to generalize data from the available data using the data augmentation method (e.g., rotation, cropping, scaling, and mirroring) in a horizontal or vertical way. The second remedy is data collection using weakly supervised learning methods.

4.2. Comparisons Between Deep Learning and Traditional Methods

Table 6 describe the state-of-the-art comparisons between retinal feature and lesion detection methods on the same dataset based on hand-crafted and deep features. This table indicates that the deep features-based classification methods outperform conventional algorithms in terms of the extraction of features. In past systems, the authors mainly utilized CNN variants of deep-learning algorithms.
Moreover, in Table 7, a performance comparison between traditional methods and deep learning approaches is shown in order to endorse the superiority of deep learning-based methods over traditional methods in retinal feature detection. These methods are reported in [122] for optic disc and MA segmentation and localization, based on hand-engineered features and CNN-based methods. The discussed methods were tested on the same datasets and statistical metrics. As seen in Table 7, on the MESSIDOR dataset, the deep learning-based method provided a higher accuracy (96.40%) than the hand-crafted-based method (86%) for OD segmentation whereas on the DRIVE dataset, the traditional-based method achieved a smaller accuracy (75.56%) than a variant of deep learning-based methods, i.e., CNN, yielding 92.68%. For OD localization, deep learning-based methods [122] obtained less accuracy then hand-engineered-based arts. While in MA detection, deep learning-based methods yielded a higher accuracy than traditional methods.
Earlier versions of CNNs were observed to be less applicable in real-time due to the requirement of more computational resources. Now, deep learning methods have been improved, leading towards real-time applications. For instance, He et al. [157] presented a real-time applicable DL architecture by reducing the filter size and running time. They also proposed a flexible activation function to increase the computational power of DL models. Similarly, Li et al. [158] minimized computational efforts between forward and backward propagation in DL models, which made the CNN performance more efficient for crucial problems. The DL efficiency can be further enhanced by fixing the time complexity and implementation through GPUs.

4.3. Future Directions

Although deep learning algorithms have proven to be important in today’s image and video processing applications, some possible directions remain that should be addressed for the development of powerful DL networks. In fact, deep learning (DL)-based methods are also utilized for the development of an automatic diagnosis system for DR. There are many variants of DL methods, but, in the past, studies have mostly utilized CNN models to design deep multi-layer architectures for the detection of DR from retinal fundus images. However, the annotation of these images requires ophthalmologists, which is a very expensive and time consuming job. Therefore, the design of DL-based methods that can learn from a limited dataset of fundus images is necessary. Also, in general, there is another class imbalance problem that can occur in the case of developing an automatic solution for DR retinal fundus images. It is important to explore the class imbalance problem for the development of DL-based methods in the case of learning biases for a specific class.
The development of deep learning-based strategies compared to traditional methods requires the following important steps.
  • Enhancing the generalization ability of the DL networks by increasing their size, e.g., by adding the number of levels and units in each layer. One such type of DL model called GoogleNet contains 22 layers.
  • Establishing a layer-wise feature learning mechanism in the network. Each layer can learn their successive layer features and vice versa. DeepIndex [159] is one of these types of models that learns features in a hierarchical learning fashion.
  • Incorporating/combining hand-designed and non-hand-designed features to obtain better generalized models.
  • The current DL models rely only on shared weights to make their choices, which may not be adequate. There is a need for application-based deep networks that do not depend on the existing models. Ouyang et al. [160] developed an object detection model, verifying that object level notions are more viable than image level notions.
Moreover, the existing DL models’ performance could be enhanced by integrating the dynamic size of deep learning architectures with their results in the cascaded mode. Thus, this can eliminate the larger computational costs, requiring the training of individual DL networks to execute tasks independently. For instance, Ouyang et al. [160] utilized a two-stage training procedure, in which previous stage classifiers were integrated with the current stage classifier to correctly classify misclassified images. Sun et al. [161] designed a three-class CNN model for face recognition. The initial facial points were estimated by the first class CNN and then the remaining two class CNNs were applied to fine-tune the initial predictions. Wang et al. [162] proposed a hybrid network for object recognition. The first network was used to locate objects while the second network was utilized on the previous network output for the estimation of object coordinates.

5. Conclusions

This article conducted a comprehensive survey into automated DR screening algorithms from over 162 research papers, outlining their challenges and results in the detection of structural variations of fundus salient features using digital fundus images. Initially, the role of fundus images in an image acquisition step for the development of DR-based CAD systems was described as well as recorded as being more robust than other retinal modalities. In addition to the significance of fundus modality, the objective of common statistical parameters used in the evaluation of CAD systems was also briefly discussed. Next, state-of-the-art computerized methods were discussed in detail to gain an understanding of their framework for the segmentation and classification of fundus features using publicly and non-publicly available retinal benchmarks. Finally, the main challenges of the automated DR methods along with their possible solutions were demonstrated in the discussion. The current automated DR screening methods were noted as being promising. In the future, these methods should be evaluated on much larger datasets of high resolution images for the recognition of the five severity levels of DR and a fine-tuning of their internal structure should be performed for the production of highly reliable, fast, and real-time diagnosis settings of diabetic retinopathy.

Author Contributions

Conceptualization, I.Q.; methodology, I.Q.; software, I.Q.; validation, I.Q.; formal analysis, I.Q., Q.A.; investigation, I.Q., Q.A.; resources, I.Q.; data curation, I.Q., Q.A.; writing—original draft preparation, I.Q.; writing—review and editing, I.Q., Q.A.; visualization, I.Q., Q.A.; supervision, J.M.; project administration, J.M.; funding acquisition, J.M.

Funding

This work is supported by the National Natural Science Foundation of China (NNSFC) under the grant no: (61672322, 61672324).

Acknowledgments

This work is supported by the National Natural Science Foundation of China (NNSFC) under the grant no: (61672322, 61672324) and is part of a PhD research project conducted in the intelligent and media research center (iLEARN), School of Computer Science and Technology, Shandong University, Qingdao, China.

Conflicts of Interest

The authors declare no conflict of interest.

References

  1. Kavakiotis, I.; Tsave, O.; Salifoglou, A.; Maglaveras, N.; Vlahavas, I.; Chouvarda, I. Machine learning and data mining methods in diabetes research. Comput. Struct. Biotechnol. J. 2017, 15, 104–116. [Google Scholar] [CrossRef]
  2. Mookiah, M.R.K.; Acharya, U.R.; Chua, C.K.; Lim, C.M.; Ng, E.Y.K.; Laude, A. Computer-aided diagnosis of diabetic retinopathy: A review. Comput. Biol. Med. 2013, 43, 2136–2155. [Google Scholar] [CrossRef] [PubMed]
  3. Stitt, A.W.; Curtis, T.M.; Chen, M.; Medina, R.J.; McKay, G.J.; Jenkins, A.; Lois, N. The progress in understanding and treatment of diabetic retinopathy. Prog. Retin. Eye Res. 2016, 51, 156–186. [Google Scholar] [CrossRef] [PubMed]
  4. Amin, J.; Sharif, M.; Yasmin, M.; Ali, H.; Fernandes, S.L. A method for the detection and classification of diabetic retinopathy using structural predictors of bright lesions. J. Comput. Sci. 2017, 19, 153–164. [Google Scholar] [CrossRef]
  5. Fraz, M.M.; Remagnino, P.; Hoppe, A.; Uyyanonvara, B.; Rudnicka, A.R.; Owen, C.G.; Barman, S.A. Blood vessel segmentation methodologies in retinal images—A survey. Comput. Methods Progr. Biomed. 2012, 108, 407–433. [Google Scholar] [CrossRef] [PubMed]
  6. Abbas, Q.; Fondon, I.; Sarmiento, A.; Jiménez, S.; Alemany, P. Automatic recognition of severity level for diagnosis of diabetic retinopathy using deep visual features. Med. Biol. Eng. Comput. 2017, 55, 1959–1974. [Google Scholar] [CrossRef]
  7. Acharya, U.R.; Mookiah, M.R.K.; Koh, J.E.; Tan, J.H.; Bhandary, S.V.; Rao, A.K.; Laude, A. Automated screening system for retinal health using bi-dimensional empirical mode decomposition and integrated index. Comput. Biol. Med. 2016, 75, 54–62. [Google Scholar] [CrossRef]
  8. Ting, D.S.; Wu, W.C.; Toth, C. Deep learning for retinopathy of prematurity screening. Br. J. Ophthalmol. 2019, 103, 577–579. [Google Scholar] [CrossRef]
  9. Barkana, B.D.; Saricicek, I.; Yildirim, B. Performance analysis of descriptive statistical features in retinal vessel segmentation via fuzzy logic, ANN, SVM, and classifier fusion. Knowl. Based Syst. 2017, 118, 165–176. [Google Scholar] [CrossRef]
  10. Pratt, H.; Coenen, F.; Broadbent, D.M.; Harding, S.P.; Zheng, Y. Convolutional neural networks for diabetic retinopathy. Procedia Comput. Sci. 2016, 90, 200–205. [Google Scholar] [CrossRef]
  11. Imran, R.M.; Naz, S.; Zaib, A. Deep learning for medical image processing: Overview, challenges and the future. In Classification in BioApps; Springer: Cham, Switzerland, 2018; pp. 323–350. [Google Scholar] [CrossRef]
  12. Xu, K.; Feng, D.; Mi, H. Deep convolutional neural network-based early automated detection of diabetic retinopathy using fundus image. Molecules 2017, 22, 2054. [Google Scholar] [CrossRef] [PubMed]
  13. Zabihollahy, F.; Lochbihler, A.; Ukwatta, E. Deep learning based approach for fully automated detection and segmentation of hard exudate from retinal images. In Medical Imaging 2019: Biomedical Applications in Molecular, Structural, and Functional Imaging, Proceedings of the International Society for Optics and Photonics, Singapore, 15 March 2019; SPIE Medical Imaging: San Diego, CA, USA, 2019. [Google Scholar]
  14. Keel, S.; Wu, J.; Lee, P.Y.; Scheetz, J.; He, M. Visualizing Deep Learning Models for the Detection of Referable Diabetic Retinopathy and Glaucoma. JAMA Ophthalmol. 2019, 137, 288–292. [Google Scholar] [CrossRef] [PubMed]
  15. Winder, R.J.; Morrow, P.J.; McRitchie, I.N.; Bailie, J.R.; Hart, P.M. Algorithms for digital image processing in diabetic retinopathy. Comput. Med. Imaging Gr. 2009, 33, 608–622. [Google Scholar] [CrossRef] [PubMed]
  16. Teng, T.; Lefley, M.; Claremont, D. Progress towards automated diabetic ocular screening: A review of image analysis and intelligent systems for diabetic retinopathy. Med. Biol. Eng. Comput. 2002, 40, 2–13. [Google Scholar] [CrossRef] [PubMed]
  17. Patton, N.; Aslam, T.M.; MacGillivray, T.; Deary, I.J.; Dhillon, B.; Eikelboom, R.H.; Yogesan, K.; Constable, I.J. Retinal image analysis: Concepts, applications and potential. Prog. Retin. Eye Res. 2006, 25, 99–127. [Google Scholar] [CrossRef] [PubMed]
  18. Qureshi, I.; Sharif, M.; Yasmin, M.; Raza, M.Y.; Javed, M. Computer aided systems for diabetic retinopathy detection using digital fundus images: A survey. Curr. Med. Imaging Rev. 2016, 12, 234–241. [Google Scholar] [CrossRef]
  19. Sánchez, C.I.; Niemeijer, M.; Išgum, I.; Dumitrescu, A.; Suttorp-Schulten, M.S.; Abràmoff, M.D.; van Ginneken, B. Contextual computer-aided detection: Improving bright lesion detection in retinal images and coronary calcification identification in CT scans. Med. Image Anal. 2012, 16, 50–62. [Google Scholar] [CrossRef]
  20. Antal, B.; Hajdu, A. An ensemble-based system for automatic screening of diabetic retinopathy. Knowl. Based Syst. 2014, 60, 20–27. [Google Scholar] [CrossRef] [Green Version]
  21. Besenczi, R.; Tóth, J.; Hajdu, A. A review on automatic analysis techniques for color fundus photographs. Comput. Struct. Biotechnol. J. 2016, 14, 371–384. [Google Scholar] [CrossRef] [Green Version]
  22. Naqvi, S.A.G.; Zafar, M.F.; ul Haq, I. Referral system for hard exudates in eye fundus. Comput. Biol. Med. 2015, 64, 217–235. [Google Scholar] [CrossRef]
  23. Bharkad, S. Automatic segmentation of optic disk in retinal images. Biomed. Signal Process. Control 2017, 31, 483–498. [Google Scholar] [CrossRef]
  24. Alshayeji, M.; Al-Roomi, S.A.; Abed, S.E. Optic disc detection in retinal fundus images using gravitational law-based edge detection. Med. Biol. Eng. Comput. 2017, 55, 935–948. [Google Scholar] [CrossRef] [PubMed]
  25. Sarathi, M.P.; Dutta, M.K.; Singh, A.; Travieso, C.M. Blood vessel inpainting based technique for efficient localization and segmentation of optic disc in digital fundus images. Biomed. Signal Process. Control 2016, 25, 108–117. [Google Scholar] [CrossRef]
  26. Singh, A.; Dutta, M.K.; ParthaSarathi, M.; Uher, V.; Burget, R. Image processing based automatic diagnosis of glaucoma using wavelet features of segmented optic disc from fundus image. Comput. Methods Progr. Biomed. 2016, 124, 108–120. [Google Scholar] [CrossRef] [PubMed]
  27. Abed, S.E.; Al-Roomi, S.A.; Al-Shayeji, M. Effective optic disc detection method based on swarm intelligence techniques and novel pre-processing steps. Appl. Soft Comput. 2016, 49, 146–163. [Google Scholar] [CrossRef]
  28. Díaz-Pernil, D.; Fondón, I.; Peña-Cantillana, F.; Gutiérrez-Naranjo, M.A. Fully automatized parallel segmentation of the optic disc in retinal fundus images. Pattern Recognit. Lett. 2016, 83, 99–107. [Google Scholar] [CrossRef]
  29. Harangi, B.; Hajdu, A. Detection of the optic disc in fundus images by combining probability models. Comput. Biol. Med. 2015, 65, 10–24. [Google Scholar] [CrossRef]
  30. Dashtbozorg, B.; Mendonça, A.M.; Campilho, A. Optic disc segmentation using the sliding band filter. Comput. Biol. Med. 2015, 56, 1–12. [Google Scholar] [CrossRef] [Green Version]
  31. Mary, M.C.V.S.; Rajsingh, E.B.; Jacob, J.K.K.; Anandhi, D.; Amato, U.; Selvan, S.E. An empirical study on optic disc segmentation using an active contour model. Biomed. Signal Process. Control 2015, 18, 19–29. [Google Scholar] [CrossRef]
  32. Mittapalli, P.S.; Kande, G.B. Segmentation of optic disk and optic cup from digital fundus images for the assessment of glaucoma. Biomed. Signal Process. Control 2016, 24, 34–46. [Google Scholar] [CrossRef]
  33. Xiong, L.; Li, H. An approach to locate optic disc in retinal images with pathological changes. Comput. Med. Imaging Gr. 2016, 47, 40–50. [Google Scholar] [CrossRef] [PubMed]
  34. Qureshi, I. Glaucoma detection in retinal images using image processing techniques: A survey. Int. J. Adv. Netw. Appl. 2015, 7, 2705–2718. [Google Scholar]
  35. Rajaiah, R.P.; Britto, R.J. Optic disc boundary detection and cup segmentation for prediction of glaucoma. Int. J. Sci. Eng. Technol. Res. (IJSETR) 2014, 3, 2665–2672. [Google Scholar]
  36. Tan, N.M.; Xu, Y.; Goh, W.B.; Liu, J. Robust multi-scale superpixel classification for optic cup localization. Comput. Med. Imaging Gr. 2015, 40, 182–193. [Google Scholar] [CrossRef]
  37. Zilly, J.; Buhmann, J.M.; Mahapatra, D. Glaucoma detection using entropy sampling and ensemble learning for automatic optic cup and disc segmentation. Comput. Med. Imaging Gr. 2017, 55, 28–41. [Google Scholar] [CrossRef]
  38. Chakravarty, A.; Sivaswamy, J. Joint optic disc and cup boundary extraction from monocular fundus images. Comput. Methods Progr. Biomed. 2017, 147, 51–61. [Google Scholar] [CrossRef]
  39. Arnay, R.; Fumero, F.; Sigut, J. Ant colony optimization-based method for optic cup segmentation in retinal images. Appl. Soft Comput. 2017, 52, 409–417. [Google Scholar] [CrossRef]
  40. Miri, M.S.; Abràmoff, M.D.; Lee, K.; Niemeijer, M.; Wang, J.K.; Kwon, Y.H.; Garvin, M.K. Multimodal segmentation of optic disc and cup from SD-OCT and color fundus photographs using a machine-learning graph-based approach. IEEE Trans. Med. Imaging 2015, 34, 1854–1866. [Google Scholar] [CrossRef] [PubMed]
  41. Issac, A.; Parthasarthi, M.; Dutta, M.K. An adaptive threshold based algorithm for optic disc and cup segmentation in fundus images. In Proceedings of the IEEE 2nd International Conference on Signal Processing and Integrated Networks (SPIN), Delhi, India, 19–20 February 2015; pp. 143–147. [Google Scholar] [CrossRef]
  42. Kaur, J.; Mittal, D. A generalized method for the detection of vascular structure in pathological retinal images. Biocybern. Biomed. Eng. 2017, 37, 184–200. [Google Scholar] [CrossRef]
  43. Neto, L.C.; Ramalho, G.L.; Neto, J.F.R.; Veras, R.M.; Medeiros, F.N. An unsupervised coarse-to-fine algorithm for blood vessel segmentation in fundus images. Expert Syst. Appl. 2017, 78, 182–192. [Google Scholar] [CrossRef]
  44. Gupta, G.; Kulasekaran, S.; Ram, K.; Joshi, N.; Sivaprakasam, M.; Gandhi, R. Local characterization of neovascularization and identification of proliferative diabetic retinopathy in retinal fundus images. Comput. Med. Imaging Gr. 2017, 55, 124–132. [Google Scholar] [CrossRef] [PubMed]
  45. Vostatek, P.; Claridge, E.; Uusitalo, H.; Hauta-Kasari, M.; Fält, P.; Lensu, L. Performance comparison of publicly available retinal blood vessel segmentation methods. Comput. Med. Imaging Gr. 2017, 55, 2–12. [Google Scholar] [CrossRef]
  46. Quellec, G.; Lamard, M.; Erginay, A.; Chabouis, A.; Massin, P.; Cochener, B.; Cazuguel, G. Automatic detection of referral patients due to retinal pathologies through data mining. Med. Image Anal. 2016, 29, 47–64. [Google Scholar] [CrossRef] [PubMed]
  47. GeethaRamani, R.; Balasubramanian, L. Retinal blood vessel segmentation employing image processing and data mining techniques for computerized retinal image analysis. Biocybern. Biomed. Eng. 2016, 36, 102–118. [Google Scholar] [CrossRef]
  48. Zhang, L.; Fisher, M.; Wang, W. Retinal vessel segmentation using multi-scale textons derived from keypoints. Comput. Med. Imaging Gr. 2015, 45, 47–56. [Google Scholar] [CrossRef] [PubMed] [Green Version]
  49. Tan, J.H.; Acharya, U.R.; Bhandary, S.V.; Chua, K.C.; Sivaprasad, S. Segmentation of optic disc, fovea and retinal vasculature using a single convolutional neural network. J. Comput. Sci. 2017, 20, 70–79. [Google Scholar] [CrossRef] [Green Version]
  50. Wang, S.; Yin, Y.; Cao, G.; Wei, B.; Zheng, Y.; Yang, G. Hierarchical retinal blood vessel segmentation based on feature and ensemble learning. Neurocomputing 2015, 149, 708–717. [Google Scholar] [CrossRef]
  51. Aslani, S.; Sarnel, H. A new supervised retinal vessel segmentation method based on robust hybrid features. Biomed. Signal Process. Control 2016, 30, 1–12. [Google Scholar] [CrossRef]
  52. Singh, N.P.; Srivastava, R. Retinal blood vessels segmentation by using Gumbel probability distribution function based matched filter. Comput. Methods Progr. Biomed. 2016, 129, 40–50. [Google Scholar] [CrossRef]
  53. Frucci, M.; Riccio, D.; di Baja, G.S.; Serino, L. Severe: Segmenting vessels in retina images. Pattern Recognit. Lett. 2016, 82, 162–169. [Google Scholar] [CrossRef]
  54. Hassan, G.; El-Bendary, N.; Hassanien, A.E.; Fahmy, A.; Snasel, V. Retinal blood vessel segmentation approach based on mathematical morphology. Procedia Comput. Sci. 2015, 65, 612–622. [Google Scholar] [CrossRef]
  55. Sigurðsson, E.M.; Valero, S.; Benediktsson, J.A.; Chanussot, J.; Talbot, H.; Stefánsson, E. Automatic retinal vessel extraction based on directional mathematical morphology and fuzzy classification. Pattern Recognit. Lett. 2014, 47, 164–171. [Google Scholar] [CrossRef]
  56. Pandey, D.; Yin, X.; Wang, H.; Zhang, Y. Accurate vessel segmentation using maximum entropy incorporating line detection and phase-preserving denoising. Comput. Vis. Image Underst. 2017, 155, 162–172. [Google Scholar] [CrossRef]
  57. Kar, S.S.; Maity, S.P. Retinal blood vessel extraction using tunable bandpass filter and fuzzy conditional entropy. Comput. Methods Progr. Biomed. 2016, 133, 111–132. [Google Scholar] [CrossRef]
  58. Zhao, Y.; Zhao, J.; Yang, J.; Liu, Y.; Zhao, Y.; Zheng, Y.; Wang, Y. Saliency driven vasculature segmentation with infinite perimeter active contour model. Neurocomputing 2017, 259, 201–209. [Google Scholar] [CrossRef] [Green Version]
  59. Christodoulidis, A.; Hurtut, T.; Tahar, H.B.; Cheriet, F. A multi-scale tensor voting approach for small retinal vessel segmentation in high resolution fundus images. Comput. Med. Imaging Gr. 2016, 52, 28–43. [Google Scholar] [CrossRef] [PubMed]
  60. Farokhian, F.; Yang, C.; Demirel, H.; Wu, S.; Beheshti, I. Automatic parameters selection of Gabor filters with the imperialism competitive algorithm with application to retinal vessel segmentation. Biocybern. Biomed. Eng. 2017, 37, 246–254. [Google Scholar] [CrossRef]
  61. Kovács, G.; Hajdu, A. A self-calibrating approach for the segmentation of retinal vessels by template matching and contour reconstruction. Med. Image Anal. 2016, 29, 24–46. [Google Scholar] [CrossRef]
  62. Kar, S.S.; Maity, S.P. Blood vessel extraction and optic disc removal using curvelet transform and kernel fuzzy c-means. Comput. Biol. Med. 2016, 70, 174–189. [Google Scholar] [CrossRef]
  63. Zhao, Y.Q.; Wang, X.H.; Wang, X.F.; Shih, F.Y. Retinal vessels segmentation based on level set and region growing. Pattern Recognit. 2014, 47, 2437–2446. [Google Scholar] [CrossRef]
  64. Koukounis, D.; Ttofis, C.; Papadopoulos, A.; Theocharides, T. A high performance hardware architecture for portable, low-power retinal vessel segmentation. Integr. VLSI J. 2014, 47, 377–386. [Google Scholar] [CrossRef]
  65. Imani, E.; Javidi, M.; Pourreza, H.R. Improvement of retinal blood vessel detection using morphological component analysis. Comput. Methods Progr. Biomed. 2015, 118, 263–279. [Google Scholar] [CrossRef] [PubMed]
  66. Habib, M.M.; Welikala, R.A.; Hoppe, A.; Owen, C.G.; Rudnicka, A.R.; Barman, S.A. Detection of microaneurysms in retinal images using an ensemble classifier. Inf. Med. Unlocked 2017, 9, 44–57. [Google Scholar] [CrossRef]
  67. Kumar, M.; Nath, M.K. Detection of microaneurysms and exudates from color fundus images by using SBGFRLS algorithm. In Proceedings of the International Conference on Informatics and Analytics ICIA, Puducherry, India, 25–26 August 2016; p. 36. [Google Scholar] [CrossRef]
  68. Sreng, S.; Maneerat, N.; Hamamoto, K. Automated microaneurysms detection in fundus images using image segmentation. In Proceedings of the International Conference on Digital Arts, Media and Technology (ICDAMT), Chiang Mai, Thailand, 1–4 March 2017; pp. 19–23. [Google Scholar] [CrossRef]
  69. Pereira, C.; Veiga, D.; Mahdjoub, J.; Guessoum, Z.; Gonçalves, L.; Ferreira, M.; Monteiro, J. Using a multi-agent system approach for microaneurysm detection in fundus images. Artif. Intell. Med. 2014, 60, 179–188. [Google Scholar] [CrossRef] [PubMed]
  70. Agrawal, A.; Bhatnagar, C.; Jalal, A.S. A survey on automated microaneurysm detection in diabetic retinopathy retinal images. In Proceedings of the International Conference on Information Systems and Computer Networks (ISCON), Mathura, India, 9–10 March 2013; pp. 24–29. [Google Scholar] [CrossRef]
  71. Wu, B.; Zhu, W.; Shi, F.; Zhu, S.; Chen, X. Automatic detection of microaneurysms in retinal fundus images. Comput. Med. Imaging Gr. 2017, 55, 106–112. [Google Scholar] [CrossRef] [PubMed]
  72. Rosas-Romero, R.; Martínez-Carballido, J.; Hernández-Capistrán, J.; Uribe-Valencia, L.J. A method to assist in the diagnosis of early diabetic retinopathy: Image processing applied to detection of microaneurysms in fundus images. Comput. Med. Imaging Gr. 2015, 44, 41–53. [Google Scholar] [CrossRef] [PubMed]
  73. Tavakoli, M.; Shahri, R.P.; Pourreza, H.; Mehdizadeh, A.; Banaee, T.; Toosi, M.H.B. A complementary method for automated detection of microaneurysms in fluorescein angiography fundus images to assess diabetic retinopathy. Pattern Recognit. 2013, 46, 2740–2753. [Google Scholar] [CrossRef] [Green Version]
  74. Sopharak, A.; Uyyanonvara, B.; Barman, S. Simple hybrid method for fine microaneurysm detection from non-dilated diabetic retinopathy retinal images. Comput. Med. Imaging Gr. 2013, 37, 394–402. [Google Scholar] [CrossRef] [PubMed]
  75. Datta, N.S.; Dutta, H.S.; De, M.; Mondal, S. An effective approach: Image quality enhancement for microaneurysms detection of non-dilated retinal fundus image. Procedia Technol. 2013, 10, 731–737. [Google Scholar] [CrossRef]
  76. Zhang, B.; Karray, F.; Li, Q.; Zhang, L. Sparse representation classifier for microaneurysm detection and retinal blood vessel extraction. Inf. Sci. 2012, 200, 78–90. [Google Scholar] [CrossRef]
  77. Akram, M.U.; Khalid, S.; Khan, S.A. Identification and classification of microaneurysms for early detection of diabetic retinopathy. Pattern Recognit. 2013, 46, 107–116. [Google Scholar] [CrossRef]
  78. Zhou, W.; Wu, C.; Chen, D.; Yi, Y.; Du, W. Automatic microaneurysm detection using the sparse principal component analysis-based unsupervised classification method. IEEE Access 2017, 5, 2563–2572. [Google Scholar] [CrossRef]
  79. Ren, F.; Cao, P.; Li, W.; Zhao, D.; Zaiane, O. Ensemble based adaptive over-sampling method for imbalanced data learning in computer aided detection of microaneurysm. Comput. Med. Imaging Gr. 2017, 55, 54–67. [Google Scholar] [CrossRef] [PubMed]
  80. Javidi, M.; Pourreza, H.R.; Harati, A. Vessel segmentation and microaneurysm detection using discriminative dictionary learning and sparse representation. Comput. Methods Progr. Biomed. 2017, 139, 93–108. [Google Scholar] [CrossRef] [PubMed]
  81. Shan, J.; Li, L. A deep learning method for microaneurysm detection in fundus images. In Proceedings of the First International Conference on Connected Health: Applications, Systems and Engineering Technologies (CHASE), Washington, DC, USA, 27–29 June 2016; pp. 357–358. [Google Scholar] [CrossRef]
  82. Srivastava, R.; Duan, L.; Wong, D.W.; Liu, J.; Wong, T.Y. Detecting retinal microaneurysms and hemorrhages with robustness to the presence of blood vessels. Comput. Methods Progr. Biomed. 2017, 138, 83–91. [Google Scholar] [CrossRef]
  83. Adal, K.M.; Sidibé, D.; Ali, S.; Chaum, E.; Karnowski, T.P.; Mériaudeau, F. Automated detection of microaneurysms using scale-adapted blob analysis and semi-supervised learning. Comput. Methods Progr. Biomed. 2014, 114, 1–10. [Google Scholar] [CrossRef] [PubMed] [Green Version]
  84. Kaur, N.; Chatterjee, S.; Acharyya, M.; Kaur, J.; Kapoor, N.; Gupta, S. A supervised approach for automated detection of hemorrhages in retinal fundus images. In Proceedings of the 5th International Conference on Wireless Networks and Embedded Systems (WECON), Rajpura, India, 14–16 October 2016; pp. 1–5. [Google Scholar] [CrossRef]
  85. Zhou, L.; Li, P.; Yu, Q.; Qiao, Y.; Yang, J. Automatic hemorrhage detection in color fundus images based on gradual removal of vascular branches. In Proceedings of the IEEE International Conference on Image Processing (ICIP), Phoenix, AZ, USA, 25–28 September 2016; pp. 399–403. [Google Scholar] [CrossRef]
  86. Xiao, D.; Yu, S.; Vignarajan, J.; An, D.; Tay-Kearney, M.L.; Kanagasingam, Y. Retinal hemorrhage detection by rule-based and machine learning approach. In Proceedings of the 39th Annual International Conference of the IEEE in Engineering in Medicine and Biology Society (EMBC), Jeju Island, Korea, 11–15 July 2017; pp. 660–663. [Google Scholar] [CrossRef]
  87. Arun, G.; Sasirekha, N. Detection of retinal hemorrhage in color fundus image using splat feature segmentation. In Proceedings of the International Conference on Innovations in Information, Embedded and Communication Systems (ICIIECS), Coimbatore, India, 19–20 March 2015; pp. 1–5. [Google Scholar] [CrossRef]
  88. Tang, L.; Niemeijer, M.; Reinhardt, J.M.; Garvin, M.K.; Abràmoff, M.D. Splat feature classification with application to retinal hemorrhage detection in fundus images. IEEE Trans. Med. Imaging 2013, 32, 364–375. [Google Scholar] [CrossRef] [PubMed]
  89. Tang, L.; Niemeijer, M.; Abràmoff, M.D. Splat feature classification: Detection of the presence of large retinal hemorrhages. In Proceedings of the IEEE International Symposium on Biomedical Imaging: From Nano to Macro, Chicago, IL, USA, 30 March–2 April 2011; pp. 681–684. [Google Scholar] [CrossRef]
  90. Molina-Casado, J.M.; Carmona, E.J.; García-Feijoó, J. Fast detection of the main anatomical structures in digital retinal images based on intra-and inter-structure relational knowledge. Comput. Methods Progr. Biomed. 2017, 149, 55–68. [Google Scholar] [CrossRef]
  91. Agarwal, S.; Acharjya, K.; Sharma, S.K.; Pandita, S. Automatic computer aided diagnosis for early diabetic retinopathy detection and monitoring: A comprehensive review. In Proceedings of the Online International Conference on Green Engineering and Technologies (IC-GET), Coimbatore, India, 19 November 2016; pp. 1–7. [Google Scholar] [CrossRef]
  92. Ashraf, A.; Akram, M.U.; Sheikh, S.A.; Abbas, S. Detection of macular whitening and retinal hemorrhages for diagnosis of malarial retinopathy. In Proceedings of the IEEE International Conference on Imaging Systems and Techniques (IST), Macau, China, 16–18 September 2015; pp. 1–5. [Google Scholar] [CrossRef]
  93. Ashraf, A.; Akram, M.U.; Sheikh, S.A. Detection of retinal whitening, cotton wool spots and retinal Hemorrhages for diagnosis of Malarial Retinopathy. In Proceedings of the IEEE Region 10 Conference in TENCON, Macau, China, 1–4 November 2015; pp. 1–5. [Google Scholar] [CrossRef]
  94. Sharma, A.; Dutta, M.K.; Singh, A.; Parthasarathi, M.; Travieso, C.M. Dynamic thresholding technique for detection of hemorrhages in retinal images. In Proceedings of the IEEE Seventh International Conference on Contemporary Computing (IC3), Noida, India, 7–9 August 2014; pp. 113–116. [Google Scholar] [CrossRef]
  95. Lahmiri, S.; Shmuel, A. Variational mode decomposition based approach for accurate classification of color fundus images with hemorrhages. Opt. Laser Technol. 2017, 96, 243–248. [Google Scholar] [CrossRef]
  96. Liu, Q.; Zou, B.; Chen, J.; Ke, W.; Yue, K.; Chen, Z.; Zhao, G. A location-to-segmentation strategy for automatic exudate segmentation in colour retinal fundus images. Comput. Med. Imaging Gr. 2017, 55, 78–86. [Google Scholar] [CrossRef]
  97. Imani, E.; Pourreza, H.R. A novel method for retinal exudate segmentation using signal separation algorithm. Comput. Methods Progr. Biomed. 2016, 133, 195–205. [Google Scholar] [CrossRef] [PubMed]
  98. Harangi, B.; Hajdu, A. Automatic exudate detection by fusing multiple active contours and regionwise classification. Comput. Biol. Med. 2014, 54, 156–171. [Google Scholar] [CrossRef] [PubMed]
  99. Zhang, X.; Thibault, G.; Decencière, E.; Marcotegui, B.; Laÿ, B.; Danno, R.; Chabouis, A. Exudate detection in color retinal images for mass screening of diabetic retinopathy. Med. Image Anal. 2014, 18, 1026–1043. [Google Scholar] [CrossRef] [PubMed] [Green Version]
  100. Tjandrasa, H.; Putra, R.E.; Wijaya, A.Y.; Arieshanti, I. Classification of non-proliferative diabetic retinopathy based on hard exudates using soft margin SVM. In Proceedings of the IEEE International Conference on Control System, Computing and Engineering (ICCSCE), George Town, Malaysia, 27–29 November 2013; pp. 376–380. [Google Scholar] [CrossRef]
  101. Akram, M.U.; Khalid, S.; Tariq, A.; Khan, S.A.; Azam, F. Detection and classification of retinal lesions for grading of diabetic retinopathy. Comput. Biol. Med. 2014, 45, 161–171. [Google Scholar] [CrossRef]
  102. Omar, M.; Khelifi, F.; Tahir, M.A. Detection and classification of retinal fundus images exudates using region based multiscale LBP texture approach. In Proceedings of the IEEE International Conference on Control, Decision and Information Technologies (CoDIT), St. Paul’s Bay, Malta, 6–8 April 2016; pp. 227–232. [Google Scholar] [CrossRef]
  103. Banerjee, S.; Kayal, D. Detection of hard exudates using mean shift and normalized cut method. Biocybern. Biomed. Eng. 2016, 36, 679–685. [Google Scholar] [CrossRef]
  104. Fraz, M.M.; Jahangir, W.; Zahid, S.; Hamayun, M.M.; Barman, S.A. Multiscale segmentation of exudates in retinal images using contextual cues and ensemble classification. Biomed. Signal Process. Control 2017, 35, 50–62. [Google Scholar] [CrossRef] [Green Version]
  105. Prentašić, P.; Lončarić, S. Detection of exudates in fundus photographs using deep neural networks and anatomical landmark detection fusion. Comput. Methods Progr. Biomed. 2016, 137, 281–292. [Google Scholar] [CrossRef]
  106. Sidibé, D.; Sadek, I.; Mériaudeau, F. Discrimination of retinal images containing bright lesions using sparse coded features and SVM. Comput. Biol. Med. 2015, 62, 175–184. [Google Scholar] [CrossRef] [Green Version]
  107. Paing, M.P.; Choomchuay, S.; Yodprom, M.R. Detection of lesions and classification of diabetic retinopathy using fundus images. In Proceedings of the 9th International Conference on Biomedical Engineering (BMEiCON), Laung Prabang, Laos, 7–9 December 2016; pp. 1–5. [Google Scholar] [CrossRef]
  108. García, M.; Valverde, C.; López, M.I.; Poza, J.; Hornero, R. Comparison of logistic regression and neural network classifiers in the detection of hard exudates in retinal images. In Proceedings of the 35th Annual International Conference on Engineering in Medicine and Biology Society (EMBC), Osaka, Japan, 3–7 July 2013; pp. 5891–5894. [Google Scholar] [CrossRef]
  109. Laaksonen, L.; Hannuksela, A.; Claridge, E.; Fält, P.; Hauta-Kasari, M.; Uusitalo, H.; Lensu, L. Evaluation of feature sensitivity to training data inaccuracy in detection of retinal lesions. In Proceedings of the IEEE 6th International Conference on Image Processing Theory Tools and Applications (IPTA), Oulu, Finland, 12–15 December 2016; pp. 1–6. [Google Scholar] [CrossRef]
  110. Pereira, C.; Gonçalves, L.; Ferreira, M. Exudate segmentation in fundus images using an ant colony optimization approach. Inf. Sci. 2015, 296, 14–24. [Google Scholar] [CrossRef]
  111. Figueiredo, I.N.; Kumar, S.; Oliveira, C.M.; Ramos, J.D.; Engquist, B. Automated lesion detectors in retinal fundus images. Comput. Biol. Med. 2015, 66, 47–65. [Google Scholar] [CrossRef] [Green Version]
  112. Kaur, J.; Mittal, D. A generalized method for the segmentation of exudates from pathological retinal fundus images. Biocybern. Biomed. Eng. 2018, 38, 27–53. [Google Scholar] [CrossRef]
  113. Al-Bander, B.; Al-Nuaimy, W.; Williams, B.M.; Zheng, Y. Multiscale sequential convolutional neural networks for simultaneous detection of fovea and optic disc. Biomed. Signal Process. Control 2018, 40, 91–101. [Google Scholar] [CrossRef]
  114. Gargeya, R.; Leng, T. Automated identification of diabetic retinopathy using deep learning. Ophthalmology 2017, 124, 962–969. [Google Scholar] [CrossRef] [PubMed]
  115. Silva, P.S.; El-Rami, H.; Barham, R.; Gupta, A.; Fleming, A.; van Hemert, J.; Aiello, L.P. Hemorrhage and/or microaneurysm severity and count in ultrawide field images and early treatment diabetic retinopathy study photography. Ophthalmology 2017, 124, 970–976. [Google Scholar] [CrossRef] [PubMed]
  116. Dash, J.; Bhoi, N. A thresholding based technique to extract retinal blood vessels from fundus images. Future Comput. Inf. J. 2017, 2, 103–109. [Google Scholar] [CrossRef]
  117. Leontidis, G. A new unified framework for the early detection of the progression to diabetic retinopathy from fundus images. Comput. Biol. Med. 2017, 90, 98–115. [Google Scholar] [CrossRef] [PubMed] [Green Version]
  118. Koh, J.E.; Acharya, U.R.; Hagiwara, Y.; Raghavendra, U.; Tan, J.H.; Sree, S.V.; Laude, A. Diagnosis of retinal health in digital fundus images using continuous wavelet transform (CWT) and entropies. Comput. Biol. Med. 2017, 84, 89–97. [Google Scholar] [CrossRef]
  119. Lane, M.; Lane, V.; Abbott, J.; Braithwaite, T.; Shah, P.; Denniston, A.K. Multiple deprivation, vision loss, and ophthalmic disease in adults: Global perspectives. Surv. Ophthalmol. 2017, 63, 406–436. [Google Scholar] [CrossRef]
  120. Barua, B.; Hasan, M.M. A new approach of detection and segmentation of blood vessels for the classification of healthy and diseased retinal images. In Proceedings of the 3rd International Conference on Electrical Engineering and Information Communication Technology (ICEEICT), Dhaka, Bangladesh, 22–24 September 2016; pp. 1–6. [Google Scholar] [CrossRef]
  121. Santhakumar, R.; Tandur, M.; Rajkumar, E.R.; Geetha, K.S.; Haritz, G.; Rajamani, K.T. Machine learning algorithm for retinal image analysis. In Proceedings of the IEEE in Region 10 Conference (TENCON), Singapore, 22–25 November 2016; pp. 1236–1240. [Google Scholar] [CrossRef]
  122. Asiri, N.; Hussain, M.; Abualsamh, H.A. Deep Learning based computer-aided diagnosis systems for diabetic retinopathy: A survey. arXiv 2018, arXiv:1811.01238. [Google Scholar]
  123. Bhatia, K.; Arora, S.; Tomar, R. Diagnosis of diabetic retinopathy using machine learning classification algorithm. In Proceedings of the 2nd International Conference on Next Generation Computing Technologies (NGCT), Uttrakhand, India, 14–16 October 2016; pp. 347–351. [Google Scholar] [CrossRef]
  124. Devarakonda, S.T.; Vupparaboina, K.K.; Richhariya, A.; Chhablani, J.; Jana, S. Automated detection of retinal disorders from OCT images using artificial neural network. In Proceedings of the IEEE Annual in India Conference (INDICON), Bangalore, India, 16–18 December 2016; pp. 1–6. [Google Scholar] [CrossRef]
  125. Vo, H.H.; Verma, A. New deep neural nets for fine-grained diabetic retinopathy recognition on hybrid color space. In Proceedings of the IEEE International Symposium on Multimedia (ISM), San Jose, CA, USA, 11–13 December 2016; pp. 209–215. [Google Scholar] [CrossRef]
  126. Lahiri, A.; Roy, A.G.; Sheet, D.; Biswas, P.K. Deep neural ensemble for retinal vessel segmentation in fundus images towards achieving label-free angiography. In Proceedings of the IEEE 38th Annual International Conference in Engineering in Medicine and Biology Society (EMBC), Orlando, FL, USA, 16–20 August 2016; pp. 1340–1343. [Google Scholar] [CrossRef]
  127. Yang, Y.; Li, T.; Li, W.; Wu, H.; Fan, W.; Zhang, W. Lesion detection and grading of diabetic retinopathy via two-stages deep convolutional neural networks. In Lecture Notes in Computer Science, Proceedings of the Medical Image Computing and Computer-Assisted Intervention—MICCAI, Quebec City, QC, Canada, 10–14 September 2017; Descoteaux, M., Maier-Hein, L., Franz, A., Jannin, P., Collins, D., Duchesne, S., Eds.; Springer: Cham, Switzerland, 2017; Volume 10435, pp. 533–540. [Google Scholar] [CrossRef]
  128. Wang, Z.; Yin, Y.; Shi, J.; Fang, W.; Li, H.; Wang, X. Zoom-in-net: Deep mining lesions for diabetic retinopathy detection. In Lecture Notes in Computer Science, Proceedings of the Medical Image Computing and Computer-Assisted Intervention—MICCAI, Quebec City, QC, Canada, 10–14 September 2017; Descoteaux, M., Maier-Hein, L., Franz, A., Jannin, P., Collins, D., Duchesne, S., Eds.; Springer: Cham, Switzerland, 2017; Volume 10435, pp. 267–275. [Google Scholar] [CrossRef]
  129. Mansour, R.F. Deep-learning-based automatic computer-aided diagnosis system for diabetic retinopathy. Biomed. Eng. Lett. 2018, 8, 41–57. [Google Scholar] [CrossRef]
  130. Lachure, J.; Deorankar, A.V.; Lachure, S.; Gupta, S.; Jadhav, R. Diabetic retinopathy using morphological operations and machine learning. In Proceedings of the IEEE International in Advance Computing Conference (IACC), Banglore, India, 12–13 June 2015; pp. 617–622. [Google Scholar] [CrossRef]
  131. Nijalingappa, P.; Sandeep, B. Machine learning approach for the identification of Diabetes Retinopathy and its stages. In Proceedings of the IEEE International Conference on Applied and Theoretical Computing and Communication Technology (iCATccT), Davangere, India, 29–31 October 2015; pp. 653–658. [Google Scholar] [CrossRef]
  132. Kunwar, A.; Magotra, S.; Sarathi, P.M. Detection of high-risk macular edema using texture features and classification using SVM classifier. In Proceedings of the International Conference in Advances in Computing, Communications and Informatics (ICACCI), Kerala, India, 10–13 August 2015; pp. 2285–2289. [Google Scholar] [CrossRef]
  133. Arenas-Cavalli, J.T.; Ríos, S.A.; Pola, M.; Donoso, R. A web-based platform for automated diabetic retinopathy screening. Procedia Comput. Sci. 2015, 60, 557–563. [Google Scholar] [CrossRef]
  134. Guo, Y.; Liu, Y.; Oerlemans, A.; Lao, S.; Wu, S.; Lew, M.S. Deep learning for visual understanding: A review. Neurocomputing 2016, 187, 27–48. [Google Scholar] [CrossRef]
  135. Abbas, Q.; Ibrahim, M.E.; Jaffar, M.A. Video scene analysis: An overview and challenges on deep learning algorithms. Multimed. Tools Appl. 2017, 76, 1–39. [Google Scholar] [CrossRef]
  136. Peng, Y.; Dharssi, S.; Chen, Q.; Keenan, T.D.; Agrón, E.; Wong, W.T.; Chew, E.Y.; Lu, Z. DeepSeeNet: A deep learning model for automated classification of patient-based age-related macular degeneration severity from color fundus photographs. Ophthalmology 2019, 126, 565–575. [Google Scholar] [CrossRef] [PubMed]
  137. Verbraak, F.D.; Abramoff, M.D.; Bausch, G.C.; Klaver, C.; Nijpels, G.; Schlingemann, R.O.; van der Heijden, A.A. Accuracy of a Device for the Automated Detection of Diabetic Retinopathy in a Primary Care Setting. Diabetes Care 2019, 42, 651–656. [Google Scholar] [CrossRef] [PubMed]
  138. Soomro, T.A.; Gao, J.; Khan, T.; Hani, A.F.M.; Khan, M.A.; Paul, M. Computerised approaches for the detection of diabetic retinopathy using retinal fundus images: A survey. Pattern Anal. Appl. 2017, 20, 927–961. [Google Scholar] [CrossRef]
  139. Pang, H.; Luo, C.; Wang, C. Improvement of the application of diabetic retinopathy detection model. Wirel. Pers. Commun. 2018, 98, 1–14. [Google Scholar] [CrossRef]
  140. Zhang, W.; Zhong, J.; Yang, S.; Gao, Z.; Hu, J.; Chen, Y.; Yi, Z. Automated identification and grading system of diabetic retinopathy using deep neural networks. Knowl. Based Syst. 2019, 175, 12–25. [Google Scholar] [CrossRef]
  141. Arunkumar, R.; Karthigaikumar, P. Multi-retinal disease classification by reduced deep learning features. Neural Comput. Appl. 2017, 28, 329–334. [Google Scholar] [CrossRef]
  142. Saha, S.K.; Fernando, B.; Cuadros, J.; Xiao, D.; Kanagasingam, Y. Automated quality assessment of colour fundus images for diabetic retinopathy screening in telemedicine. J. Digit. Imaging 2018, 31, 1–10. [Google Scholar] [CrossRef]
  143. Akilesh, B.; Marwah, T.; Balasubramanian, V.N.; Rajamani, K. On the relevance of very deep networks for diabetic retinopathy diagnostics. In Applications of Cognitive Computing Systems and IBM Watson; Contractor, D., Telang, A., Eds.; Springer: Singapore, 2017; pp. 47–54. [Google Scholar]
  144. García, G.; Gallardo, J.; Mauricio, A.; López, J.; Del Carpio, C. Detection of diabetic retinopathy based on a convolutional neural network using retinal fundus images. In Lecture Notes in Computer Science, Proceedings of the Artificial Neural Networks and Machine Learning—ICANN, Alghero, Italy, 11–14 September 2017; Lintas, A., Rovetta, S., Verschure, P., Villa, A., Eds.; Springer: Cham, Switzerland, 2017; Volume 10614, pp. 635–642. [Google Scholar] [CrossRef]
  145. Otálora, S.; Perdomo, O.; González, F.; Müller, H. Training deep convolutional neural networks with active learning for exudate classification in eye fundus images. In Lecture Notes in Computer Science, Proceedings of the Intravascular Imaging and Computer Assisted Stenting, and Large-Scale Annotation of Biomedical Data and Expert Label Synthesis, Quebec City, QC, Canada, 10–14 September 2017; LABELS, STENT, CVII; Cardoso, M., Ed.; Springer: Cham, Switzerland, 2017; Volume 10552, pp. 146–154. [Google Scholar] [CrossRef]
  146. Sayres, R.; Ankur, T.; Ehsan, R.; Katy, B.; David, C.; Naama, H.; Jonathan, K.; Arunachalam, N.; Zahra, R.; Derek, W.; et al. Using a deep learning algorithm and integrated gradients explanation to assist grading for diabetic retinopathy. Ophthalmology 2019, 126, 552–564. [Google Scholar] [CrossRef] [PubMed]
  147. Galveia, J.N.; Travassos, A.; Quadros, F.A.; da Silva Cruz, L.A. Computer aided diagnosis in ophthalmology: Deep learning applications. In Lecture Notes in Computational Vision and Biomechanics; Classification in BioApps; Dey, N., Ashour, A., Borra, S., Eds.; Springer: Cham, Switzerland, 2018; Volume 26, pp. 263–293. [Google Scholar] [CrossRef]
  148. Somasundaram, S.K.; Alli, P. A machine learning ensemble classifier for early prediction of diabetic retinopathy. J. Med. Syst. 2017, 41, 201. [Google Scholar] [CrossRef]
  149. Saha, R.; Chowdhury, A.R.; Banerjee, S. Diabetic retinopathy related lesions detection and classification using machine learning technology. In Lecture Notes in Computer Science, Proceedings of the Artificial Intelligence and Soft Computing—ICAISC, Zakopane, Poland, 12–16 June 2016; Rutkowski, L., Korytkowski, M., Scherer, R., Tadeusiewicz, R., Zadeh, L., Zurada, J., Eds.; Springer: Cham, Switzerland, 2016; Volume 9693, pp. 734–745. [Google Scholar] [CrossRef]
  150. Prentašic, P. Detection of Diabetic Retinopathy in Fundus Photographs. 2013. Available online: https://pdfs.semanticscholar.org/5daf/98b580fd3a575a50726c37f1963cad2b1815.pdf (accessed on 2 June 2019).
  151. Maher, R.; Kayte, S.; Dhopeshwarkar, M. Review of automated detection for diabetes retinopathy using fundus images. Int. J. Adv. Res. Comput. Sci. Softw. Eng. 2015, 5, 1129–1136. [Google Scholar]
  152. Thomas, N.; Mahesh, T. Detecting clinical features of diabetic retinopathy using image processing. Int. J. Eng. Res. Technol. (IJERT) 2014, 3, 558–561. [Google Scholar]
  153. Bossuyt, P.M.; Reitsma, J.B.; Bruns, D.E.; Gatsonis, C.A.; Glasziou, P.P.; Irwig, L.M.; de Vet, H.C. Towards complete and accurate reporting of studies of diagnostic accuracy: The STARD initiative. Clin. Chem. Lab. Med. 2003, 41, 68–73. [Google Scholar] [CrossRef] [PubMed]
  154. Noronha, K.; Acharya, U.R.; Nayak, K.P.; Kamath, S.; Bhandary, S.V. Decision support system for diabetic retinopathy using discrete wavelet transform. Proc. Inst. Mech. Eng. Part H J. Eng. Med. 2013, 227, 251–261. [Google Scholar] [CrossRef]
  155. Acharya, U.R.; Ng, E.Y.K.; Tan, J.H.; Sree, S.V.; Ng, K.H. An integrated index for the identification of diabetic retinopathy stages using texture parameters. J. Med. Syst. 2012, 36, 2011–2020. [Google Scholar] [CrossRef] [PubMed]
  156. Qureshi, I.; Ma, J.; Shaheed, K. A hybrid proposed fundus image enhancement framework for diabetic retinopathy. Algorithms 2019, 12, 14. [Google Scholar] [CrossRef]
  157. He, K.; Sun, J. Convolutional neural networks at constrained time cost. In Proceedings of the IEEE Conference on Computer Vision and Pattern Recognition, Boston, MA, USA, 7–12 June 2015; pp. 5353–5360. [Google Scholar] [CrossRef]
  158. Li, H.; Zhao, R.; Wang, X. Highly efficient forward and backward propagation of convolutional neural networks for pixelwise classification. arXiv 2014, arXiv:1412.4526. [Google Scholar]
  159. Liu, Y.; Guo, Y.; Wu, S.; Lew, M. DeepIndex for accurate and efficient image retrieval. In Proceedings of the ACM International Conference on Multimedia Retrieval (ICMR’15), Shanghai, China, 23–26 June 2015; pp. 43–50. [Google Scholar] [CrossRef]
  160. Ouyang, W.; Luo, P.; Zeng, X.; Qiu, S.; Tian, Y.; Li, H.; Zhu, Z. Deepid-net: Multi-stage and deformable deep convolutional neural networks for object detection. arXiv 2014, arXiv:1409.3505. [Google Scholar]
  161. Sun, Y.; Wang, X.; Tang, X. Deep convolutional network cascade for facial point detection. In Proceedings of the IEEE Conference on Computer Vision and Pattern Recognition, Portland, OR, USA, 23–28 June 2013; pp. 3476–3483. [Google Scholar] [CrossRef]
  162. Wang, X.; Zhang, L.; Lin, L.; Liang, Z.; Zuo, W. Deep joint task learning for generic object extraction. In Proceedings of the Advances in Neural Information Processing Systems, Montreal, QC, Canada, 8–13 December 2014; pp. 523–531. [Google Scholar]
Figure 1. A sample of a fundus image, where (a) represents retinal anatomic features; (b) mild NPDR; (c) moderate NPDR; (d) severe NPDR.
Symmetry 11 00749 g001
Figure 2. State-of-the-art CAD systems for diagnosis of diabetic retinopathy using retinal fundus images.
Symmetry 11 00749 g002
Figure 3. Proposed OD and OC segmentation by [41]: (a) Input image; (b) preprocessed red channel; (c) OD segmentation; (d) green channel; (e) OC segmentation.
Symmetry 11 00749 g003aSymmetry 11 00749 g003b
Figure 4. A sample of a fundus image showing secular changes of vessels.
Symmetry 11 00749 g004
Figure 5. (a) Original image; (b) ground truth; (c) proposed vasculature extraction [42].
Symmetry 11 00749 g005aSymmetry 11 00749 g005b
Figure 6. (a) Input image; (b) manual annotated MAs; (c) proposed MA detection by [80].
Symmetry 11 00749 g006
Figure 7. (a) Input image; (b) hemorrhage identified [84].
Symmetry 11 00749 g007
Figure 8. (a) Input image; (b) wavelet output; (c) cartoon result; (d) EX detection [111].
Symmetry 11 00749 g008
Figure 9. A basic taxonomy of the CNN model [135].
Symmetry 11 00749 g009
Table 1. A standard scale for DR screening [11].
DR TypesClinical Features
NormalNo abnormal lineaments
Mild NPDRFound MA
Moderate NPDRMaximum number of MAs, EXs, and HMs
Severe NPDRAll abnormal features in four quadrants
PDRAll abnormal features with new blood vessel formation
Table 2. Current OD and OC detection algorithms.
MethodDatabaseAccuracy (%)Color SpaceData
Optic disc segmentation schemes
FIR filter [23]DRIVE, DIRATEDB0, DIRATEDB1, DRIONS98.9524 and 8 bits369
Edge detection [24]DRIVE, DiaRet, DMED, STARE95.918 bit303
Region growing [25]MESSIDOR, DRIVE. local dataset918 bit1384
Wavelet features [26]Local dataset94.724 bit63
Swarm intelligence [27]DRIVE, DiaRet, DMED, STARE98.458 bit318
Hough transform [28]DRIVE, DIARETDB199.68 bit129
Ensemble models [29]DIARETDB0&1, DRIVE, MESSIDOR98.9124 bit1459
Sliding band filter [30]ONHSD, MESSIDOR, INSPIRE-AVR-8 bit1339
Active contour models [32]RIM-ONE978 bit169
Active contour model [33]Private dataset, RIM-ONE, DIARETDB098.28 bit59
Optic cup segmentation methods
Super pixel classification [36]ORIGA-24 bit650
CNN [37]DRISHTI-GS94.124 bit50
sparse dictionary [38]INSPIRE, DRISHTI-GS, RIM-ONEv2, DRIONS-DB, MESSIDOR, DATASET-1-8 bit1577
Ant colony optimization [39]RIM-ONE-8 bit159
An adaptive threshold [41]Private dataset928 bit63
Table 3. Performance comparison of retinal vessel extraction techniques.
Classification MethodImage-ProcessingDatabaseColor SpaceAccuracy (%)Data
Geometrical features [42]Un-sharp masking to enhance image quality, matched filter to model vascular mapDRIVE, STARE, ARIA, HRF24 bit95.45785
Local coarse segmentation [43]Noise removal using a Gaussian filter on a green channel, enhanced vessel pixels using a morphological top-hat operatorDRIVE, STARE8 bit8760
Classification [44]Uniform grid applied to set patchesMESSIDOR, HRF. STARE, local dataset24 bitAUC: 92.2779
Segmentation [48]Gabor filter for vessel feature extractionDRIVE24 bit 95.0540
CNN [49]RGB conversion into an LUV model, luminance channel, L, for vessel pixel contrast enhancementDRIVE24 bit94.5440
CNN and RF [50]Histogram equalization and Gaussian filter for image enhancement and noise removalDRIVE, STARE8 bit97.560
Phase-preserving method [51]Morphological opening operation for background subtraction and noise reductionDRIVE, STARE, HRF, CHASE_DB18 bit96133
Fuzzy conditional entropy [52]Green channel extraction, morphological opening operation for vessel central light reflex removal, curve let transform for image de-noiseDRIVE, STARE8 bit-60
Saliency and contour model [53]Green channel extraction, retinex for image homogeneityDRIVE, STARE8 bit9760
Gabor filter [55]Parameter optimization using ICA for a Gabor filterDRIVE24 bit9440
Template matching [56]ROI extraction using a global threshold mechanismDRIVE, STARE8 bit9660
Hybrid feature and forest classifier [57]Green channel extraction, CLAHE for image enhancementDRIVE, STARE8 bit96.2260
Gumbel probability distribution [58]Green channel selected and converted into grayscale, CLAHE for contrast enhancementDRIVE, STARE8 bitAUC: 0.928760
Mathematical morphology, k-means [60]Morphological operations for smoothing and background suppressionDRIVE8 bit9340
Fuzzy classification [61]CLAHE for image enhancement, Gaussian filter for noise reductionDRIVE24 bit9640
Matched filter and fuzzy c-means [62]Green channel extraction, image de-noising, and edge enhancement using curvelet transformationDRIVE, STARE, DIARETDB18 bit96.75149
Level set and region growing [63]CLAHE and Gabor wavelet transformation applied to a green channel for image enhancementDRIVE, STARE8 bit94.9360
Morphological component analysis [65]Otsu threshold and median filter applied to a green component for ROI extraction and illumination enhancementDRIVE, STARE8 bit9560
Table 4. MA detection methods in the literature.
Classification MethodImage ProcessingDatabaseColor SpaceAccuracy (%)Data
Tree ensemble [66]Median filter, CLAHE, and Gaussian filter applied on a green component for noise reduction, contrast enhancement, and noise removalMESSIDOR, DIARETDB1 v2.18 bitROC: 0.415256
Gaussian filtering [67]Green part extracted from colored image, median filter and CLAHE applied for noise reduction and image enhancement, blood vessels removed using a matched filterDIARETDB18 bit93.4189
Canny edge, threshold [68]Images resized, noise removal and image enhancement using median filter and 2D wavelet transformationDIARETDB124 bit9089
Multi-agent model [69]Median filter applied on the green part to estimate the background image, Gaussian and modified kirsch filters applied to more visible dark lesions and to enhance the edges and thickness of pixels LaTIM8 bit-36
Local & profile features [71]Background ROI image generated using a median filter, CLAHE applied on the green component for contrast enhancement, a Gaussian filter applied to smooth the imageROC & e-optha8 bit-198
PCA and RT [72]Green channel ratio divided by the red channel to eliminate non-uniform illumination, image normalization using the statistical properties of a grayscale image, i.e., an average gray value and its standard deviation, morphological opening operation for ROI extractionDIARETDB1, ROC16 bit95.93189
RT [73]Top-hat transformation and an average filter applied to separate features from the background, improve contrast, and remove noise Mashhad, local, ROC8 bit-192
Naïve Bayes classifier [74]Median filter applied on the green component to remove poor image artifacts, CLAHE used to improve image contrastPrivate8 bit99.9980
Contrast enhancement [75]Green layer for image contextual division, CLAHE applied on each image division for contrast enhancement, median filter applied to smooth the imagePrivate8 bit-47
SRC [76]Gaussian function and a matched filter applied to extract ROI extraction and for vessel eliminationROC8 bit-100
Hybrid classifiers [77]Morphological opening used on the green channel to smooth the disc and bright area, Gabor filter applied for lesion contrast enhancementDIARETDB0&18 bit99.40219
SPCA [78]CLAHE used on the green channel for more visible image contrast, Gaussian filter applied to attenuate noiseROC8 bit-100
Ensemble learning [79]Top-hat transformation applied on the green channel to separate the vascular and lesion region from the background, Gaussian filter used to smooth the image e-optha8 bitAUC: 0.844148
Sparse and dictionary learning [80]Otsu-based mask applied on the green layer to extract the ROI region, an adaptive histogram equalization used to eliminate intensity variations in the ROI areaROC8 bit-100
SSAE [81]-DIARETDB24 and 8 bits RGBAUC: 96.289
Multiple kernel learning [82]Green layer passed to the grid process for image patches, patches processed by a Gaussian filter for smoothness, CLAHE for patch contrast enhancement DIARETDB1, MESSIDOR8 bitROC: 0.97143
Semi-supervised learning [83]Statistical observations of grayscale image valuesROC, Private8 bit-400
Table 5. State-of-the-art deep-learning algorithms for automatic extraction of features.
CitedApproachFeaturesDatasetAccuracy
[136]2-State CNNDetect Severity-level of DRKAGGLE fundusAUC: 0.9687
[137]SVM and 3-layers CNNDetect Normal and DRMessidorAUC: 0.957
[139]CNN ModelDetection of Diabetes--
[140]CNN and GMM modelsDetection of DiabetesKAGGLE fundusAC: 97.93%
[141]CNN and M-SVMClassify the retinal disease--
[143]CNN and ResNetDetection of DRKAGGLE and EyePACS-
[144]NN and CNNDetection of DREyePACSAC: 83.68%
[145]CNN modelDetection of exudates--
[113]Multiscale and CNN Detection of fovea and OD-AC: 97%
Table 6. Performance comparison between retinal feature and lesion detection methods.
Retinal FeatureResearch StudyDatasetAccuracy (%)
Optic discHough transform [28]DRIVE, DIARETDB199.6
FIR filter [23]98.95
Optic cupCNN [37]DRISHTI-GS, Private94.1
An adaptive threshold [41]92
Blood vesselCNN and random forest [50]DRIVE, STARE97.5
Saliency and contour model [53]97
MicroaneurysmsNaïve Bayes classifier [74]Private99.99
Hybrid classifiers [77]DIARETDB0 and 199.40
Hemorrhage Variation mode decomposition [95]Private100
SVM [93]STARE97
ExudateMorphological operations [103]DIARETDB0 and 198.65
ACO [110]HEI-MED97
Table 7. Performance comparison between traditional hand-crafted and deep learning methods.
Retinal FeatureApproachResearch StudyDatasetAccuracy (%)
Optic disc segmentationTraditionalMorphological featuresMESSIDOR86
Deep learningCNN96.40
TraditionalActive contourDRIVE75.56
Deep learningSingle state-CNN92.68
Optic disc localizationTraditionalMorphological featuresMESSIDOR99
Deep learningR-CNN99.9
TraditionalVessel distributionDRIVE100
Deep learningCNN100
TraditionalONE-ONE minimizationDIARETDB1100
Deep learningCNN98.88
Micro-aneurysmsTraditionalEnsemble methodMESSIDOR90
Deep learningDCNN95.4

