Article

Hybrid Particle Swarm Algorithm for Products’ Scheduling Problem in Cellular Manufacturing System

1
Department of Industrial Engineering, University of Engineering & Technology, Peshawar P.O.B. 814, KPK, Pakistan
2
Department of Industrial Engineering, University of Engineering & Technology, Taxila 47080, Pakistan
3
Department of Electrical Engineering, University of Engineering & Technology, Peshawar P.O.B. 814, Pakistan
4
State Key Laboratory of Digital Manufacturing Equipment and Technology, School of Mechanical Science and Engineering, Huazhong University of Science & Technology, Wuhan 430074, China
5
School of Electrical Engineering, University of Ulsan, Ulsan 44610, Korea
*
Authors to whom correspondence should be addressed.
Symmetry 2019, 11(6), 729; https://doi.org/10.3390/sym11060729
Submission received: 20 April 2019 / Revised: 22 May 2019 / Accepted: 24 May 2019 / Published: 28 May 2019

Abstract

:
Industries have to produce high quality products with low cost because of the competitive environment and customer demand. To cope with the increasing demand of customized products at low cost, the concept of cellular manufacturing systems (CMS) has been introduced under the umbrella of lean manufacturing. Industries are facing three major problems in CMS; selection of product families, cell formation and products scheduling. This paper deals with the products scheduling problem in CMS. As it is a non-deterministic polynomial-time (NP) hard problem, a hybrid particle swarm optimization algorithm with Nawaz, Enscore, Ham-NEH (NEPSO) embedded with local search is proposed to find optimized sequence results for two conflicting performance measures (work in process and machine cell utilization). Here, particle swarm optimization (PSO) is integrated with an NEH algorithm to quickly achieve better optimal sequence. For this purpose, the solution obtained from the NEH algorithm is used as a seed for PSO optimization. A mathematical model is presented for conflicting performance measures; minimization of work in process (WIP) and maximization of average machine cell utilization. A case study of automotive manufacturing cells was conducted. Results of the NEPSO were compared with the existing method, standard PSO, genetic algorithm (GA), and NEH algorithm, showing that the NEPSO performed better in term of problem optimization of the cellular layouts.

1. Introduction

Scheduling is allocation of resources over a time to accomplish a set of tasks [1,2]. In a manufacturing system, it portrays the determination of sequences in which jobs should process over the production cycle, including indication of jobs’ start and finish times [3]. Its importance has been amplified in recent decades, owing to the increasing trend in diversity of demand and variety in altering markets with global competition. In addition, every schedule is evaluated under a certain set of objectives which measures the performance of the schedule.
In manufacturing sectors, scheduling activities are carried out in various layouts like job shop, flow shop, and flexible flow shops. Further, in order to gain advantages of group technology, cellular manufacturing layouts are implied. Machines in these cells may be arranged in a flow line structure or job shop like. In the current research, flexible flow line cells are encountered.
Complexity of flexible flow line scheduling falls under the umbrella of non-deterministic polynomial-time (NP) hard problem, and they don’t possess an exact method for finding an optimal solution in tractable time. To cover this gap, heuristic approaches were devised. Moreover, higher dimension problems solved with typical heuristics lead to degraded solutions. Meta-heuristic techniques were generated to achieve solutions having less gap from optimal.
In real-world manufacturing scenarios, scheduling is often carried out to optimize multiple objectives simultaneously. Ample work has been carried out on objectives like makespan, flow time, work in process (WIP), earliness and tardiness. However, scheduling considering relative performance of WIP and average machine cell utilization with minimum energy consumption have received less focus from researchers and their analysis is important because it directly relates to the profitability of the firm. Progressive manufacturing systems and strategies assure that excess WIP is a burden and should be minimized with effective utilization of machines [4]. Furthermore, utilization of a machine cell to affect minimum work in process (WIP) inventories in a production cell are priority managerial concerns. They relate to two particular objectives in production scheduling separately, minimization of maximum completion time (makespan of a certain machine), and minimization of flow/throughput time of a certain job in the manufacturing cell. WIP level depends on throughput time of a job between two adjacent machines.
An effort has been made in this work to optimize the objective function, which incorporates maximum machine cell utilization with minimum WIP. Furthermore, a hybrid meta-heuristic is proposed to generate the best possible sequence of jobs that ensures a desirable schedule. Remainder of the paper is categorized subsequently as follow: A concise literature review on manufacturing layouts, objectives and considered algorithms is presented in Section 2. A proposed methodology composed of mathematical model and descriptive elaboration of the proposed hybrid meta-heuristic is provided in Section 3. A case study considering different size problems of an automotive industry is solved in Section 4. In Section 5, results are given and discussed.

2. Literature Review

Manufacturing systems enduring applications of group technology principle received regard in the manufacturing environment with increasing product diversity and variability in customers demand. A machine cell structure is composed of machines processing part families. The cellular manufacturing system holds the key to such a type of production and is basically a physical dissection of manufacturing facilities. It is engaged in processing of a collection of analogous parts on a group of dedicated machines called a ‘cell’ [5] (Ham et al. 1985). The adaptation towards manufacturing cells is due to advantages like reduced setup times, improved product quality, simplified material flow with reduced material flow and, most importantly, reduced WIP [6,7]. Manufacturing cells involve two major issues to be tackled, namely design issues and operational issues. In designing, phase cell formation and machine layouts are studied whilst the operational phase deals with scheduling of parts to improve cell efficacy. Operational issues are crucial because they deal in depth with the hidden problems inside a manufacturing cell.
Over the last few decades, extensive research studies have been carried out on scheduling in a manufacturing cell. From previous studies [8], it is evident that various factors affect loading problems in a manufacturing cell. Therefore, it needs a proficient production planning system to benefit from Group Technology (GT) applications. Various researchers [9,10,11,12] have studied relative effects of different operation procedures in a manufacturing cell. Author [5] Ham et al. presented an integer programming model for group scheduling in flow line manufacturing cell. The proposed procedure generated optimal solutions for small size problems. [13] presented that cellular layout’s performances are dependent on scheduling of jobs. [10] addressed scheduling in manufacturing cells, considering it as a flow line cell for the makespan minimization. [6] addressed scheduling problems in manufacturing cells with the aid of genetic algorithm (GA), considering objective functions of makespan, flow time and idle time of a machine cell. The author didn’t observe the combined effect of these objectives in a machine cell. [12] proposed different heuristics for flow line manufacturing cell and identified that interchange heuristic performed well among them for makespan minimization problem.
In today’s competitive technology, researchers have targeted various optimization techniques and improved them. Approaches have evolved from analytical to evolutionary algorithms in search of optimal solutions with better computational abilities. Particle swarm optimization (PSO) is one of the recent biologically inspired algorithms and its dominance has been observed over other techniques in convergence to optimal solutions pertaining to low computational costs [14,15,16]. PSO is a stochastic optimization technique developed by Dr. Kennedy and Dr. Ebehart in 1995 which is inspired by the behavior of fish schooling or bird flocking [17]. PSO and other evolutionary methodologies such as GA share many similarities. The process is initiated with a population of random solutions then searches for optimum by updating the generations. In PSO, the random solutions, often called “particles”, move through the problem space following the current best particles [18]. Tasgetiren et al. [18,19] identified that scheduling activities urges determination of job permutations in job shop and flow shop scheduling problems. Xia and Wu [20,21] successfully applied hybrid methodology for multi-objective flow shop scheduling problem (FSSP) and job shop scheduling problem (JSSP), namely minimizing makespan, workload on critical and total overall workload. Liu et al. [22] presented variable neighborhood (VN) PSO, to minimize makespan and flow time simultaneously. Jia et al. [23] proposed a hybrid PSO, with objective functions of minimizing makespan and workload on a most loaded machine. Scheduling in a flexible manufacturing cell is executed with PSO on large scale problem that outperformed genetic algorithm, memetic algorithm and simulated annealing [24]. Tavakkoli-Moghaddam [25] adopted a pareto-based PSO to address intra-cell scheduling in manufacturing cells with respect to multi-objective minimization including makespan and tardiness cost. He suggested that the proposed algorithm performed better with medium and large scale problems.
In order to gain a competitive edge in a line of manufacturing processes, overhead costs are to be minimized with coherent factors such as (1) WIP and (2) Machine utilization. All of them hold a key factor to reduce overhead costs. (1) WIP inventory consists of partially completed set of products that are either waiting or in ongoing process. It is costly due to storage and handling costs, damage, loss and spoilage. Hence, holding WIP can be significantly costly and every manager seeks to minimize it. Therefore, many researchers worked on developing new methods for handling WIP, for example, Yang [26] and Massim et al. [27]. Conway et al. described the role of WIP with production lines in series whilst investigating distribution of accumulated WIP inventory [28]. A minimum wait objective in cyclic sequencing problems discovered minimum average WIP under the constraint of achieving maximum throughput rate [29]. Yang et al. and Zhang et al. (2014) proposed a mathematical model for steady-state investigation of cyclic scheduling in job shops. Their model lead to minimization of work in process with optimal cycle time in job shop [29,30]. (2) Utilization refers to the proper usage of machines. It considers the ratio of time the machine needs to process a set of jobs elapsed time for that machine in a certain schedule. Numerous researchers have pointed cell utilization as an objective criterion in cell formation problems, including with scatter search technique [31], and proposing new mathematical model to gain higher cell utilization [32]. Utilization is also tackled by integrating process planning and scheduling of jobs with evolutionary techniques [33].
However, combined objective functions such as machine cell utilization contradicting WIP, based on permutation of jobs, have received limited attention from researchers.

3. Performance Analysis

We assume that readers know the modeling tool of discrete event simulation: That is, part and machine process start time, finish time and waiting time.
We want to study the performance of the system and to work out a predictive grasp. The first assumption underlying is that operating times are deterministic.
In addition, we assume that:
  • No pre-emption is allowed and setup times are sequence independent.
  • Breakdown and re-work is neglected and all parts are available.
  • Buffer size is not considered.
For better comprehension of the following section, we introduce an illustrative hypothetical flow line cell (z) shown in Figure 1. Three part types (P1 (hexagon), P2 (rhombus) and P3 (triangle)) are to be produced on four different machines M(1)–M(4) with an assigned sequence (P1-P2-P3), having processing times T(x), where x is unit in minutes. In this flow line cell, missing operations of parts are represented in the figure; for example, P3 has no operation on M(1) while only P3 and P2 are processed on M(1) and M(4) respectively. All three parts have to move on the line until the end while been processed. In this certain schedule M(1) becomes the bottleneck machine, having a maximum workload of 4 + 3 = 7 min. This is termed as the cycle time (Tc) for the current scenario. Furthermore, after completion of parts for the first cycle, all three parts will be processed completely after a cycle time of 7 min.
Only enough WIP is to be used to ensure that each machine finds a part at its input when a current job finishes on it. Therefore, the bottleneck machine will work at 100% capacity and will not wait for parts. Under the calculated cycle time we minimize WIP, allowing maximum utilization of machine and work at maximum throughput rate. We assume that a sequence of jobs have TTi as a total duration or throughput time (from start to end of point). If TTi is superior to Tc, the operating sequence time is longer than cycle time and must be cut into several cycles. This is achieved by introduction of several parts of this sequence: WIP. It is noteworthy to mention that this number has to be at least equal to an integer superior or equal to TTi by Tc (see [34]). The waiting time of a part due to resource conflict makes the operating sequence longer which proportionally increases WIP.
For instance, to illustrate WIP calculation for P3 from Figure 1, following the sequence mentioned, P(3) has a total processing time of T3 = 6 + 5 = 11 min, while its waiting time is ‘0’, hence, TT3 = 6 + 5 + 0 = 11 min with the cycle time of 7 min. For this, we need an integer which is ≥ 11/7 (= 1.57) = 2 parts. Furthermore, for accumulative WIP, summation of WIP for all parts is carried out (See Equation (1) and objective function in Section 4.1). It should also be noted that in the elaborated example, setup and transport times are inclusive in the processing times, while waiting time is zero here, which ultimately leads to a lower bound or optimal point of a solution. Practically, waiting times are mostly a part of an operating schedule.
Machine utilization is triggered by the portion of time a machine is used in a current pattern of schedule and depends upon the makespan of a machine. Suppose we are having a parts sequence of 1, 2 and 3 in a schedule. For instance, we observe M(3) on which P1 and P3 are processed after being operated on M(1) and M(2) respectively. Both these parts are available on simulation time (t (min)) 4 and 6 to M(3). Hence, M(3) starts at t = 4 for P1 and at t = 6 P3 is loaded, which has a processing time of 5 min, hence, M(3) stops processing both parts at t = 11. M(3) remains idle for 1 min during this pattern, that is, t(4,5). Now, for calculation, as utilization is the proportion of time a machine cell is engaged in a production activity (1 + 5 = 6 min) to the total run time of machines from start to finish of the schedule (11 − 4 = 7 min): 6/7 = 0.857. Furthermore, underutilization is the portion or fraction in which machine is not utilized, so we can denote it by under-utilization (UU) = 1 − 0.875 = 0.135. Additionally, if average machine under-utilization in a cell is considered, then the acquired summed up UU value for all machines is rationalized by the total number of machines (See Equation (2) and objective function in Section 4.1).
When WIP is kept on minimizing, it induces a starvation phenomenon on machines, and their utilization is affected with the inclusion of idle times. In this work we desired to maximize machine cell utilization with a minimum amount of WIP.

4. Methodology

Our methodology consists of three sections, namely mathematical modeling, overview of GA, and application of particle swarm algorithm integrated with NEH heuristic, which schedules cellular layout cells of a real time case study undertaken at an automotive industry. A thorough explanation for a 10 × 10 size problem is presented for purposes of understanding.

4.1. Mathematical Modeling

There are two objective functions; maximizing machine cell’s utilization and doing so with a minimum amount of WIP. We have formulated our objective function to be a minimizing one. For this purpose under-utilization of machine is extracted by subtracting proportion of utilization from “1”.
minimize   WIP =   [ j = 1 m PT ij + j = 1 m WT ij T c ]
Minimize   Under utilization   ( UU )   =   [ j = 1 m 1   U j m ]
  i = 1 , , , n   a n d   j = 1 , , m ,
where i = ith part, n = last part, j = jth machine, and m = last machine.
These are subject to,
j = 1 m Z ij = 1   i , j
( t o ( ij ) +   t s ( ij ) )   TT ij     0   i , j
ST ij = Max ( C ij + t rj ( j 1 ) ,   C ( i 1 ) j )     i , j
C ij   C i ( j 1 ) > 0     i , j
C ( i 1 ) j AT ij > 0     i , j
AT ij = { 1 ,   t i C i ( j 1 ) + t rj ( j 1 ) 0 ,   t i < C i ( j 1 ) + t rj ( j 1 )     i , j
ST ik     ST ij     PT ij     i , j
PT ij 0     i , j
TT ij 0     i , j
T c ( ij ) > 0     i , j
The terms and indices used are as follows:
C ij = AT ij + WQ i , j + PT ij + t s ( ij )
  • AT ij = Arrival time of part “i” on machine “j”
  • PT ij = Process time of part “i” on machine “j”
  • t s ( ij ) = Setup time of part “i” on machine “j”
  • ST ij = Start time of part “i” on machine “j”
  • C ij = Completion time of part “i” on machine “j”
  • WQ i , j = Waiting time in queue of part “i” on machine “j”
Equation (3) illustrates that at any time one part will be processed by every machine. Equation (4) shows that summation of operation time and setup time for part “i” on machine “j” is always equal to or less than throughput time of that part and machine. Equation (5) stipulates that for a part “i” to start processing on particular machine “j”, maximum completion time is to be selected between completion time + traveling time of part “i” from previous machine and completion time of previous part “i-1” that was processed on machine “j”. Equation (6) ensures that completion time for same part on machine “j” is always greater than completion time at machine “j-1”. Equation (7) depicts that the queue is always generated when completion time of a previous part is greater than arrival time of next part over the same machine. Equation (8) is basically an event to-occur description, that is, denoted by “1”. It ensures that part “i” can only arrive at machine “j” when it has finished processing on previous machine. Equation (9) determines the difference between start times of a job at two consecutive machines should be equal or greater than process time of job at pre-machine. Equations (10)–(12) are non-negativity constraints; they can’t be less than zero and are restricted to be always positive.
(1) Decision Variable
Scheduling through sequencing of parts to achieve minimization of the objective function is considered. Decision is to be made based on allocation of parts priority on machines in order to achieve optimum objective function value.
(2) Objective Functions
The WIP of ith job is expressed by integer number of the cycle times, essential to complete all operations in order to produce that part. Therefore, WIP of ith job is stated as follows:
WIP i = [ j = 1 m PT ij + j = 1 m WT ij T c ]
with WT ij being waiting time between operation O ij and its successor O ik ( i , j ) regarding same occurrence of the part. Hence, minimizing WIP i is equivalent to minimizing the sum of all the waiting times between operations of ith job.
Machine utilization of jth machine is expressed by the ratio of total processing time for all parts required on that machine to the total run time of the machine in a pattern schedule. Hence, utilization of machine j (Uj) is termed as follows:
U j = i = 1 n PT ij RT j
with PT ij being the total processing times including setup times of ith part on jth machine and RT j is total machine run time to process all the parts in a schedule pattern. In other words, RT j = max. machine stop time (makespan) – min machine start time. For calculating under-utilization:
UU j = 1   U j
where UU j being under-utilization of machine j. The average under-utilization of a machine cell is achieved by dividing with “m” machine: Avg. UU = j = 1 m 1   U j m . Eventually, the combined objective function is as follow:
[ i = 1 n j = 1 m P ij + j = 1 m W ij T c ] + [ j = 1 m 1   U j m ]
(3) Normalizing Objectives and Weighted Sum Method
A simple approach of weighted sum method taken from multiple criteria decision making (MCDM) is applied to calculate the weights and to normalize the objective functions [35], to get a better tradeoff between the objectives. By combining the objective function, fitness is achieved, that is a = 1 2 w a έ l , where w a is a constant representing the weight for a-th objective, a = 1 2 w a = 1 and έ l is normalized form of l-th objective that is calculated by (13):
έ l ( x ) = ε ( x ) LB UB LB  
where ε ( x ) , LB and UB are l-th objective function value of solution x, the best and worst known values of the solution for the l-th objective, respectively.

4.2. Genetic Algorithm

Genetic algorithms have proven to be systematic methods for solving search and optimization problems [36]. These algorithms apply the same processes of biological evolution, based on a population, selection, reproduction, and mutation, achieving with them the evolution of the system that leads us to the solution of the problem. The encoding scheme is a representation of a schedule by a string of decision variables, in other words, chromosome. In this algorithm, priority relationship between the jobs is adopted and is the basis for the representation scheme of solution. Chromosome is a priority list K, for instance, {6, 5, 3, 2, 1, 4}, which means that job 6 is entitled to the highest priority. Consuming the schedule generator as mentioned, a final solution is acquired with the priority list. The actual jobs’ sequences in various machines are dissimilar in the final associated solution. In each machine, jobs are scheduled dynamically conferring to the decision rule. At each decision period, the starting time of the next processed job is decided and at that point the finish time of that task is the new decision period.
The transition from one generation to another in a genetic algorithm is as follows [37]:
  • Evaluation: Determine the aptitude of each individual according to certain criteria or measure, that is, which individuals are the most apt to survive.
  • Selection: Select the strongest individuals of a generation that must pass to the next generation or must reproduce. In our case, roulette wheel selection scheme [38] was applied.
  • Crossing: Take two individuals to reproduce and cross their genetic information to generate new individuals that will form a new population. Several crossover operators have been proposed for the permutation encoded chromosomes. In the current study, the Similar Block 2—Point Order Crossover (SB2OX) was applied as according to results of [39], it is an efficient technique for a permutation solution space. The crossover probability considered was for two levels (0.2 and 0.3)
  • Mutation: Randomly alters the genes of an individual because of errors in the reproduction or deformation of genes. In other words, genetic variability is introduced into the population for diversity enhancement of a population. In addition, early convergence is also avoided to any local optimum. In this study, swap technique was used with two level probabilities, 0.01 and 0.02.
  • Replacement: Procedure to create a new generation of individuals.
A GA starts from an initial population with individuals generated randomly or from certain rules that achieve greater diversity in the population [40]. Generation after generation the processes listed are executed, until reaching a pre-established generation or the algorithm converges to a solution.

4.3. NEPSO in Scheduling

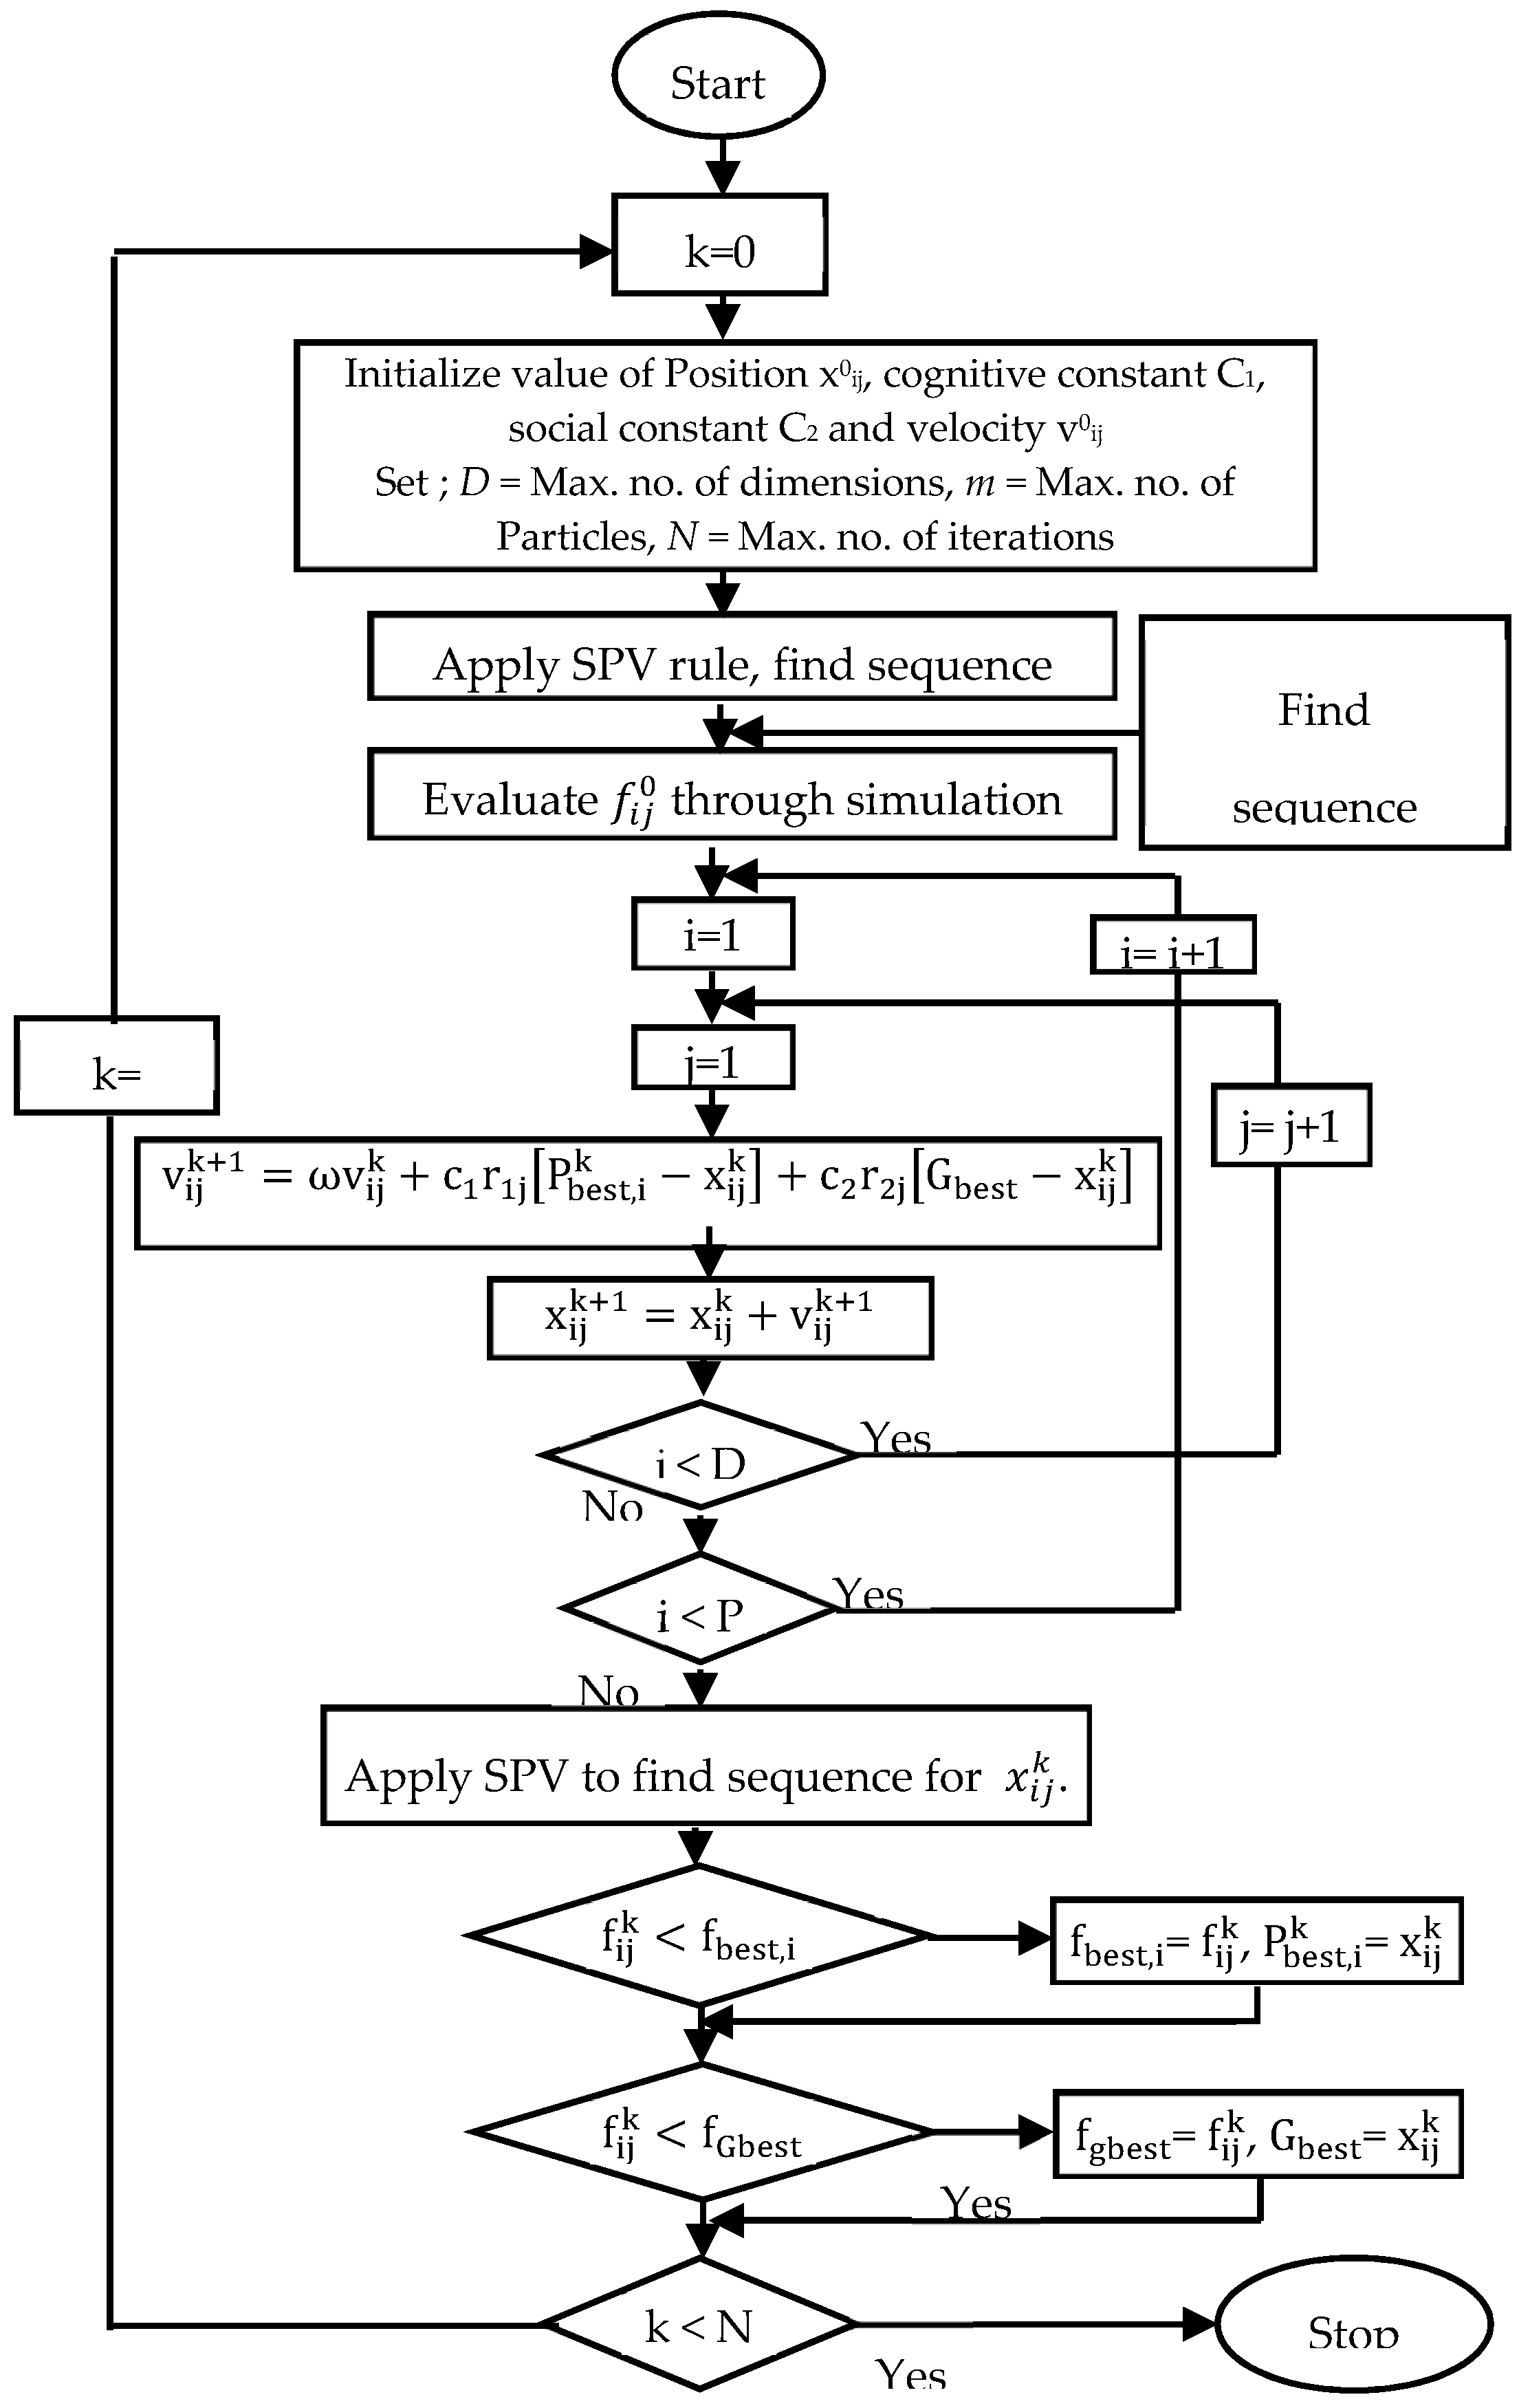
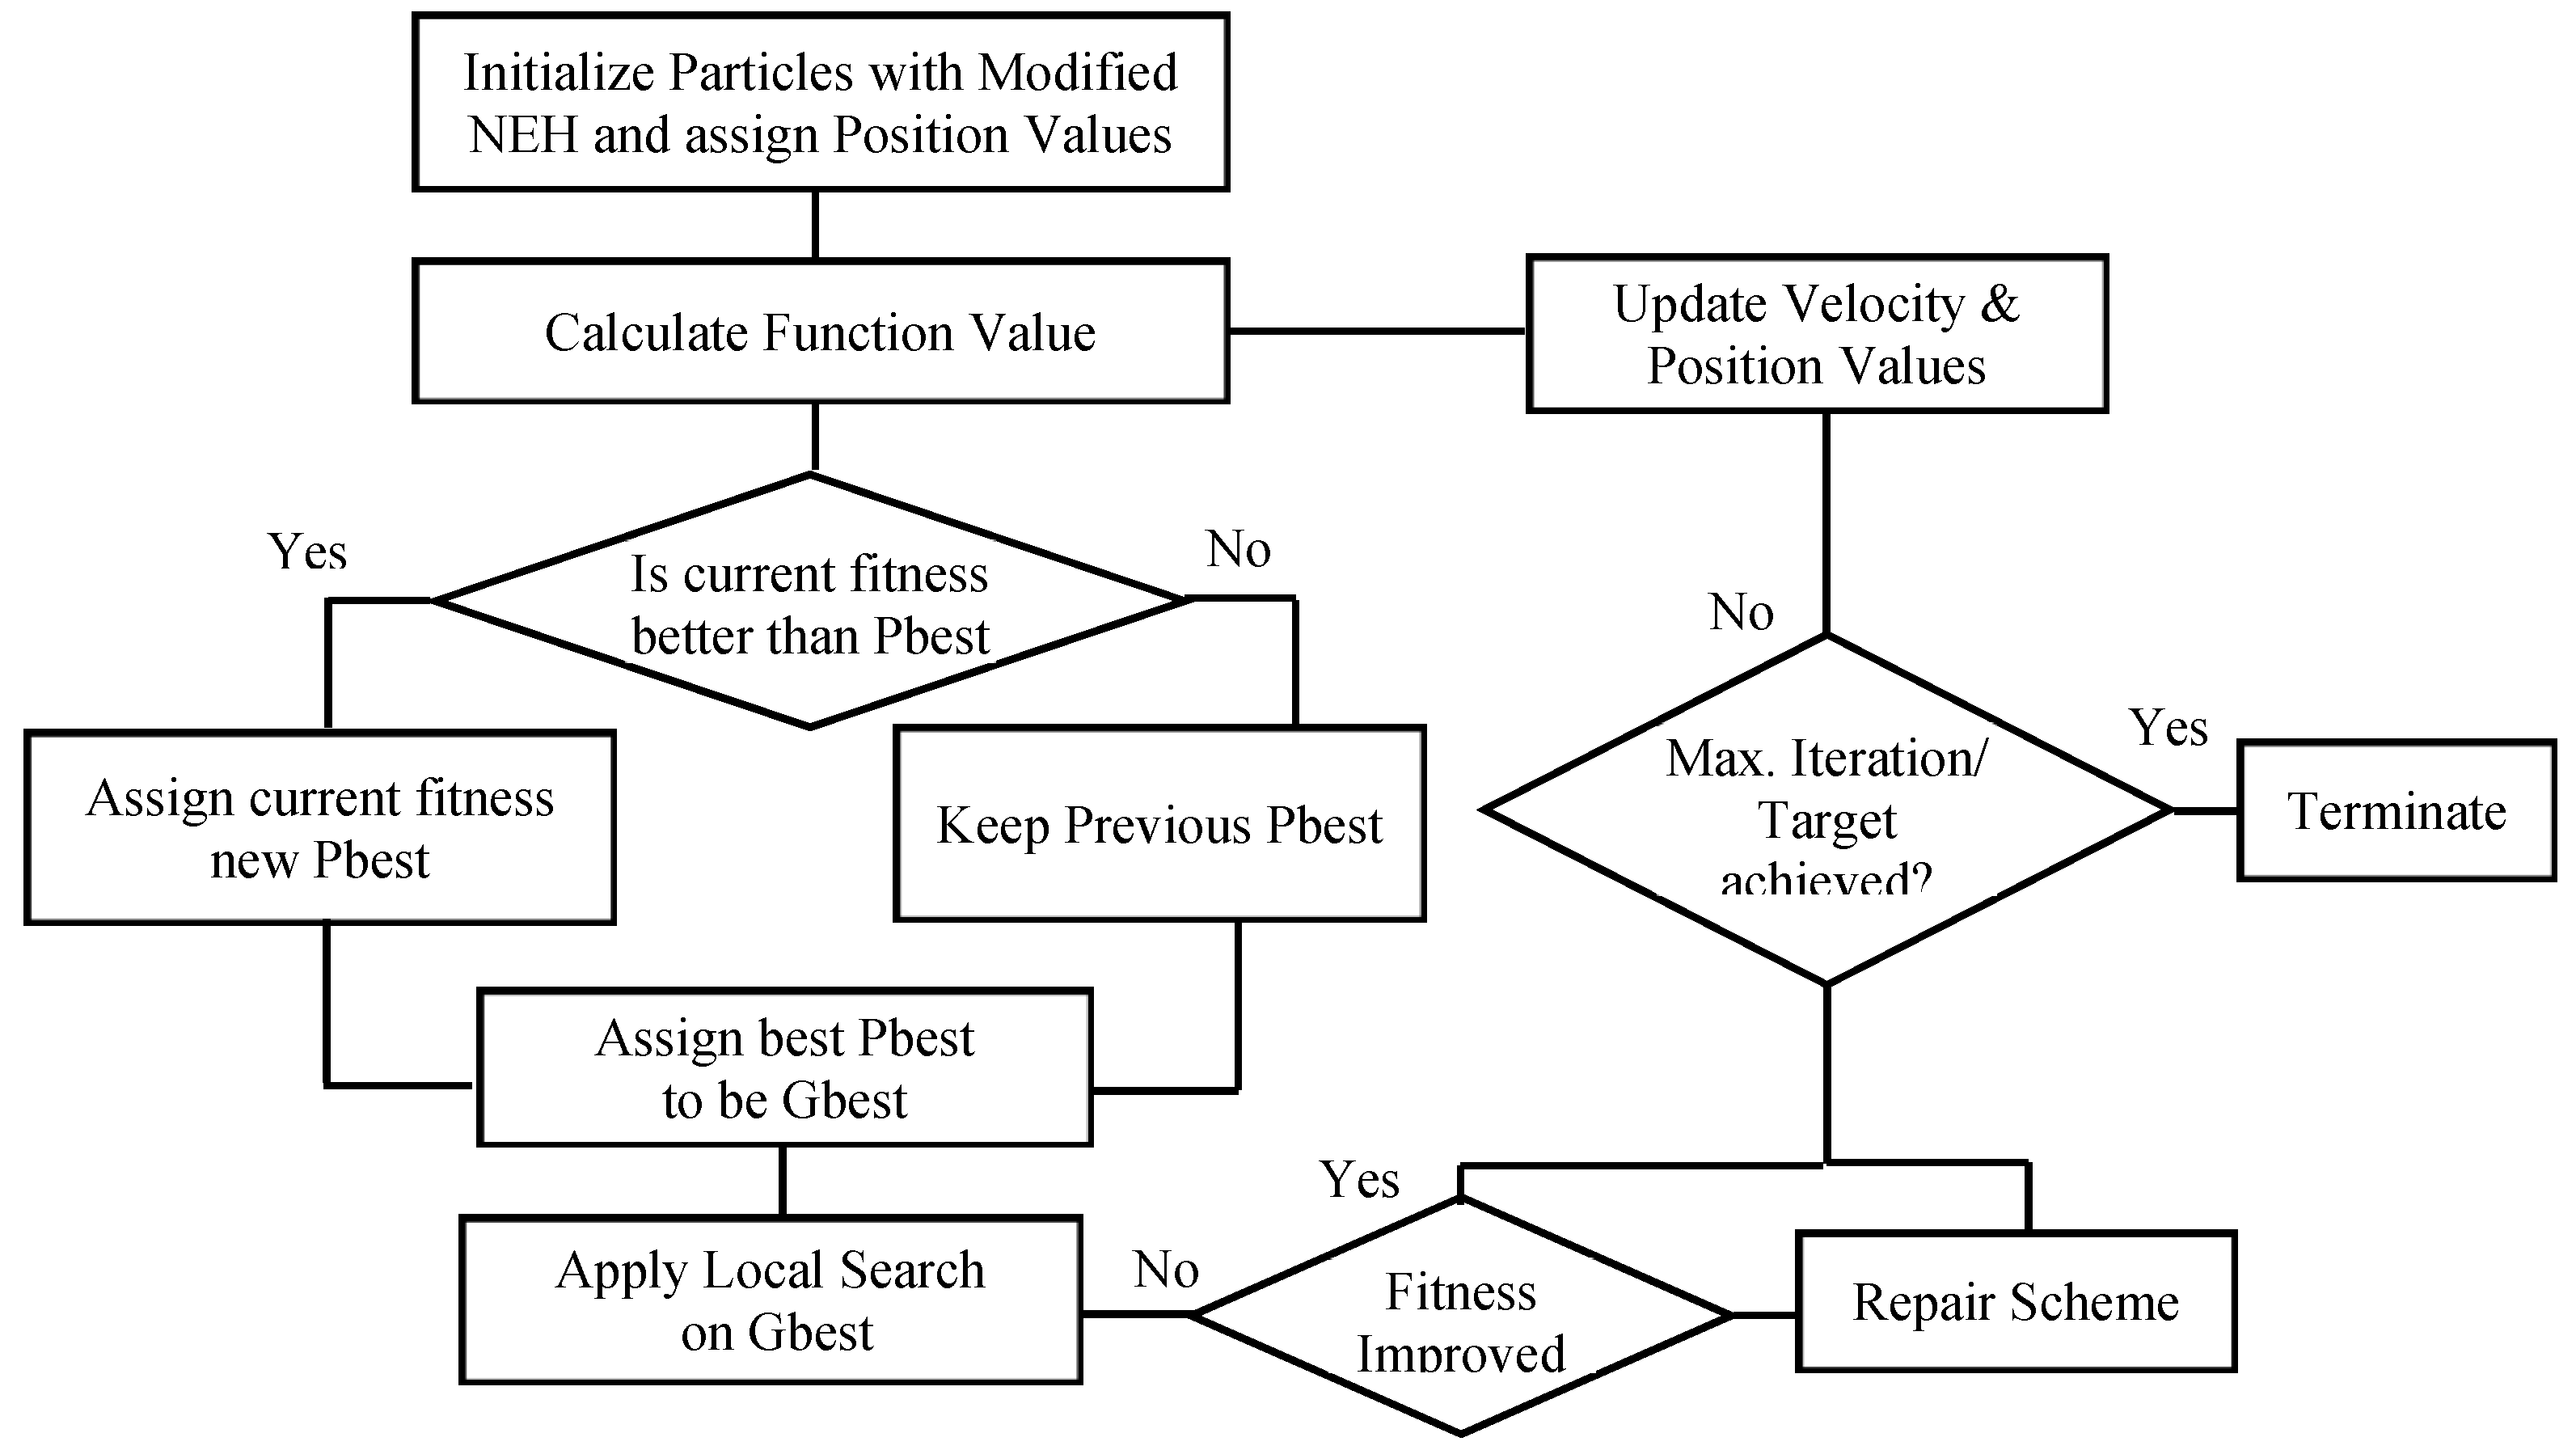
This hybrid algorithm presents combination of two distinct algorithms, namely a constructive heuristic (NEH) and improvement algorithm (PSO) being integrated with discrete simulation. Motivation for integrating both these algorithms is due to a need for a better initial population for the search based algorithm. Normally, initial population is on random basis; we cannot apprehend a better result every time. NEH won’t give an optimal sequence of the parts but it certainly gives a better sequence to start up with. A simple methodology of NEPSO is provided in Figure 2, while Figure 3 gives a detailed step-wise framework for the proposed algorithm.

4.3.1. PSO Terms to clear:

  • Particle: At iteration k, X i k ith particle in swarm is denoted by X i k and is represented by number of dimensions as X i k = [ x i , 1 k , , x i , n k ] ; x i , j k refers to position value of ith particle w.r.t to dimension j (j = 1,..., n).
  • Population: The group of m particles in swarm at iteration k, i.e. p k = [ X 1 k , , X m k ] .
  • Sequence: S i k is a sequence of jobs inferred by the particle X i k . S i k = [ s i , 1 k , , s i , n k ] ; s i , j k is the arrangement of job j in domain of the particle i at iteration k w.r.t. jth dimension.
  • Particle velocity: V i k is the velocity of ith particle at kth iteration; V i k = [ v i , 1 k , , v i , n k ] .
  • Inertia weight: Parameter used for controlling impact of the previous velocity on the current velocity and denoted by wk.
  • Personal best: Position values determining best fitness values for ith particle so far until iteration k is known as personal best denoted by PB i k . Updated for every particle in swarm, such as when fitness ( S i k   ) < fitness ( S i k 1   ), personal best is updated else it stays the same.
  • Global best: Among all particles in the swarm at iteration k, position values with a sequence giving overall best fitness represents global best particle.

4.3.2. Initial Seed Solution

Utilization of machines pertains to makespan, while WIP is related to flow time of jobs. In order to optimize both of them, their primary objectives must be minimized. For such purpose, a modified NEH heuristic is used in this work to pursue a better initial seed solution. This modified heuristic gave fine results when tested on benchmark problems. NEH heuristic used was as follows:
  • For each job i, find the total processing time Ti with help of (14).
    T i =   j = 1 m PT ij
  • Sort the n jobs in descending order of their total processing times.
  • Take the first four jobs from the sorted list and form 4! = 24 partial sequences. The best k out of these 24 partial sequences is selected for further processing. The relative positions of jobs in any partial sequence are not altered in any later (larger) sequence.
  • Let x be the position numbers. Set x = 5, because we are already filled with 4 positions, that is, jobs.
  • The next job on the sorted list is inserted at each of the x positions in each of the k (x−1)-job partial sequences, resulting in x × k x-job partial sequences.
  • The best k out of the x × k sequences is selected for further processing. Here we distinguish and find out two sequences, that is, kth sequence with minimum total flow time and kth sequence with minimum makespan.
  • Increment x by 1.
  • If x > n, accept the best of the k n-job sequences as the final solution and stop.
  • Otherwise go to step 7.
Two different sequences are obtained from the heuristic, one with minimum makespan and the other with flow time. In order to complete an initial population size matrix, perturbation/mutation schemes are applied to the acquired sequences in order to generate sequences with inherited good characteristics.
(4) Steps of Hybrid NEPSO
  • Determine the initial solution with the aid of proposed heuristic.
  • Set iteration k=0 and number of particles—each job represent a dimension. Set values of cognitive and social co-efficient C1, C2 [18].
  • Linking to the initial solution, generate position values according to SPV rule for m particles in search space, i.e.{ X i 0 ,   i = 1 , , m } where X i 0 = { x i 1 0 , , x in 0 } and n is last job’s dimension.
  • Generate initial velocities for the particles in random manner with help of Equation (15), where Rn(0,1) is random number in between 0 and 1,   { V i 0 , i = 1 m } where we have V i 0 = [ V i,1 0 , V i,n 0 }
    v i j 0 = v m i n + ( v m a x v m i n ) R n ( 0 , 1 )
  • Evaluate the sequences by finding out the function values with help of simulation.
    • Simulation model assists in finding throughput time for machines on basis of which WIP is calculated.
    • Model also determines if component of time machine is idle, calculating average utilization of the machines.
  • Set these function values to be personal best for each particle in the swarm at first iteration.
  • Select minimum of the personal best values and set it as global best.
  • In next step, update velocity for the particles, keeping track of previous personal best value of the particle and global best of the swarm; this helps in convergence to achieve good fitness values.
  • Updated velocities change the particles position and new sequence is developed and evaluated.
  • Apply smallest position value (SPV) rule on the positions of generated particles, thus, determining its sequence. SPV rule gives the job its sequential number according to its dimensions adjusted by arranging particle position values in ascending order.   S i k = [ s i , 1 k , , s i , n k ] , where s i , j k is the assignment of job j of the particle i in the processing order at iteration k with respect to the jth dimension.
  • Evaluate function values; if the achieved are minimum than previous, their particle positions are updated in library of personal and global best positions.
  • If stopping criteria is met, stop the iteration.
Otherwise, move on towards next iteration and repeat the steps viii–xi.
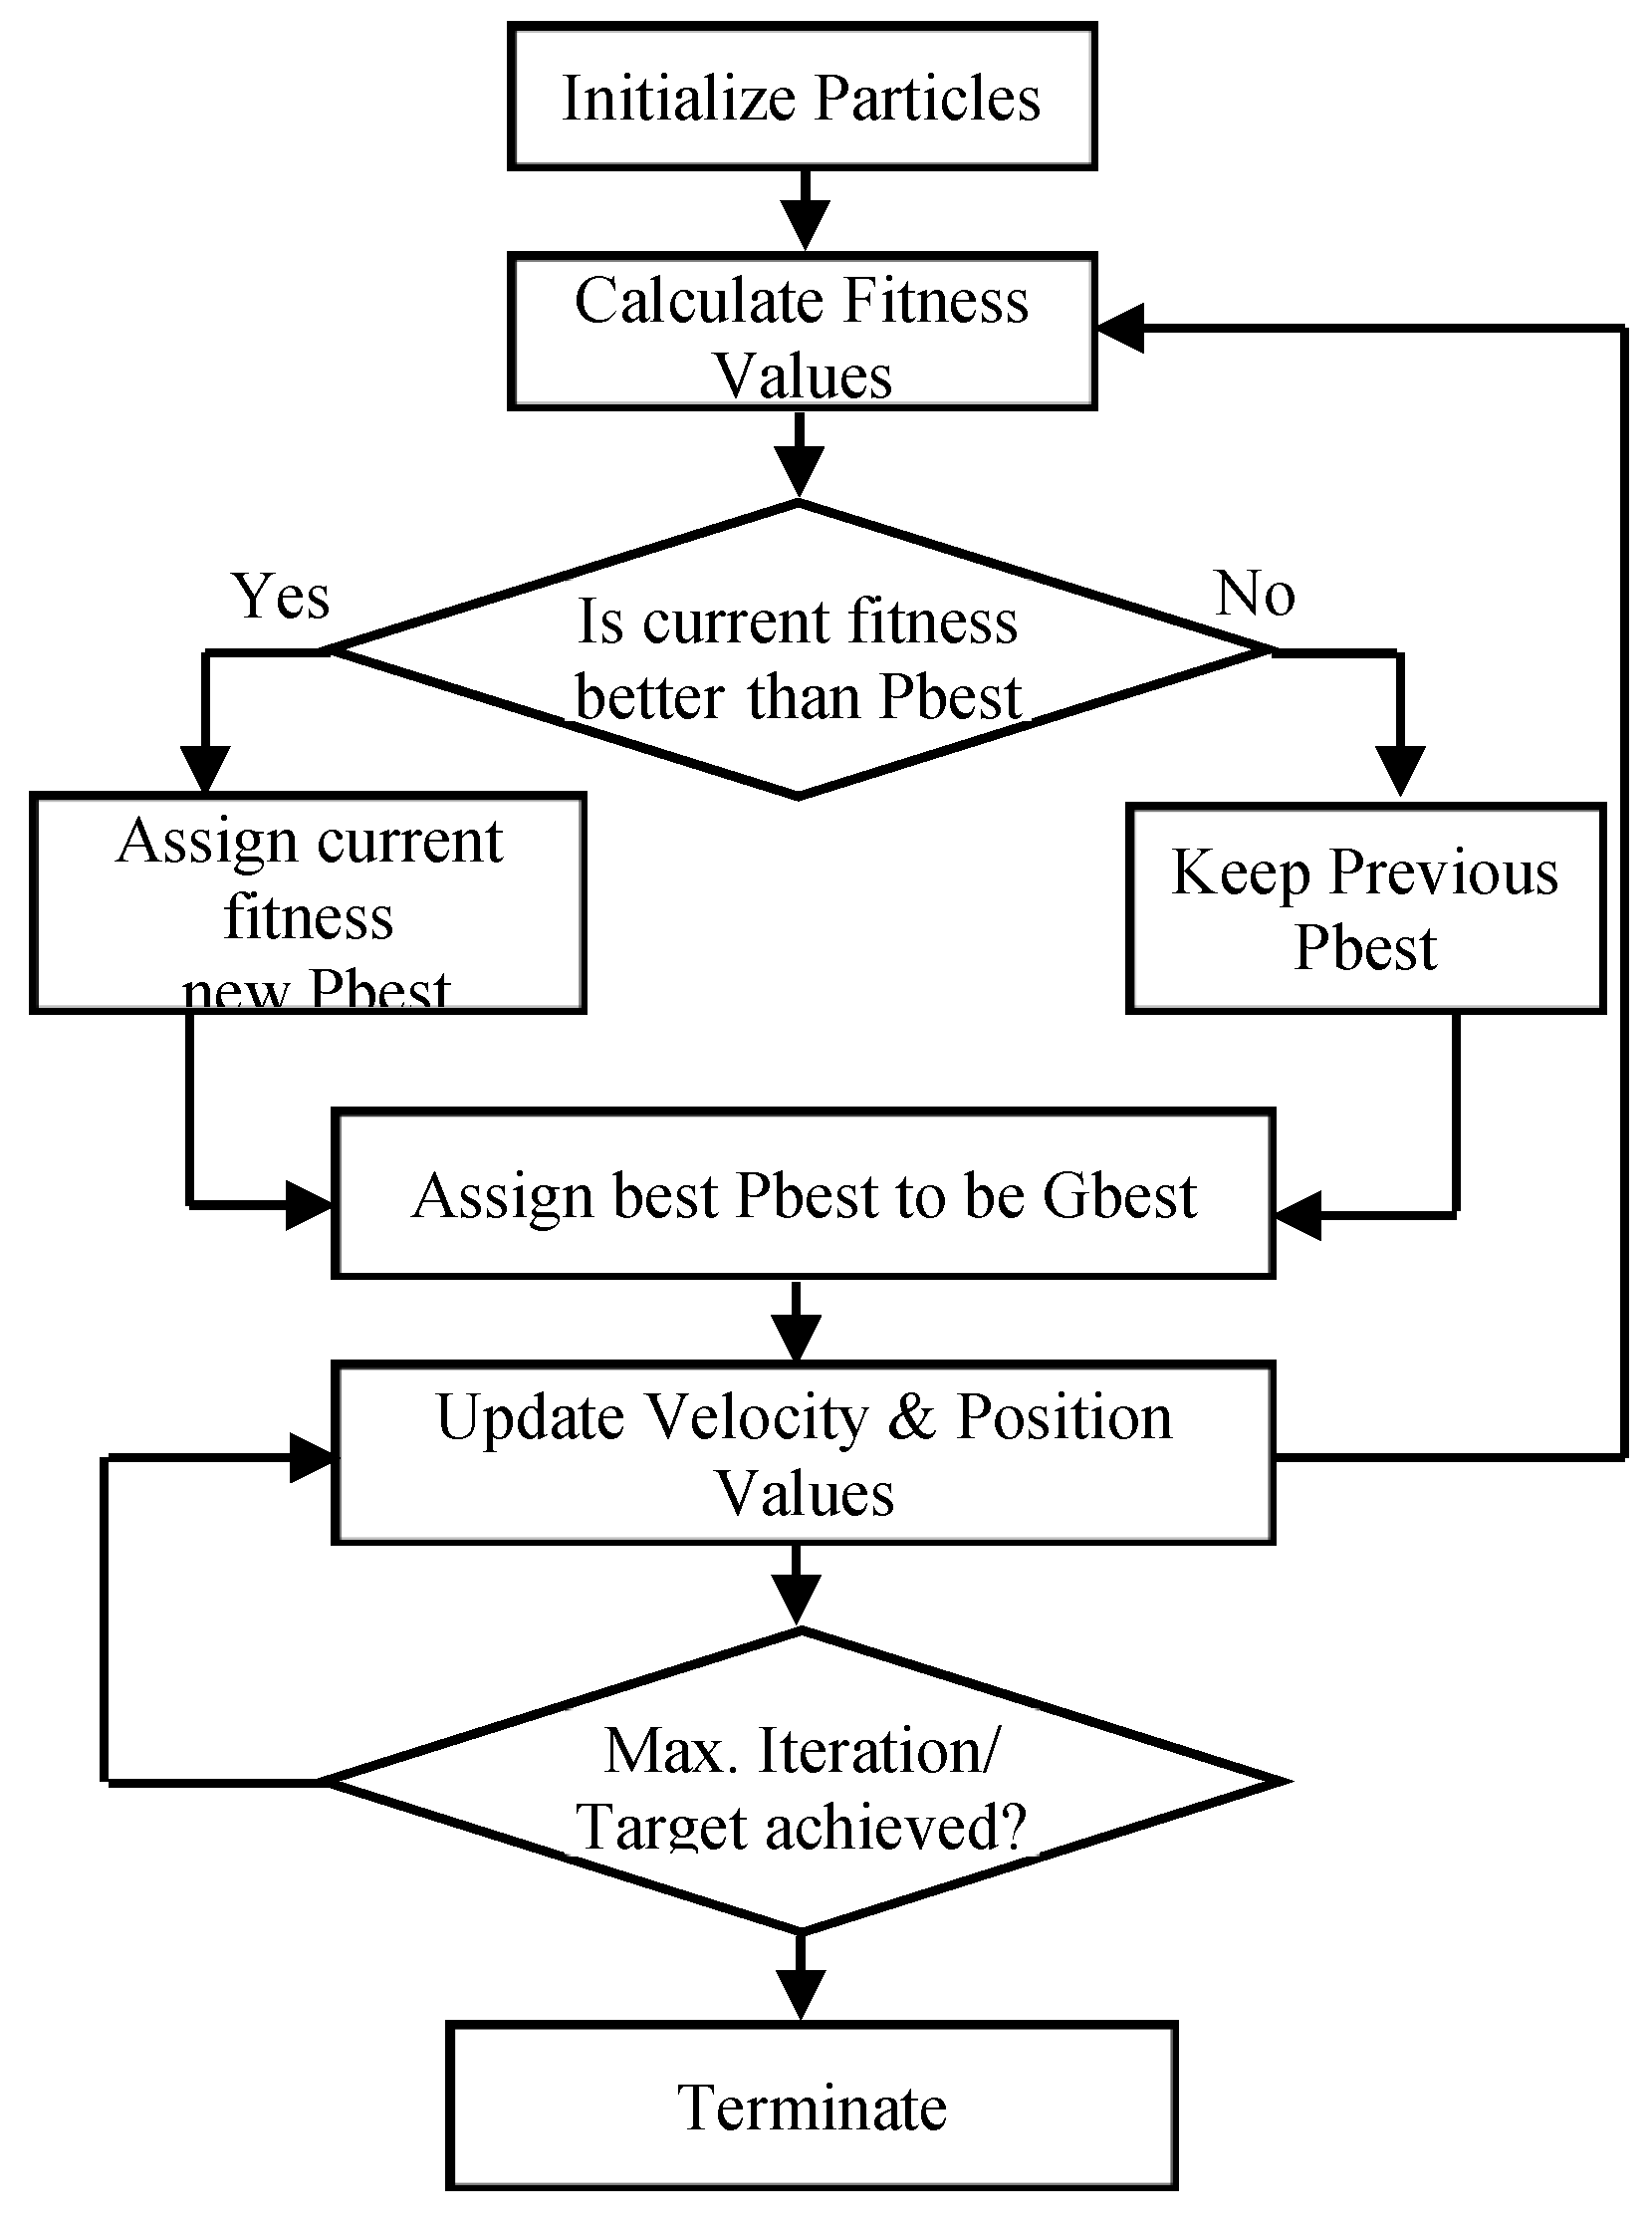
Furthermore, a flow-chart view is provided in Figure 4 (Standard PSO) and Figure 5 (Proposed NEPSO) for the ease in understanding of both the procedures, similarities, and differences.
(5) Solution Representation
Solution representation is an important issue in designing PSO algorithm. For constructing a direct relationship among particles and problem domain of a flow shop problem, n number of dimensions are used for n number of jobs (j = 1… n); each dimension depicts a job.
Every particle has continuous set of position values (PVs) that must be converted into discrete values for permutation purpose; hence, smallest position value (SPV) is applied. SPV phenomenon arranges jobs in ascending order of their PVs’ and determines its sequence. Solution representation framework for particle X i k is illustrated with its velocity and corresponding sequence in Table 1. It is evident from table that smallest position value among all is x 1 , 6 0 = 1.476, which relocates j = 6, giving it first value in the sequence and simultaneously other dimensions are arranged.
(6) Variable Neighborhood Search (Local Search)
Local search is integrated with NEPSO in order to obtain better results. Standard PSO lacks local search and sometimes easily sticks in local optima. In local search, swapping of parts is carried out randomly in order to get better results. If a better sequence is found, it violates the SPV rules and needs a repair scheme. This approach is demonstrated in
Table 2. Local search applied to sequence before repair, where job s i , 3 k = 1 is interchanged with s i , 4 k = 3. As seen in Table 2, the SPV rule is violated by applying local search to the sequence, because the sequence is a result of the particle’s position value itself. Once local search is completed in iteration, the particle must be repaired so the SPV rule is not violated. This is obtained by changing position values according to the SPV rule as shown in table. To further elaborate, interchange the position values of the jobs exchanged with respect to their dimensions. Since, s i , 3 k and s i , 4 k are interchanged, their associated position values x i , 3 k = 5.44 and x i , 4 k = 8.91 are interchanged to keep particle consistent with SPV rule, as evident in Table 3.
Performance of the local search algorithm relies on the choice of neighborhood structure. For a flow line cell, the following two neighborhood structures are employed as in [19,24]:
  • Interchange the two jobs between yth and zth dimension, y ≠ z (interchange).
  • Remove the job at the yth dimension and then insert in zth dimension, y ≠ z (insert).
The methodology of local search in this work is based on insert accompanied by interchange variant of variable neighborhood search (VNS), presented in [26].

5. Case Problems

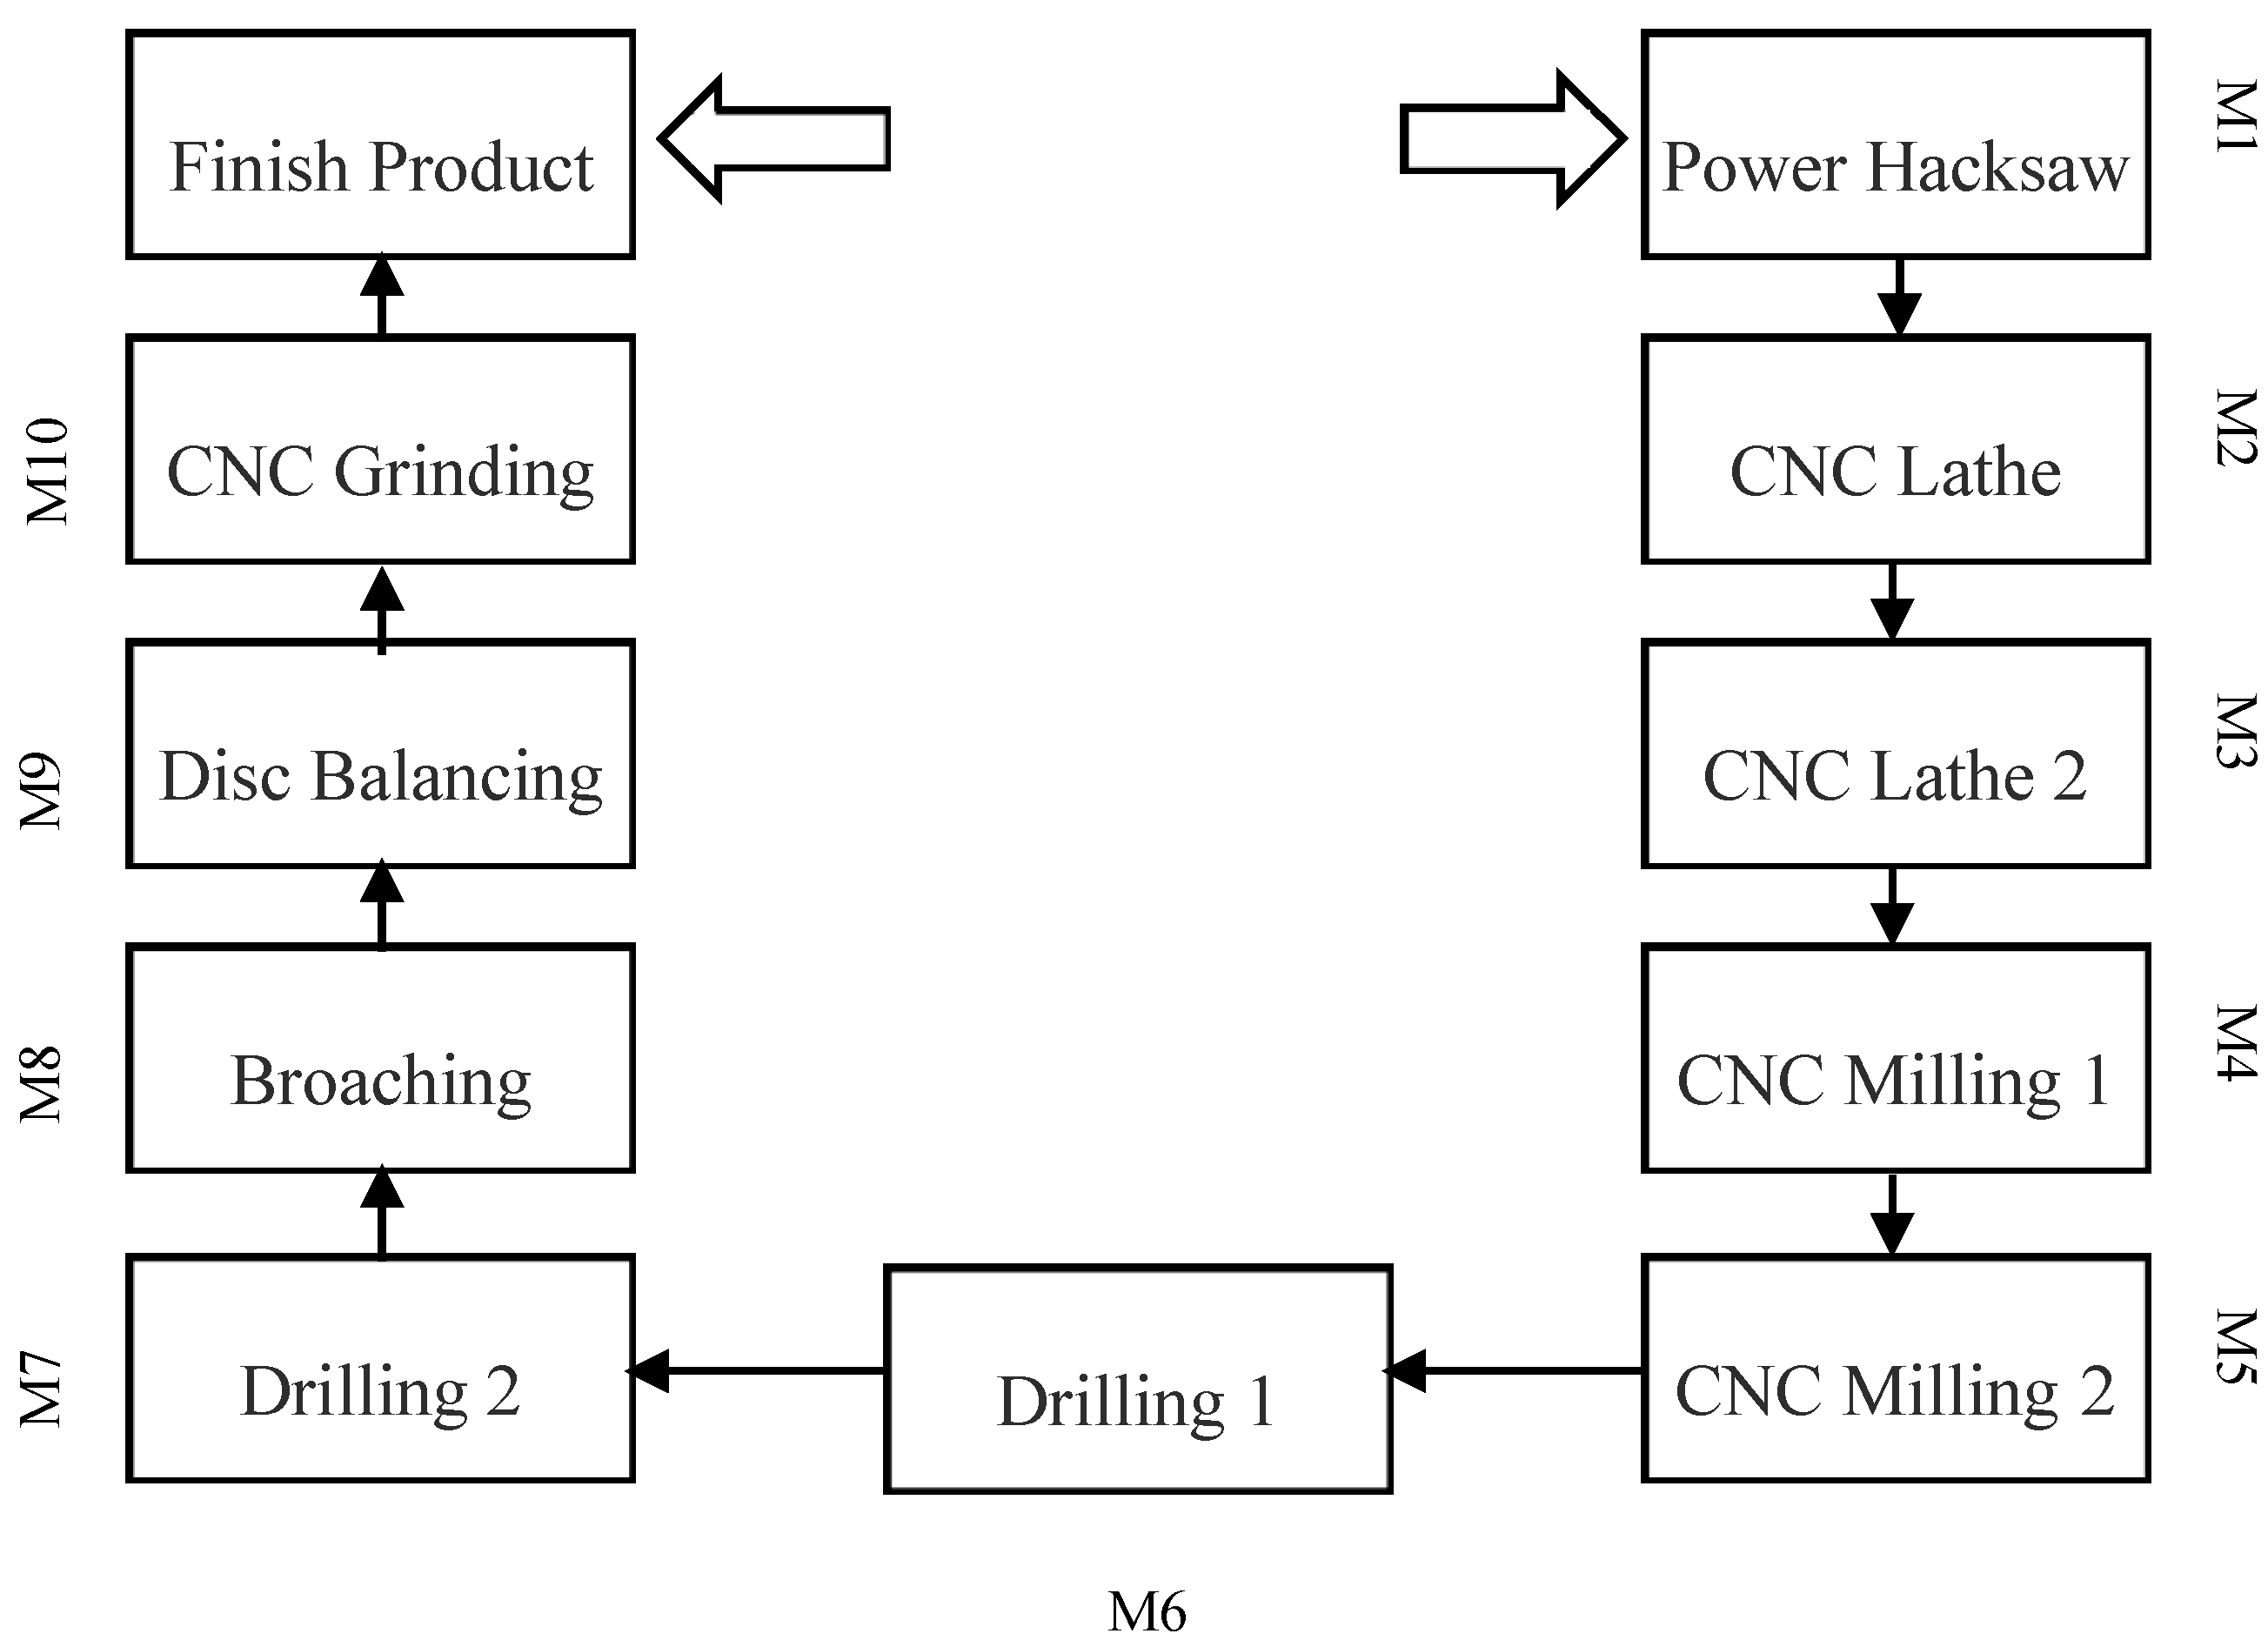
In this work, a case study has been considered and the developed model with proposed algorithm is applied to it. The case study is related to the automobile industry, having various sized cellular layouts, which produces various spare parts of automobile. For purposes of understanding, a flow line cell sized 10 × 10 (ten parts, ten machines) was selected and application of the proposed algorithm was briefly discussed. Results comprising 14 other cells with different sizes are discussed in the next section. The layout of 10 × 10 machine cell is shown in Figure 6, where M1 represents machine one and so on. The flow of part in the cell is shown from start to end point.
Data for parts processing and setup times on each machine is shown in Table 4. Processing times were small due to mostly automated/small operations. Missing operations are denoted with ‘0’ in the tables. Because it is a flow line cell, parts having missing operations also possess transportation time between machines.

5.1. Application of NEPSO on Case Study

PSO is one of the most effective optimization tools regarding scheduling [41]. NEH is used to obtain an initial seed solution with respect to both objective functions. A sample of an initial seed solution is shown in Table 5. The first and sixth particle represents sequences with minimum flowtime and makespan respectively, whilst other particles are obtained by perturbation schemes as discussed before. The italic form shows the parts being altered with respect to position.
The parameters set to run the algorithm are shown in Table 6. Parameter settings are taken from the study of parametric optimization of inertia weights, constriction factor, and velocities involved in the algorithm to enhance its search capabilities in the search space [18,42,43,44]. These studies have a strong relevancy with the current study because of the nature of the problem (combinatorial optimization in flow line shops). These authors have solved it on a multi objective problem, solving makespan and flow time, and the parameter space is a discrete one with the algorithm adapted to operate in it. The initial particles are assigned position values following smallest position value technique and their velocities are generated randomly by Equation (15). All steps further from this point are the same as standard PSO. In order to avoid trapping in local optima, local search is applied on global best value after first iteration with rate of 30% of initial population. In total, three runs were performed for each set of 50 generations and average values were taken to observe the trend.
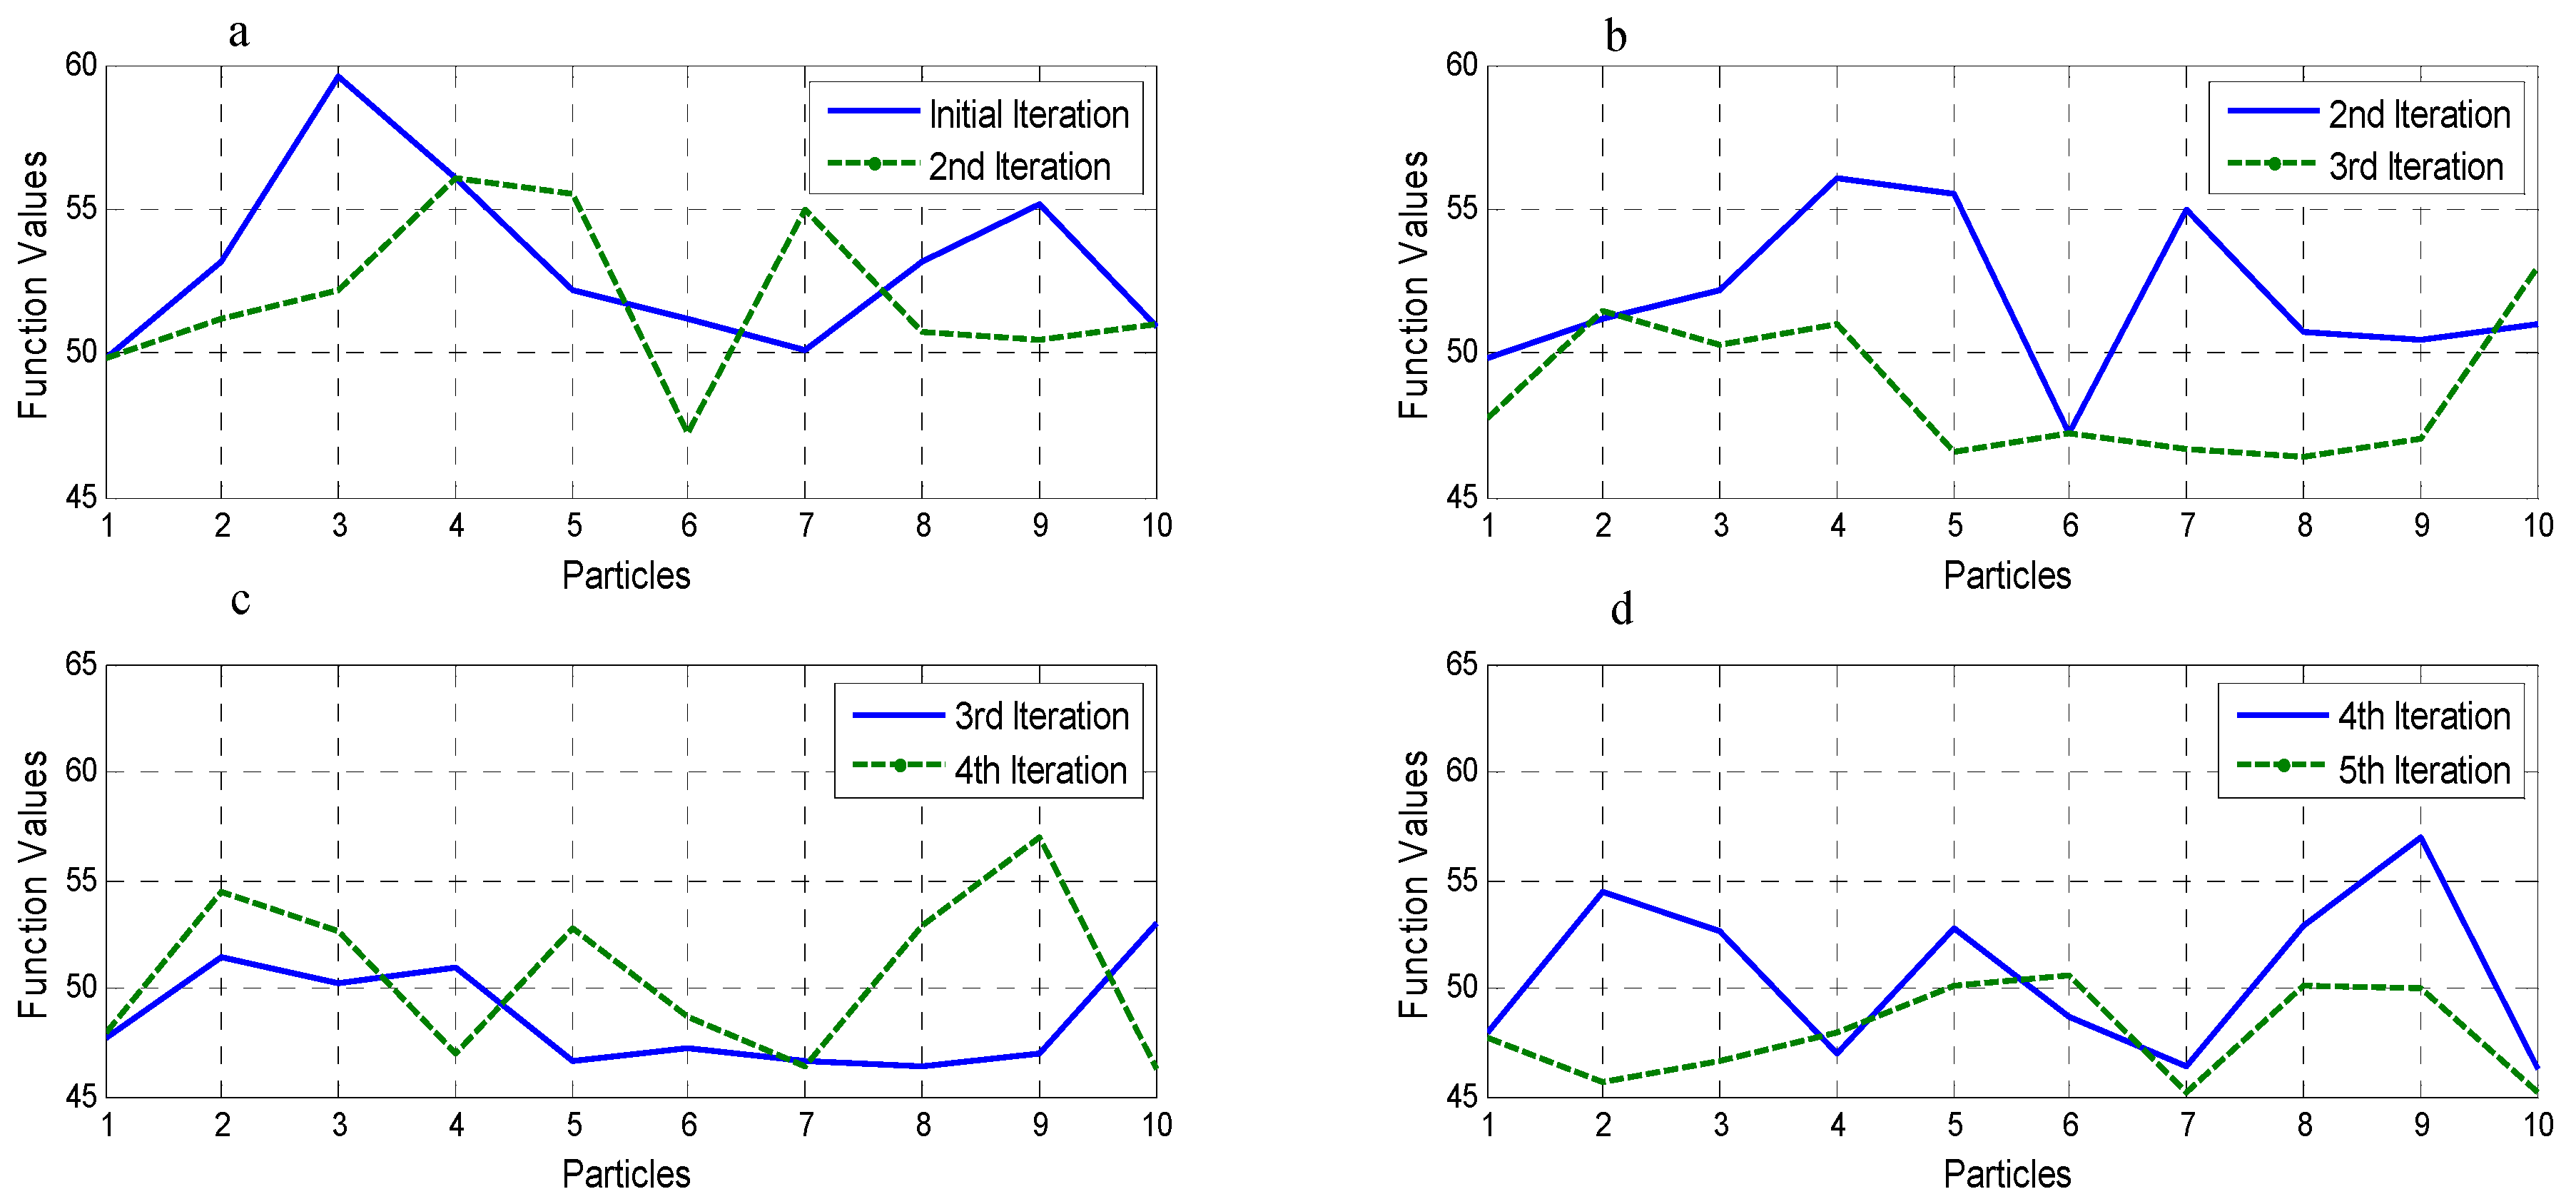
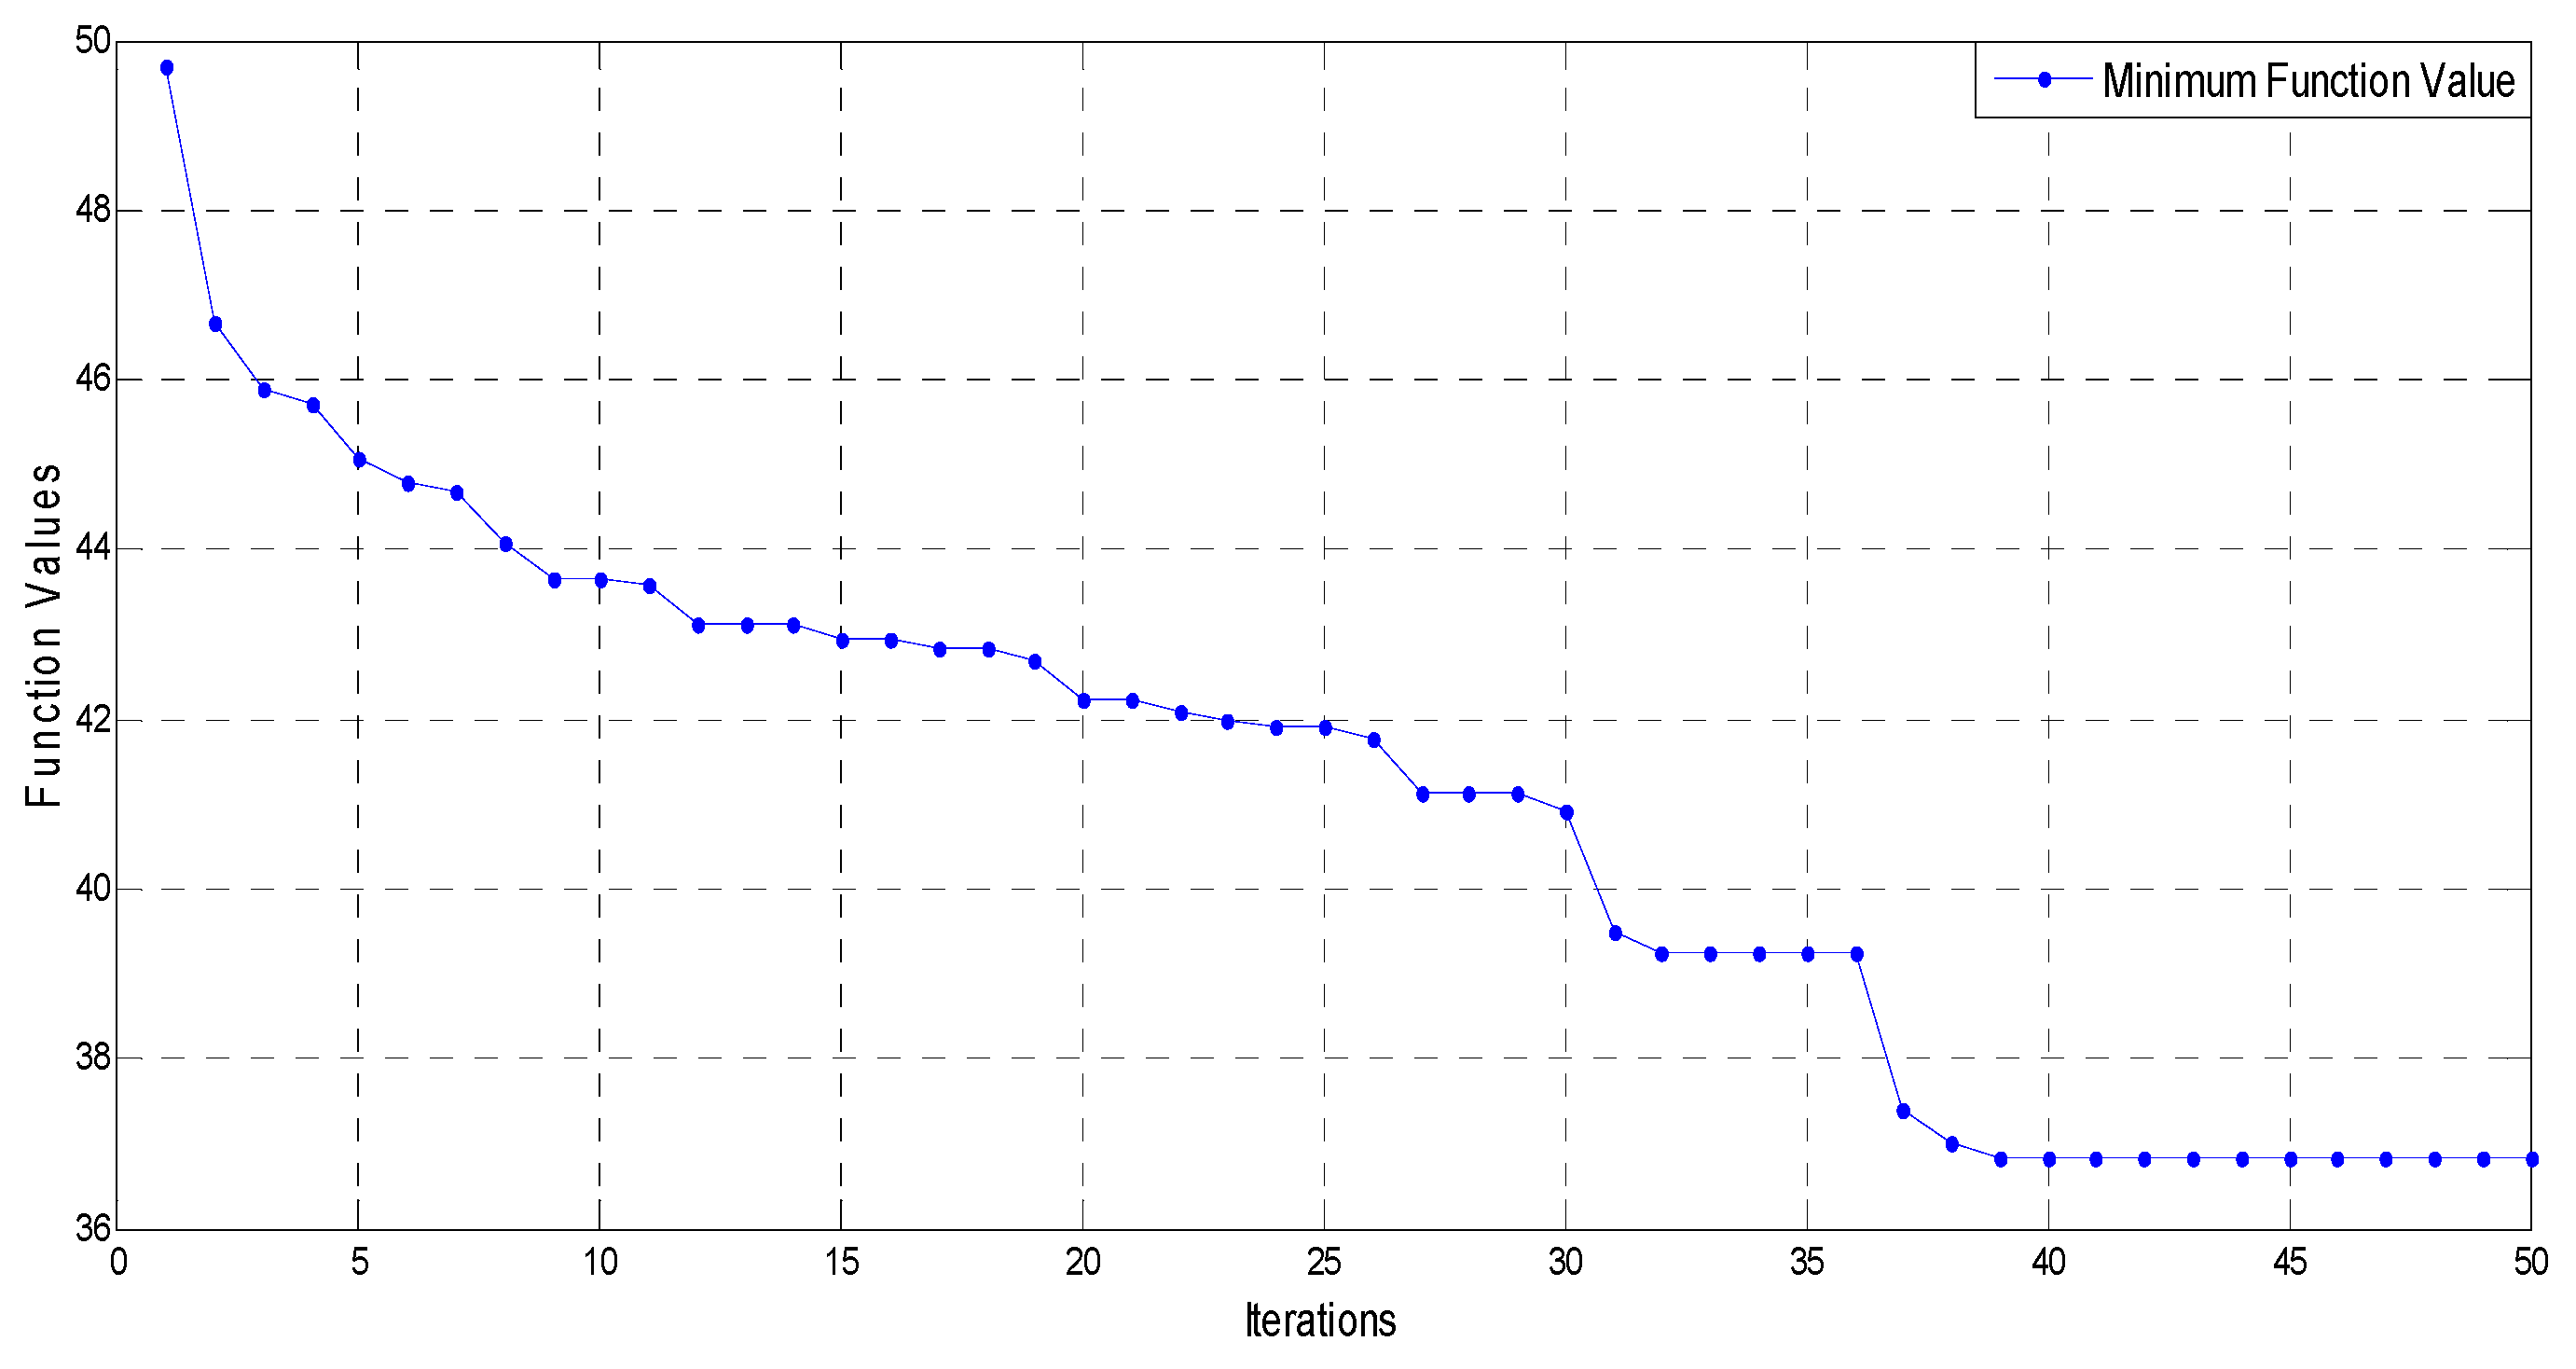
The behavior of the algorithm to optimize the function values from start onwards is substantial, and it improves the objective values. Convergence rate is higher at the start and it steadies and declines as the iterations proceed. Figure 7 shows convergence of a particle achieved from subsequent iteration while average function values of the swarm are minimized. Basically, a trend of convergence for the 10 particles is shown in which objective function is minimized from a range of 60 to 45 in only four iterations. Figure 8 presents the overall minimization of an objective function value.
In next section, the proposed algorithm was applied on various cell sizes and their results were compared with other algorithms such as earliest due date (EDD), NEH, GA, and PSO to check its robustness. Currently, EDD was practiced in the cellular setups which resulted in high WIP and under-utilization.

5.2. Comparison and Model Analysis

The performance of the proposed NEPSO is examined by solving through an ILG IBM CPLEX optimizer. The key parameters selection are used as presented by Cui et al. [45]. The comparison analysis are conducted for the all problem sets. A few of them are given in the Table 7 to show the validation and performance of proposed algorithm.
Percentage gap is used to identify the quality of solution which is calculated using Equation (16).
Percentage   Gap   =   Obtained   Value   Best   Value Obtained   Value
In Table 8, percentage gap for objective values and computation time are zero, indicating that the proposed NEPSO algorithm achieved best optimal value against the CPLEX optimizer. Therefore, the proposed NEPSO outperformed for the current problem sets.

6. Results

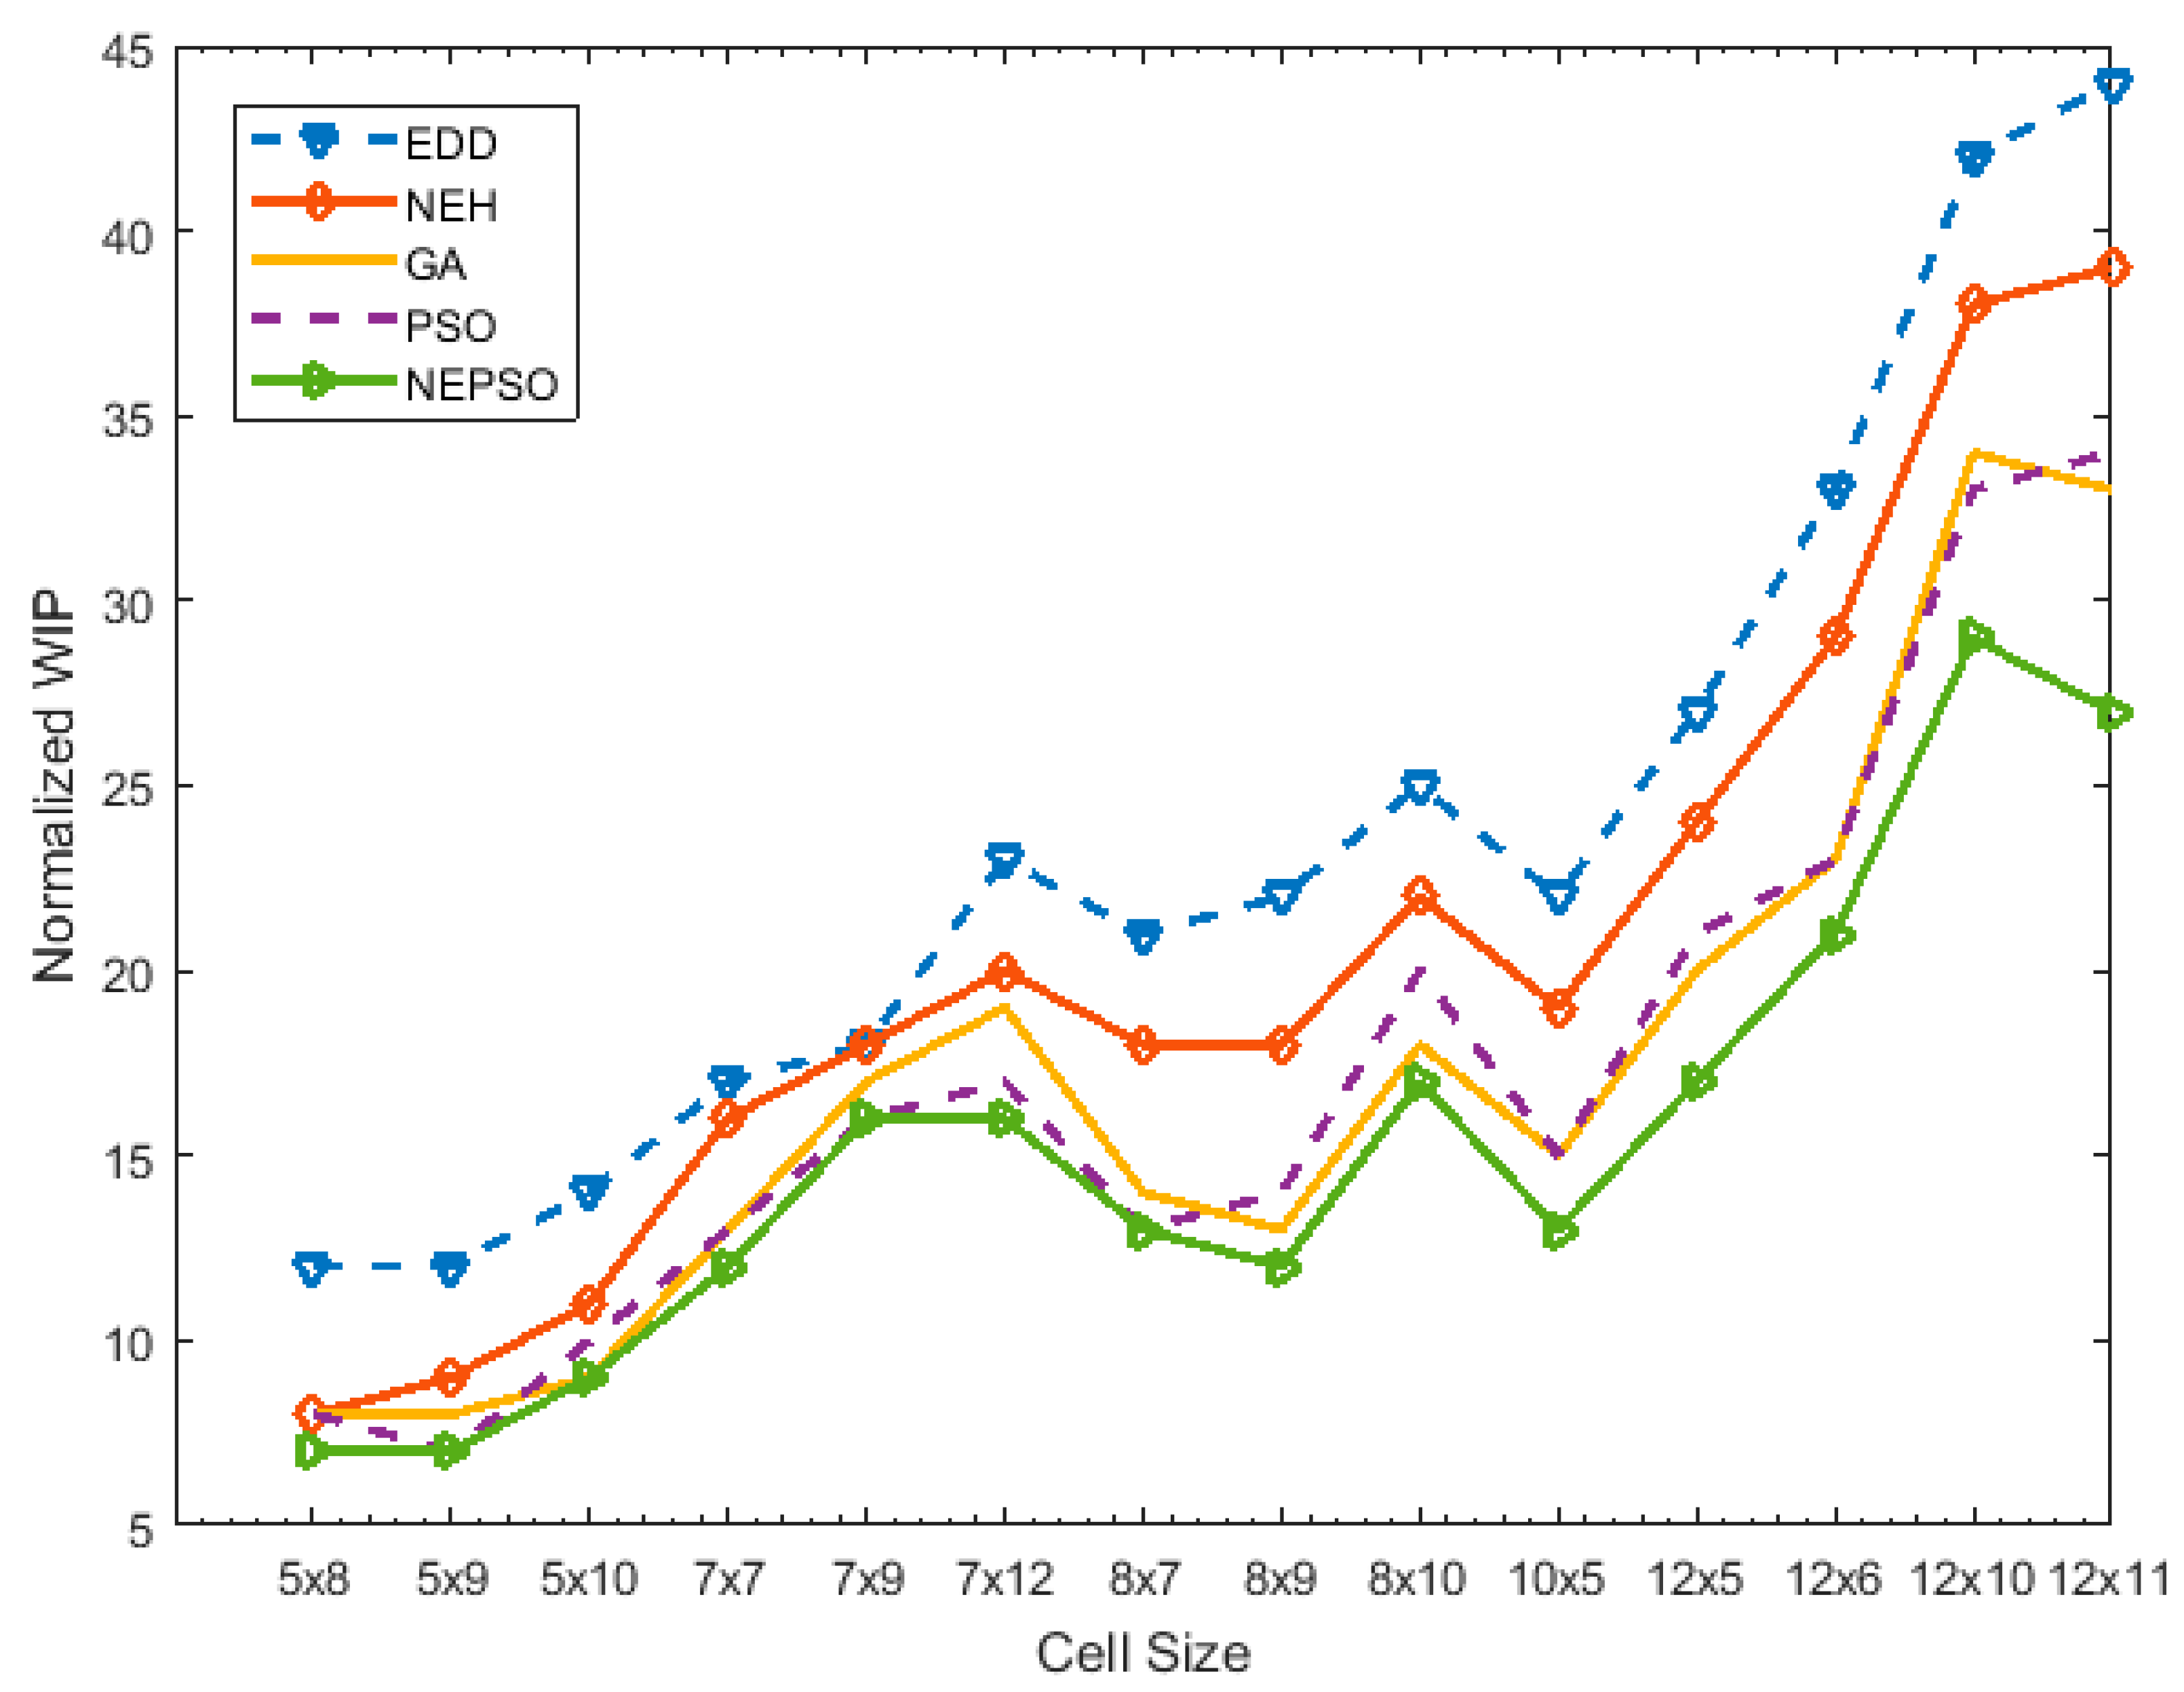
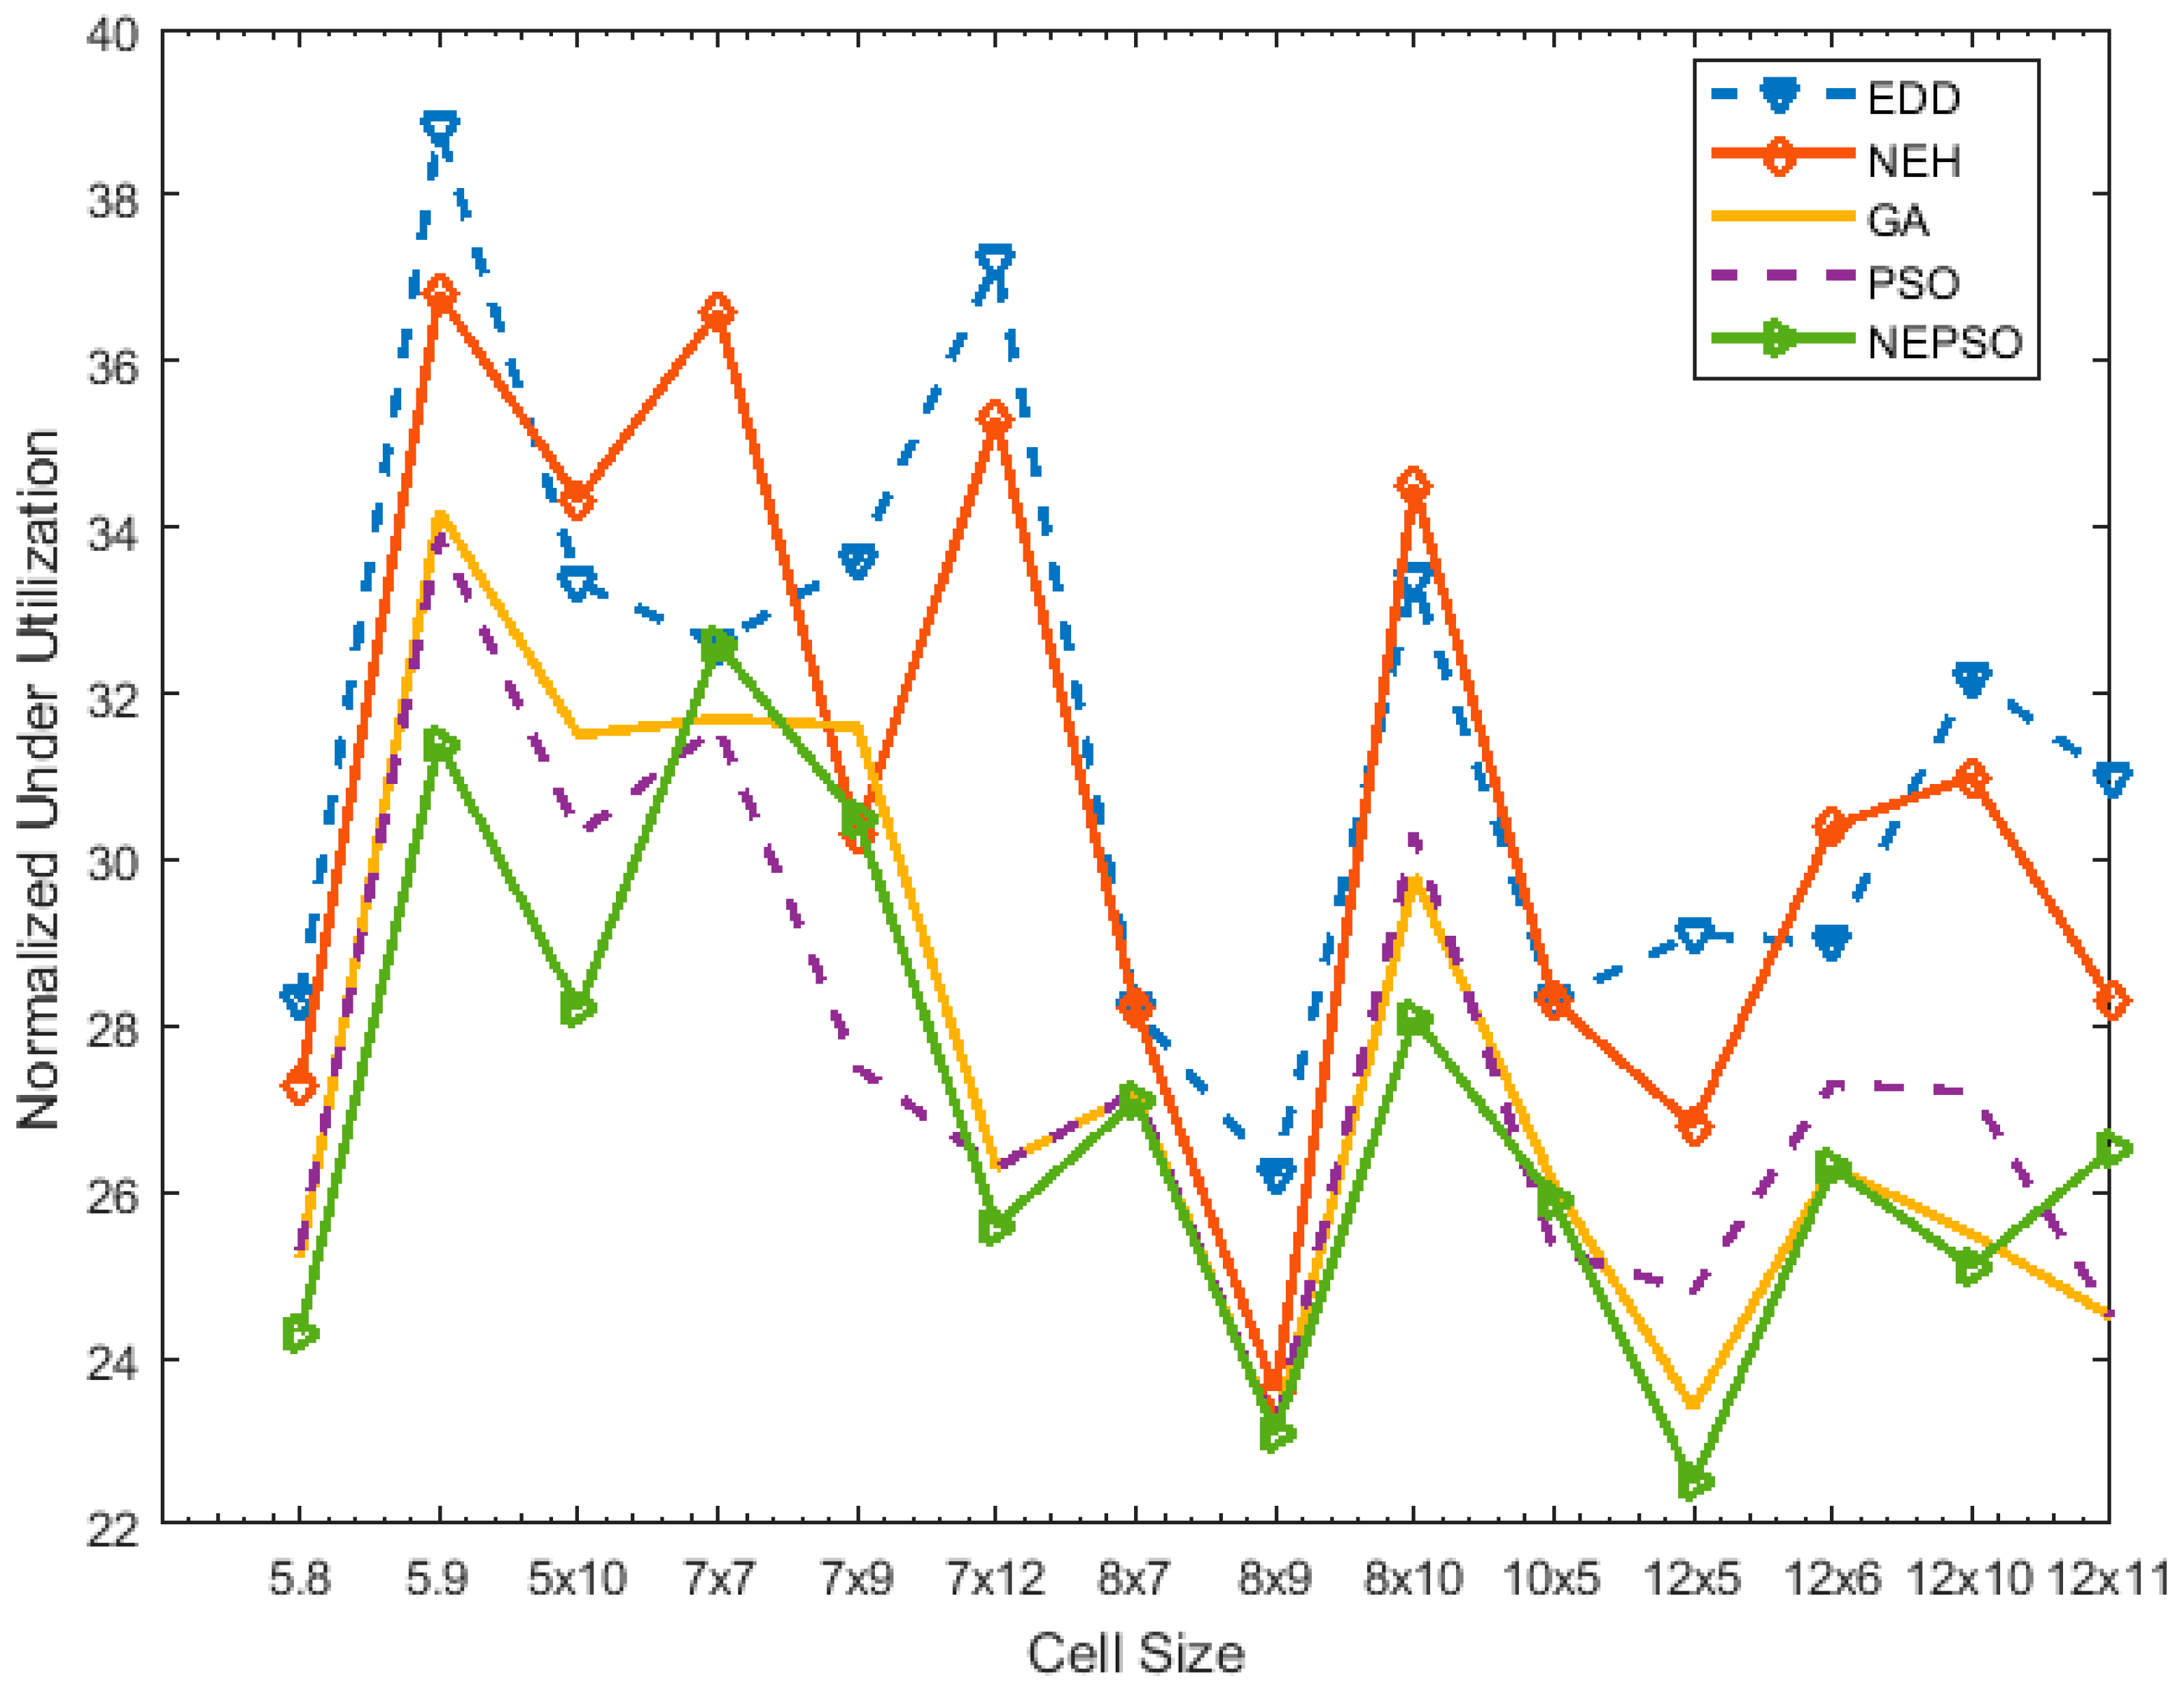
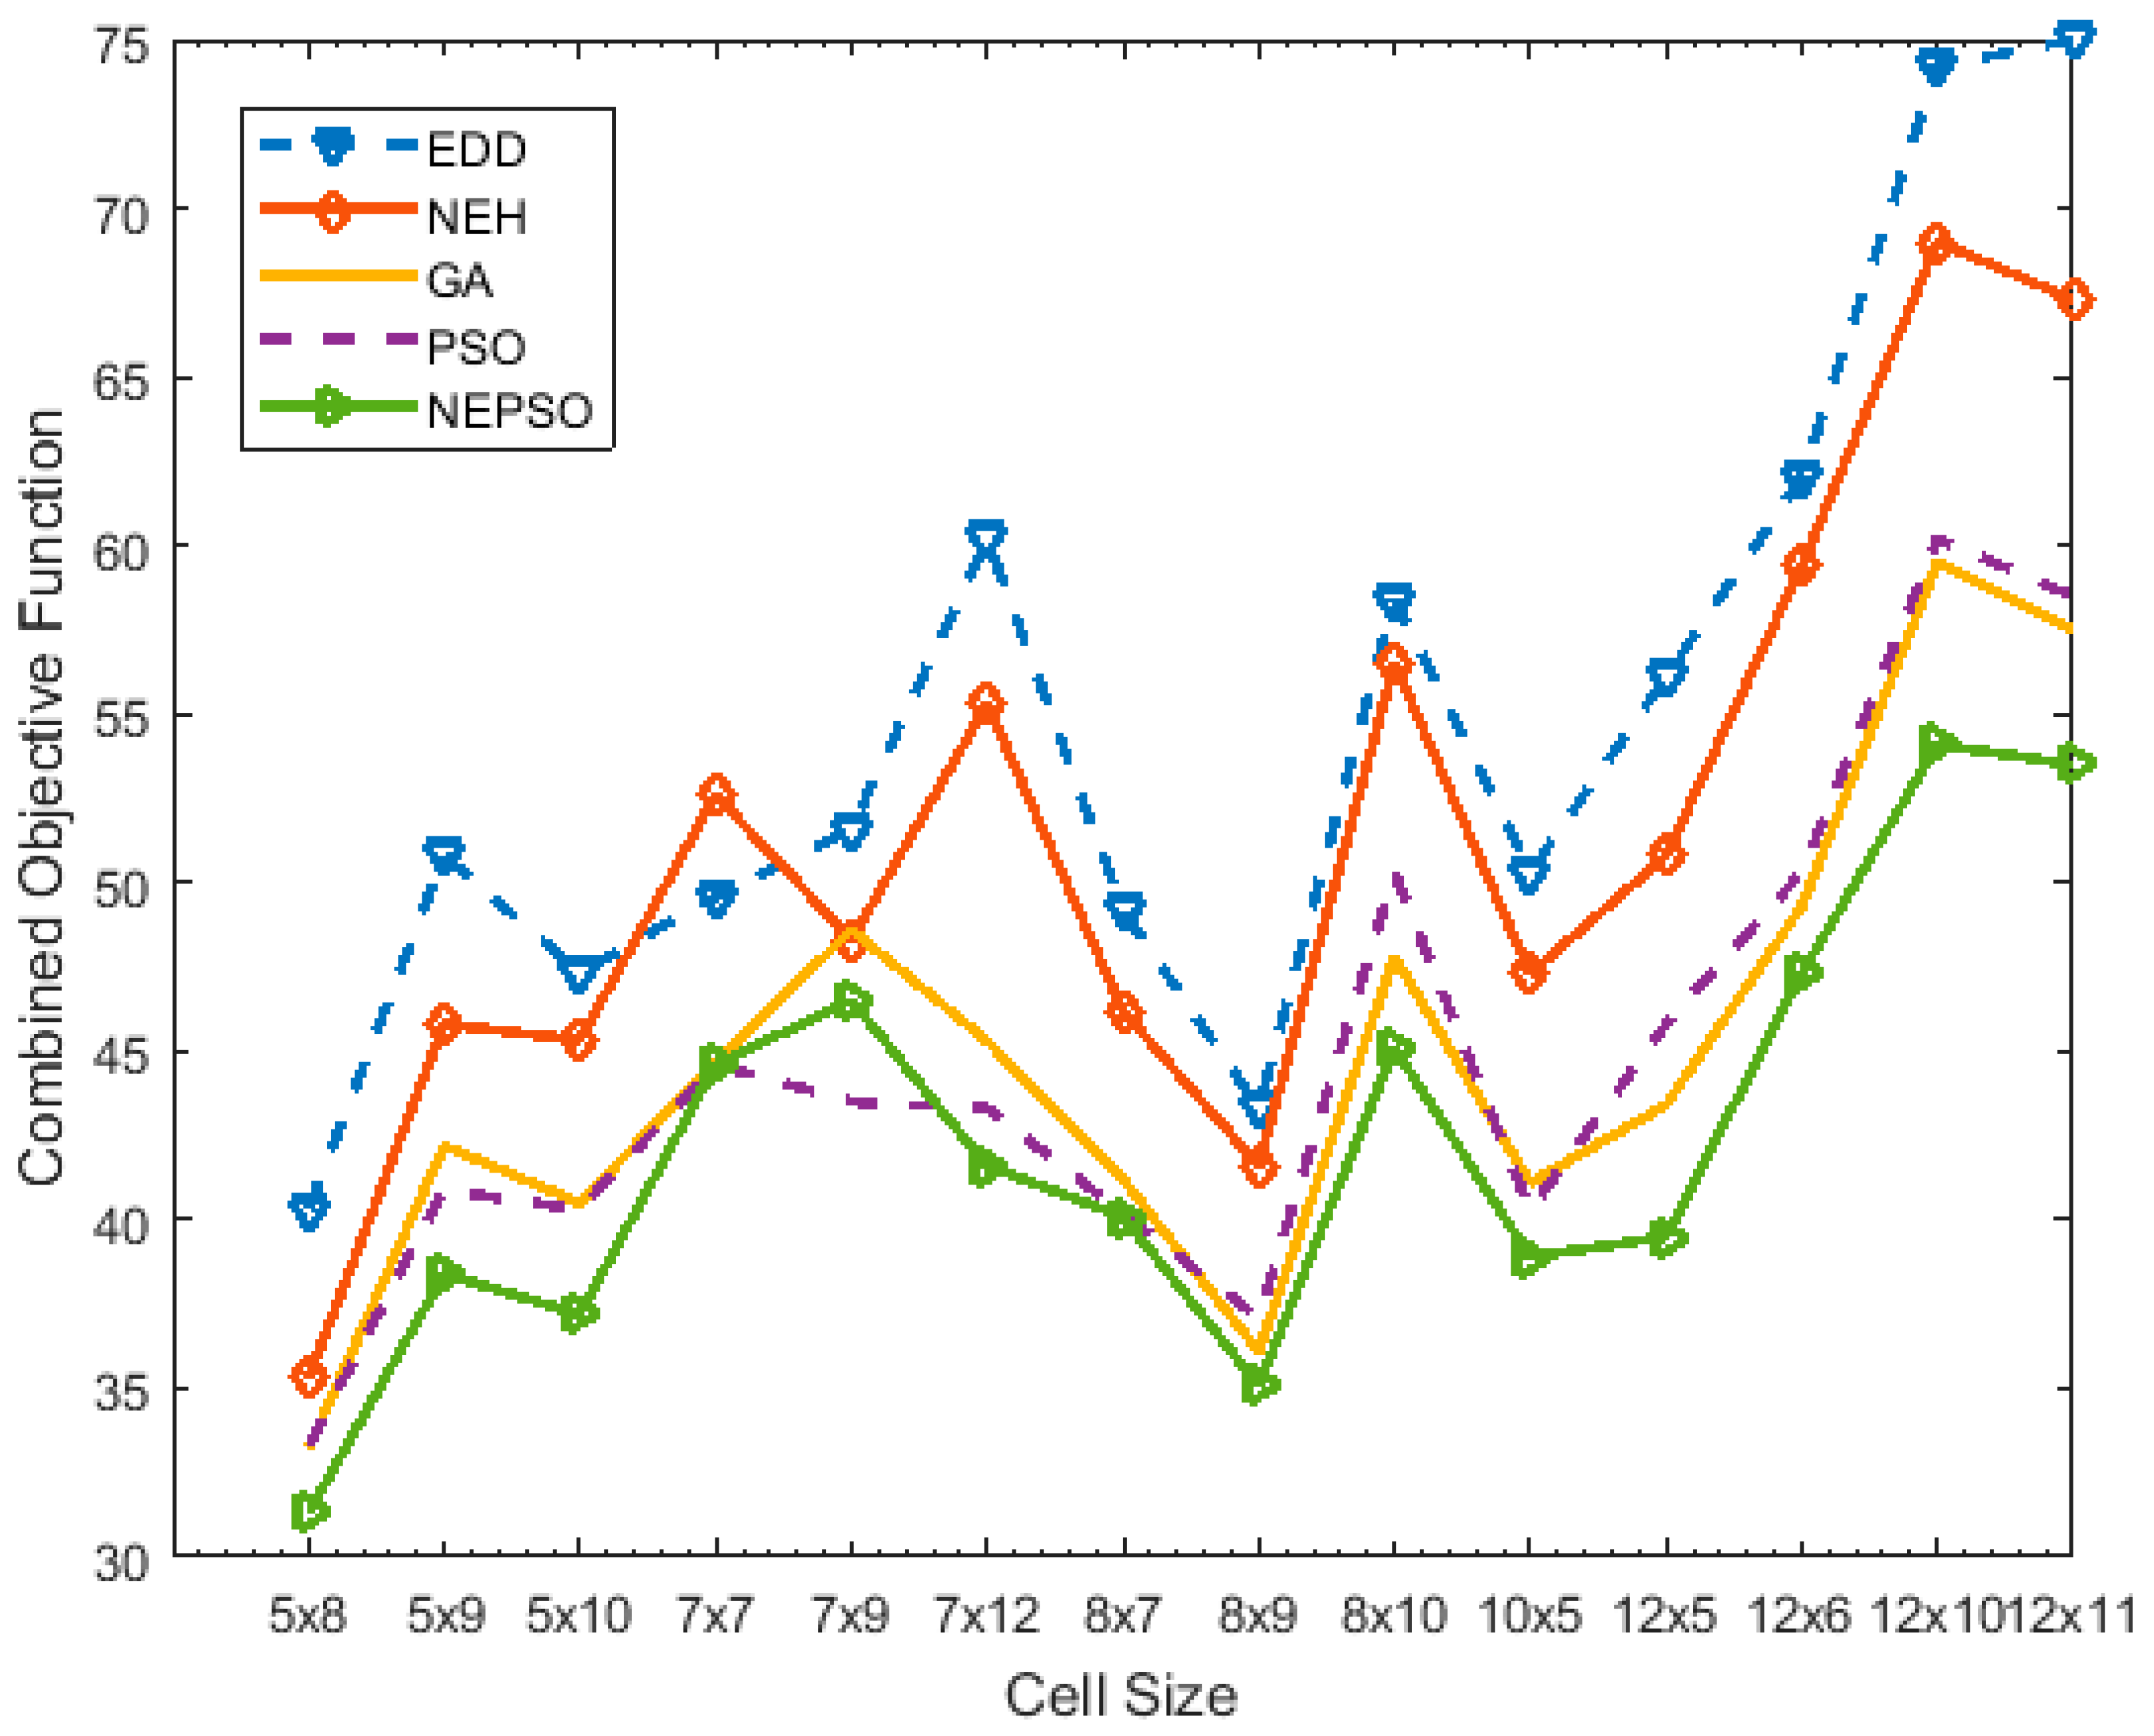
The results for the different problem sizes are shown in Table 9. The table depicts the result of normalized values of WIP, under-utilization of machines, and combined objective function (C.O.F) values for the algorithms: EDD, PSO, NEH, GA and NEPSO. As mentioned before, the cellular setup was operated under EDD, and a significant amount of improvement was observed after implementation of NEPSO. On average, about 22% improvement was observed cumulatively across all cells. Furthermore, graphs in Figure 9, Figure 10 and Figure 11 illustrate the effectiveness of the proposed algorithm in comparison to others.
For example, for the 5 × 8 problem, the normalized value for WIP for EDD was 12 while for NEH and PSO it was 8 for each. The NEPSO algorithm gave the optimized value with a WIP value of 7. Same is the case with normalized values of machine under-utilization for EDD, NEH, GA, PSO and NEPSO where the values were 28.3, 27.3, 25.2, 25.3 and 24.3, respectively. In most of the cases, the NEPSO gave the optimized results for both WIP and machine under-utilization, but in rare case the PSO algorithm showed improved machine under-utilization and reduced WIP values than the NEPSO algorithm. However, in case of combined (sum) value of machine utilization and WIP, NEPSO presented optimized results. For instance, in the 12x11 problem, the normalized values for machine under-utilization were 31, 28.3, 24.5, 24.5 and 26.5 for EDD, NEH, GA, PSO and NEPSO algorithms, respectively. It predicted improved machine under-utilization results for the GA and PSO algorithms over NEPSO, however, when combined results of both WIP and machine under-utilization are considered, the value for PSO was 58.5 while for NEPSO was 53.5. In the current research, 13 out of 14 instances were dominated by the proposed algorithm, indicating significant improvement over the standard PSO.

7. Conclusions

The results show improved objective function values for most of the normalized WIP and machine under-utilization, and for all the C.O.F values with NEPSO. In few cases, the individual results of WIP and machine under-utilization gave an optimized result with the GA and PSO algorithms rather than NEPSO algorithm, but as a whole the combined objective function value for the NEPSO algorithm outclassed the others discussed. In the 12 × 11 problem, the PSO algorithm gave a more optimized result than NEPSO for a specific objective function but overall the combined objective function of the NEPSO algorithm presented an upper hand. The decision is ultimately left with the management and their preference; if they are interested in optimized result of only WIP then for that specific 12 × 11 problem PSO algorithm may be used.

Author Contributions

All the authors contributed equally in this work.

Funding

This research was supported by the Basic Science Research Program through the National Research Foundation of Korea (NRF-2016R1D1A1B03934653). This work was supported by the Research Program through the National Research Foundation of Korea (NRF-2016R1D1A1B03934653, NRF-2019R1A2C1005920).

Conflicts of Interest

The authors declare no conflict of interest.

References

  1. Baker, K.R. Scheduling a Full-Time Workforce to Meet Cyclic Staffing Requirements. Manag. Sci. 1974, 20, 1561–1568. [Google Scholar] [CrossRef]
  2. Baker, K.R. Introduction to Sequencing and Scheduling; John Wiley & Sons: Hoboken, NJ, USA, 1974. [Google Scholar]
  3. Conway, R.W.; Maxwell, W.L.; Miller, L.W. Theory of Scheduling; Courier Corporation: North Chelmsford, MA, USA, 2012. [Google Scholar]
  4. Swamidass, P.M. Encyclopedia of Production and Manufacturing Management; Springer Science & Business Media: Berlin, Germany, 2000. [Google Scholar]
  5. Ham, I.; Hitomi, K.; Yoshida, T. Production scheduling for group technology. In Group Technology; Springer: Berlin, Germany, 1985; pp. 93–107. [Google Scholar]
  6. Sridhar, J.; Rajendran, C. Scheduling in flowshop and cellular manufacturing systems with multiple objectives—A genetic algorithmic approach. Prod. Plan. Control 1996, 7, 374–382. [Google Scholar] [CrossRef]
  7. Wemmerlov, U.; Johnson, D.J. Cellular manufacturing at 46 user plants: implementation experiences and performance improvements. Int. J. Prod. Res. 1997, 35, 29–49. [Google Scholar] [CrossRef]
  8. Shafer, S.; Charnes, J. A simulation analyses of factors influencing loading practices in cellular manufacturing. Int. J. Prod. Res. 1995, 33, 279–290. [Google Scholar] [CrossRef]
  9. Suer, G.A.; Saiz, M.; Gonzalez, W. Evaluation of manufacturing cell loading rules for independent cells. Int. J. Prod. Res. 1999, 37, 3445–3468. [Google Scholar] [CrossRef]
  10. Logendran, R.; Nudtasomboon, N. Minimizing the makespan of a group scheduling problem: a new heuristic. Int. J. Prod. Econ. 1991, 22, 217–230. [Google Scholar] [CrossRef]
  11. Akturk, M.S.; Wilson, G.R. A hierarchical model for the cell loading problem of cellular manufacturing systems. Int. J. Prod. Res. 1998, 36, 2005–2023. [Google Scholar] [CrossRef]
  12. Schaller, J. A comparison of heuristics for family and job scheduling in a flow-line manufacturing cell. Int. J. Prod. Res. 2000, 38, 287–308. [Google Scholar] [CrossRef]
  13. Flynn, B. The effects of setup time on output capacity in cellular manufacturing. Int. J. Prod. Res. 1987, 25, 1761–1772. [Google Scholar]
  14. Eberhart, R.C.; Shi, Y. Guest Editorial Special Issue on Particle Swarm Optimization. IEEE Trans. Evolut. Comput. 2004, 8, 201–203. [Google Scholar] [CrossRef]
  15. Hassan, R.; Cohanim, B.; De Weck, O.; Venter, G. A Comparison of Particle Swarm Optimization and the Genetic Algorithm. In Proceedings of the 46th AIAA/ASME/ASCE/AHS/ASC Structures, Structural Dynamics and Materials Conference, Austin, TX, USA, 21 April 2005. [Google Scholar]
  16. Das, S.; Abraham, A.; Konar, A. Particle Swarm Optimization and Differential Evolution Algorithms: Technical Analysis, Applications and Hybridization Perspectives. In Advances of Computational Intelligence in Industrial Systems; Liu, Y., Sun, A., Loh, H.T., Lu, W.F., Lim, E.-P., Eds.; Springer: Berlin, Germany, 2008; pp. 1–38. [Google Scholar] [Green Version]
  17. Reyes-Sierra, M.; Coello, C.C. Multi-objective particle swarm optimizers: A survey of the state-of-the-art. Int. J. Comput. Intell. Res. 2006, 2, 287–308. [Google Scholar]
  18. Tasgetiren, M.F.; Liang, Y.C.; Sevkli, M.; Gencyilmaz, G. A particle swarm optimization algorithm for makespan and total flowtime minimization in the permutation flowshop sequencing problem. Eur. J. Oper. Res. 2007, 177, 1930–1947. [Google Scholar] [CrossRef]
  19. Tasgetiren, M.F.; Sevkli, M.; Liang, Y.C.; Yenisey, M.M. A particle swarm optimization and differential evolution algorithms for job shop scheduling problem. J. Oper. Res. 2006, 3, 120–135. [Google Scholar]
  20. Xia, W.; Wu, Z. An effective hybrid optimization approach for multi-objective flexible job-shop scheduling problems. Comput. Ind. Eng. 2005, 48, 409–425. [Google Scholar] [CrossRef]
  21. Xia, W.J.; Wu, Z.M. A hybrid particle swarm optimization approach for the job-shop scheduling problem. Int. J. Adv. Manuf. Technol. 2006, 29, 360–366. [Google Scholar] [CrossRef]
  22. Liu, H.; Abraham, A.; Choi, O.; Moon, S.H. Variable Neighborhood Particle Swarm Optimization for Multi-objective Flexible Job-Shop Scheduling Problems. In Simulated Evolution and Learning; Wang, T.D., Li, X., Chen, S.H., Wang, X., Abbass, H., Iba, H., Chen, G., Yao, X., Eds.; Springer: Berlin, Germany, 2006; pp. 197–204. [Google Scholar]
  23. Jia, Z.; Chen, H.; Sun, Y. Hybrid particle swarm optimization for flexible job-shop scheduling. J. Syst. Simul. 2007, 19, 4743–4747. [Google Scholar]
  24. Jerald, J.; Asokan, P.; Prabaharan, G.; Saravanan, R. Scheduling optimisation of flexible manufacturing systems using particle swarm optimisation algorithm. Int. J. Adv. Manuf. Technol. 2005, 25, 964–971. [Google Scholar] [CrossRef]
  25. Tavakkoli-Moghaddam, R.; Jafari-Zarandini, Y.; Gholipour-Kanani, Y. Multi-objective Particle Swarm Optimization for Sequencing and Scheduling a Cellular Manufacturing System. In Advanced Intelligent Computing Theories and Applications; Huang, D.-S., McGinnity, M., Heutte, L., Zhang, X.-P., Eds.; Springer: Berlin, Germany, 2010; pp. 69–75. [Google Scholar]
  26. Yang, J.; Posner, M.E. Flow shops with WIP and value added costs. J. Schedul. 2010, 13, 3–16. [Google Scholar] [CrossRef]
  27. Massim, Y.; Yalaoui, F.; Amodeo, L.; Châtelet, É.; Zeblah, A. Efficient combined immune-decomposition algorithm for optimal buffer allocation in production lines for throughput and profit maximization. Comput. Oper. Res. 2010, 37, 611–620. [Google Scholar] [CrossRef]
  28. Conway, R.; Maxwell, W.; McClain, J.O.; Thomas, L.J. The Role of Work-in-Process Inventory in Serial Production Lines. Oper. Res. 1988, 36, 229–241. [Google Scholar] [CrossRef]
  29. Yang, J. 7. Flow-shop Scheduling Problem with Weighted Work-In-Process. Available online: http://www.dbpia.co.kr/journal/articleDetail?nodeId=NODE00596702&language=ko_KR (accessed on 19 April 2019).
  30. Zhang, Q.; Manier, H.; Manier, M.-A. A modified shifting bottleneck heuristic and disjunctive graph for job shop scheduling problems with transportation constraints. Int. J. Prod. Res. 2014, 52, 985–1002. [Google Scholar] [CrossRef]
  31. Tavakkoli-Moghaddam, R.; Ranjbar-Bourani, M.; Amin, G.R.; Siadat, A. A cell formation problem considering machine utilization and alternative process routes by scatter search. J. Intell. Manuf. 2012, 23, 1127–1139. [Google Scholar] [CrossRef]
  32. Mahdavi, I.; Javadi, B.; Fallah-Alipour, K.; Slomp, J. Designing a new mathematical model for cellular manufacturing system based on cell utilization. Appl. Math. Comput. 2007, 190, 662–670. [Google Scholar] [CrossRef]
  33. Li, W.D.; McMahon, C.A. A simulated annealing-based optimization approach for integrated process planning and scheduling. Int. J. Comput. Integrated Manuf. 2007, 20, 80–95. [Google Scholar] [CrossRef] [Green Version]
  34. Campos, J.; Silva, M. Structural techniques and performance bounds of stochastic Petri net models. In Advances in Petri Nets; Springer: Berlin, HDB, Germany, 1992; pp. 352–391. [Google Scholar]
  35. Alanazi, H.O.; Abdullah, A.H.; Larbani, M. Dynamic weighted sum multi-criteria decision making: Mathematical Model. Int. J. Math. Statistics Invent. 2013, 1, 16–18. [Google Scholar]
  36. Chen, C.H.; Liu, T.K.; Chou, J.H. A novel crowding genetic algorithm and its applications to manufacturing robots. IEEE Trans. Ind. Inf. 2014, 10, 1705–1716. [Google Scholar] [CrossRef]
  37. Gong, X.; Plets, D.; Tanghe, E.; De Pessemier, T.; Martens, L.; Joseph, W. An efficient genetic algorithm for large-scale planning of dense and robust industrial wireless networks. Expert Syst. Appl. 2018, 96, 311–329. [Google Scholar] [CrossRef] [Green Version]
  38. Oĝuz, C.; Ercan, M.F. A genetic algorithm for hybrid flow-shop scheduling with multiprocessor tasks. J. Sched. 2005, 8, 323–351. [Google Scholar] [CrossRef]
  39. Ruiz, R.; Maroto, C. A genetic algorithm for hybrid flowshops with sequence dependent setup times and machine eligibility. Eur. J. Oper. Res. 2006, 169, 781–800. [Google Scholar] [CrossRef]
  40. Man, K.F.; Tang, K.S.; Kwong, S.; Ip, W.H. Genetic algorithm to production planning and scheduling problems for manufacturing systems. Prod. Plan. Control 2000, 11, 443–458. [Google Scholar] [CrossRef]
  41. Zhang, Y.; Wang, S.; Ji, G. A comprehensive survey on particle swarm optimization algorithm and its applications. Math. Probl. Eng. 2015, 15, 1–38. [Google Scholar] [CrossRef]
  42. Tasgetiren, M.F.; Sevkli, M.; Liang, Y.C.; Gencyilmaz, G. Particle swarm optimization algorithm for single machine total weighted tardiness problem. In Proceedings of the 2004 Congress on Evolutionary Computation, Portland, OR, USA, 19–23 June 2004. [Google Scholar]
  43. Anghinolfi, D.; Paolucci, M. A new discrete particle swarm optimization approach for the single-machine total weighted tardiness scheduling problem with sequence-dependent setup times. Eur. J. Oper. Res. 2009, 193, 73–85. [Google Scholar] [CrossRef] [Green Version]
  44. Chen, W.N.; Zhang, J.; Chung, H.S.; Zhong, W.L.; Wu, W.G.; Shi, Y.H. A novel set-based particle swarm optimization method for discrete optimization problems. IEEE Trans. Evolut. Comput. 2010, 14, 278–300. [Google Scholar] [CrossRef]
  45. Cui, W.W.; Lu, Z.; Zhou, B.; Li, C.; Han, X. A hybrid genetic algorithm for non-permutation flow shop scheduling problems with unavailability constraints. Int. J. Comput. Integrated Manuf. 2016, 29, 944–961. [Google Scholar] [CrossRef]
Figure 1. Illustration of flow line cell.
Symmetry 11 00729 g001
Figure 2. Layout of Algorithm.
Symmetry 11 00729 g002
Figure 3. Detailed layout of hybrid particle swarm optimization algorithm with NEH (NEPSO).
Symmetry 11 00729 g003
Figure 4. Flowchart of Standard PSO.
Symmetry 11 00729 g004
Figure 5. Proposed algorithm.
Symmetry 11 00729 g005
Figure 6. Flow line cell.
Symmetry 11 00729 g006
Figure 7. Convergence Behavior.
Symmetry 11 00729 g007
Figure 8. Minimized function values in 50 iterations.
Symmetry 11 00729 g008
Figure 9. Results of algorithms to normalized work in process (WIP) in cell sizes.
Symmetry 11 00729 g009
Figure 10. Result of algorithms to normalized under-utilization in cell sizes.
Symmetry 11 00729 g010
Figure 11. Result of algorithms to combined objective function values in cell sizes.
Symmetry 11 00729 g011
Table 1. Solution Representation.
Dimension
J
PVVelocityAscending Order of PVSequence
x i j 0 v i j 0
15.1601.0731.4766
29.000−0.2882.8105
35.449−0.3485.1601
48.9163.1845.4493
52.810−3.2148.9164
61.4763.9189.0002
711.8440.3719.1568
89.1562.01611.8447
Table 2. Local search applied to sequence before repair.
Dimension
J
PVSequence x i j k s i j k
x i j k s i j k
15.1665.166
29595
35.4415.443
48.9138.911
52.8142.814
61.4721.472
711.84811.848
89.1579.157
Table 3. Local search applied to sequence after repair.
Dimension
J
PVSequence x i j k s i j k
x i j k s i j k
15.1665.446
29595
35.4415.163
48.9138.911
52.8142.814
61.4721.472
711.84811.848
89.1579.157
Table 4. Processing times/setup times/transportation times (min).
Machines. PartsM1M2M3M4M5M6M7M8M9M10
P12.3/1/02.5/0.15/0.150/0/0.252/0.65/0.150/0/0.150/0/0.22.8/0.25/0.251.75/0.5/0.150/0/0.20/0/0.25
P22.5/0.25/01.6/0.3/0.150/0/0.23.3/0.25/0.251.25/0.75/0.150/0/0.250/0/0.20/0/0.153.25/0.33/0.30/0/0.2
P30/0/02.31/0.25/0.22.4/0.2/0.21.5/0.5/0.251.55/0.25/0.23.1/0.45/0.30/0/0.251.5/1/0.20/0/0.152.35/0.15/0.25
P43.2/1.25/00/0/0.22.3/0.26/0.250/0/0.154/0.55/0.150/0/0.22.25/0.35/0.252.75/0.85/0.151.6/1.11/0.21.85/0.45/0.3
P51.2/0.35/02.25/0.35/0.22.5/0.15/0.152/0.75/0.250/0/0.23.25/0.75/0.251.75/0.75/0.30/0/0.20/0/0.23.33/0.75/0.3
P62.25/0.45/01.51/0.5/0.151.6/1/0.22.75/0.35/0.152.85/0.35/0.350/0/0.151.25/0.56/0.23.5/1/0.32/1.52/0.150/0/0.15
P71.35/1.5/00/0/0.22.33/0.55/0.150/0/0.20/0/0.22.45/0.35/0.151.85/0.85/0.21.75/0.65/0.30/0/0.22/1.5/0.15
P81.9/0.5/01.35/0.52/0.150/0/0.22.6/0.25/0.251.85/0.26/0.150/0/0.151.45/0.15/0.250/0/0.152.33/0.45/0.20/0/0.2
P91.75/0.4/00/0/0.21.3/0.75/0.251.85/0.46/0.150/0/0.21.75/0.5/0.33.5/0.45/0.21.5/0.75/0.252.25/0.5/0.350/0/0.2
P101.5/0.75/00/0/0.152/1.5/0.30/0/0.252/1.1/0.152.25/0.75/0.150/0/0.22.45/0.35/0.353.5/1.75/0.33.5/0.25
Table 5. Initial seed solution.
ParticlesIteration
187925131046
287625131049
387925131064
425187931046
510462513879
621078496531
721784965310
827108496531
984921076531
1053184962107
Table 6. Parameter settings for NEPSO.
CriteriaValue
Swarm/Population Size10
Inertia Weight1.2
Constriction Factor0.97
Total Number of Generations50 × 3
Table 7. Comparison of proposed NEPSO with CPLEX.
Problem Set IterationsILOG IB CPLEXTime (sec)Proposed NEPSOTime (sec)
5 × 102040.931.23237.212.133
7 × 72048.829.22044.611.544
8 × 102052.352.64445.115.330
12 × 52046.748.32139.514.221
Table 8. Percentage gap between NEPSO and CPLEX.
Problem Set Iterations% Gap
ILOG IB CPLEX Time (sec)Proposed MPSOTime (sec)
5 × 10200.0910.6120.000.00
7 × 7200.860.6050.000.00
8 × 10200.160.7090.000.00
12 × 5200.1540.7060.000.00
Table 9. Results comparison of objectives function values across various cell sizes.
S.No.Cell SizeEDDNEHGAPSONEPSO
Normalized WIPNormalized UUC.O.FNormalized WIPNormalized UUC.O.FNormalized WIPNormalized UUC.O.FNormalized WIPNormalized UUC.O.FNormalized WIPNormalized UUC.O.F% Improvement
15 × 81228.340.3827.335.3825.233.2825.333.3724.331.322.3
25 × 91238.850.8936.845.8834.242.2733.940.9731.438.424.4
35 × 101433.3347.331134.3345.33931.540.51030.340.3928.237.221.4
47 × 71732.649.61636.652.61331.744.71331.644.61232.644.610.1
57 × 91833.651.61830.348.31731.648.61627.543.51630.546.59.9
67 × 122337.260.22035.355.31926.345.31726.343.31625.641.630.9
78 × 72128.249.21828.246.21427.241.21327.240.21327.140.118.5
88 × 92221.343.31823.641.61323.136.11423.137.11223.135.118.9
98 × 102533.458.42234.556.51829.847.82030.350.31728.145.122.8
1010 × 52228.350.31928.347.31526.141.11525.340.31325.938.922.7
1112 × 52729.156.12426.850.82023.443.42124.845.81722.539.529.6
1212 × 63329622930.459.42326.349.32327.350.32126.347.323.7
1312 × 104232.274.23831693425.559.53327.260.22925.154.127.1
1412 × 114431753928.367.33324.557.53424.558.52726.553.528.7