1. Introduction
The 3D model retrieval based on sketch pays attention to the retrieval of related 3D patterns by adopting the sketches to be the input [
1,
2,
3]. Due to their convenience and intuitiveness, it has been widely applied in computer vision, information retrieval as well as computer graphics [
4]. The 3D model has two types, one is axial symmetry and the other is non-axial symmetry. Even if the model does not belong to the parameter shape family, it will indicate symmetry. Significant differences in dimensions exist between 3D patterns and 2D sketches and the similarities cannot be directly calculated. Especially for sketches and 3D models with asymmetrical characteristics, retrieval is more difficult. For the purpose of handling such issues, a strategy aims at inferring the 3D shape expressed by a 2D sketch and then match the 3D shape in the database but inferring the 3D shape from the sketch itself is a very big challenge. Another available method is to convert the 2D-3D matching problem into a 2D-2D matching problem. The sketch may match the 3D pattern if it will match a 2D view that is projected by the 3D pattern.
The stage-wise method appears practicality. However, it causes some puzzling problems as well. To begin with, the accuracy of the feature representations is rather significant in the last algorithm. It is generally hand-crafting the right features (e.g., Gabor local line-based feature (GALIF) [
5,
6], histogram of oriented gradient (HOG) [
7], as well as dense scale invariant feature transform (SIFT) algorithm) at this stage. However, a manually selected feature is a very laborious, heuristic (need specialized knowledge) method. Moreover, sketches have often been considered to be rather simple with just some lines. Conversely, simplicity also makes sketches include rather limited data. Secondly, the 3D shapes visually look similar to the query sketches just from several perspectives. In general, it is rather difficult to discover the “best views” for projecting 3D shapes, which causes the 3D shapes and sketches to be similar visually, and the uncertainty of the viewpoint causes it to be suspicious to match samples from two diversified domains without studying their metrics. The third challenge for the retrieval of 3D shape based on a sketch is the discrepancies of the domain between the two modalities. The 3D shape and a sketch are from two diversified modalities that have a big gap. The characteristics that are extracted from the two modalities follow rather diversified allocations, which cause it to be rather hard to retrieve 3D shapes directly from query sketches.
For the purpose of solving these issues, Wang et al. [
8] put forward a predefined method for the entire dataset and used two Siamese CNNs to train it. However, the strategy was on the basis of a great assumption that every 3D pattern is reserved upright, which causes it to be rather easy to select a 3D pattern’s project view. It is almost very hard to guarantee the assumption when applying it into the actual life. If this assumption doesn’t exist, it will be rather difficult to select the most outstanding projection view. The outcomes of the projection can be very changeable with changes of view. In addition, there is significant overfitting in training, which means that the learning hypothesis may fit the training set too well but fail to predict on the test dataset.
This paper puts forward a new feature representation strategy for avoiding selecting the “best” projection view and adapting the maxout network to extend the Siamese network architecture for mitigating the discrepancies between 3D shape and sketch domains. We checked the proposed strategy on SHREC (Shape Retrieval Contest Datasets) 2013 as well as 2014 datasets, which are two big scale benchmarks. The outcomes show that the strategy put forward in this paper may outperform the state-of-the-art strategies accurately on the SHREC 2013 and 2014 benchmarks.
The main contribution of our work includes:
We propose to study the feature representations for 3D patterns and sketches, which ignore the predicament of the most outstanding view selection;
Two original Siamese convolutional neural networks were used for dealing with the overfitting issue and to explore similar points successfully in and across the domains.
Experiments using two large data sets show that the strategy proposed is greatly better compared with several prior art strategies.
2. Related Work
Shape retrieval based on a sketch has attracted a lot of researchers’ interest and a lot of attention over the years. Existing solutions mainly differ in the feature descriptors used to represent query/model sketches and can be largely categorized into two groups: local and international descriptors. The global descriptor is a generalization that describes an overall object. It includes shape descriptors, contour representations and texture features. The local descriptor refers to the abstraction of key parts of the object. The combination of global and local descriptors can reduce the side effects of computational overhead and improve the accuracy of recognition. In 2003, Funkhouser et al. [
9] improved the Princeton shape search engine that the feature descriptor represents both model sketches and queries internationally. However, global descriptors are sensitive to intra-class variations and shape deformation, especially in handling incomplete query sketches. Recently, local features of the three-dimensional model have been indicated by the word bag model for shape retrieval [
10,
11]. For example, Saavedra et al. [
12] represent a sketch by the HOG feature of its “key shape”, which is an approximation of the contour with straight lines. Eitz et al. [
13] put forward BoF-GALIF that dense sampling Gabor local line-based feature and adopt the bag of feature framework, which has been demonstrated to be stronger against variations within the sketch as well as pattern rendering images. The Gabor local line-based feature is derived from the Curvelet basis. Under the condition of the representation of features, the transformation’s demands have been relaxed as a foundation. Therefore, filters can be used to approximate ideas from Curvelet transforms that only respond to image factors with an offered direction as well as frequency, resulting in a new feature space transform based on Gabor filters [
14]. Many Gabor characteristics of all the images will be integrated into a feature vector so that all the local features’ position is neglected.
Aside from the algorithms mentioned before, big scope benchmark datasets have been put forward recently for the purpose of assessing the performance of various strategies, like SHREC 2014 [
15] as well as SHREC 2013 [
16]. Sketches of the two datasets are from a big sketch collection recently [
17]. SHREC 2013’s 3D shapes have mostly been gathered from the Princeton shape benchmark [
18], while SHREC 2014’s shapes are from diversified sources, like References [
19] and [
20]. Various comparison outcomes have been reported for the two datasets. In terms of SHREC 2013, the most outstanding outcome reported within Reference [
15] comes from shape context matching (SBR-VC) as well as view clustering. In terms of SHREC 2014, the most outstanding outcome reported within Reference [
16] comes from HOG’s overlapped pyramid and the similarity limited manifold ranking, by Tatsuma et al.
In recent days, deep learning has been rather successful on a lot of computer vision tasks. This paper considers a strategy based on convolutional neural networks (CNN), which is considered to be a deep learning strategy and a kind of feedforward neural network that contains convolutional computation and has a deep structure. It is constructed by the imitation of the biological visual perception mechanism. The inter-layer connection’s sparseness, as well as the convolution kernel parameter sharing within the hidden layer, enables the convolutional neural network to map characteristics, such as pixels, with a small amount of computation, with a stable effect and characteristics of the data without additional feature engineering requirements. Due to its excellent classification ability, CNN has been used worldwide in the image recognition field [
21]. Particularly, CNN has set records on normative object recognition benchmarks [
22,
23]. In addition, it also has great advantages, because the best feature extraction classification is automatically obtained from the training dataset. Start with LeNet-5 [
24,
25], a CNN particularly possesses normative structure-stacked convolutional layers (randomly followed by contrast max-pooling and normalization) followed by at least a completely linked layer. By comparing with shallow learning frameworks as well as handcrafted characteristics, the CNN architecture requires less knowledge of the domain. It is able to study complex mappings from the original objects to the output with a deep structure. For example, Wang et al. [
8] completely decreased the number of views to just two predefined directions of the entire data set at first, and then two Siamese convolutional neural networks (CNNs) were learnt, once for the views and the other for the sketches. However, this approach is highly hypothetical. In practice, it is very difficult to have a situation that meets this assumption. This is one of the important reasons to limit the development of these methods. Therefore, finding a practical method has become the focus of the current research.
3. Framework
This paper proposes a novel strategy for 3D shape retrieval based on a sketch. Low-level characteristics were first extracted for both the 3D shapes and the sketches. In terms of the sketch, a pre-trained AlexNet was used for extracting the characteristics. In terms of the 3D shape, we also used a pre-trained multi-view CNN to “compile” the 3D pattern’s multiple 2D views into a compact feature vector. We learnt Siamese convolutional neural networks for the purpose of transforming the two domains’ raw characteristics into nonlinear feature space, which mitigates the discrepancy of the domain and maintains the discriminations. The chosen loss function contained two terms. The first term was the discriminative term that was constituted by the pairwise distance in all the domains. The other term was the correlation term that iwas constituted by the pairwise distance across the diversified domains. The discriminative term may minimize the deep learned variations of the characteristics from the same class and maximize their variations from diversified classes in all of the domains. The correlation term aims at alleviating the discrepancy of the domain, which makes the allocations of the two domains as consistent as possible.
Figure 1 presents the proposed strategy’s framework in detail.
The strategy that is put forward mostly contains two steps: (1) Extracting low-level characteristics for both 3D shapes and sketches, the feature vector obtained by multi-view CNN is at least as informative for retrieval compared with the complete collection of the object’s descriptors based on views. (2) Learning extended Siamese-CNNs for the purpose of transforming the two domains’ raw characteristics into nonlinear feature space, which mitigates the discrepancy of the domain, maintains the discriminations, increases the features’ discrimination in all of the domains and mitigates the discrepancy across various domains. The details for all of the steps are presented below.
3.1. Feature Extraction
Characteristics for the shapes as well as the sketches were respectively extracted. 3D shape. First, we chose viewpoints to create a multi-2D view shape representation of the 3D object, and there was no guarantee that the most outstanding views had similar viewpoints with the sketches. The choice of the best view depended on the best viewpoint. Usually, we chose the view or viewpoint to train manually. Thus, the process caused a lot of deviation. For the purpose of dealing with the issue, 20 viewpoints were set and each viewpoint produced four projection views, yielding a total of 80 views instead of selecting the “best” view.
We chose Fisher vectors with multiscale SIFT and CNN activation features as image descriptors for each projected 2D-view. Fisher vectors are commonly local patch descriptors of the image, and multiscale SIFT is an image registration algorithm, which combines the SIFT with a multi-scale wavelet transform. It provides less computational time than the traditional SIFT by decreasing the number of corresponding feature points. We used VLFeat to extract the Fisher vector for each view. The 80-dimensional vector was formed with the PCA. Meanwhile, the VGG-M network was adopted to extract features and train all 2D views (
Figure 1), which were made up of one softmax classification layer, three completely linked layers and five convolutional layers. Four thousand and ninety-six dimensions have been adopted to be the image descriptor.
The multi-view CNN has been a directed acyclic graph with a stochastic gradient descent and back-propagation. The multi-view CNN architecture had a total of 80 CNNs with the same parameters. For each CNN, the seventh fully connected layer (fc7) was used as an aggregated shape descriptor and combined the features of the extracted 80 view descriptors form the view-pooling layer. The maximum feature value of each CNN was taken in the view pool layer as a feature vector trained in the Siamese network.
Sketch
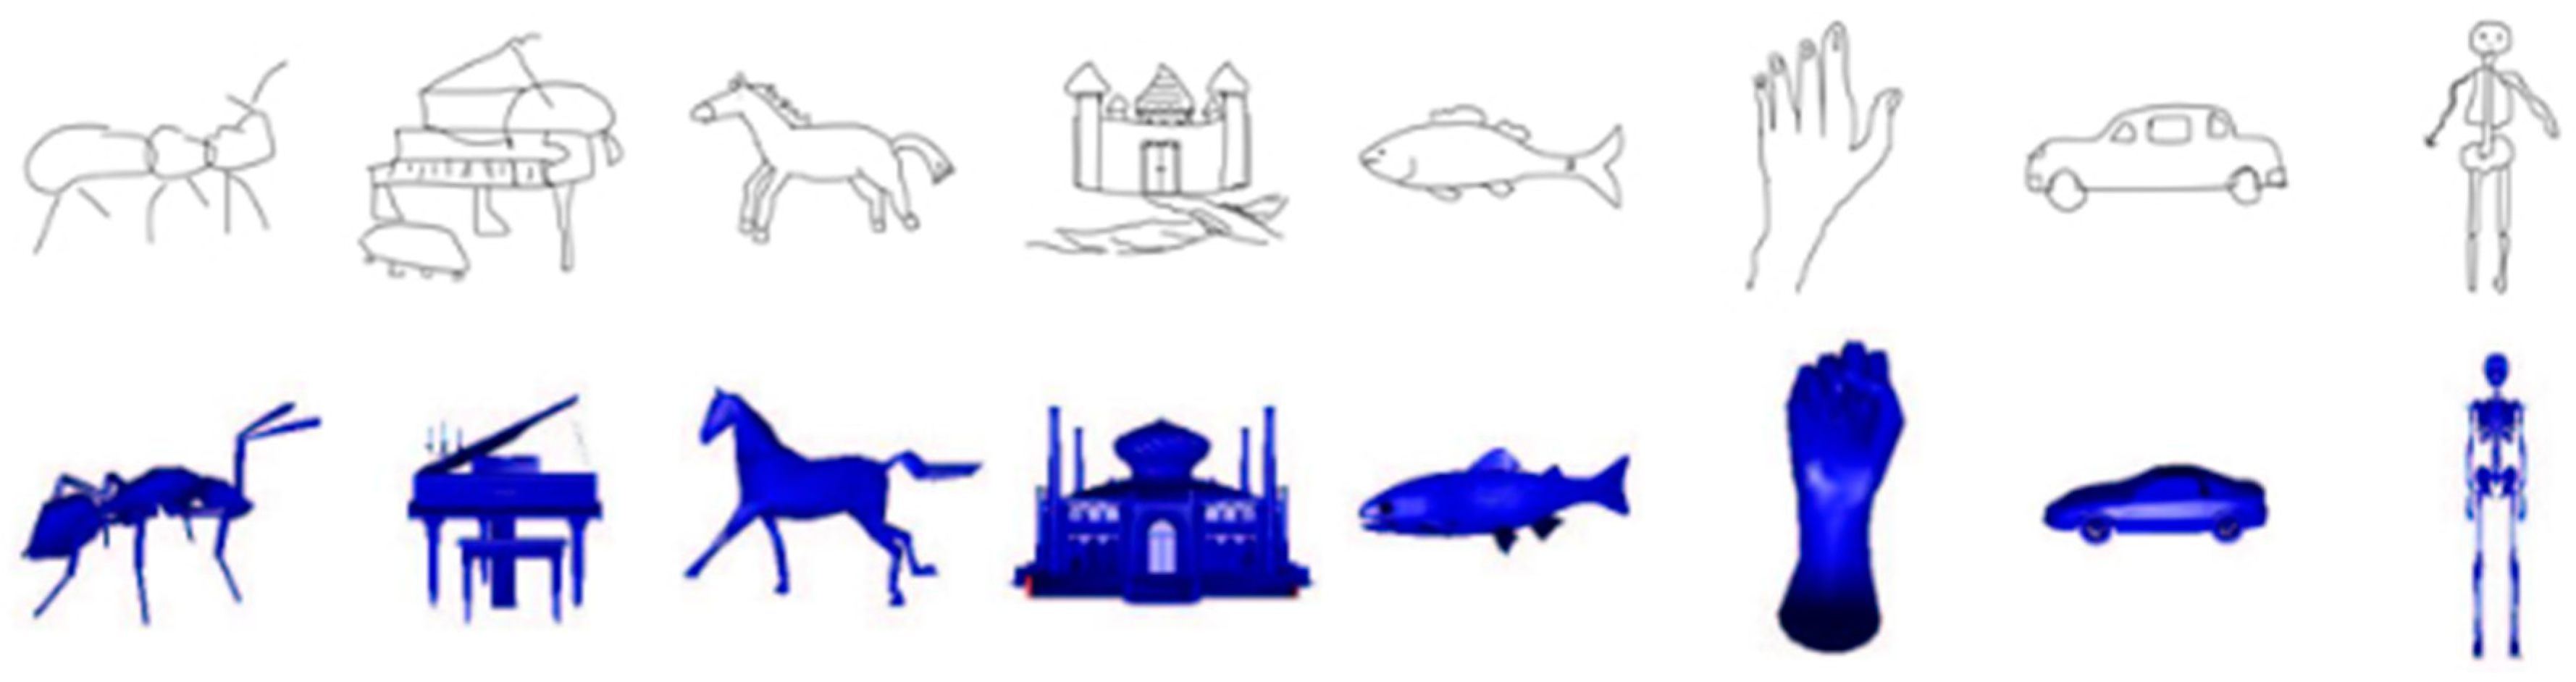
Rendering line drawings, which contain great stylization effects and abstraction is a rather effective theme in psychology, computer vision as well as computer graphics. Inner and outer edges are rather significant in such a rendering procedure. Thus, the descriptors below were adopted including suggestive contours and closed boundaries (
Figure 2) as the 2D line drawing rendering method. Then, inspired by the convolutional neural network’s excellent performance in feature learning, we fine-tuned AlexNet on the sketch dataset and then extracted features of the same size as the 3D model feature vectors in the “fc7” layer.
3.2. Siamese Network Architecture
The Siamese network has been used for recognition and verification, which learns a similarity metric from the data. A Siamese network has been considered to be a special network architecture, which consists of two identical sub-convolutional networks for two different samples; the network aims to make the output vectors dissimilar for the input pairs which were labeled to be dissimilar, and similar if input pairs were labeled to be similar.
The learning of Siamese networks has been on the basis of stochastic gradient descent (SGD); two networks process the sample pairs in each SGD iteration, the gradients and the error were computed and back propagated individually by a loss function on the basis of the two sample sets. The average of each branch was calculated first, and then the whole Siamese network was updated based on the calculation results. In general, it needed a large enough model space to choose an appropriate model to fit the training data (bias decrease). However, it will cause the probability of selected model, that has a good test performance, to reduce (variance increase). Therefore, we should take the bias-variance trade-off. Maxout is a regularized trick of depth networks, which through max (·) adopts the model averaging technique to control the model space and prevent network over-fitting.
In a convolutional network, a maxout layer performs max pooling across multiple affine feature maps. Given an input
x, the function below can compute a maxout hidden layer:
where
is the bias value and
is the weight of the hidden layer unit. In addition, the dimension of
is
, the number of hidden layer units is denoted by
the dimension of x is denoted by
, and
means each hidden layer unit is the max of the
“hidden layer” units. A maxout over linear function forms a piecewise linear function, which is capable of modeling any convex function and learning not just the relationship between hidden units, but also the activation function of each hidden unit. It will be more robust when the training network with maxout and dropout are together.
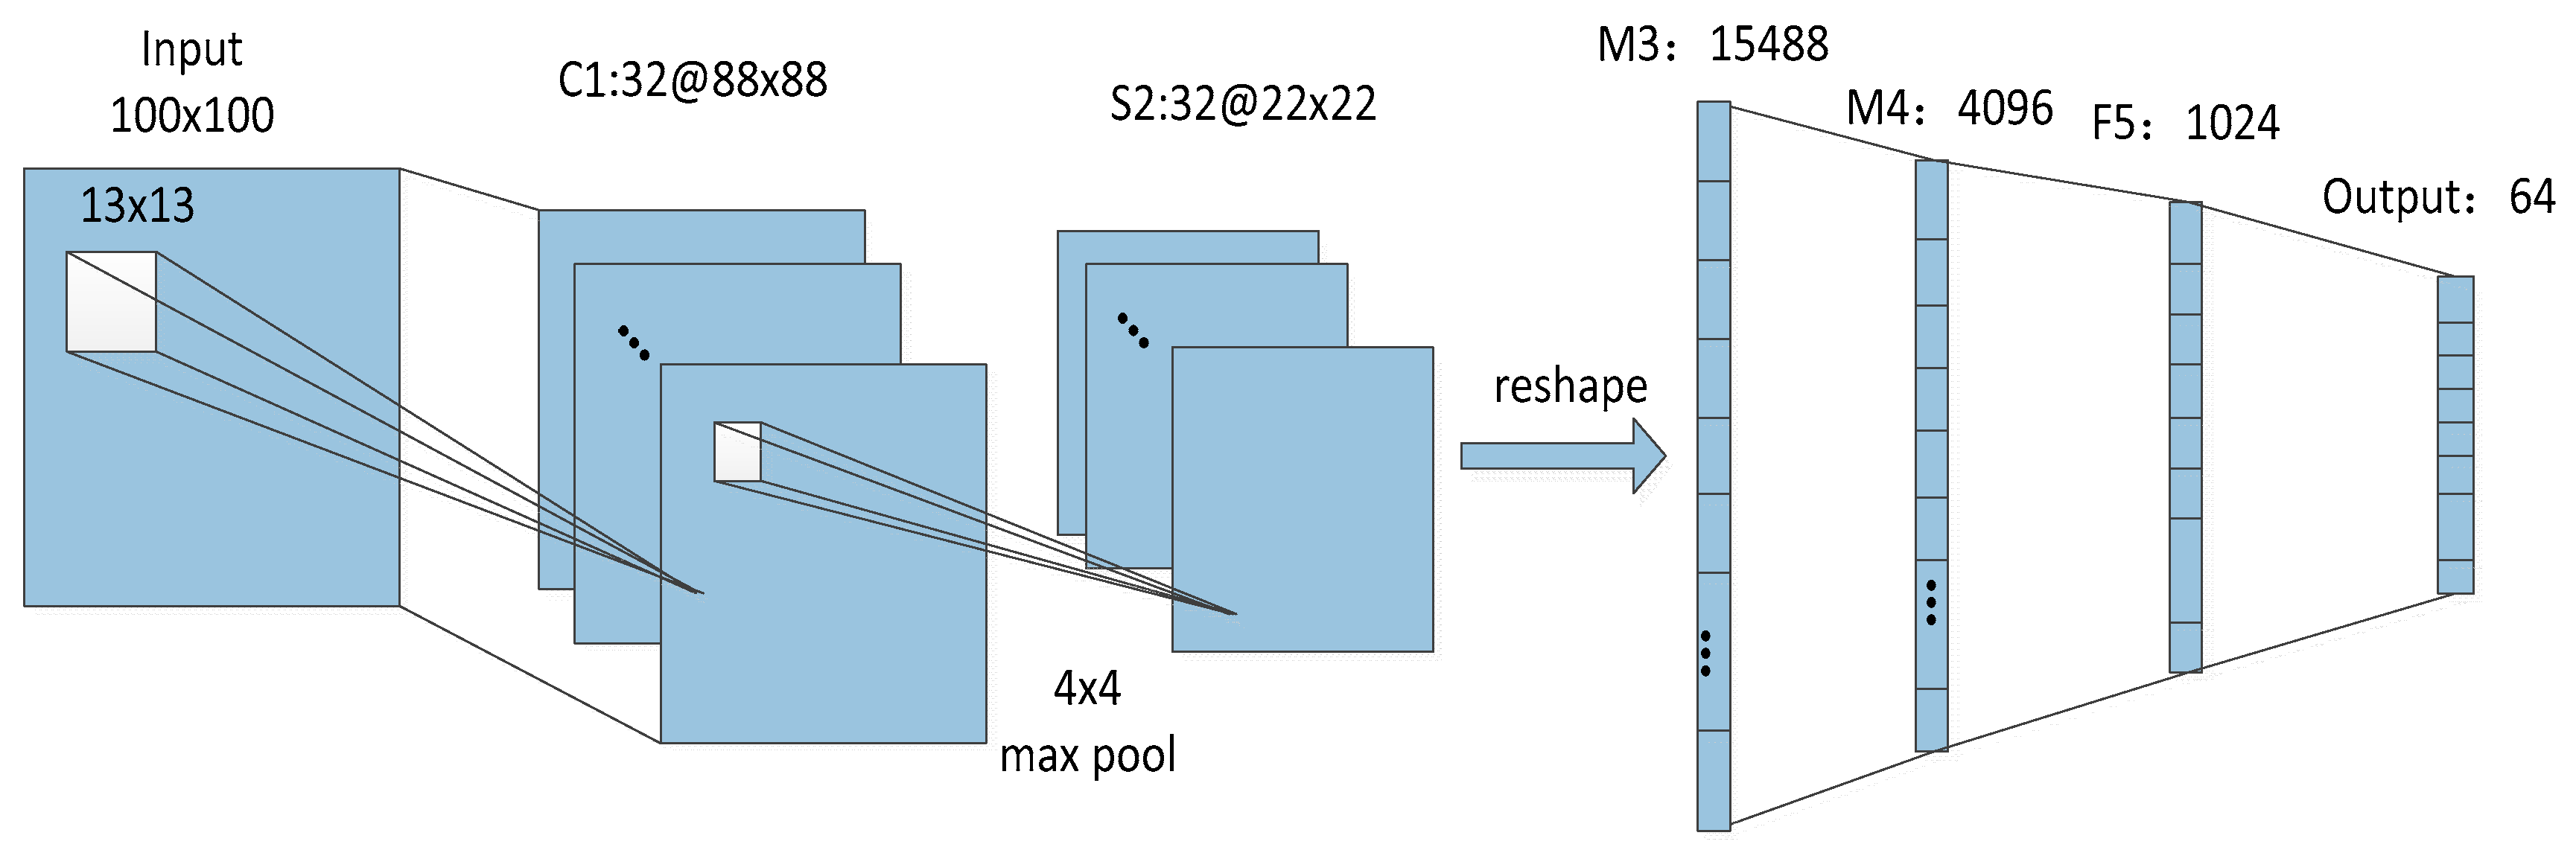
The fundamental Siamese network has been often adopted for samples in the same domain. Under the cross-domain condition, people suggest extending the fundamental version to two CNN networks. The first one is the view domain and the second is the sketch domain. The same architecture exists in the two sub-nets of the Siamese network. The architecture of the sub-net is shown in
Figure 3. The structure of the sub-net has the following layers: one convolutional layer, one pooling layer, two maxout layers. To generate features and calculate losses, an output layer and a layer which was completly linked were adopted respectively. In addition, the rectified linear units were adopted within every layer.
3.3. Cross-Domain Matching Using Siamese Network
The matching issue within the shape retrieval based on a sketch may be considered to be a metric learning paradigm. The samples were mapped to several feature vectors in all the domains. The cross-domain matching was a success if the characteristics from all the domains were accurately “aligned”.
The characteristics that were extracted from diversified domains suffered from discrepancy which made it rather hard to implement across-domain retrieval in a direct way. For the purpose of efficiently performing the cross-domain retrieval, the characteristics in the two domains ought to address the two problems below: (1) The characteristics ought to be as discriminative as they can be in all the domains. (2) The allocations of the characteristics in the two domains ought to be as consistent as they can be across various domains.
The training cases were denoted by us from the target domain (3D shape domain) and source domain (sketch domain) to be
and
separately. The transfer functions for the source domain, as well as target domain, can be denoted to be
as well as
separately. The proposed strategy simultaneously trained both deep neural networks with a loss. There were two terms about the loss function
L, including the correlation term
Lc as well as the discrimination term
, which minimize/maximize the inter-class variations as well as the intra-class variations in all of the domains and ensure the distribution-consistency in diversified domains.
where
aims at minimizing characteristics of the deep transformed intra-class distance and maximize the inter-class distance by using a predefined margin (h) in all of the domains. Besides, the pairwise across-domain distance was optimized by
for the purpose of mitigating the allocation inconsistency in the diversified domains. The parameter α was considered to be the weight to balance between the correlation and discrimination terms.
The discrimination term
aims at maximizing the inter-class distance and minimizing the intra-class distance in all of the domains, where
and
denote the 2D view domain discriminative loss as well as the sketch domain discriminative loss separately,
The sketch domain discriminative term
could be rewritten as follows:
where
and
denote the sets of negative and positive pairs within the sketch feature domain,
and
are two constants. Similarly, we could formulate
as follow:
where
and
denote the sets of negative and positive pairs within the 2D view feature domain.
The correlation term means that the characteristics in the two domains follow various allocations, which makes it difficult to retrieve directly the objects in diversified modalities. Therefore, a correlation term
was further imposed for maintaining the allocation consistency in the diversified domains. It could be rewritten as follows:
where
and
denote the sets of negative and positive pairs in the diversified domains.
maximizes directly the example of the negative across-domain pair distances and minimizes the example of the positive across-domain pair e distances, which makes the allocation of both domains as similar as they can.
4. Experiment
For the purpose of evaluating performance of the proposed solution, we implemented the experiments on the two benchmark datasets: SHREC13 as well as SHREC14 separately as adopted within References [
15,
16].
4.1. Dataset
SHREC13: The benchmark was established on the most recent big collection of the sketches of humans gathered by Eitz et al. [
17] and the famous Princeton shape benchmark (PSB) [
18]. It was composed of 1258 models and 7200 sketches, divided into 90 classes. In addition, these sketch instances in each class were split into two sets. Each group contained 50 data points for training and 30 data points for testing.
SHREC14: In toatal, the 3D pattern dataset in this benchmark included 8987 patterns categorized into 171 classes. In addition, the 2D sketch query set included 13,680 sketches (171 classes, each with 80 sketches) from the human sketch recognition dataset of Eitz et al., and all of them had related patterns within the chosen 3D benchmarks [
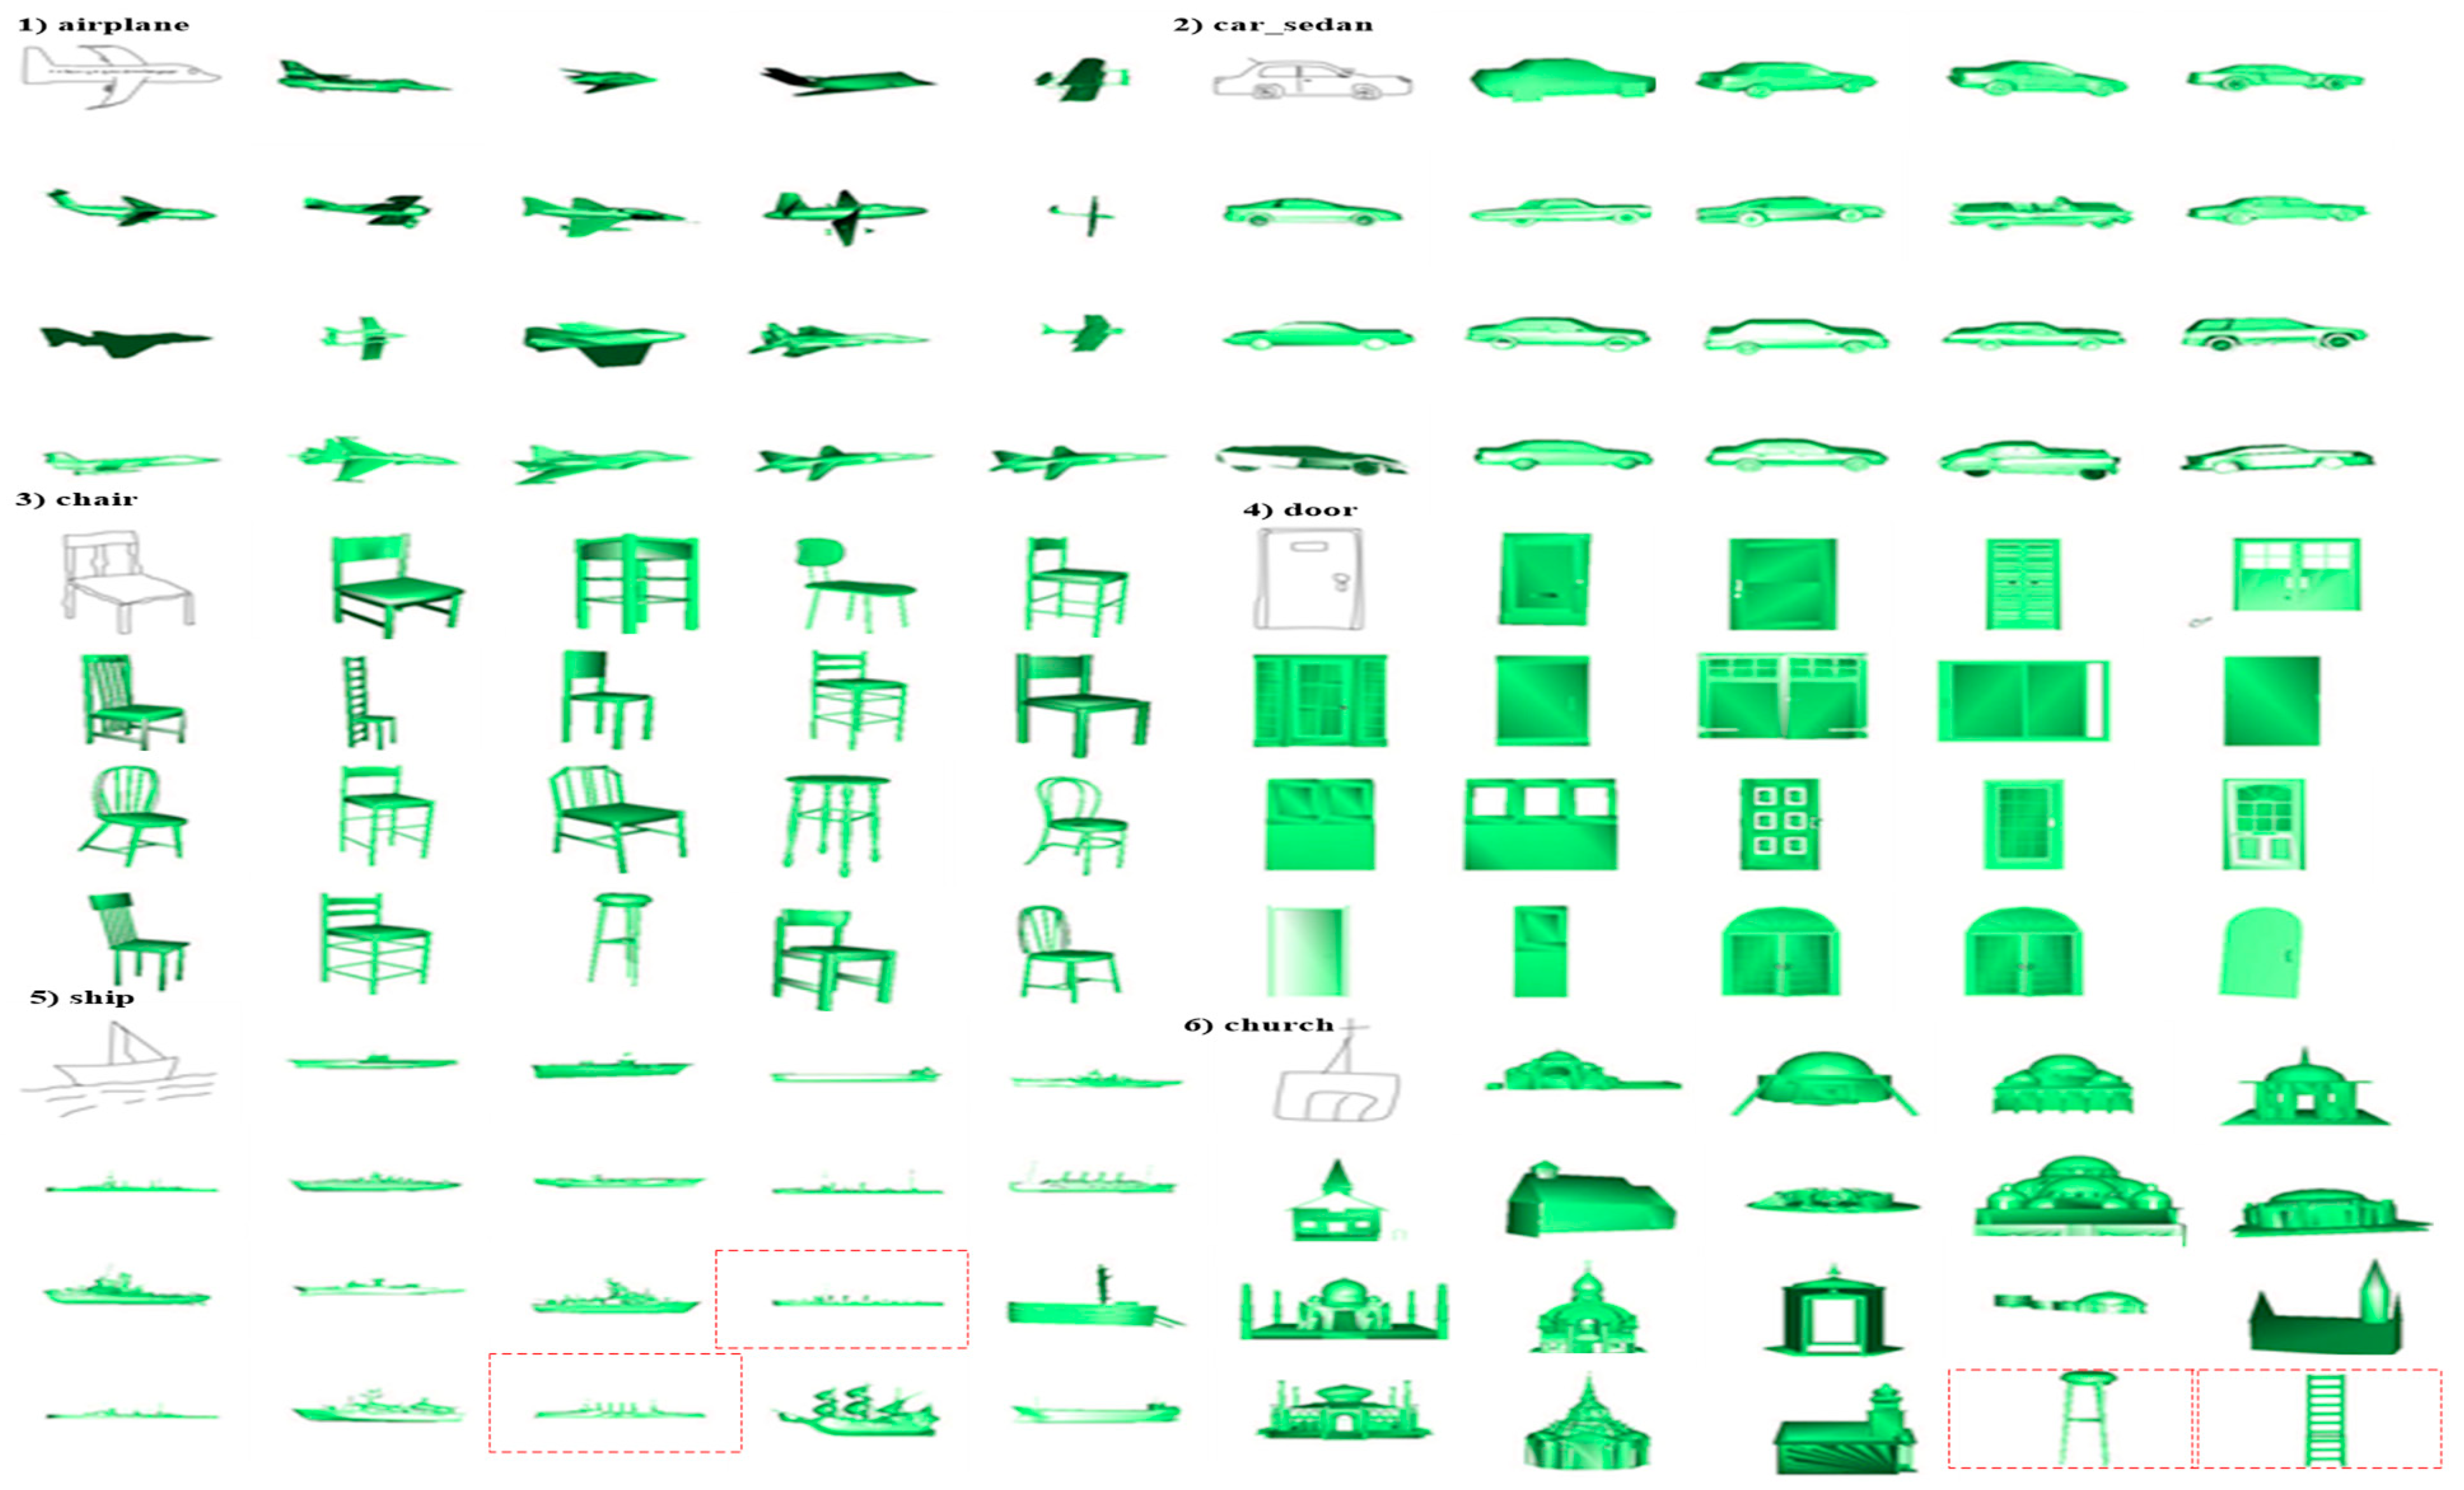
17].
Figure 4 shows several examples of sketches as well as the related patterns.
4.2. Evaluation Metrics
For the purpose of comprehensively evaluating the retrieval algorithm, seven performance metrics, which are often used, were employed by us.
Precision-Recall curve (PR) is the average precision values for fixed recall rates.
Nearest Neighbor (NN) has been considered to be the precision of the top retrieval list.
First Tier (FT) calculates the precision of the top N outcomes (where N is the number of ground-truth patterns related to the query), averaged over every query.
In a similar way, the second tier (ST) can be defined to be the recall of the top 2N retrieved outcomes.
E-Measures (E) measures the performance of the top 32 patterns retrieval within a retrieval list:
Discounted Cumulated Gain (DCG) can be defined to be the normalized summed weighted value that relates to the related patterns’ positions. A retrieval list R was first transformed into a list G, where Gi if Ri is a related pattern or Gi = 0:
At last, it was normalized by the optimal DCG:
where
n is the number of all models and
C is the number of related patterns within the same category.
Average precision (mAP) is the area under the PR curve.
4.3. Experimental Settings
Computational cost We carried out every experiment on a PC with an Intel(R) Xeon(R) CPU@ 2.40 GHz and Tesla K40 GPU, and 64 GB memory. The training time was in proportion to the number of epochs as well as the overall training amount. Total training took about 3.7 h and the retrieval time for all the queries was about 0.001 s averaged over the SHREC13 dataset.
Train epoch: The stopping criteria of the dataset were divided into testing sets and training sets, but the validation set was not specified. Therefore, the algorithm used the SHREC ’13 and SHREC ’14 data sets to run until it was terminated after convergence. It was run multiple times and reported the average value and loss function parameters of the Siamese network in Equations (2), (5) and (6); we set , and .
Generating pairs for the Siamese network. To ensure that the proper proportion of dissimilar and similar pairs could be generated, the following methods were used to generate pair sets. We randomly selected kp view pairs in the similar pairs (same class) and kn view samples from dissimilar pairs (other categories) for each training sketch. In general, training success rates for dissimilar pairs were ten times higher compared with the pairs with similarities. Here, we used kp = 2, kn = 10. The random pairing was performed by us for all of the training epochs.
k value of the maxout layer. In order to get the specific value of
k, we conducted a series of eight trials. In these trials, we set k = 2, 3, 4, 5, 6, 7, 8. Each trial of the test performed the train for 20 times. The experimental resources have been mentioned before. Diversified trials possess diversified k values while other parameters were consistent in the diversified trials. The experiment outcomes are presented within
Figure 5. It was obvious that the predictive ability was significantly better when k was set to 3. Therefore, k was set to 3 in this paper. Later on, the network pattern’s constructionwas completed.
4.4. Retrieval on SHREC 2013 Dataset
We present the statistical results in this section on SHREC13. First of all, the precision-recall curve was used to compare with the methods in References [
4] and [
8]. In Reference [
4], a comparative assessment of 16 runs (Li’s SBR-2D-3D [
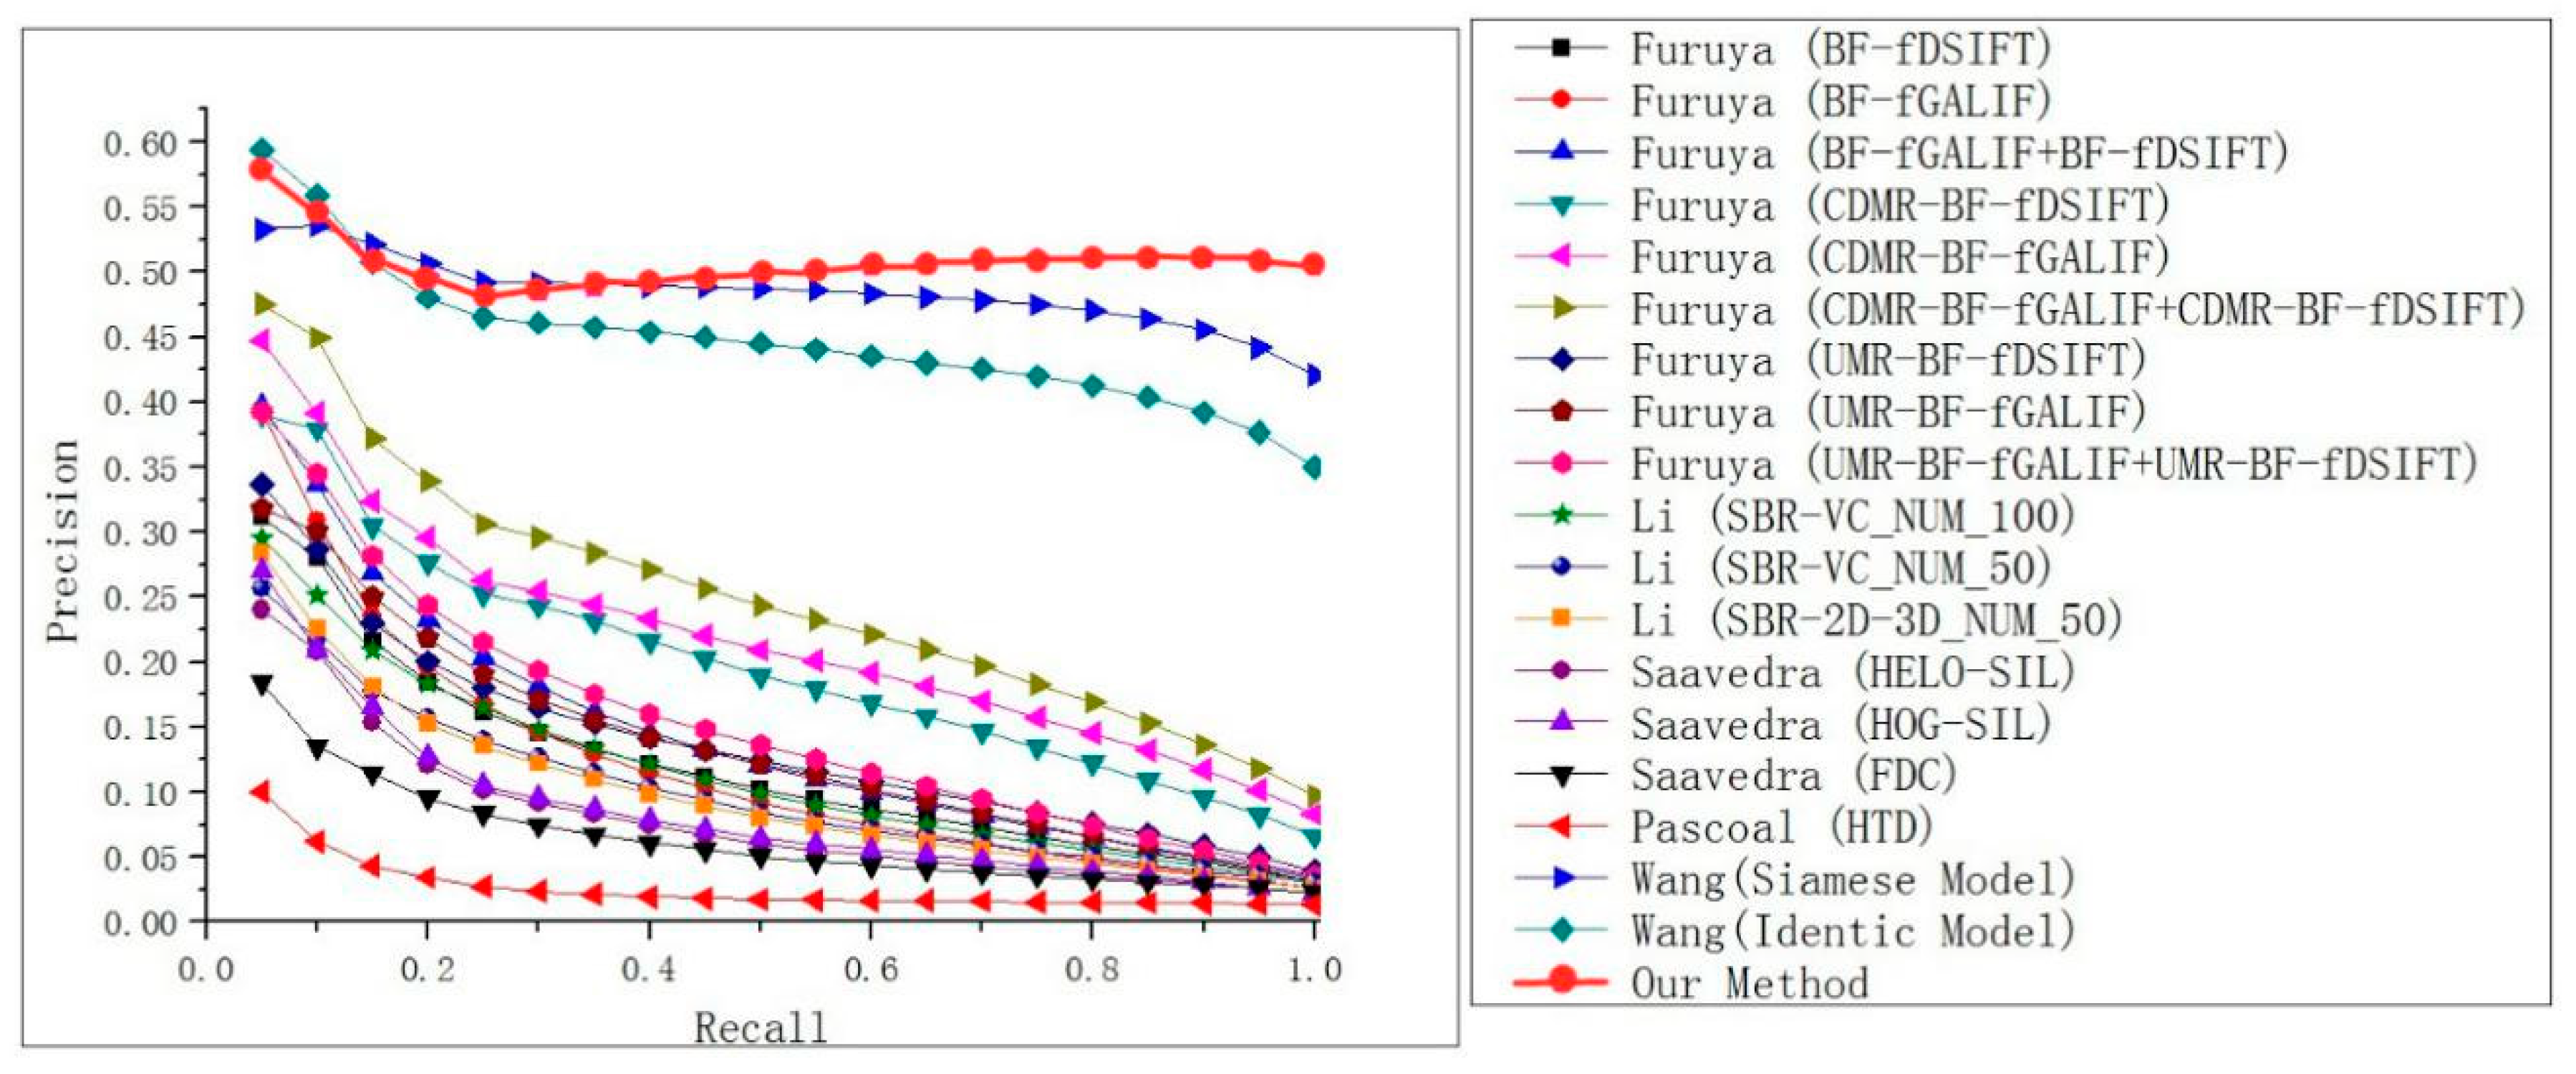
15] chose NUM = 50 only) of the 15 contributed strategies was implemented using the SHREC13 Benchmark. The outcomes of the PR assessment on the dataset are presented in
Figure 6. It was obvious that our strategy significantly outperformed the other comparison strategies. It further proved that the strategy was better from different perspectives. Besides, the SHREC13 benchmark showed that when the recall was small, the performance gain of the proposed method was improved by at least 10%. In addition, when the recall increased, the overall PR curve decreased much more slowly than other methods. It means that the method was more stable than the others. In addition, the high quality of the outcomes is visualized in
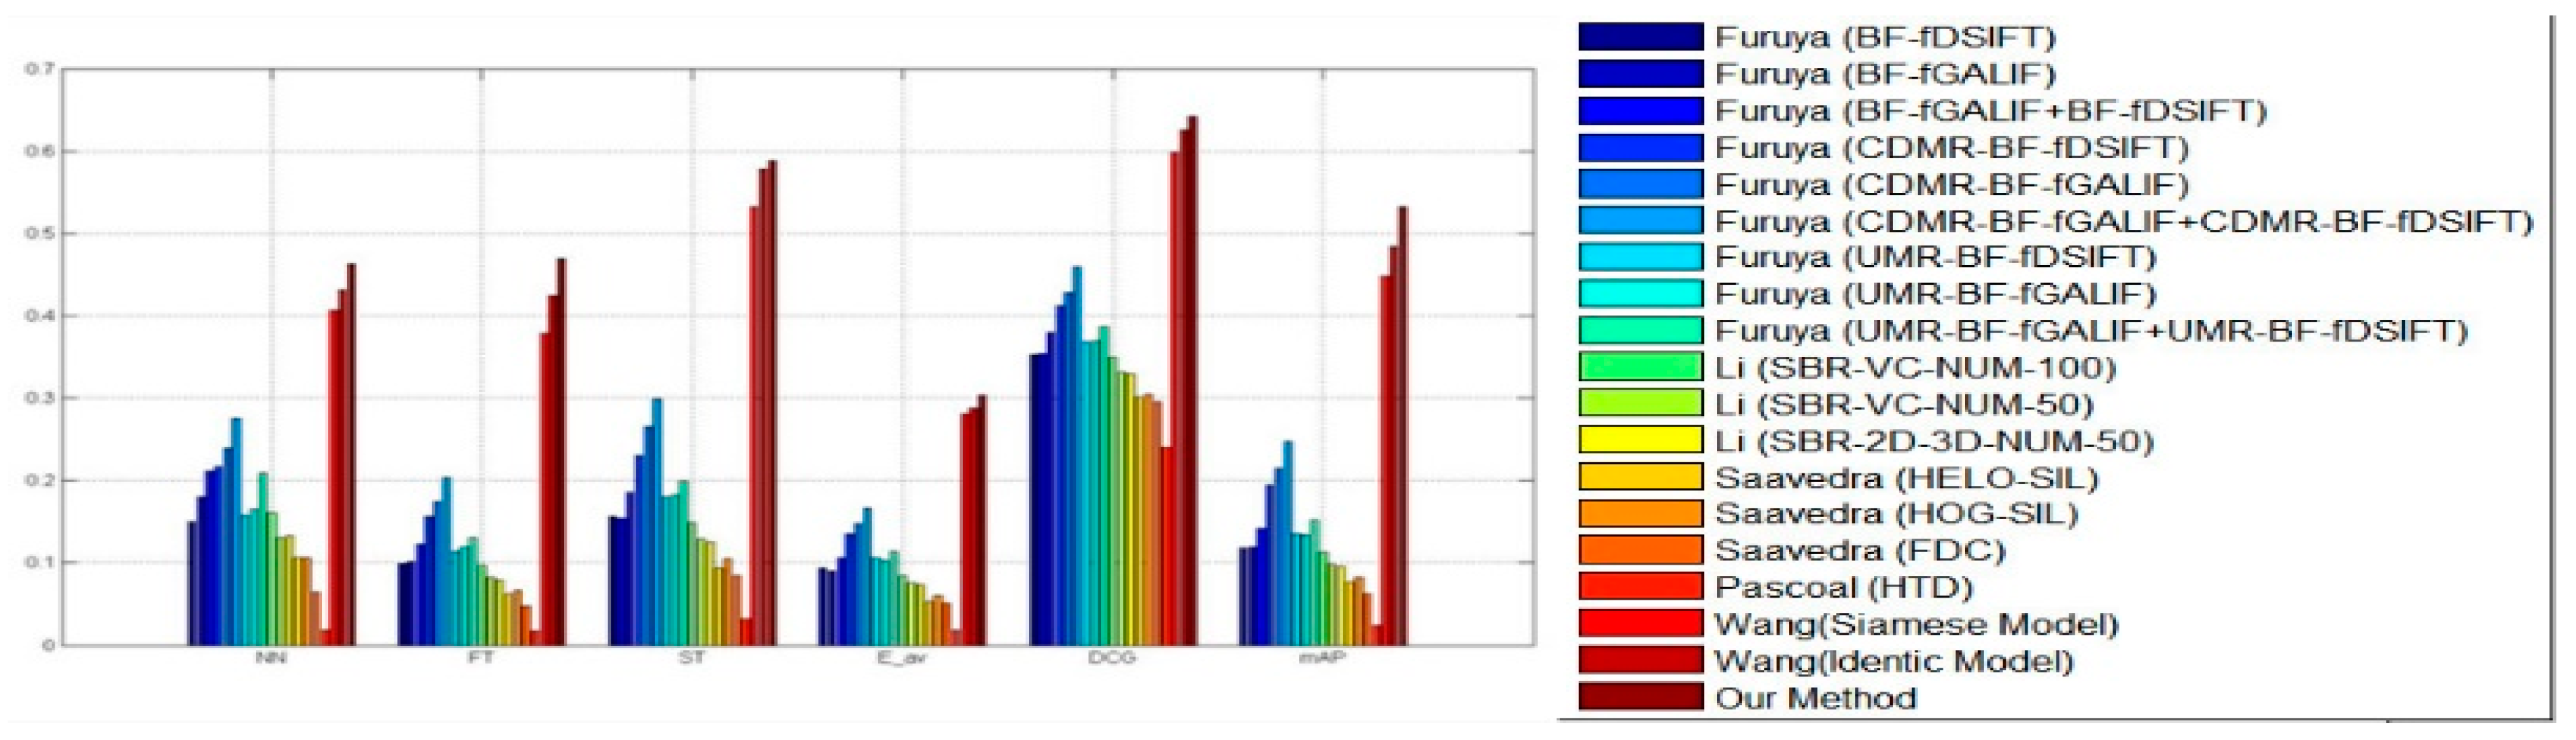
Figure 7. Except for the precision-recall curve, standard metrics, containing mAP, DCG, E, ST, FT as well as NN, were calculated as well for evaluating the strategy that was put forward by us as well as other strategies shown in
Figure 8. For every assessment standard, the strategy which was put forward by us outperformed the strategies mentioned before. The development was significant. We can draw the same conclusion; the strategy was more excellent compared with the other strategies within every metric.
4.5. Retrieval on SHREC 2014 Dataset
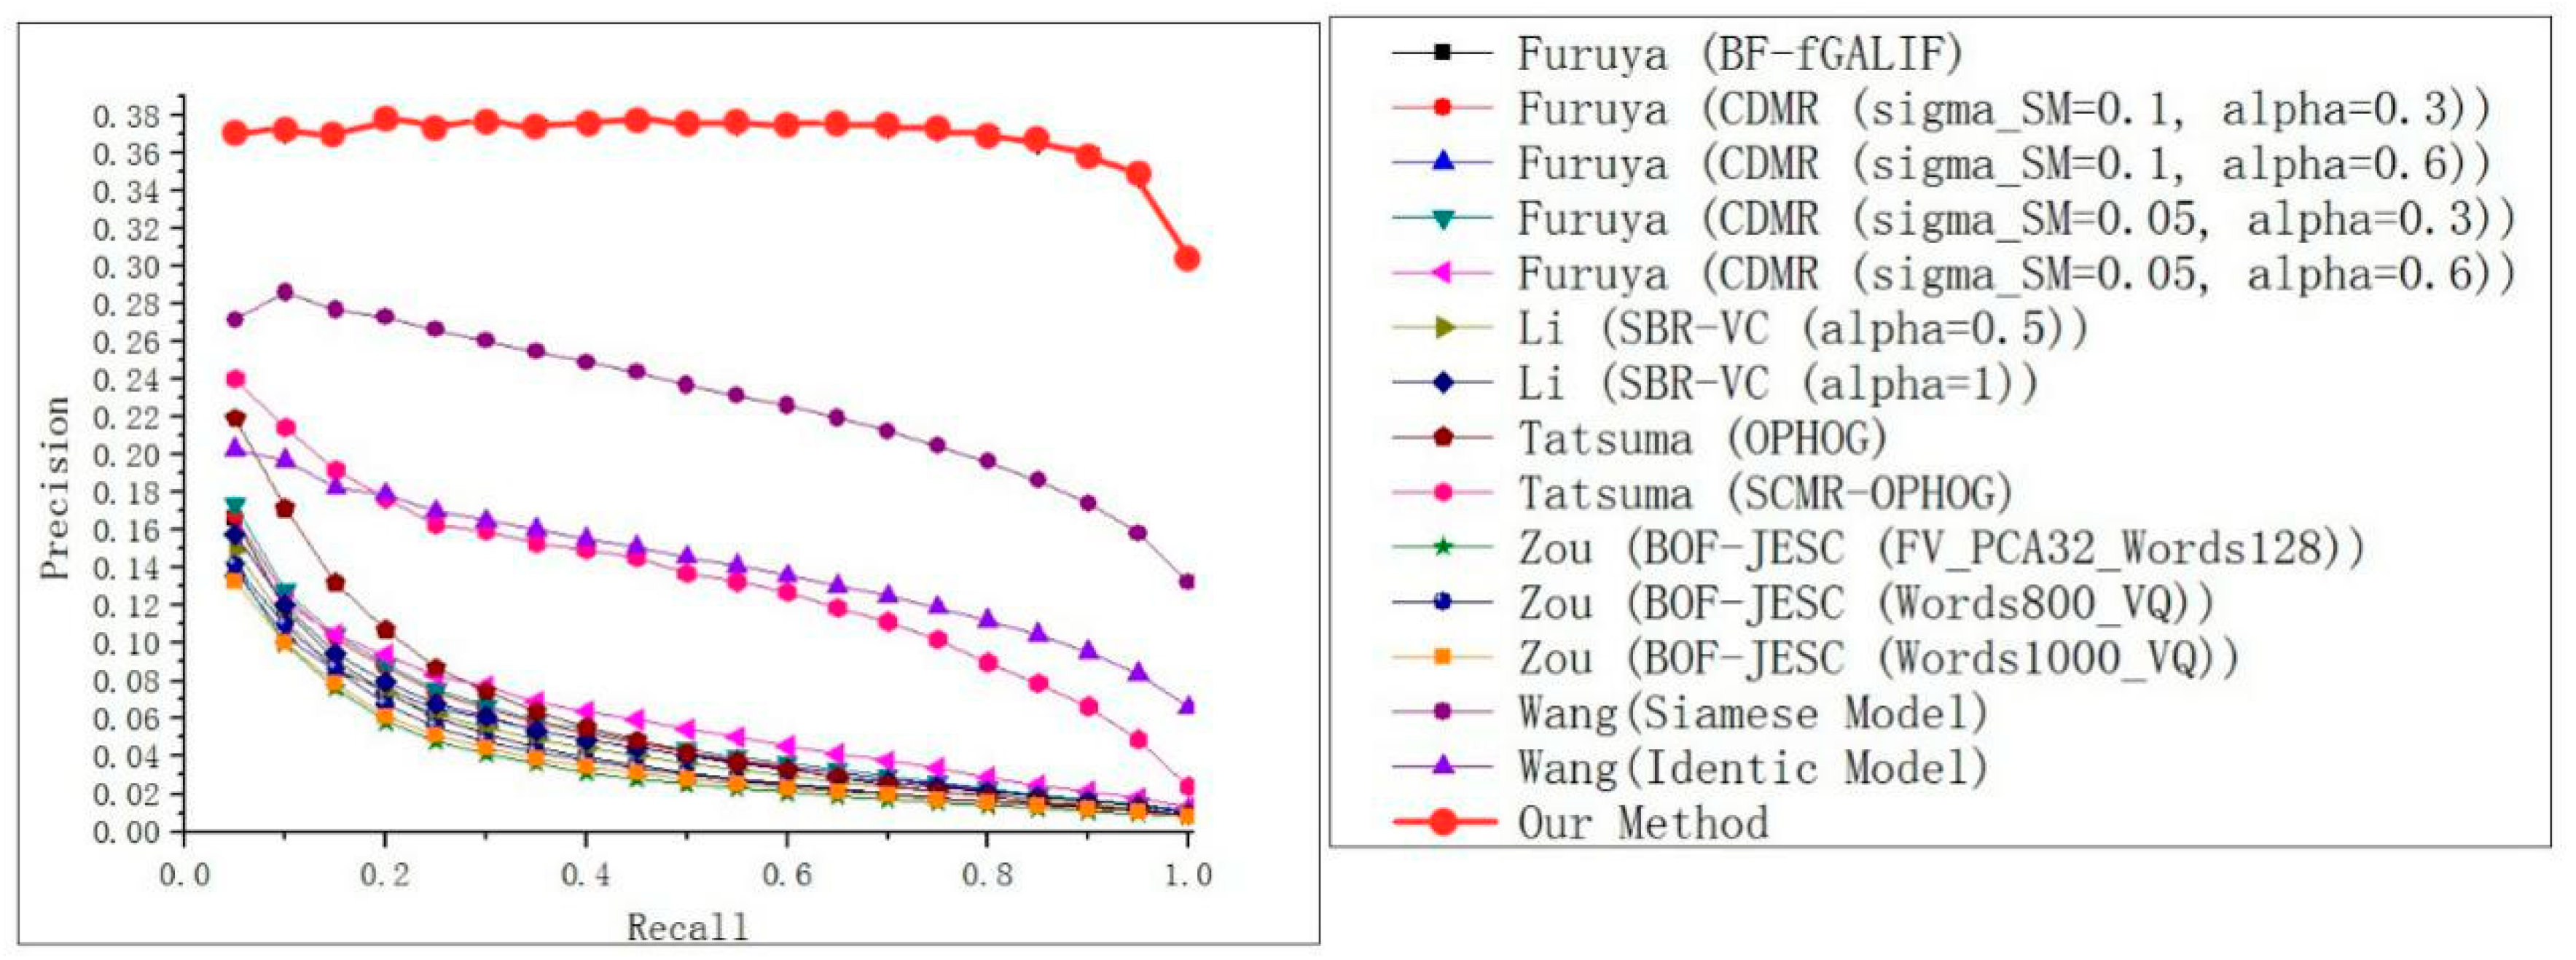
Our framework was compared by using state-of-the-art strategies reported in Reference [
15] on the SHREC 2014 dataset. The results are shown in
Figure 9 and
Figure 10. In particular, the whole PR curve had a higher performance gain of twice as much as Reference [
8] when the recall reached 1. This can be seen in the larger dataset. Our method can also solve the over-fitting problem and is more robust.
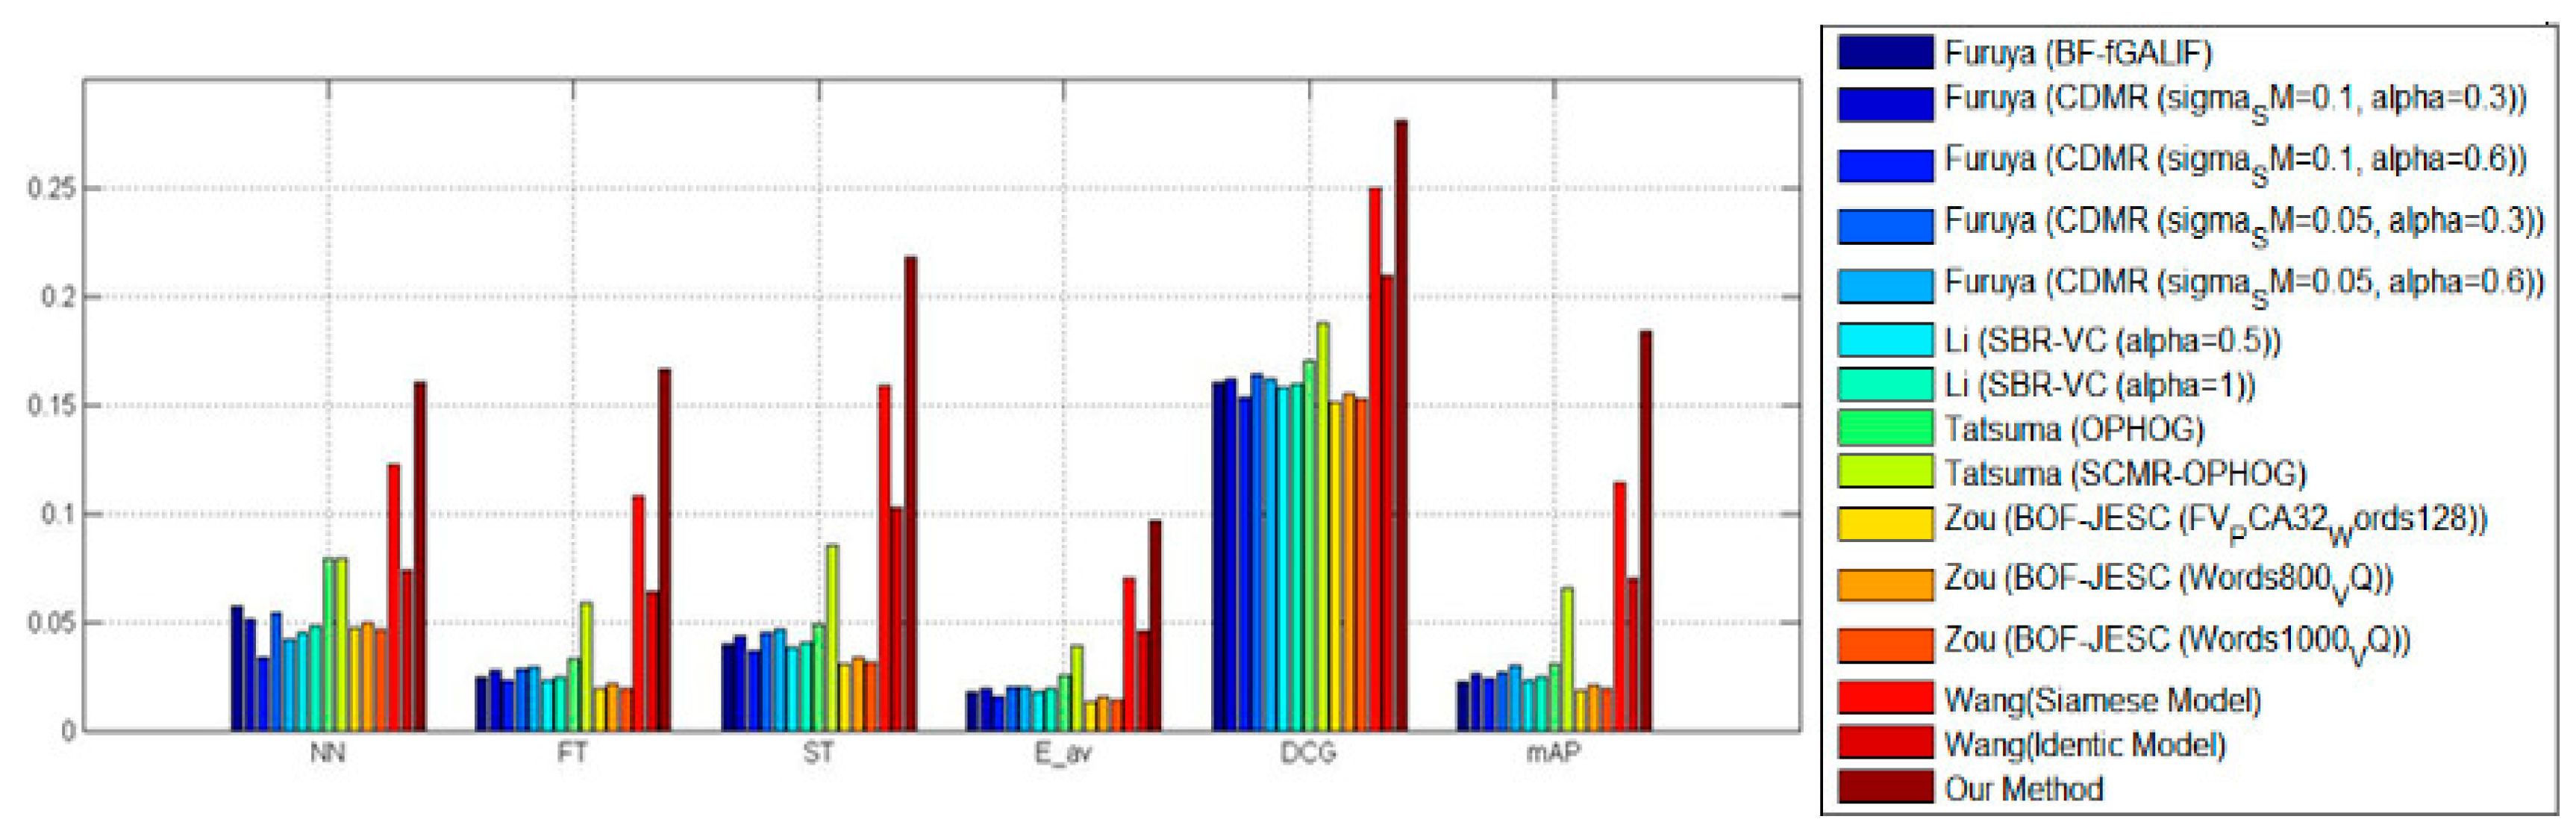
Additionally, the strategy, which was put forward by us, was also compared with the strategies mentioned above, containing map, DCG, E, ST, FT as well as NN. These strategies were adopted for assessing the strategy which was put forward by us. Among all the assessment standards, the strategy that was put forward by us outperformed the strategies mentioned before, which illustrates the efficiency of the strategy that was put forward by us.
