1. Introduction
The expansion of data analytics and machine-to-machine communication (M2M) device performance is going to provide an inventive podium for mobile operators to innovate in the area of customer and service experience. The amount of connected low power devices is growing at a fast pace, as well as the amount of data generated by those devices which release a new height of services to improve the quality of life and enterprise productivity. Smartphones, smartwatches, and other wireless devices today are manufactured with a wide range of smart sensors to improve user experience in terms of security, health, location, and marketing applications. Sensors such as accelerometers, gyros, and fitness workout sensors are becoming a part of users’ lives and are keeping them safe and healthy. With the current architecture of the IoT system, mobile network operators (MNOs) are playing a significant role in the communication of IoT devices, providing both an adapted and efficient access layer. Overlooked as recent technology, IoT is becoming an essential part of the Internet [
1], though it is a concept under continuous development [
2]. Likewise, with constant interactions with diverse devices including sensors, actuators, cameras, and mobile smartphones, IoT constitutes a new source of revenue for mobile operators, provisioning and creating new faculties to implement IoT services. One of the fundamental elements of the IoT concept is M2M [
3]. Several studies are being conducted, addressing different facets of the M2M on the current cellular infrastructure (2G/3G/LTE/LTE-A). Minor adjustments are expected from the legacy network infrastructures to handle the explosive amount of device data; to this end, an aggregation model of data traffic was proposed to benchmark the quality of services for smart devices, focusing on the basic data key performance indicators (KPIs), including the throughput and average response time of service applications [
4]. M2M devices have different QoS requirements, depending on the application; for example, real-time monitoring may require less delay and a high traffic priority compared with standard monitoring [
5]; many studies have been directed towards network provisioning [
4], the management of a service’s quality [
6], and the application of predictive methods on network traffic [
7]. In our case study, the performance is shifted towards devices.
Figure 1 illustrates a simplified traffic model, in which traffic coming from multiple SIM-enabled devices are processed and transformed to provide analytics intelligence. The model provides a large partition between device, network, and service analytics. Mobile operators will play a significant role in connecting devices due to the existing transport infrastructure and the minimal modifications that will be needed to transfer a high load of traffic (with an indifference to building relatively new infrastructures).
The introduction of 5G, network function virtualization, and cloud technologies are evident highlights of connected devices’ prerequisites on networks [
8].
The objective of this paper is to provide a practical model of network device performance, as a baseline for IoT and M2M systems. In the article, we use data analytics methodologies to explore devices’ performance based on data application indicators; the experiment applies predictive analytics as well to classify device category, manufacturer, and type based on a defined set of rules.
2. Background
Many researchers have described the concepts of M2M and IoT [
3,
9]; while all definitions apply, the simplest way to outline IoT is the Internet of objects or the Internet of everything excluding humans. Devices such as smartphones, SIM-enabled sensors, smart meters, and IP cameras are all intelligently connected via the Internet to facilitate communications between systems, people, and devices, with the aim to improve a particular aspect of business or life [
10]. Such devices use network infrastructures for interconnections. Cellular networks with long-term evolution (LTE) and LTE-A (advanced) already support low power device interconnections; having more than 20 million connected devices entails an exponential growth of traffic in the network, which can result in high latency and network congestion.
2.1. Machine-Type Communication (M2M)
Mobile cellular networks have been deployed and optimized in recent years to accommodate human-to-human communication (H2H) traffic, which in most cases is characterized by a high demand on the downlink stream. However, with the application of IoT, H2H is being slowly overshadowed by M2M, which imposes high demands on the uplink traffic stream [
11]. In machine-type communication, devices communicate between them or interacting with a remote server, with minimal human interaction. The use of smart electricity meters, intelligent vending machines, and intelligent traffic control devices are examples of machine-type communications. These devices are equipped with SIM cards that facilitate a unique identification in the network, using an IMSI (international mobile subscriber identity) and an IMEI (international mobile equipment identity). The upgrade of the current cellular infrastructure, to accommodate M2M, has been a topic of study for many researchers. Although 5G cellular support is viewed as favorable for IoT and M2M connections [
5], research is highlighting the growth and challenges of M2M traffic on existing cellular networks [
12].
Gohil et al. [
13] studied the parallelism between M2M and H2H traffic by analyzing a week of data collected from a mobile operator in the USA. The study used vital parameters such as data volume on the uplink and the downlink. It was shown that M2M generates heavy uplink traffic. The nature of the M2M data stream was also reviewed in [
14], which proved the complexity of M2M traffic patterns. David Aragao et al. [
3] introduced a mechanism for congestion control in M2M, improving energy efficiency, evaluating the impact of M2M compared to H2H, and analyzing traffic priorities on different classes of devices. The research on M2M shows the preventive measures that mobile operators need to take to efficiently adjust to high, unbalanced, and possibly unstructured data traffic.
2.2. Mobile Networks Digitization and the 5G
Different network types can be used to connect IoT devices. Wireless networks such as traditional mesh networks, ad-hoc networks, satellite networks, sensors networks, Bluetooth, and so on ensure Internet connectivity. In personal area networks, IEEE 802.15.x provides a large number of application specifications [
15]. Another communication standard implemented for the support of wireless communication is the extended Wi-Fi networks, using 900 MHz bands instead of the legacy 2.4 GHz Wi-Fi band and supporting the concept of IoT [
16]. However, coverage and scalability are two parameters that limit the adoption of the mentioned technologies in IoT services and machine-type communications. Reliability, data security, and interference pose another threat due to the use of unlicensed frequency bands. Cellular mobile networks have already been supporting connectivity between different applications, going beyond the stream of just mobile phones, tablets, and computers to accommodate other applications such as connected buildings, smart meters, and vending machines. Mobile networks should guarantee security and reliability because they are strongly regulated. Current machine-type and IoT applications use LTE cellular technology because of its high-speed characteristics and reliability. As projected by many studies, the estimated number of connected devices by 2020 could be around 50 billion [
17]. Other disciplines outside the telecommunications area are going to be major contributors to network traffic and load; for example, in the domain of healthcare, there is going to be a large number of devices connected for health and medical conditions in the smart city domain. This means the current traffic could grow exponentially; future demand in terms of network connectivity requirements is going to surpass what LTE systems can currently achieve effectively. Hence, a need for the MNO business model is to digitize their networks to support the future trends of IoT and MTC applications. More data capacity, higher throughputs, massive machine-type communication (mMTC), and ultra-low latency applications are the main drivers of the 5G network system. The enhanced mobile broadband (eMBB), mMTC, and critical machine-type communication (uMTC) are the main group of use cases that will form the building blocks of 5G networks [
18].
2.3. Real-Life Applications of IoT and M2M Communication
The connectivity of devices aims to improve human life. Let us look at a few real-life applications of the connected world. In terms of smart parking and intelligent parking reservation [
19], the developed algorithm helps users to find free parking slots and estimate the distance to free parking spots. Smart CCTV monitoring systems, equipped with artificial intelligence, upload video footage to remote servers (data usage, throughput, and latency requirements). Smart power meters used daily regulate energy usage in houses; with the prepaid electricity model, the power meters register our daily usage and send the data usage to a remote server for monitoring [
20]. The usage of smart heating systems to control and monitor appliance temperatures in homes, saving energy and efficiently managing costs [
21], is another important application of IoT technology.
Smart refrigerators, smart lighting systems, health monitoring gadgets, and smart cars are all real-life illustrations of currently popular IoT applications. The devices linked to the mentioned applications upload a massive amount of data to remote central servers through communication networks.
3. Data Analytics and Machine Learning for Device Performance
Data analytics will be pivotal in performance tracking due to the nature of the M2M data stream and the projected increase in the number of connected devices. Various applications require different types of processing. Specific applications such as those in healthcare require a high transmission rate and lower delay compared to other applications—hence the need for flexible data processing and business case adaptation. MNOs will have to switch from network monitoring to service monitoring and device monitoring. In the area of IoT and MTC, the massive amount of data generated by devices would require intelligent analytics to represent the management of traffic [
22]. On top of the analytics capability of smart device behavior, machine learning and predictive analytics are also required to exploit the knowledge that is somewhat hidden in the vast amount of data generated by those devices. Combining machine learning and big data presents a new challenge in terms of computational cost. High-performance servers and parallel computing create a need to ensure efficient processing and the retrieval of data. Data analytics is therefore crucial for both MNOs and IoT end service providers. The most commonly known big data challenges should be looked at and mitigated.
4. Problem of the Study
For many years, MNOs have focused continuously on QoS on the network level, so as to guarantee network quality as the main component of a good experience. Nonetheless, in recent years, there has been a paradigm shift to a service-oriented approach and toward customer experience management, where operators have focused on the services provided and on each client’s experience. With the evolution of technology, the IoT, and MTC, the quality of device (QoD) will also be a fundamental concept of network monitoring.
Service and device performances as perceived by IoT service providers and MNOs are dissimilar. While the former provides the end-user service (on the application layer), the latter puts in place a transport mechanism for connectivity between end-user devices. Thus, similar to OTT (over the top) services such as WhatsApp, Skype, and Viber, the content of the IoT services can also be encrypted with end-to-end encryption processes for data security. In this case, MNOs do not have access to the content of the IoT packets but provide the communication channels.
By providing the transportation mechanism, MNOs can, through deep packet inspection (DPI), identify services by analyzing the patterns of traffic in the data packets, also known as the traffic signature.
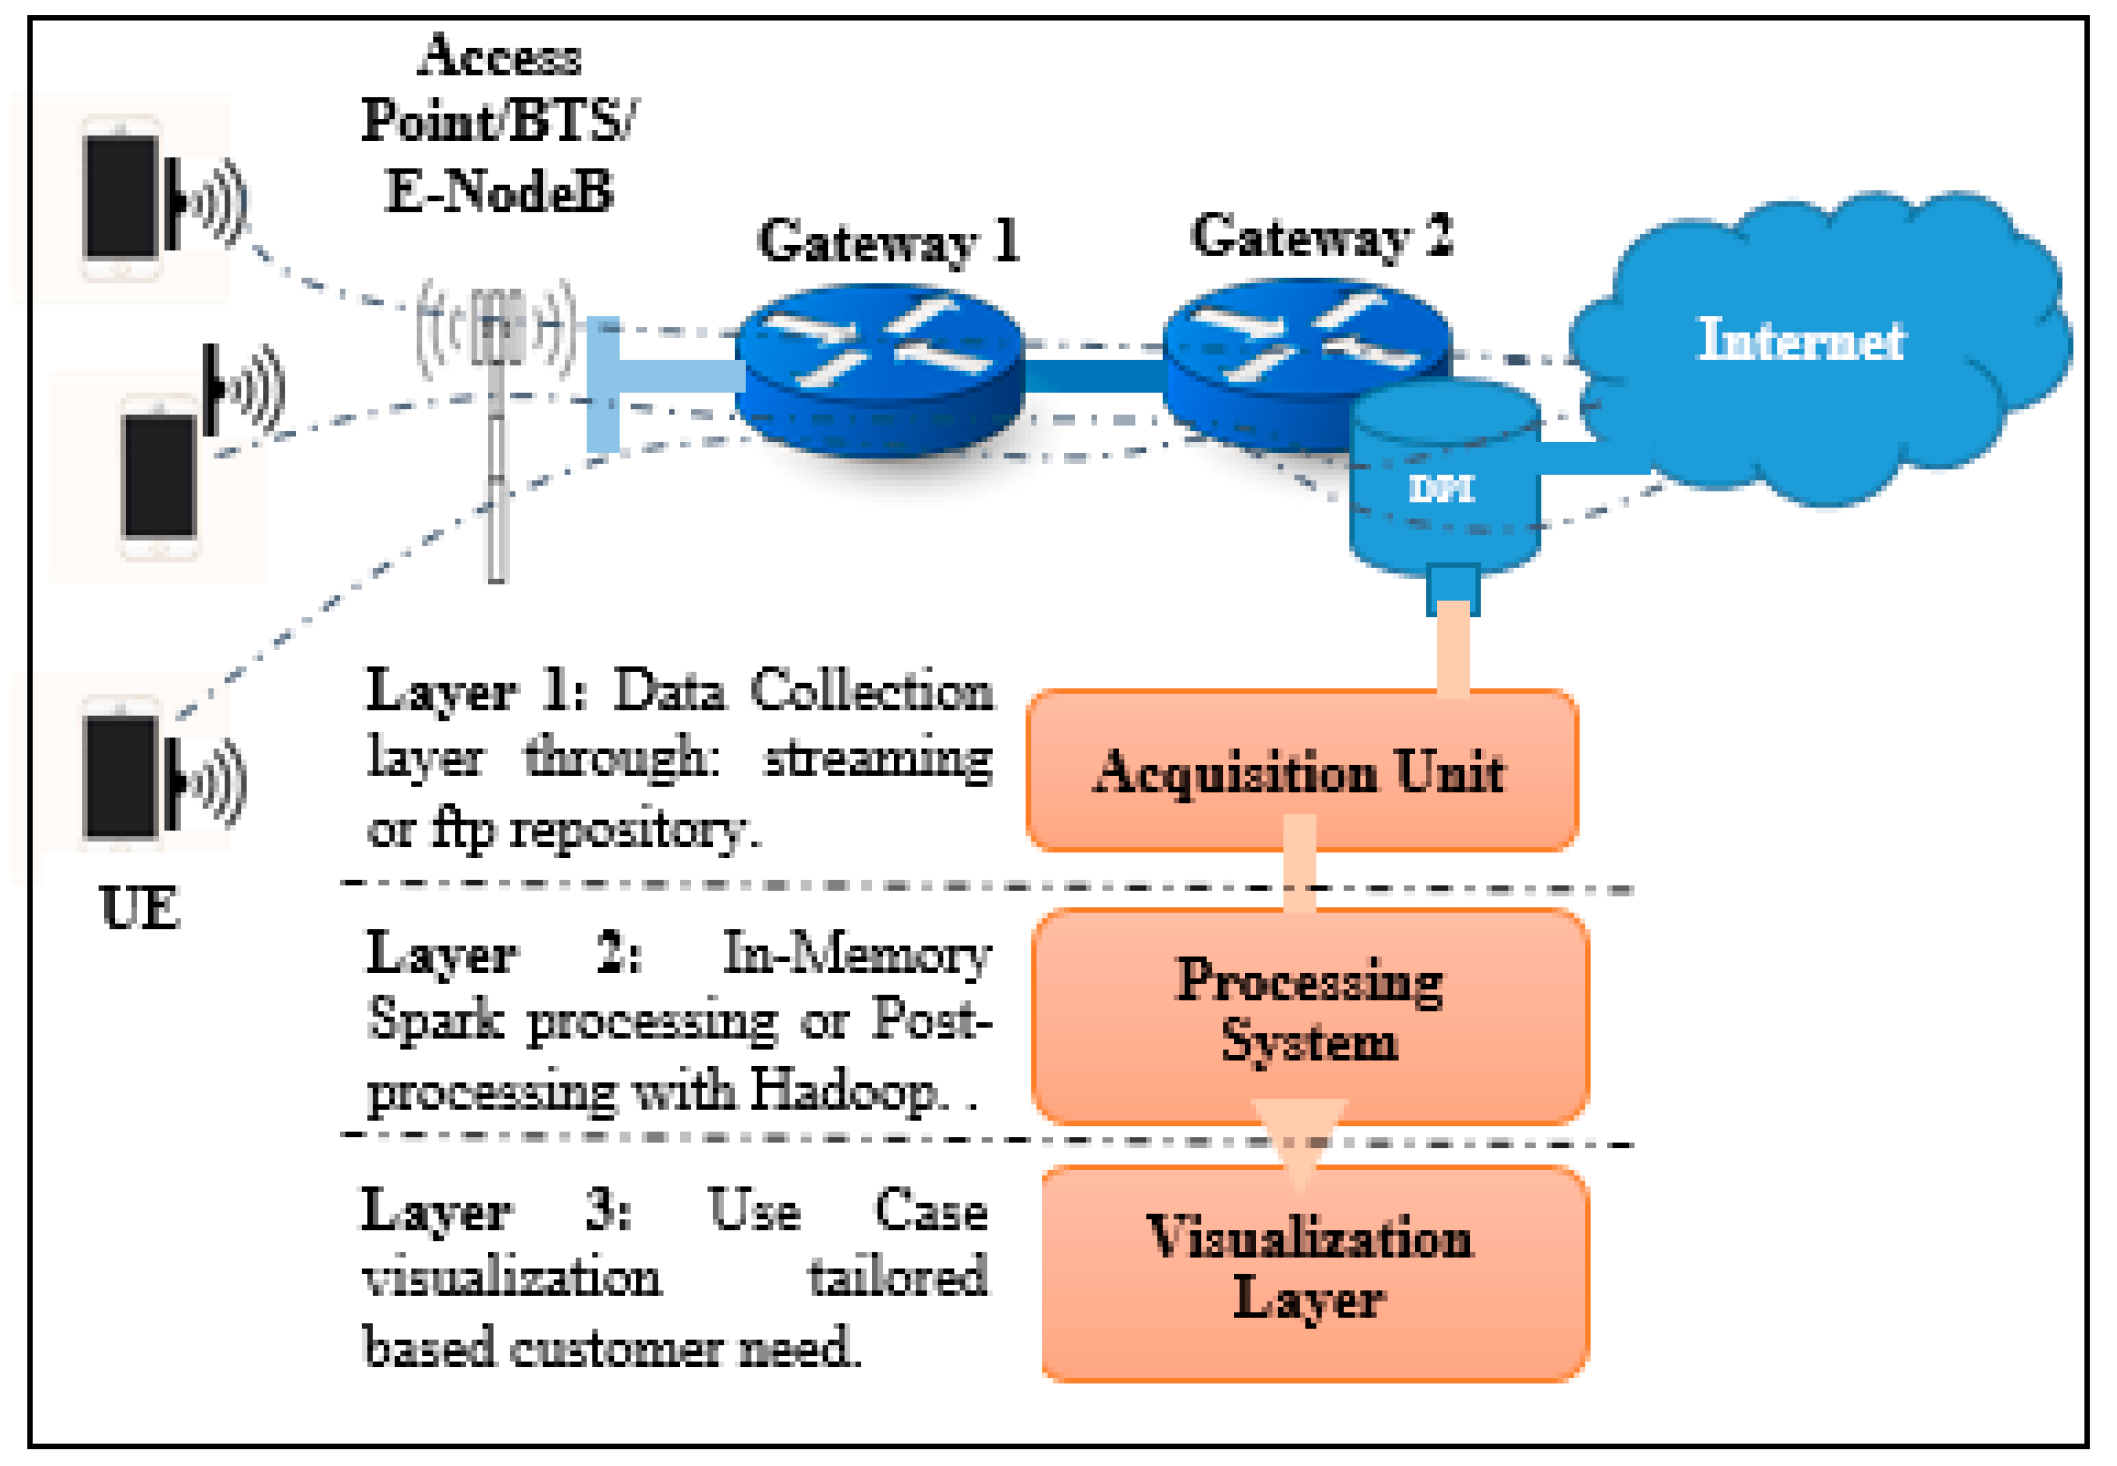
Figure 2 illustrates the communication concept, the traffic flow, and the data collection points in the network for this experimental study. The DPI engine allows the system to recognize IoT and MTC services based on their signature (packets traffic pattern) and not their content, as well as other standard Internet services.
The heterogeneity and the volume of M2M device data make IoT service data processing much more complicated—on the one hand, because of the complexity of data streams and, on the other, because of the amount of intelligence required to detect the traffic patterns in the network. Depending on the service application, M2M system processes events in either real time or non-real time [
23]—hence the need for big data technologies and cloud computing.
5. Process Methodology
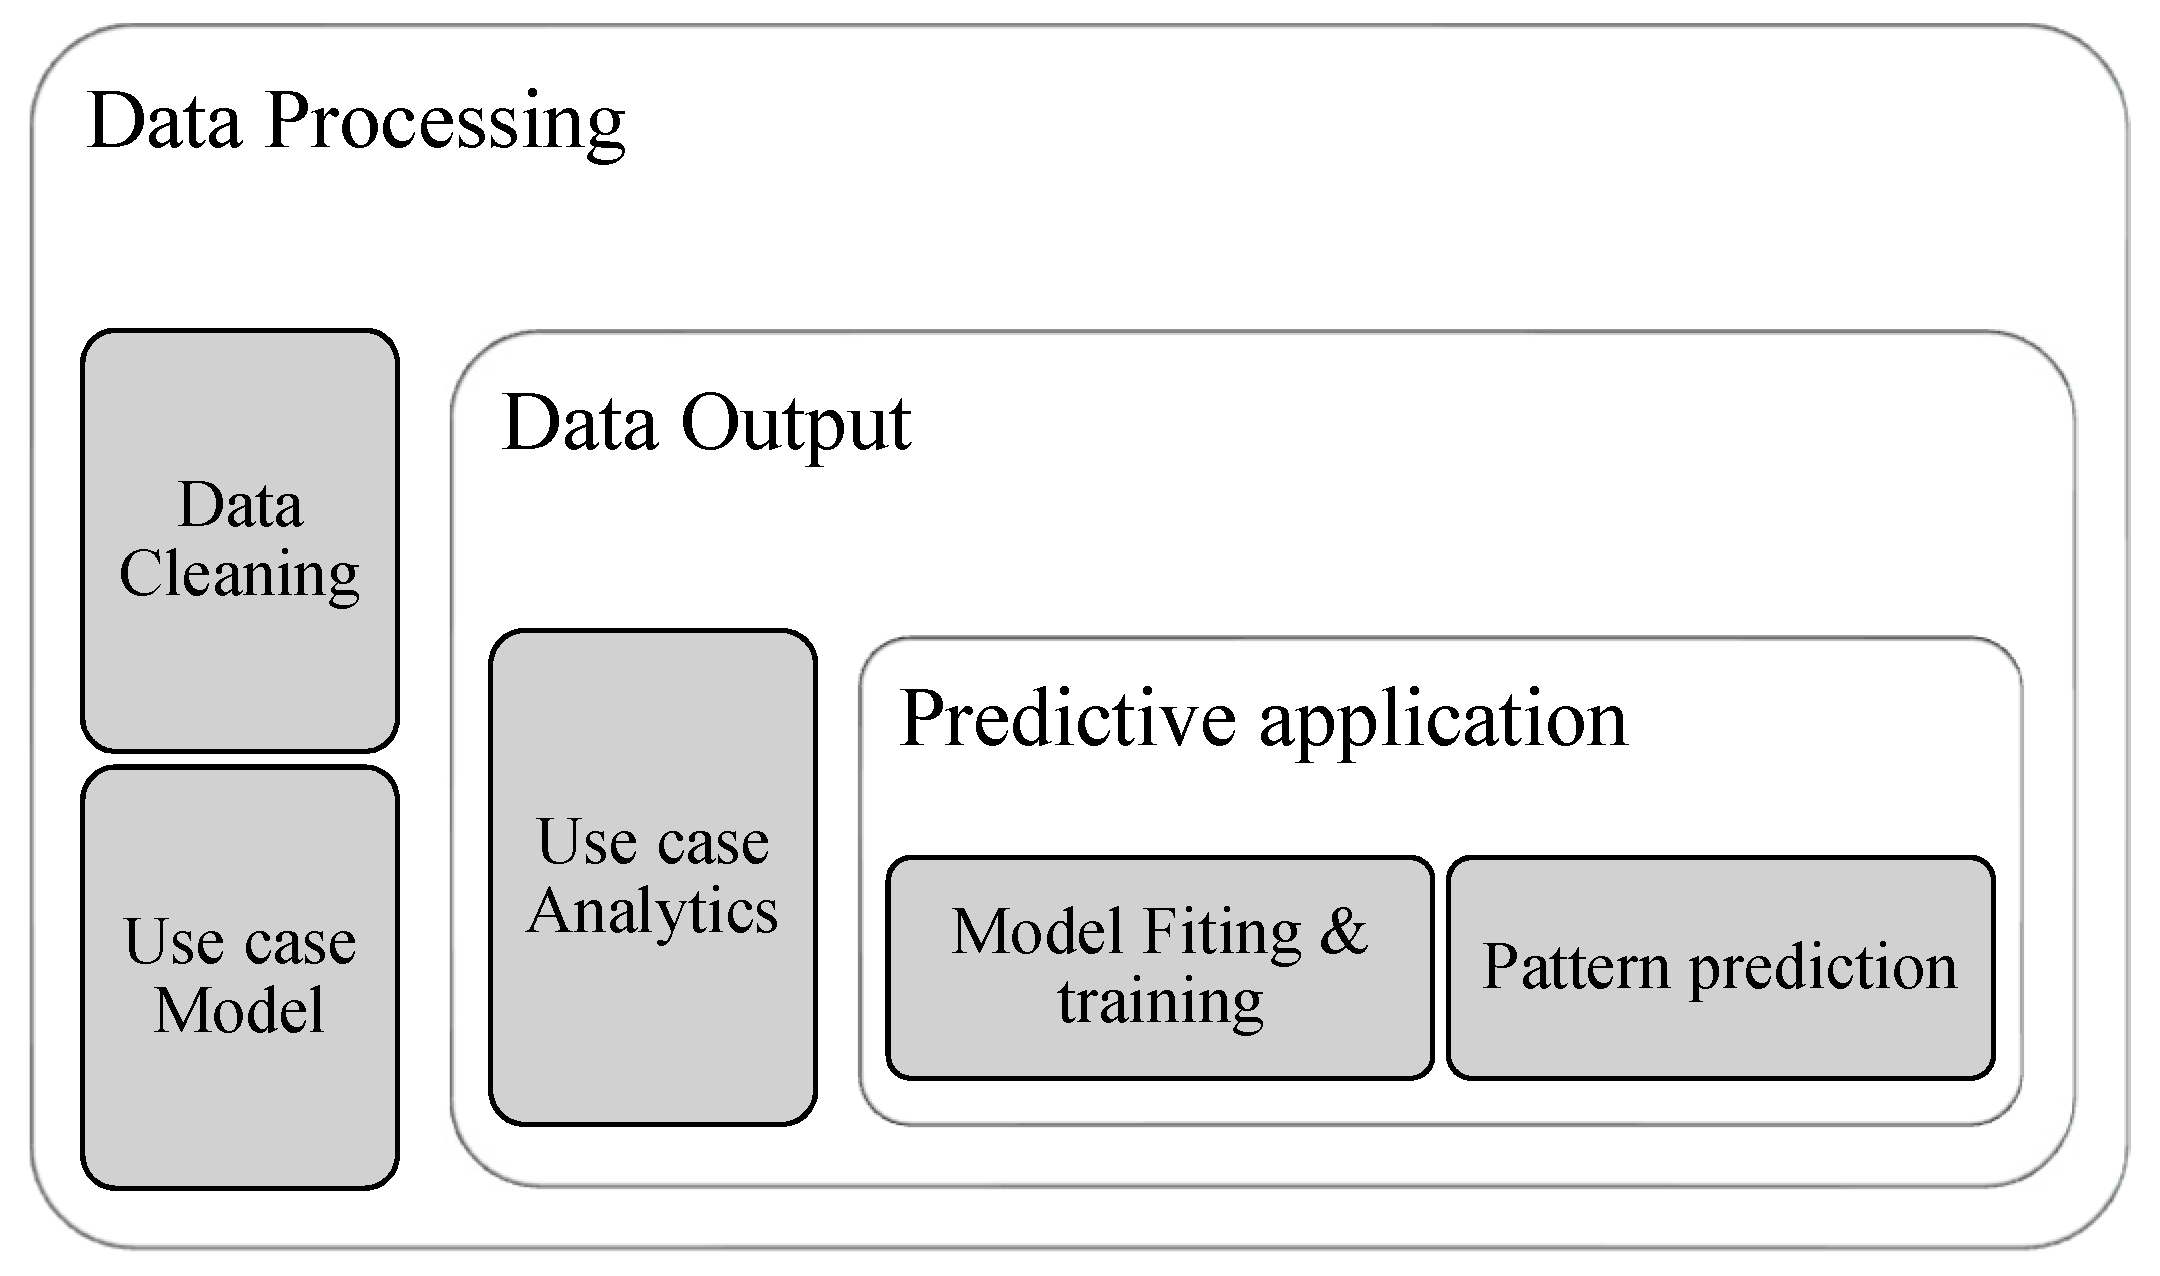
Figure 3 illustrates the methodology used in the study. Three significant steps were taken to complete the experiment. Data preprocessing was done during the experiment setup. The data processing step included data cleaning and understanding the variables and the definition of the use case model. The data output step embedded the designation of key performance indicators and user rules that should be applied to the analytics results. Finally, the predictive application step included short exploratory data analysis, data training, model fitting, and behavior prediction.
In the experiment, we categorized devices by manufacturer, model, and type based on their performance, defined through data KPIs, to determine the impact of traffic in the network.
6. Experiment Setup
In this experiment, we collected five days of data from a mobile operator through port mirroring on one Gn interface link (on the GGSN) using Wireshark. The application runs on a Linux Ubuntu laptop with 16GB of RAM, an i7 processing Core, and 1 TB of storage. The sniffed packet was analyzed and filtered by a TAC (Type Allocation Code) device. The TAC device was correlated with the IMEI database to extract the device type, manufacturer, and model. Due to the privacy of the captured data, sensitive information was hashed. The hashed information included the TAC, IMEI, and model name if necessary.
7. Device Data Processing
The data processing was accomplished using SparkSQL and the R framework for machine learning and predictive analytics [
24]. All unwanted fields were removed in the data cleaning process.
7.1. Understanding the Generated Data
The study concept used two sets of data. One was the user plane information collected from the operator network and the other was the mobile device IMEI database downloaded from kaggle [
25].
Table 1,
Table 2 and
Table 3 describes the processed variables that we used in the experiment.
7.2. Use Case Model
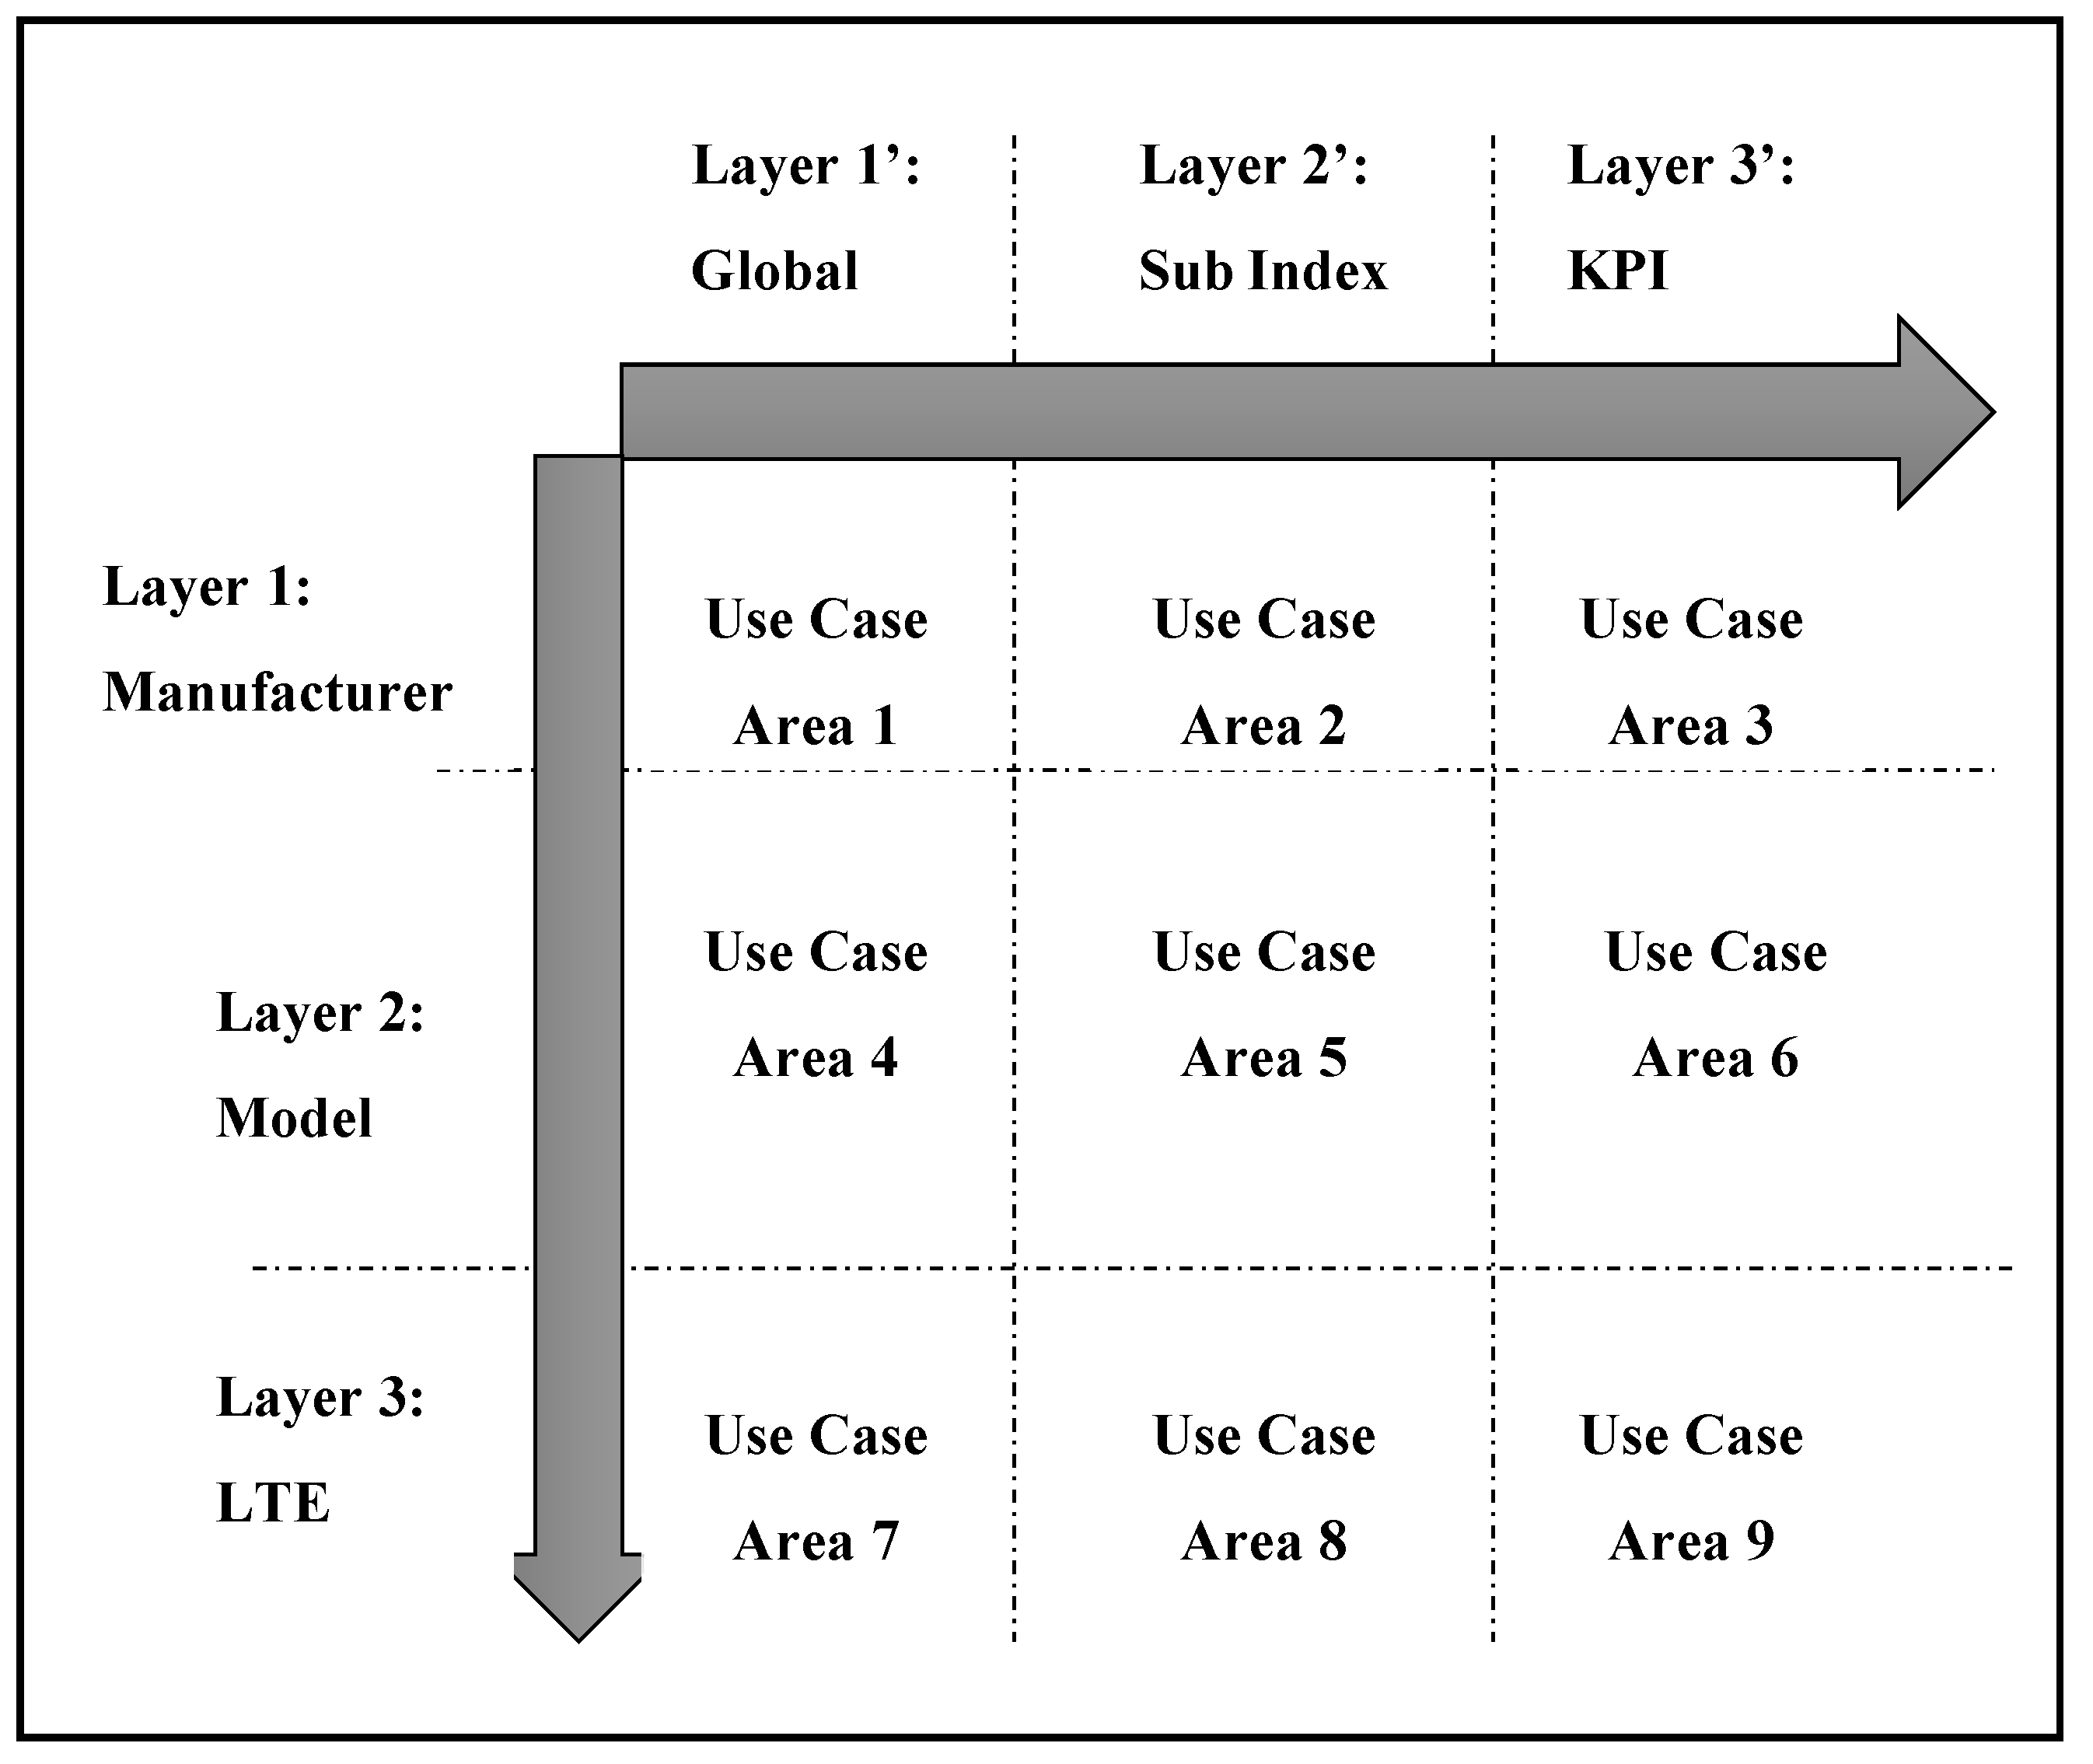
In order to simplify the workflow on the proposed use case model, a hierarchical simulation was performed on the vertical axis, and performance was monitored on the horizontal axis as shown in
Figure 4. A three-layer model was proposed on both the horizontal and vertical axes to manage devices based on specific services.
Every use case is a result of the analytics done on the datasets taking into consideration the position of the use case compared to the horizontal and vertical axis. The definition of a use case is not standardized by any organization. However, in the proposed model for device analytics, we can see that, for three-layer horizontal and vertical axes, we deduced nine use cases.
Let
be the number of vertical layers and
the number of horizontal layers. The number of use cases that we can build from the system,
, is provided by a simple equation:
Horizontal Layers: The horizontal layers aim to provide performance indicators. The concept of the global index (GI) is invoked to address different classes of users. Key parameter indicators are aggregated to form a key quality index.
Vertical Layers: The vertical layers categorize the device and provide a drill-down mechanism from manufacturing to models. In this case, network operators can identify manufacturers or devices with poor performance.
8. Use Case Output
Based on the model proposed during the experiment, the device performance use cases are presented in this section along with the analytics. The experimented results are provided in the form of reports.
8.1. Use Case Layer 1: Performance Index per Manufacturer
Situated in position
of the analytics model, where
is Vertical Axis Element 1, and
is Horizontal Axis Element 1, Use Case 1 provides the key quality index per manufacturer in the network.
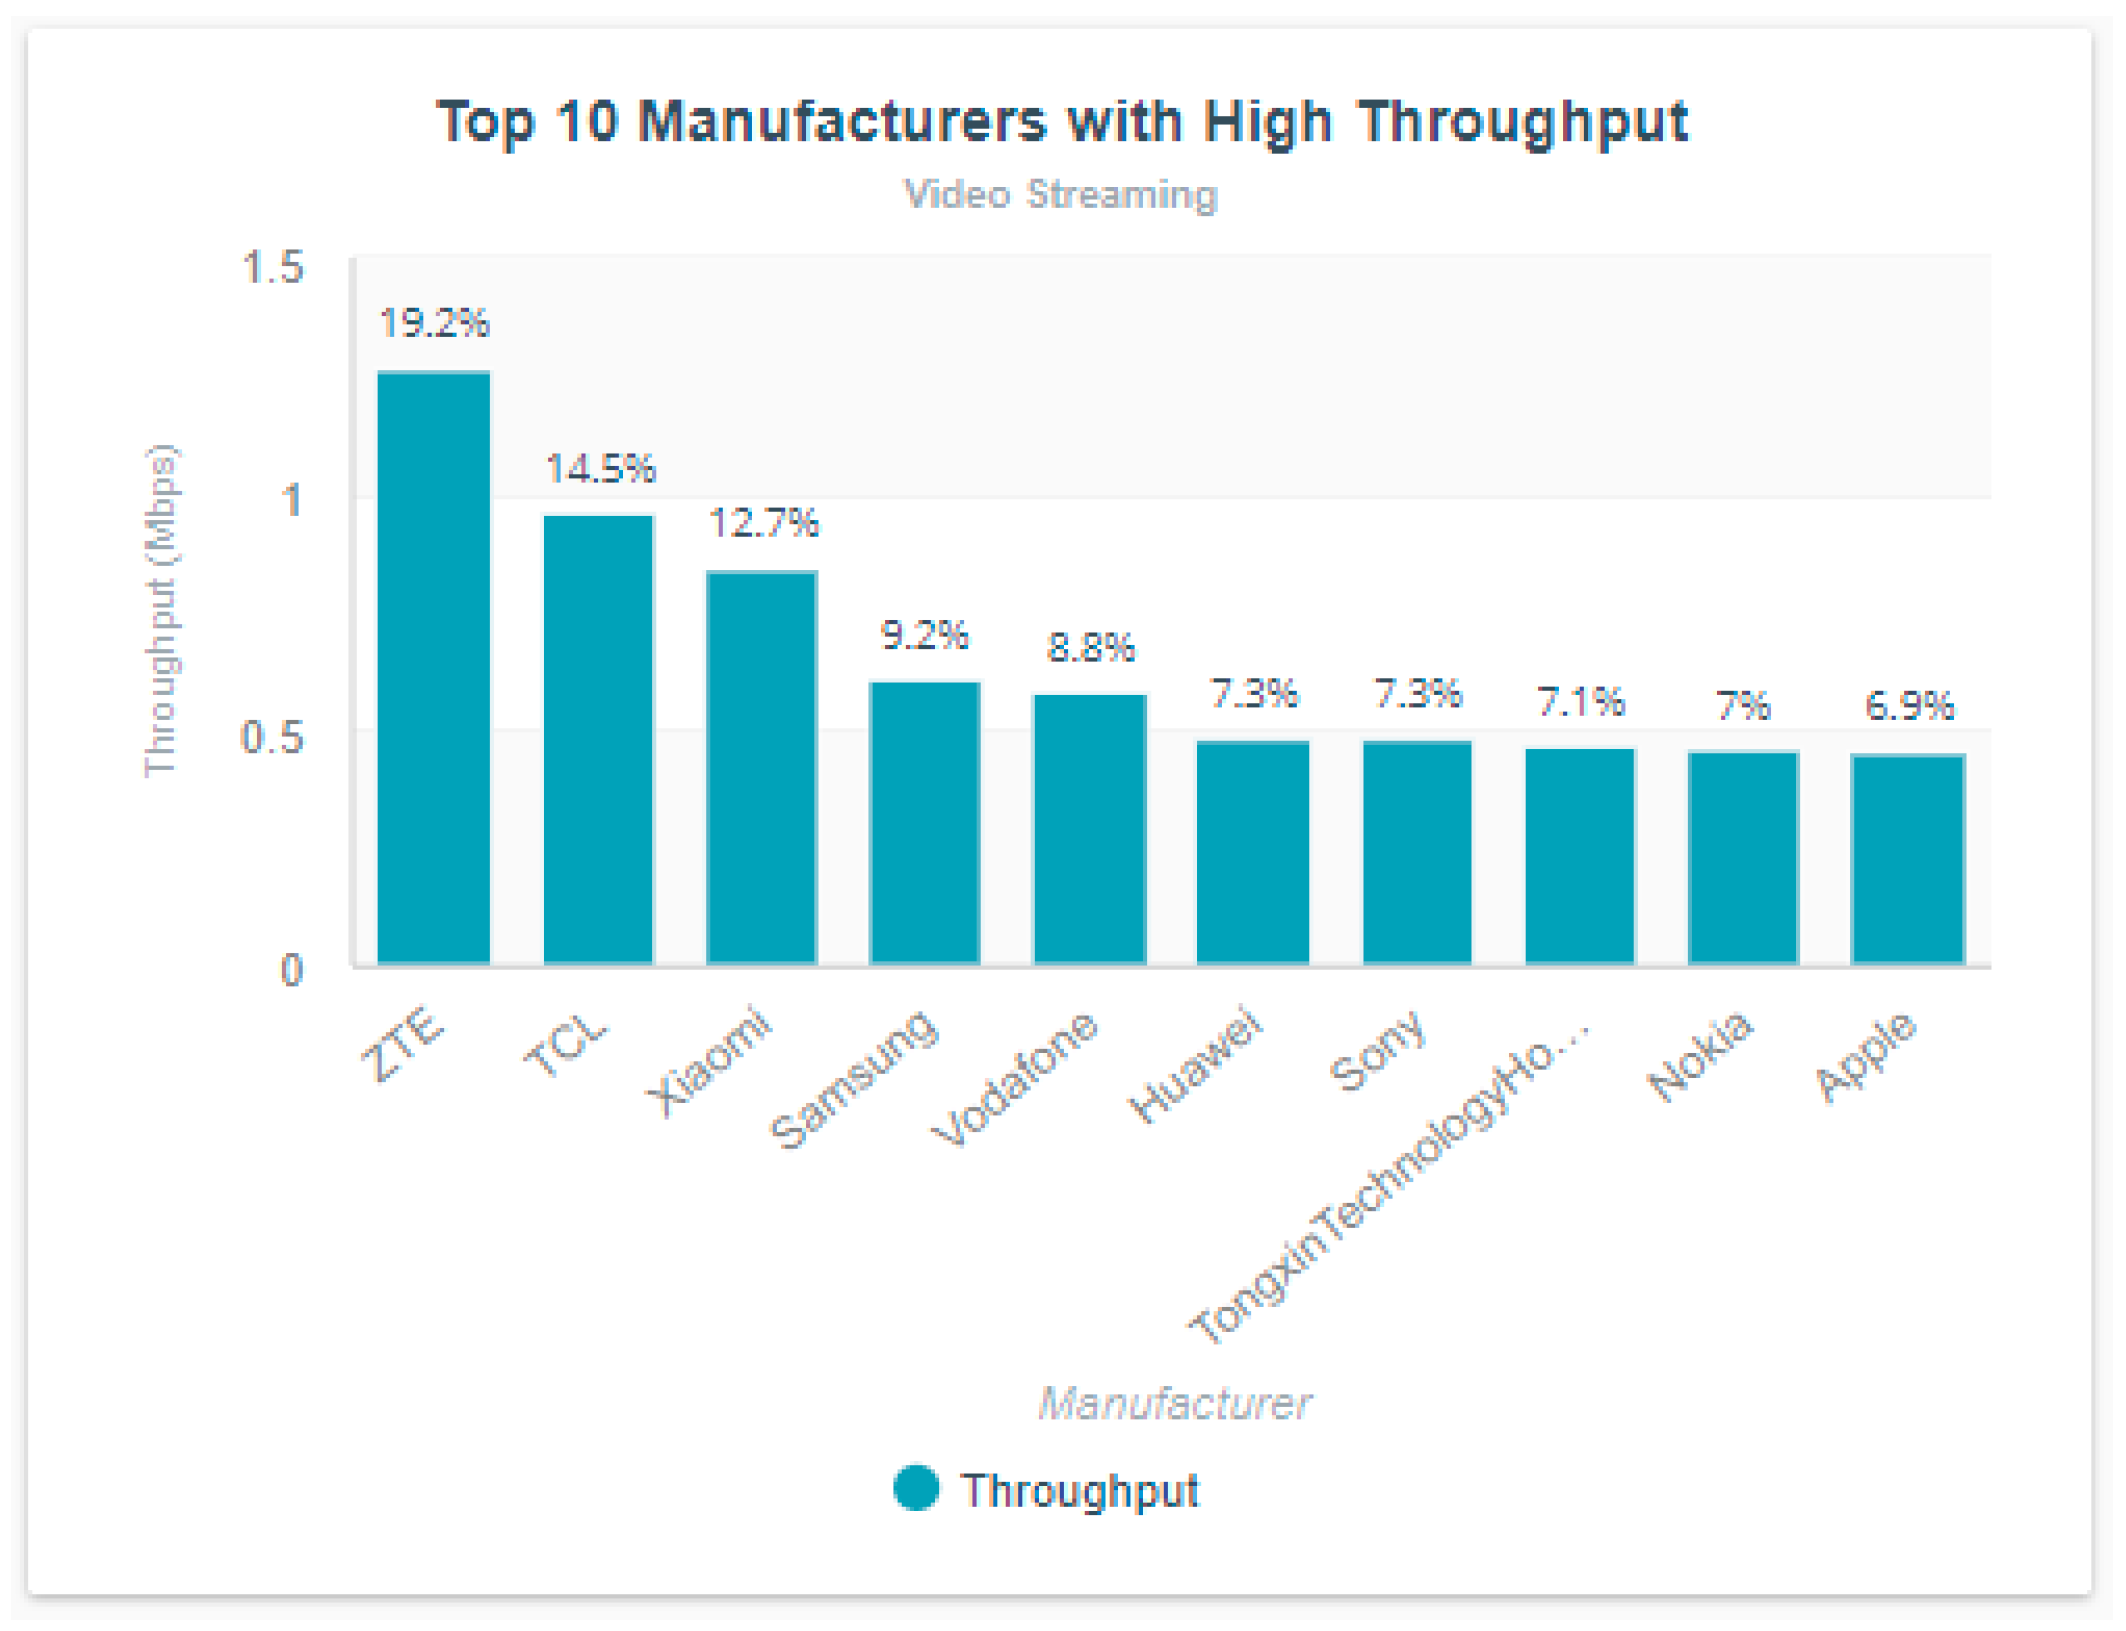
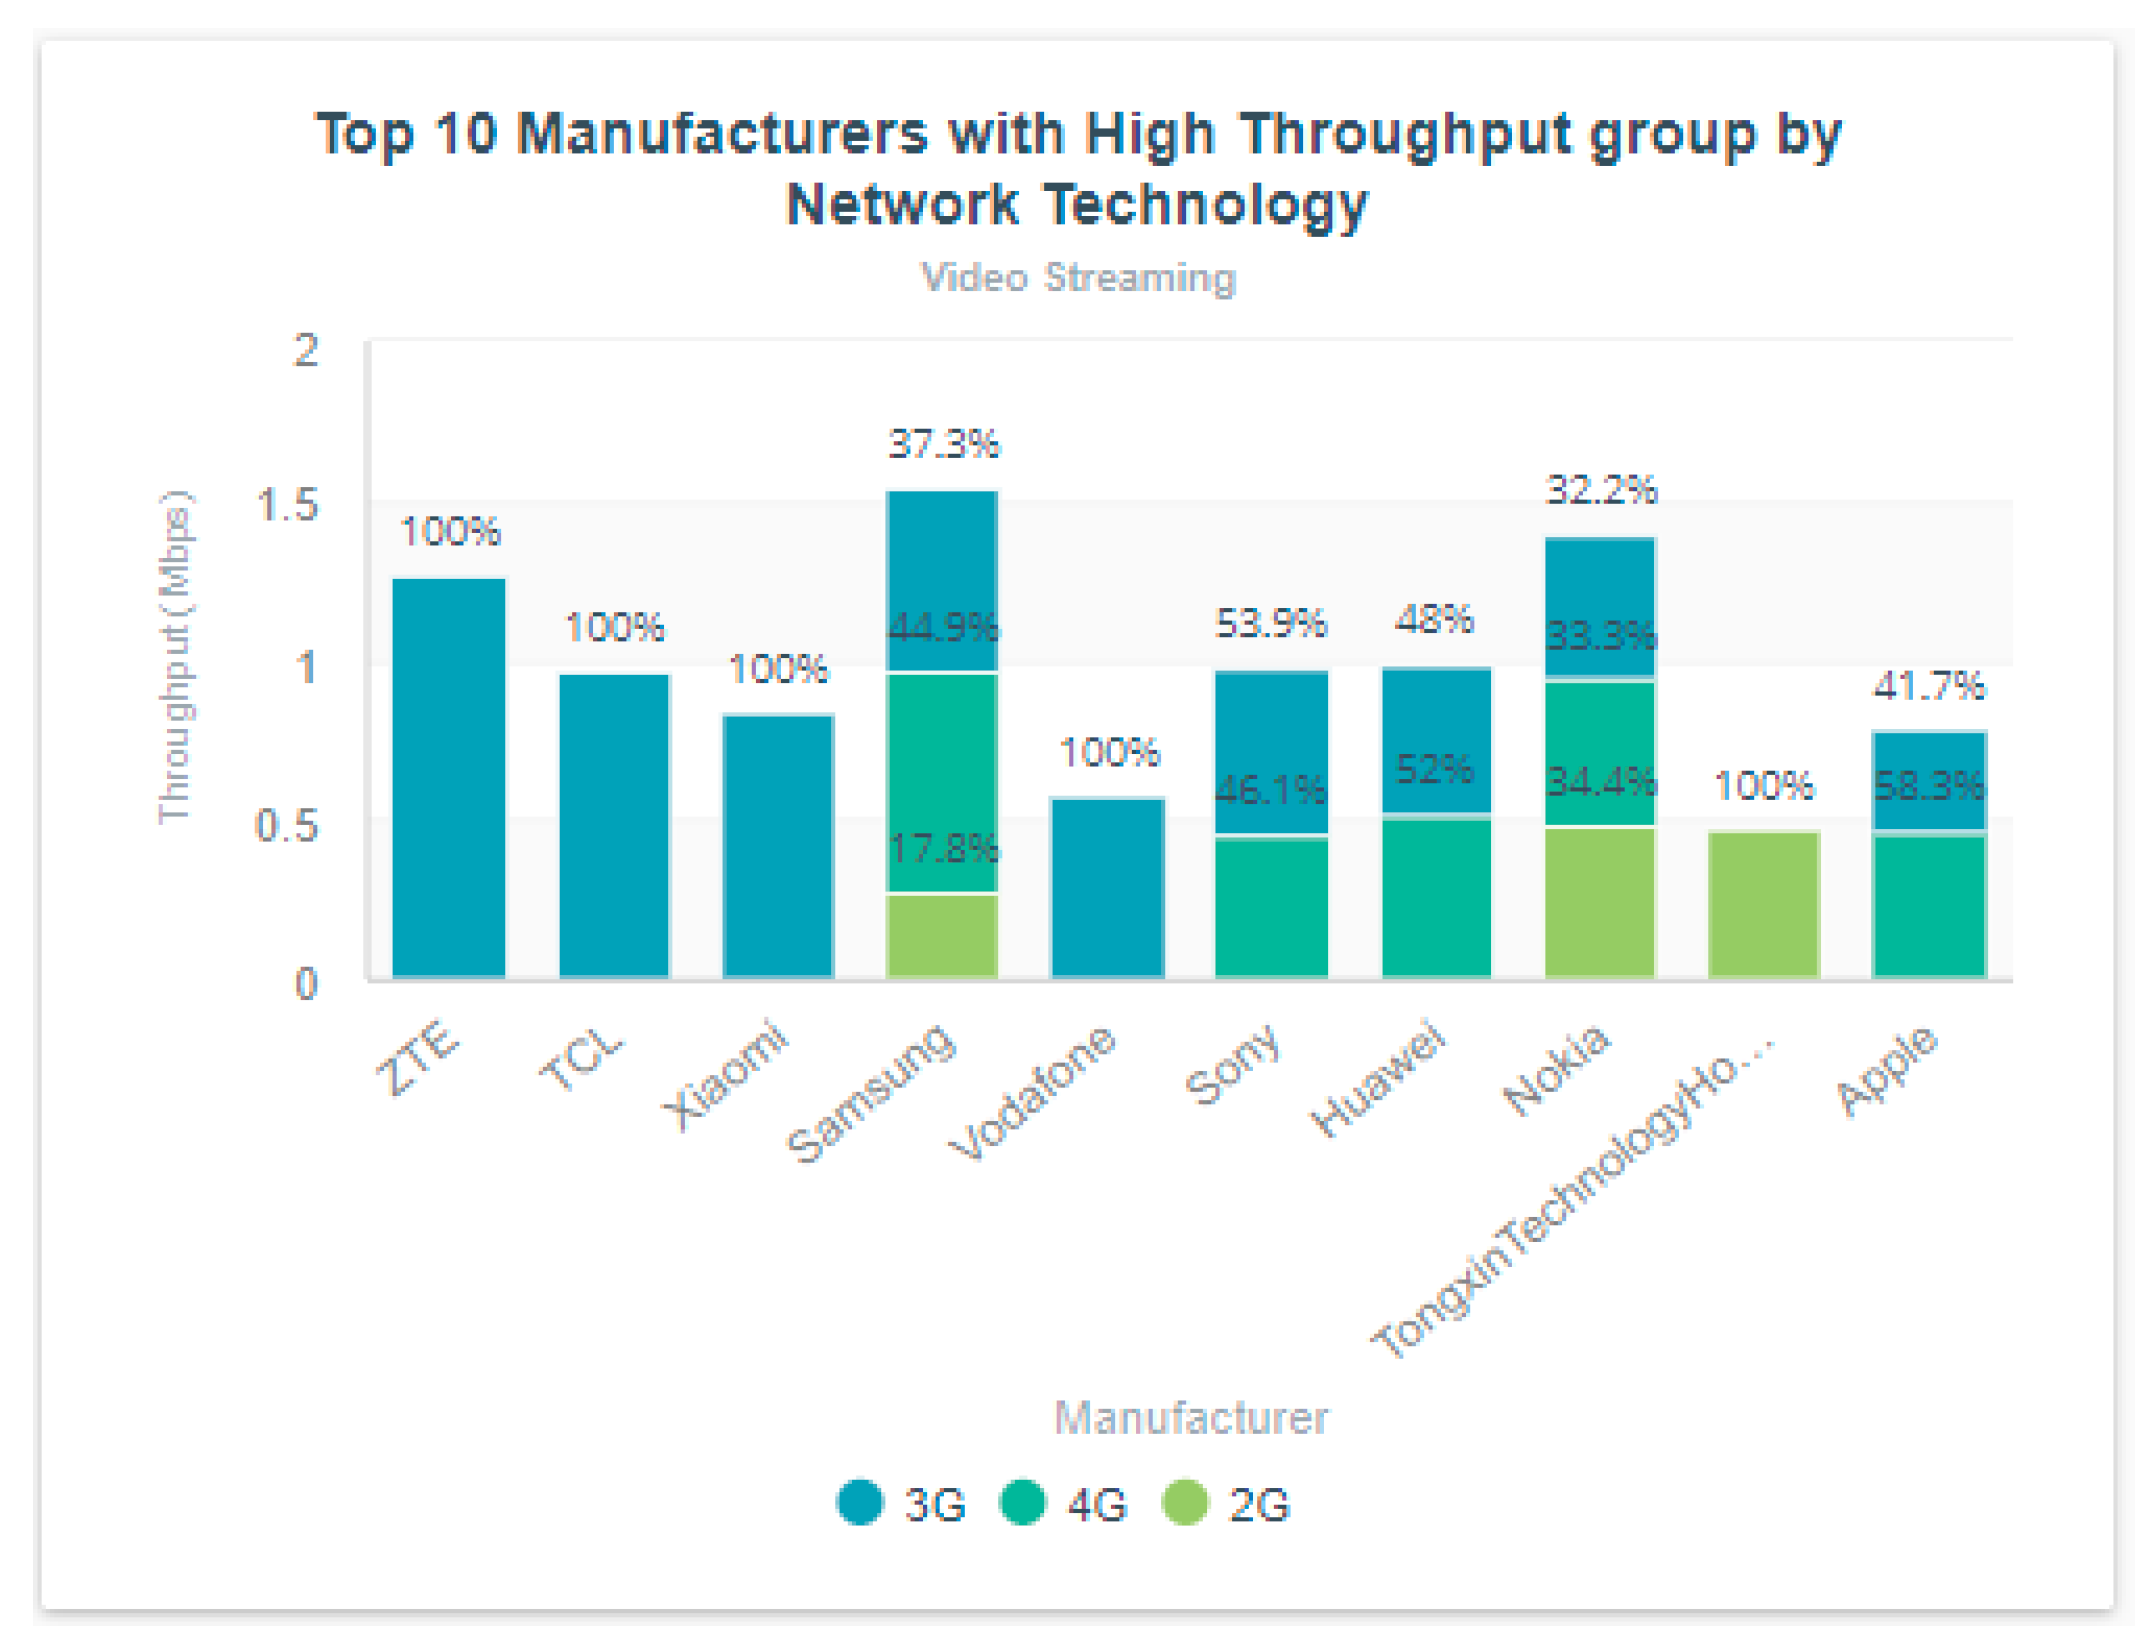
Figure 5 outputs the results of the analysis. Only one service is considered in this case: video-streaming applications.
The above figure includes all the devices grouped by manufacturer and all the technologies included. The graph is influenced by the technology’s coverage in the area where the network data is provided. The analytics shows that ZTE-based devices have the highest throughput when it comes to video streaming, representing 19.2% of all high-throughput devices. Popular manufacturers, including Samsung, Apple, Huawei, and Nokia appear in the report.
In
Figure 6, a similar performance is shown per manufacturer, now grouped by technology. In this case, the analyst or network operator can see the main contributor by network technology. LTE is currently the most recent deployed cellular technology in the market. For each manufacturer, the traffic distribution per technology is highlighted. The analysis reveals that most of the ZTE M2M traffic appears on 3G technology only. Samsung and Nokia have a percentage of traffic on 2G technology. Huawei and Apple devices benefit more from 4G/LTE with over 50% of video-related activities performed on 4G.
8.2. Use Case Layer 2: Performance Index per Device Model
Layer 2 breaks down the analysis per device model complementing Layer 1 analysis. The analysis allows the user to pinpoint the device model performing well or performing poorly based on the defined KPIs.
Table 4 presents the device model ranked by a descendent instantaneous throughput value. Three classes of devices appear in the analytics report: smartphones, dongles, and tablets.
Table 5 presents the device model ranked by descendent response delay. It is not ideal for sensitive systems such as health monitoring or HD-video streaming devices.
8.3. Use Case Layer 3: Performance Index per Technology
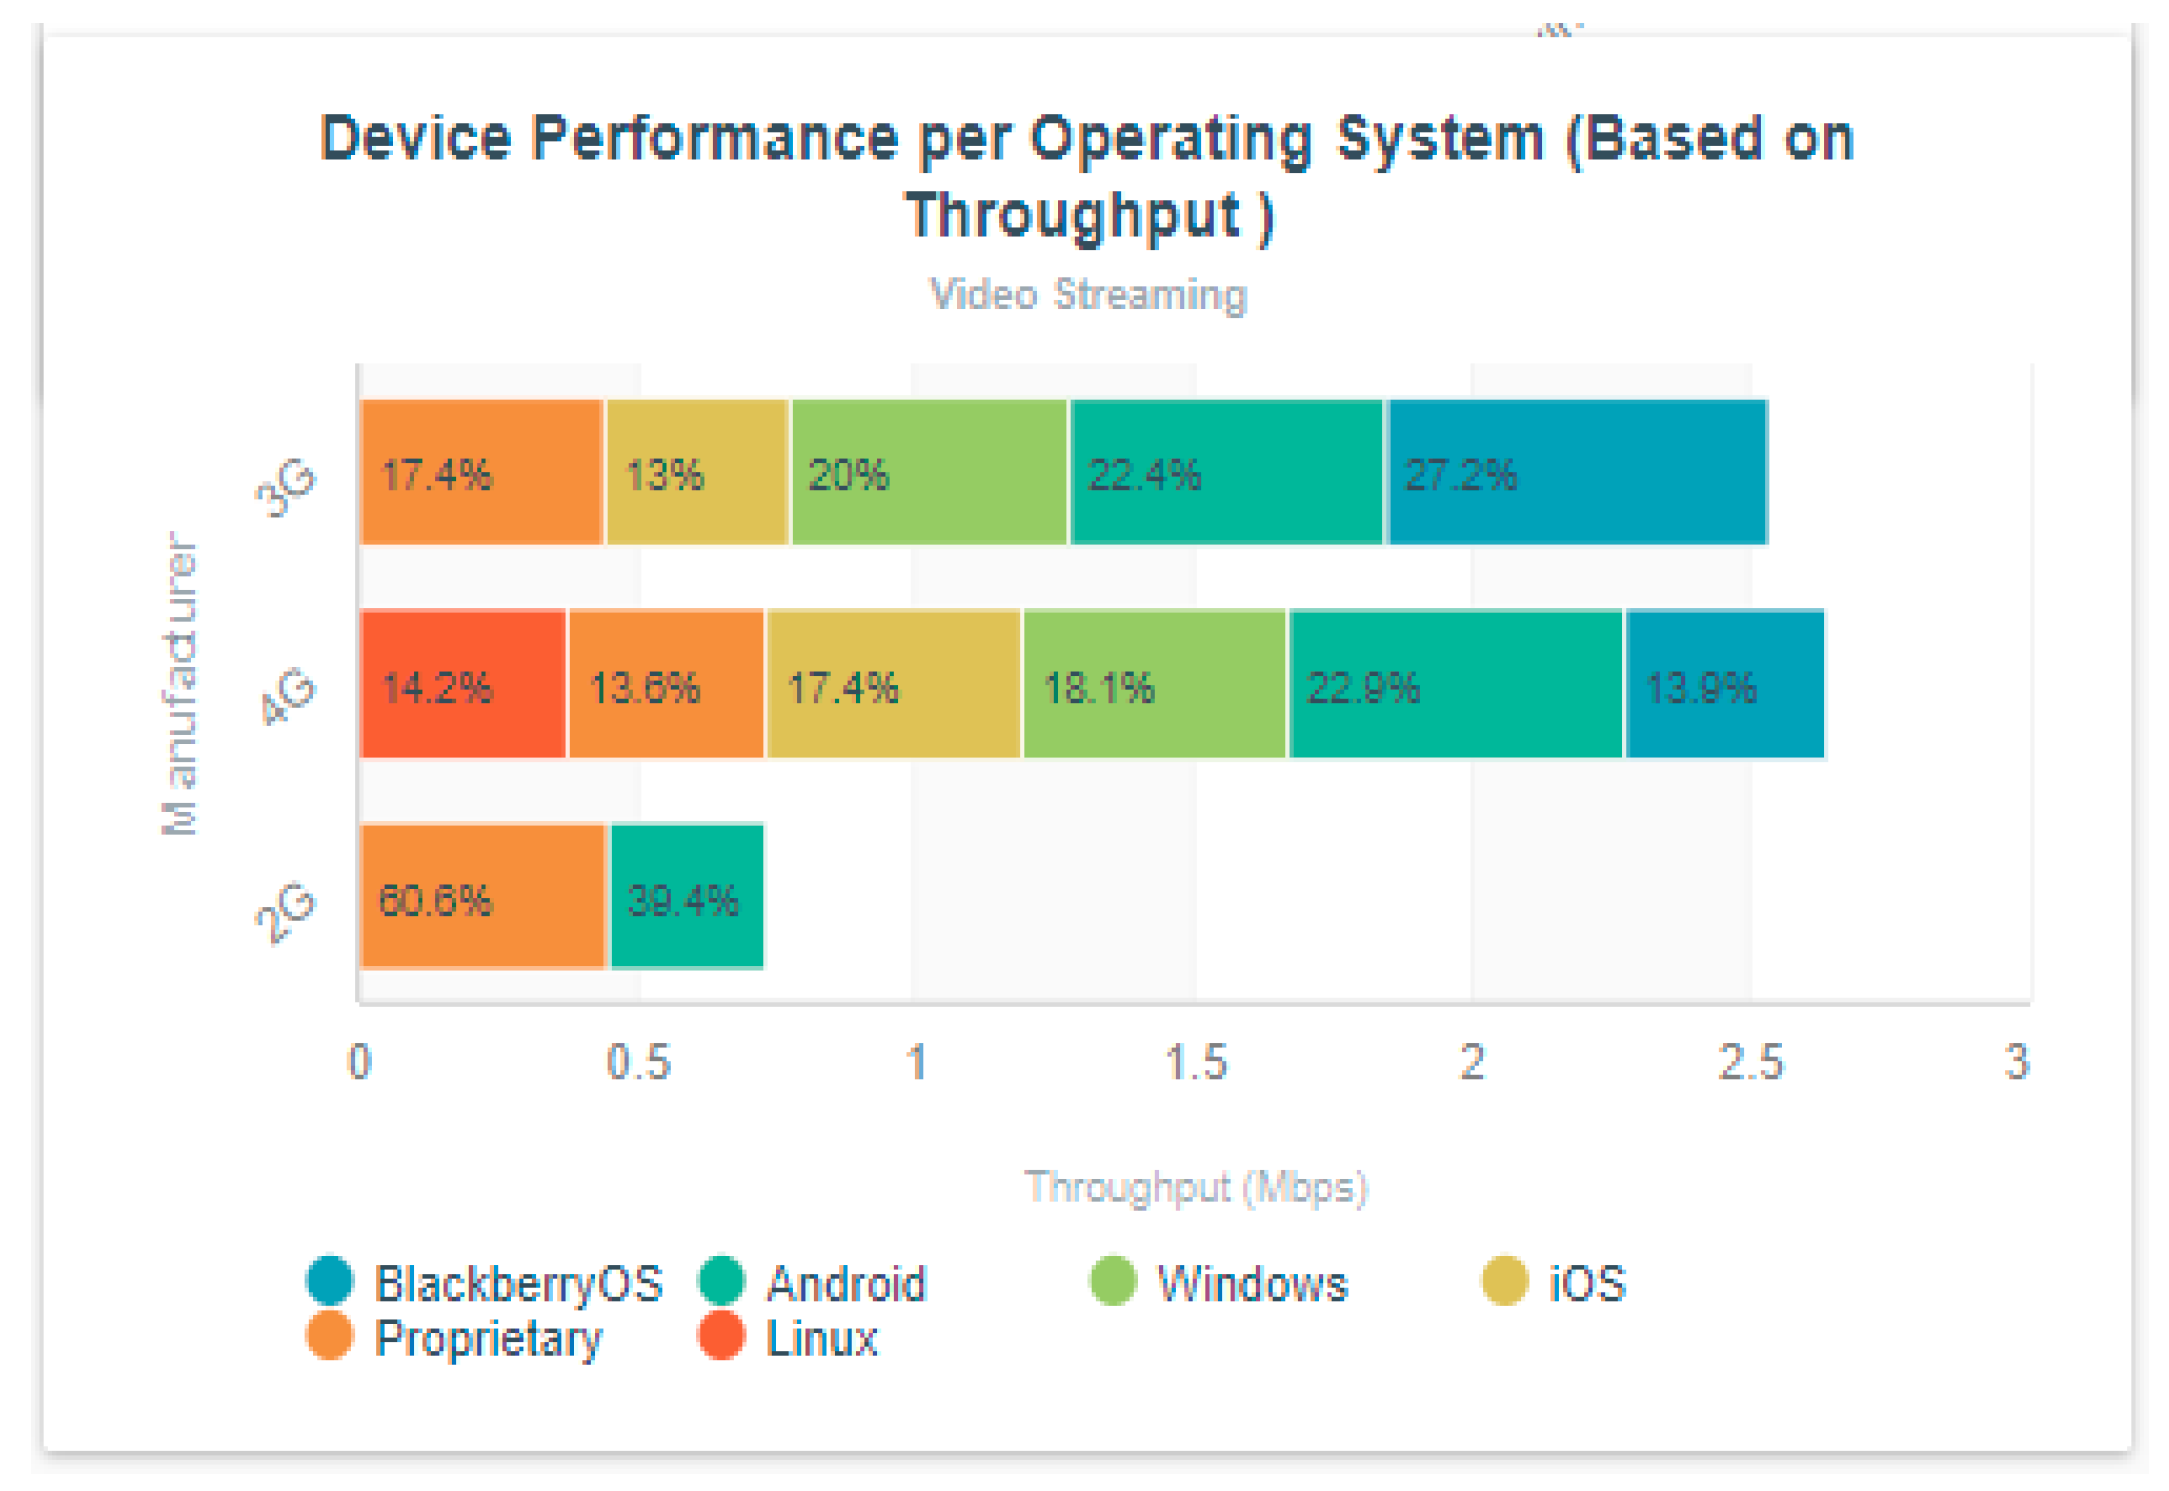
Different network technologies provide different network experiences. It is, therefore, essential to perform device analytics based on technology and distributed by the used operating systems.
In
Figure 7, the analytics result is based on the throughput. We can see that, for 4G technology, Android-based devices present high throughput in video streaming applications, followed by iOS devices. However, any combination of KPIs can be used.
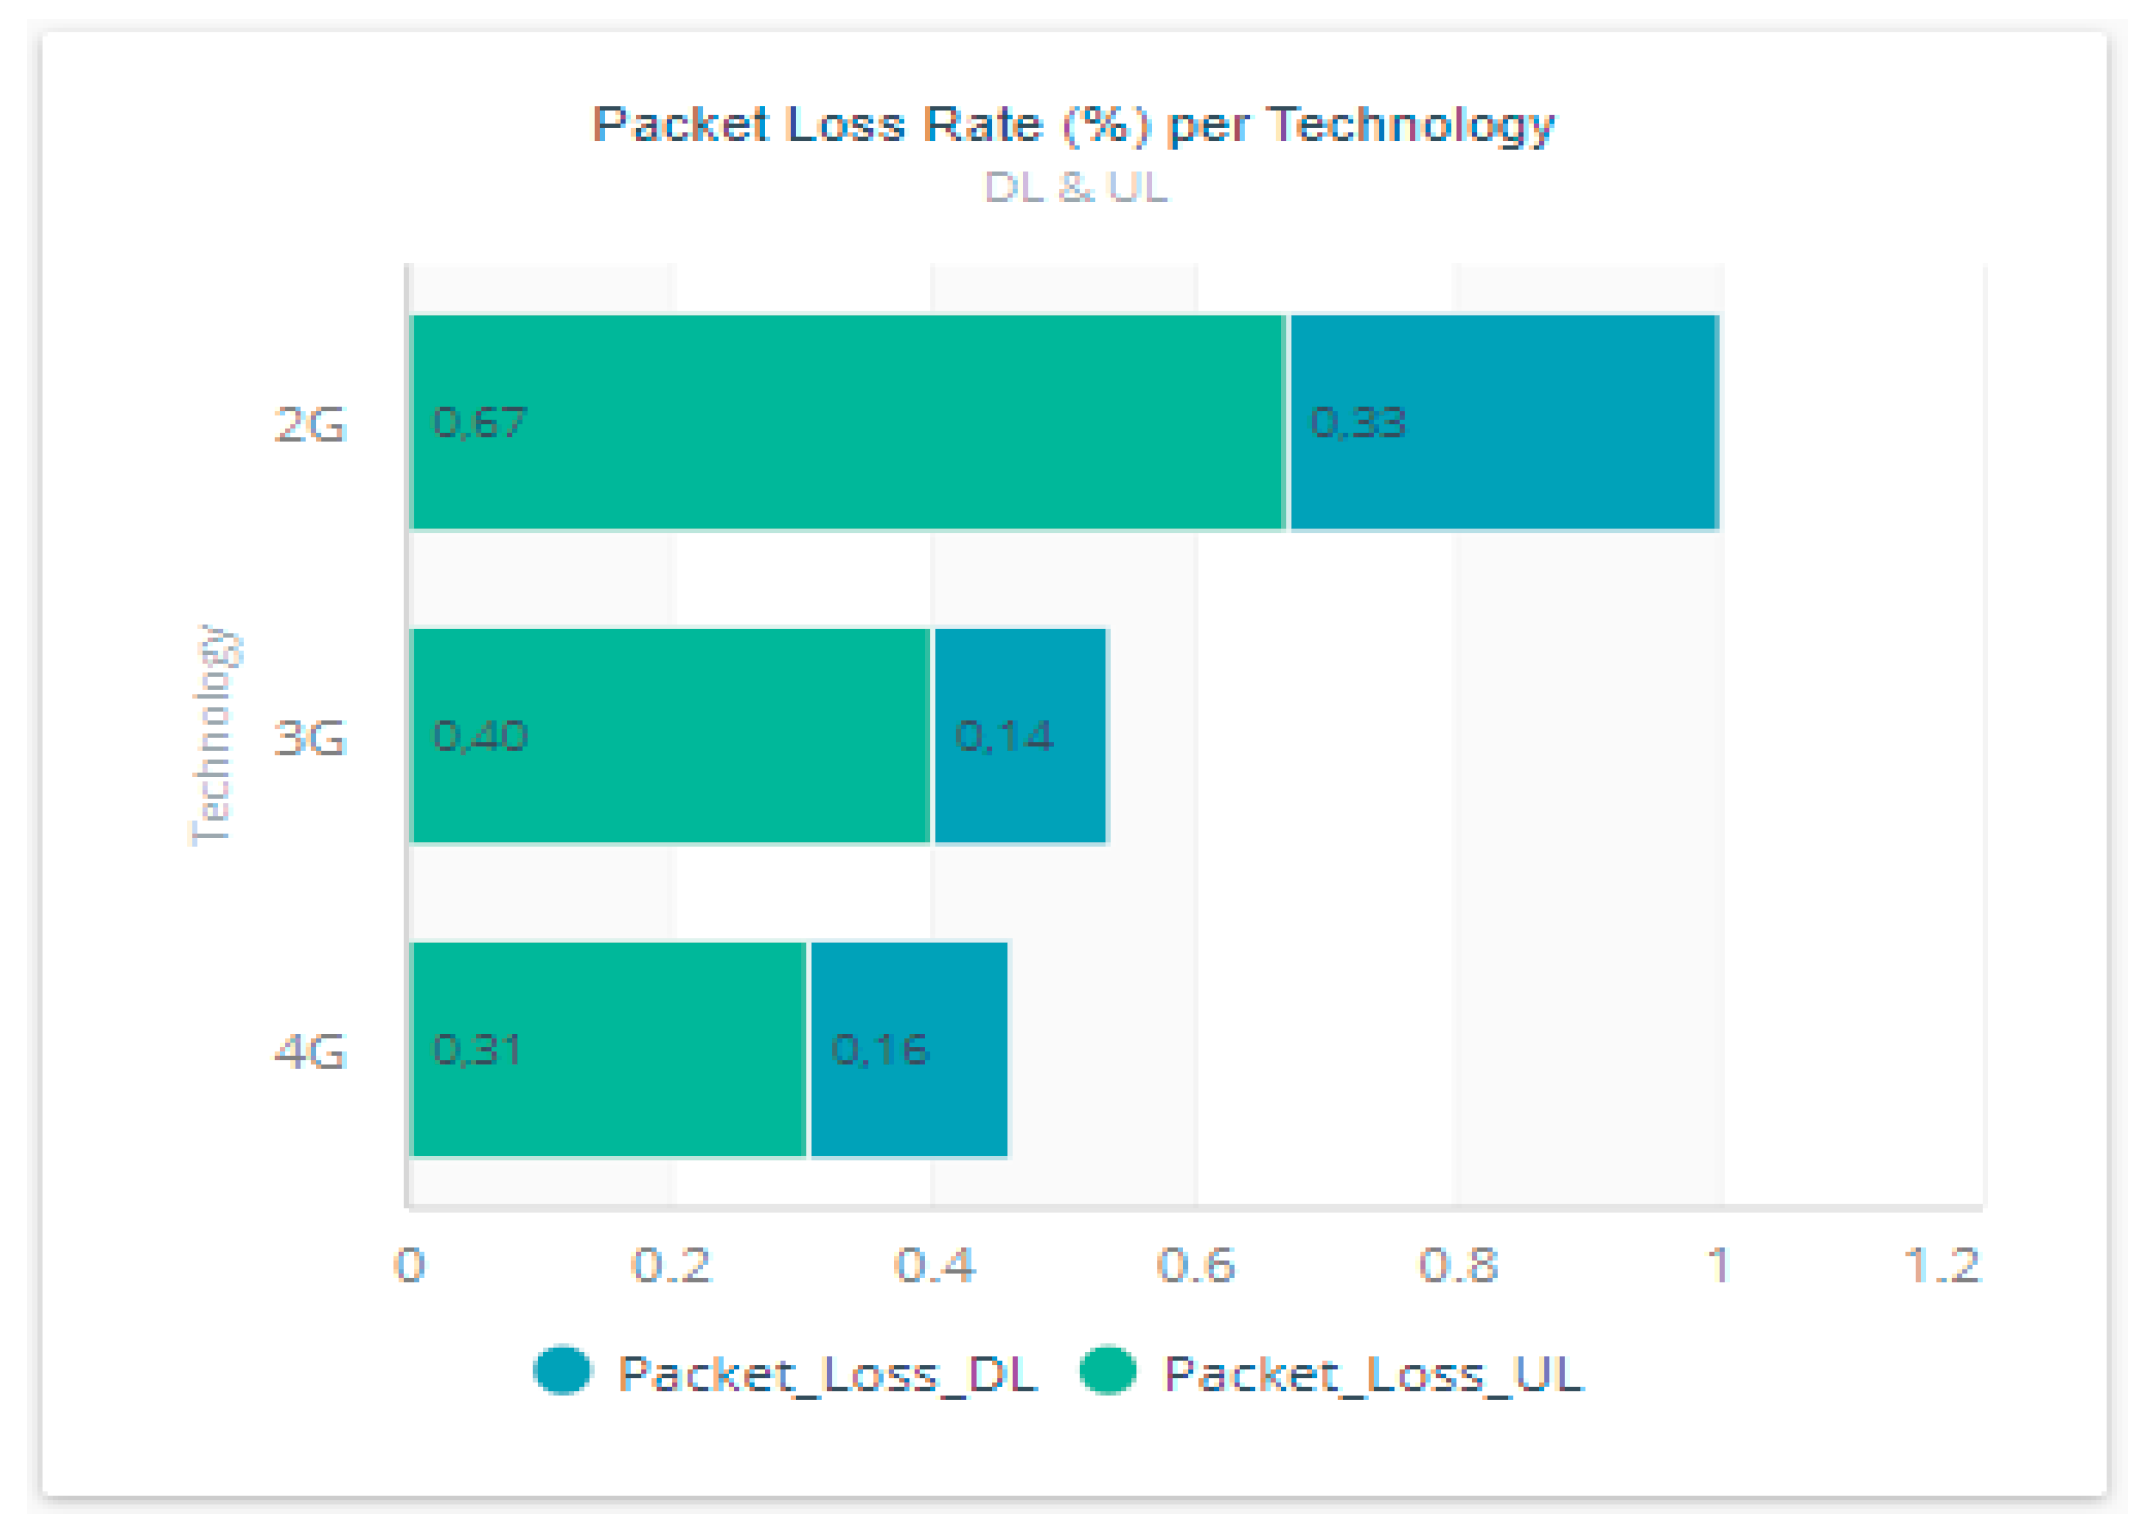
In
Figure 8, the analytics is based on packet loss to determine which technology is susceptible to packet loss. High packet loss is registered on the uplink on both technologies. In the graph, we can see that there is a high rate of packet loss on the uplink than on the downlink. M2M applications use more uplink stream than downlink—hence the need to optimize uplink transmission.
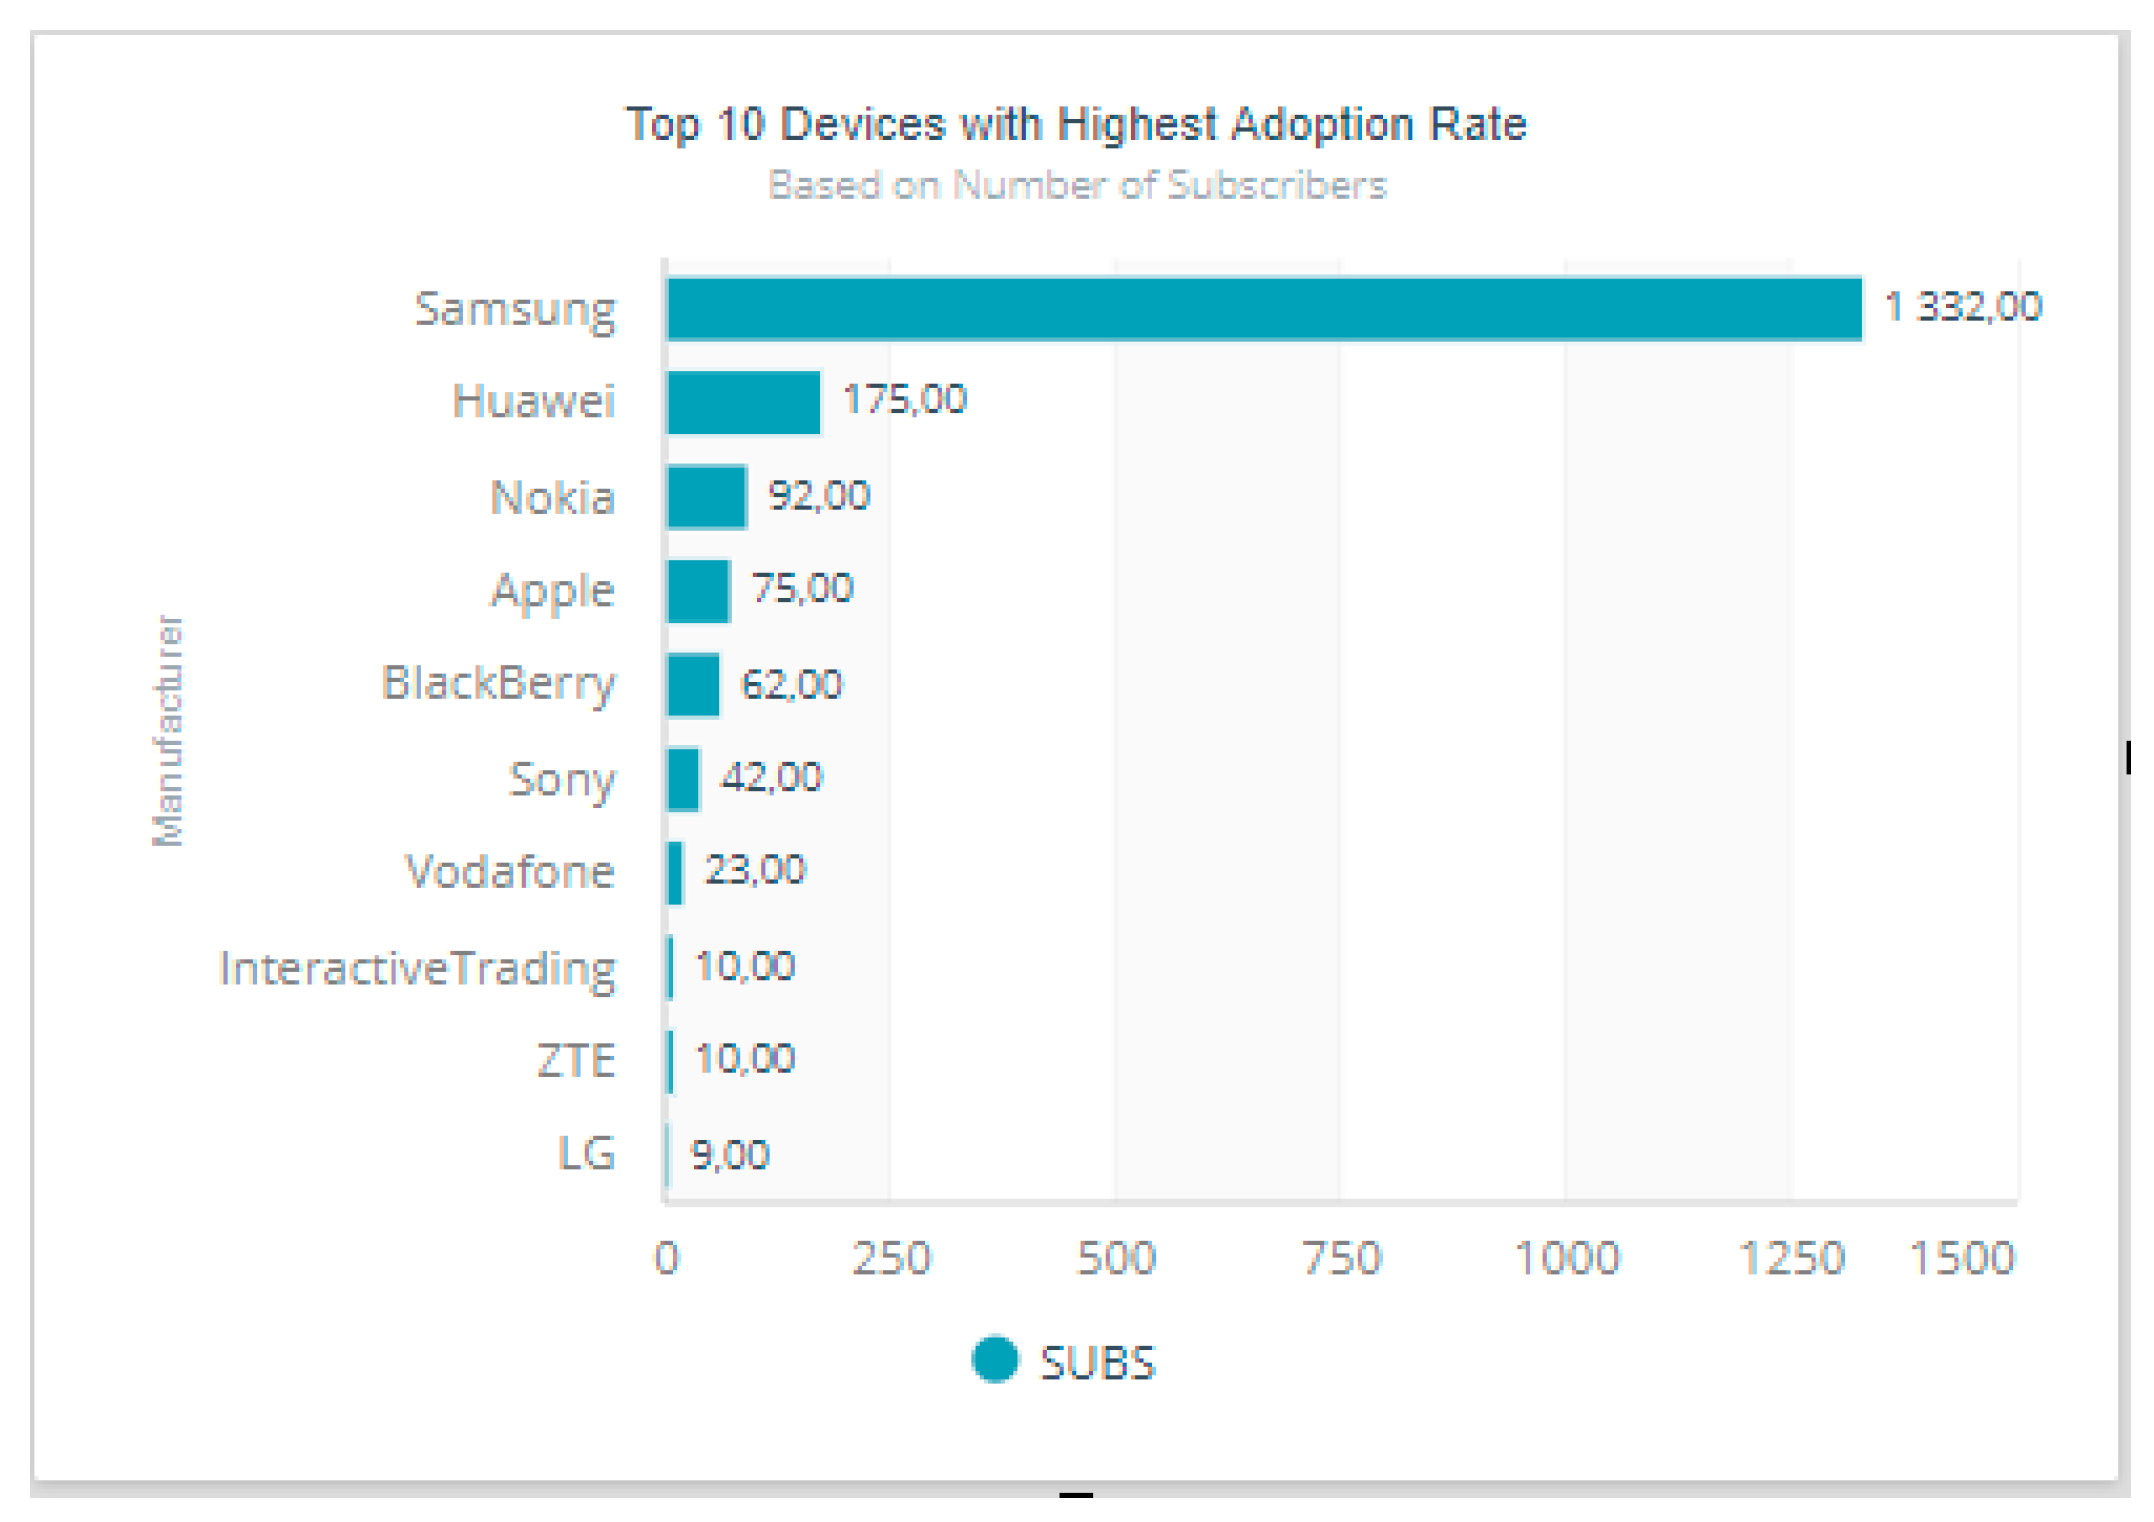
Another aspect of device analytics is to help the operators in expanding the competitive force into the market. The adoption of specific or individual devices is presented in
Figure 9, which displays the number of subscribers possessing devices of a certain manufacturer. The top manufacturer retains many more subscribers than any other.
Samsung has more subscribers as shown in
Figure 9, followed by Huawei, Nokia, and Apple, respectively. Adoption by device type is illustrated in
Figure 10. The most frequently used device type is deduced from the dataset. The most frequently used communicating devices are smartphones, followed by tablets, dongles, and legacy 2G-capable devices.
9. Predictive Analytics for Device Behavior
Machine learning and predictive analytics are becoming common practice in most of the analytics businesses. That is to say, the need to see into the future is crucial. We ran two predictive algorithms, a support vector machine (SVM) and C5.0, on the dataset to determine device models likely to experience performance problems. Predictive algorithms, even with low accuracy, can provide value for businesses.
For this study, we consider, for a good video streaming experience, the following: a 1 Mbps minimum download, an acceptable application delay of 0.5 s, a packet round trip time (RTT) of less than 0.5 s, a packet loss of less than 1%, and a domain name server (DNS) resolution failure rate of less than 2%. The predictive rule is as follows:
if (throughput > 1 Mbps & APPRT<0.5 sec & RTT<0.5 sec & packet_loss < 1% & DER<2%)
{pred_goodPer = 1; //Set the pred_goodPer to 1 if the condition is met.}
else {pred_goodPer = 0; //Set the pred_goodPer to 0 if the condition is not met}
Before applying the rule, we divide the data into training and testing sets. The rule was applied to the training set and evaluated on the testing set. Seventy percent of the data was used for the training set and 30% was used for the testing set. Prediction learning was applied to 3G and 4G technologies, as the data performance of 2G devices is vastly limited by default.
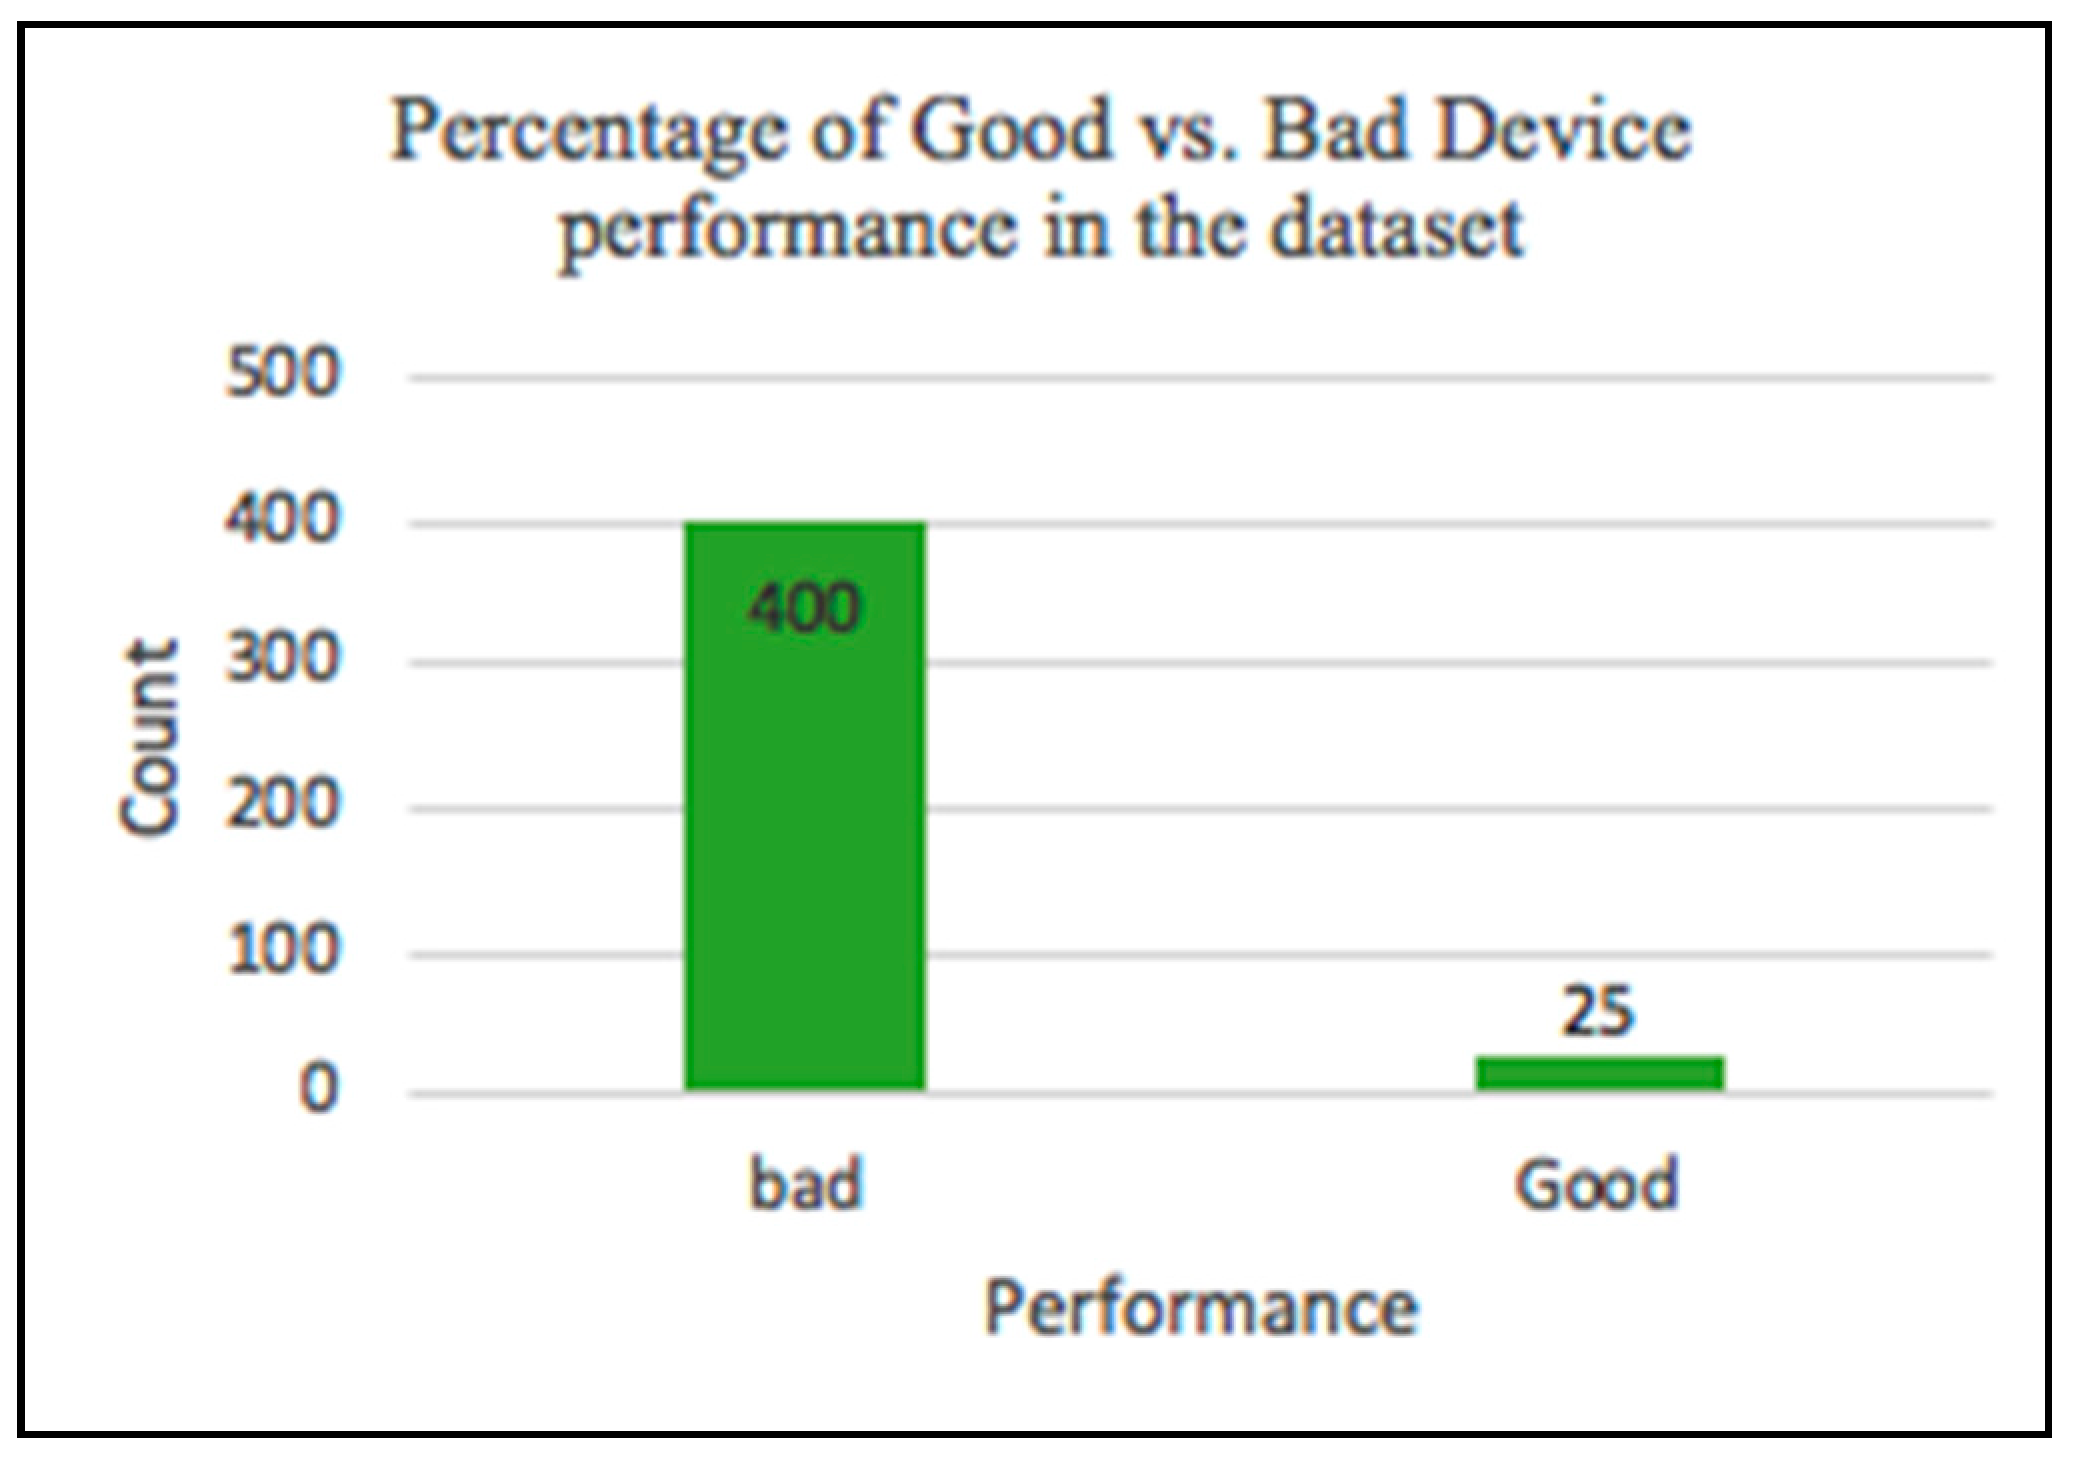
Concise exploratory data analysis, as illustrated in
Figure 11, shows the number of well versus poorly performing devices in the dataset. The rule can be modified based on the tester’s definition of acceptable video quality specifications.
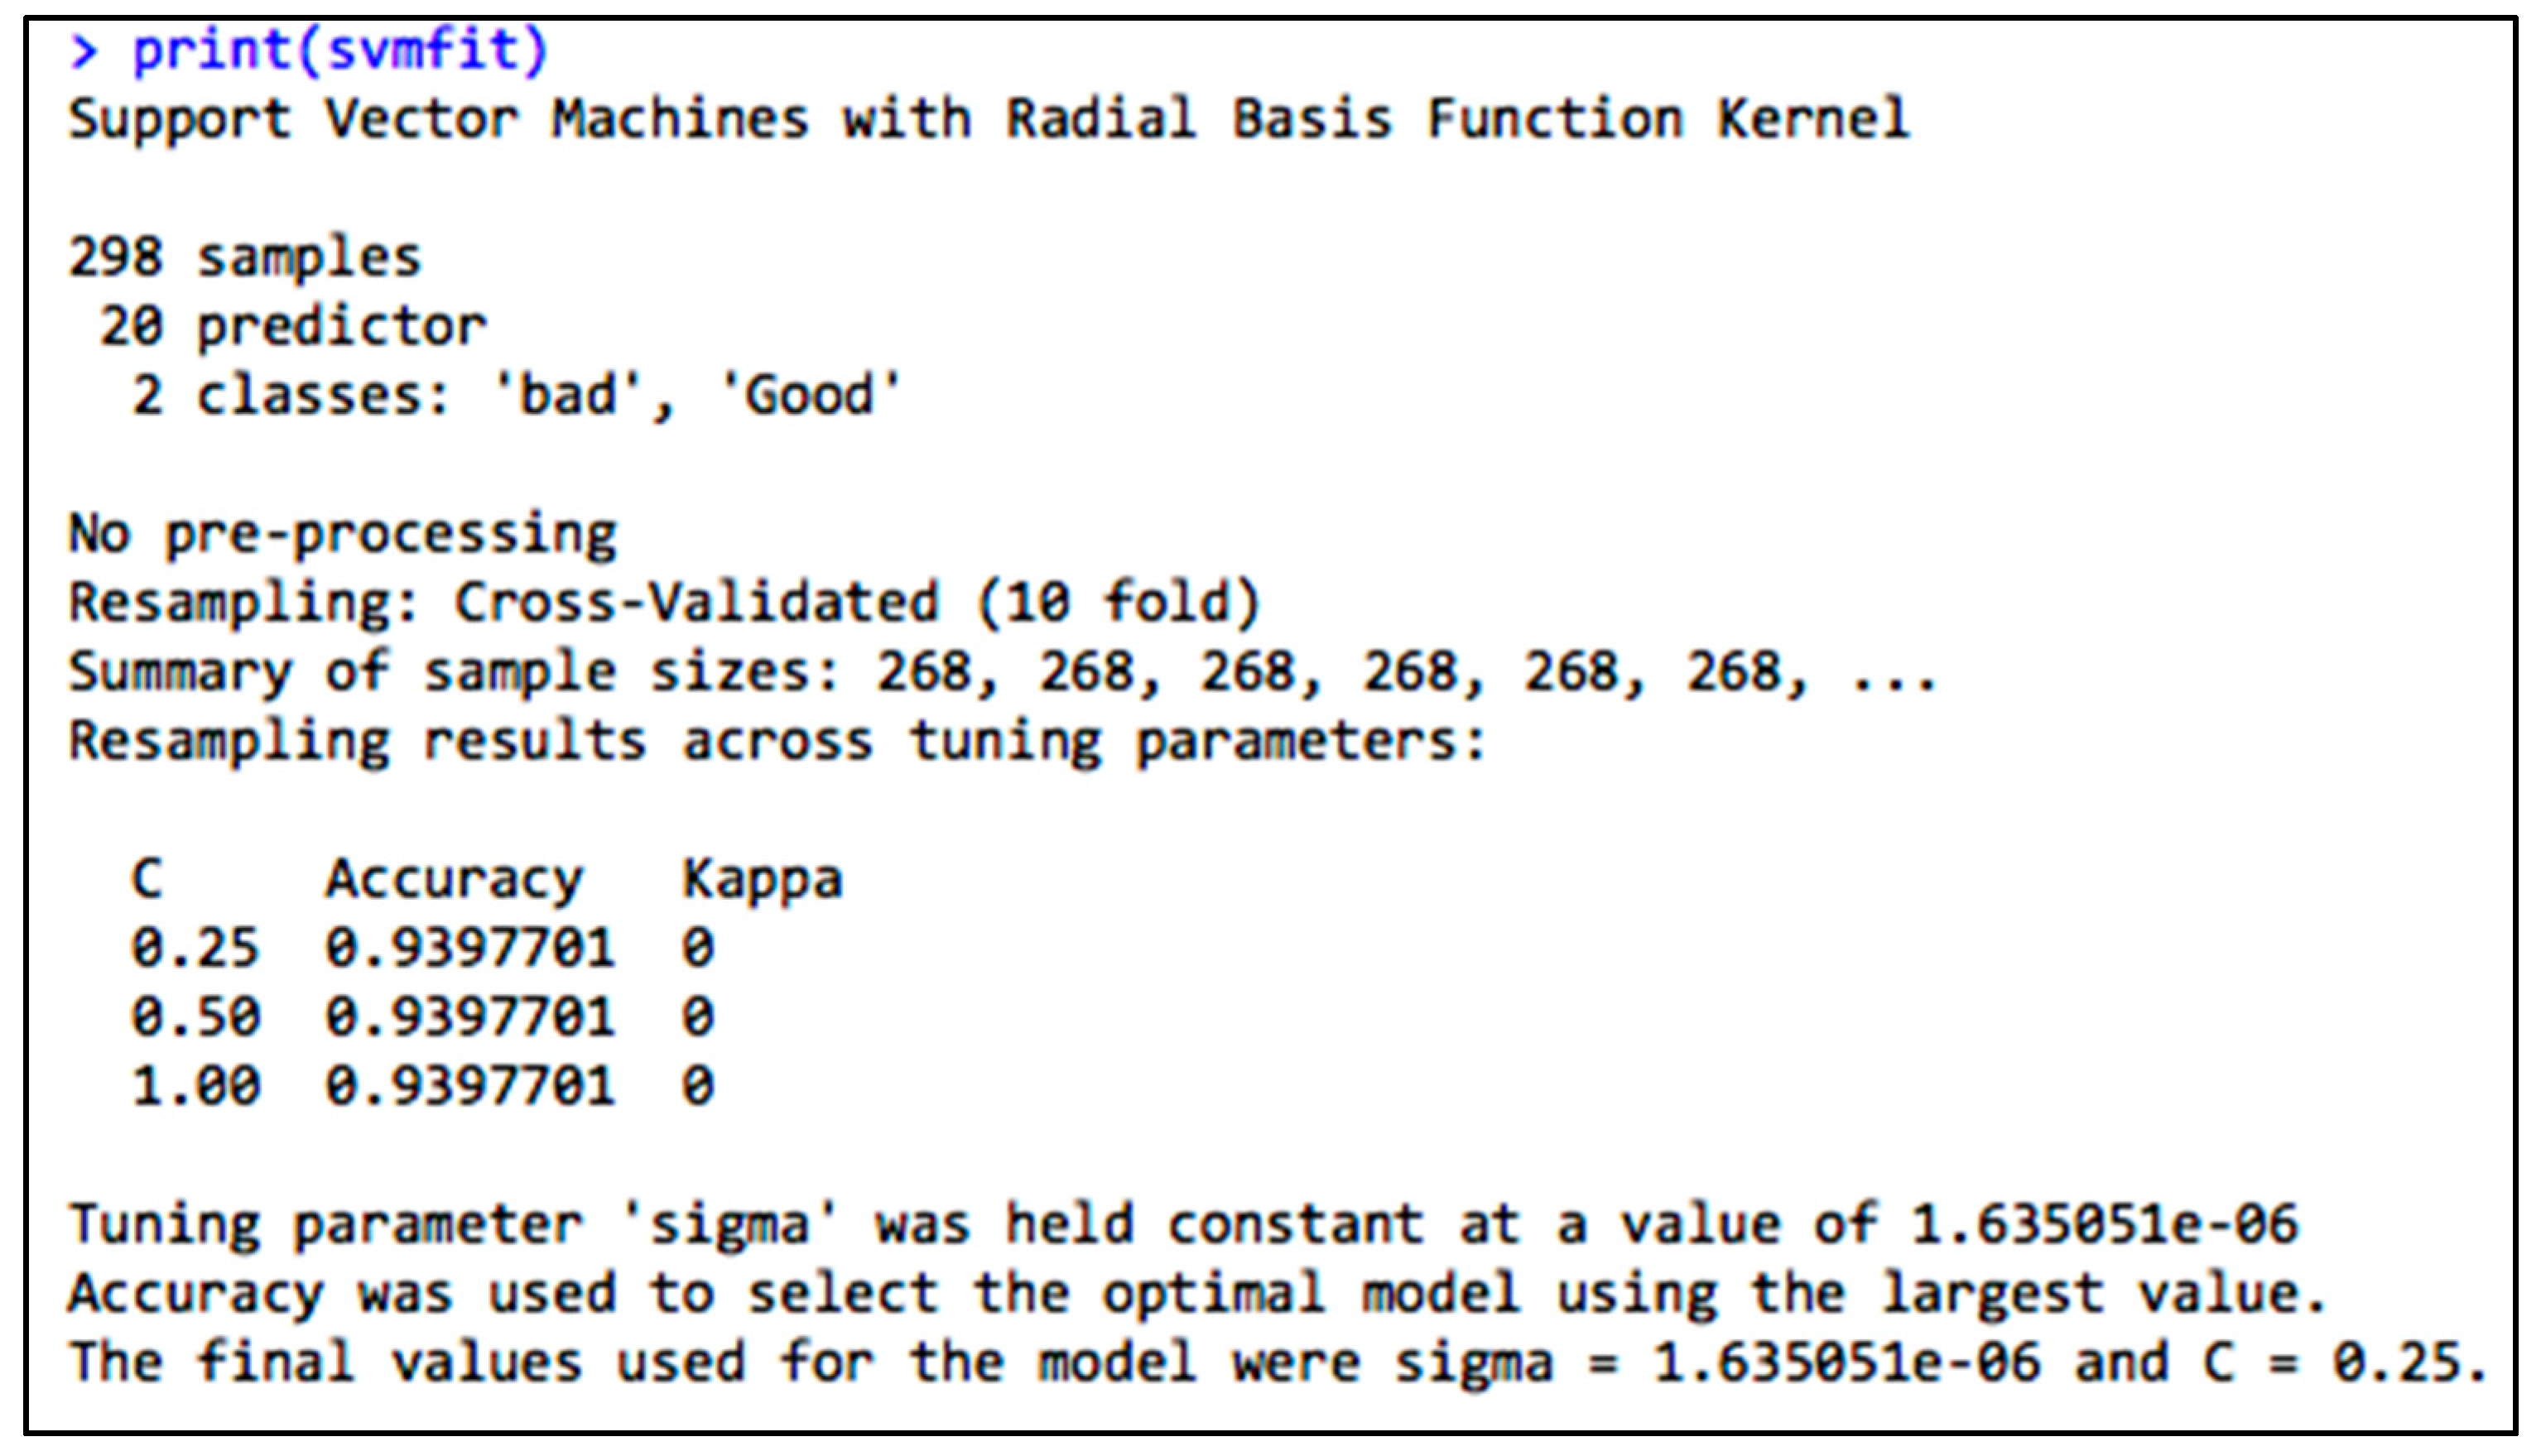
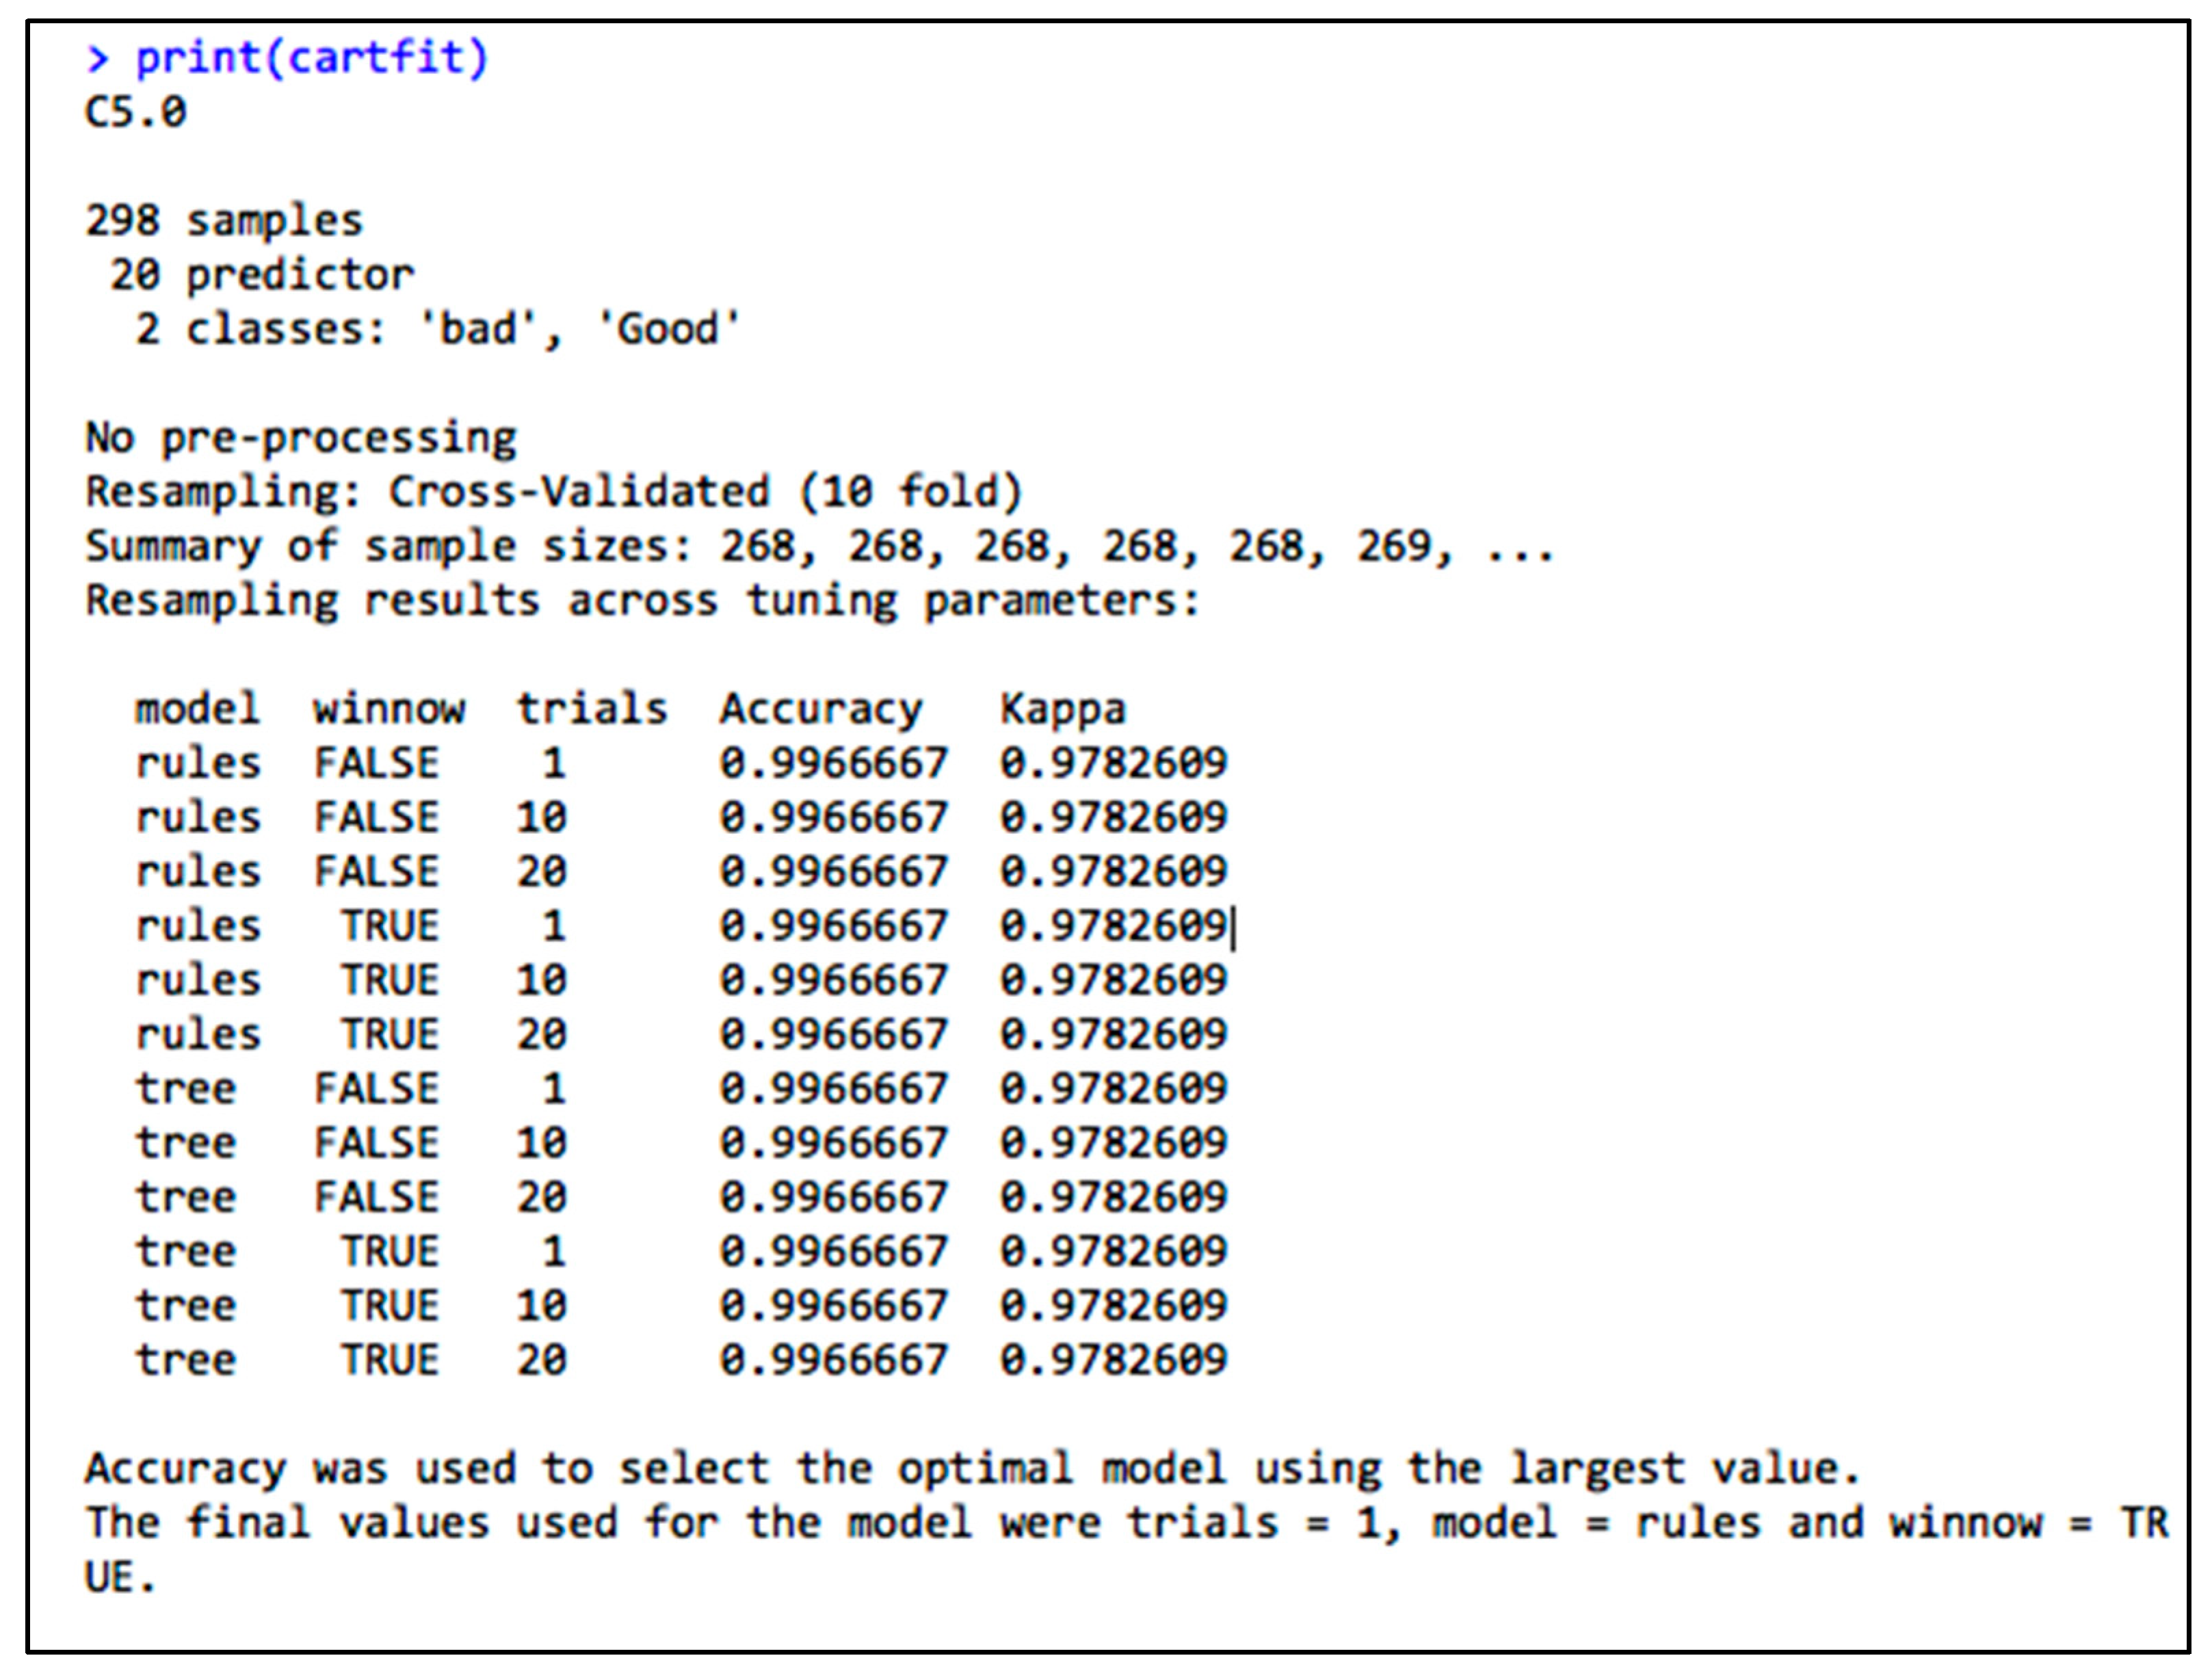
Compared to the SVM algorithm that provided an accuracy of 99.7% on the training set as shown in
Figure 12, the C50 algorithm provided an accuracy of 94% on the training set as shown in
Figure 13. The two algorithms were then run on the testing set to evaluate the models.
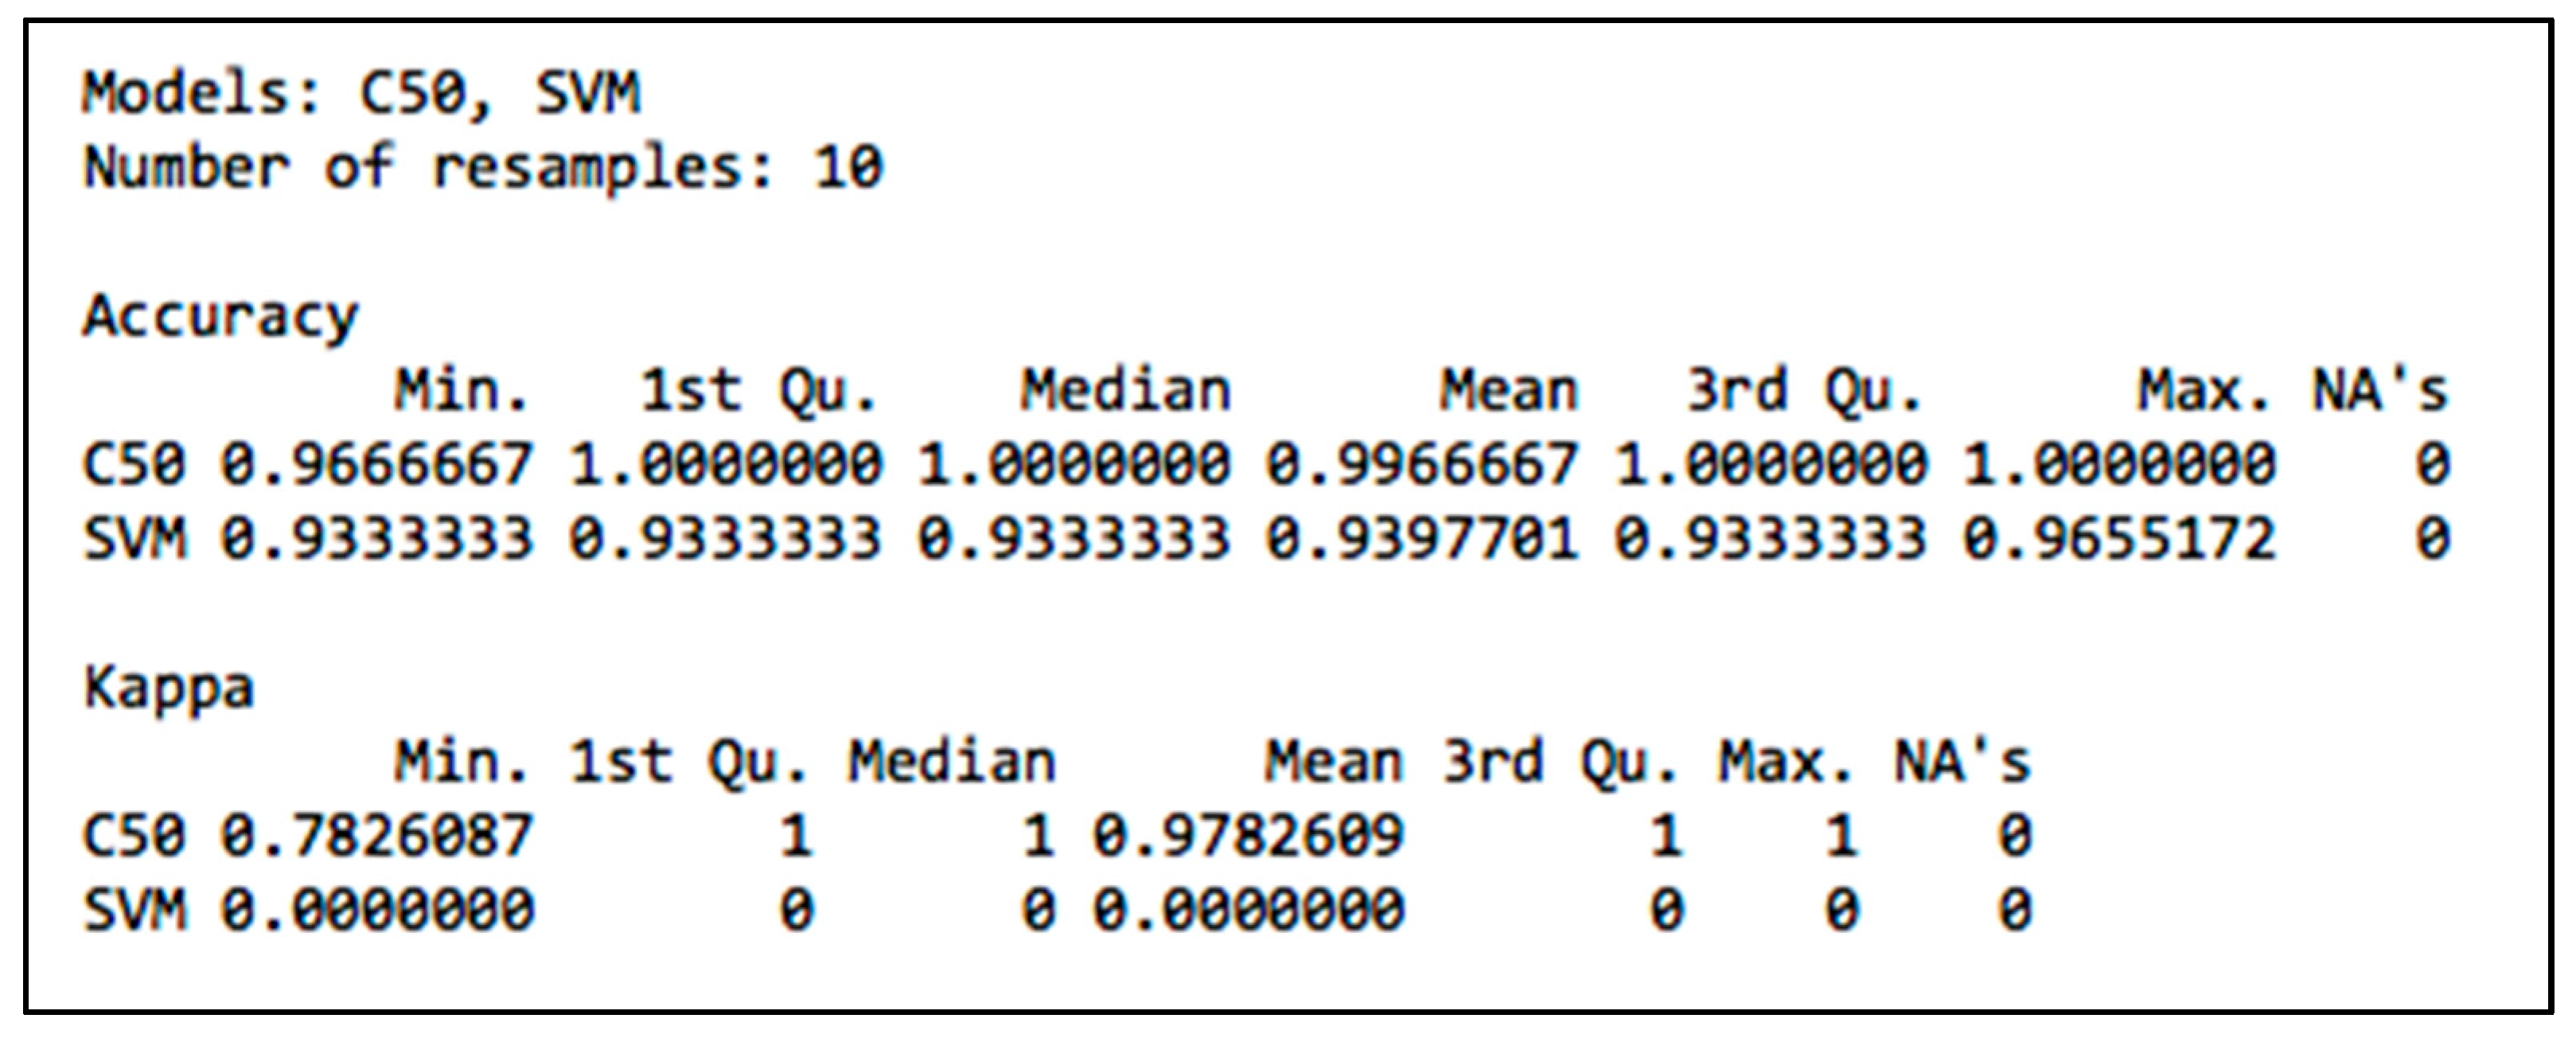
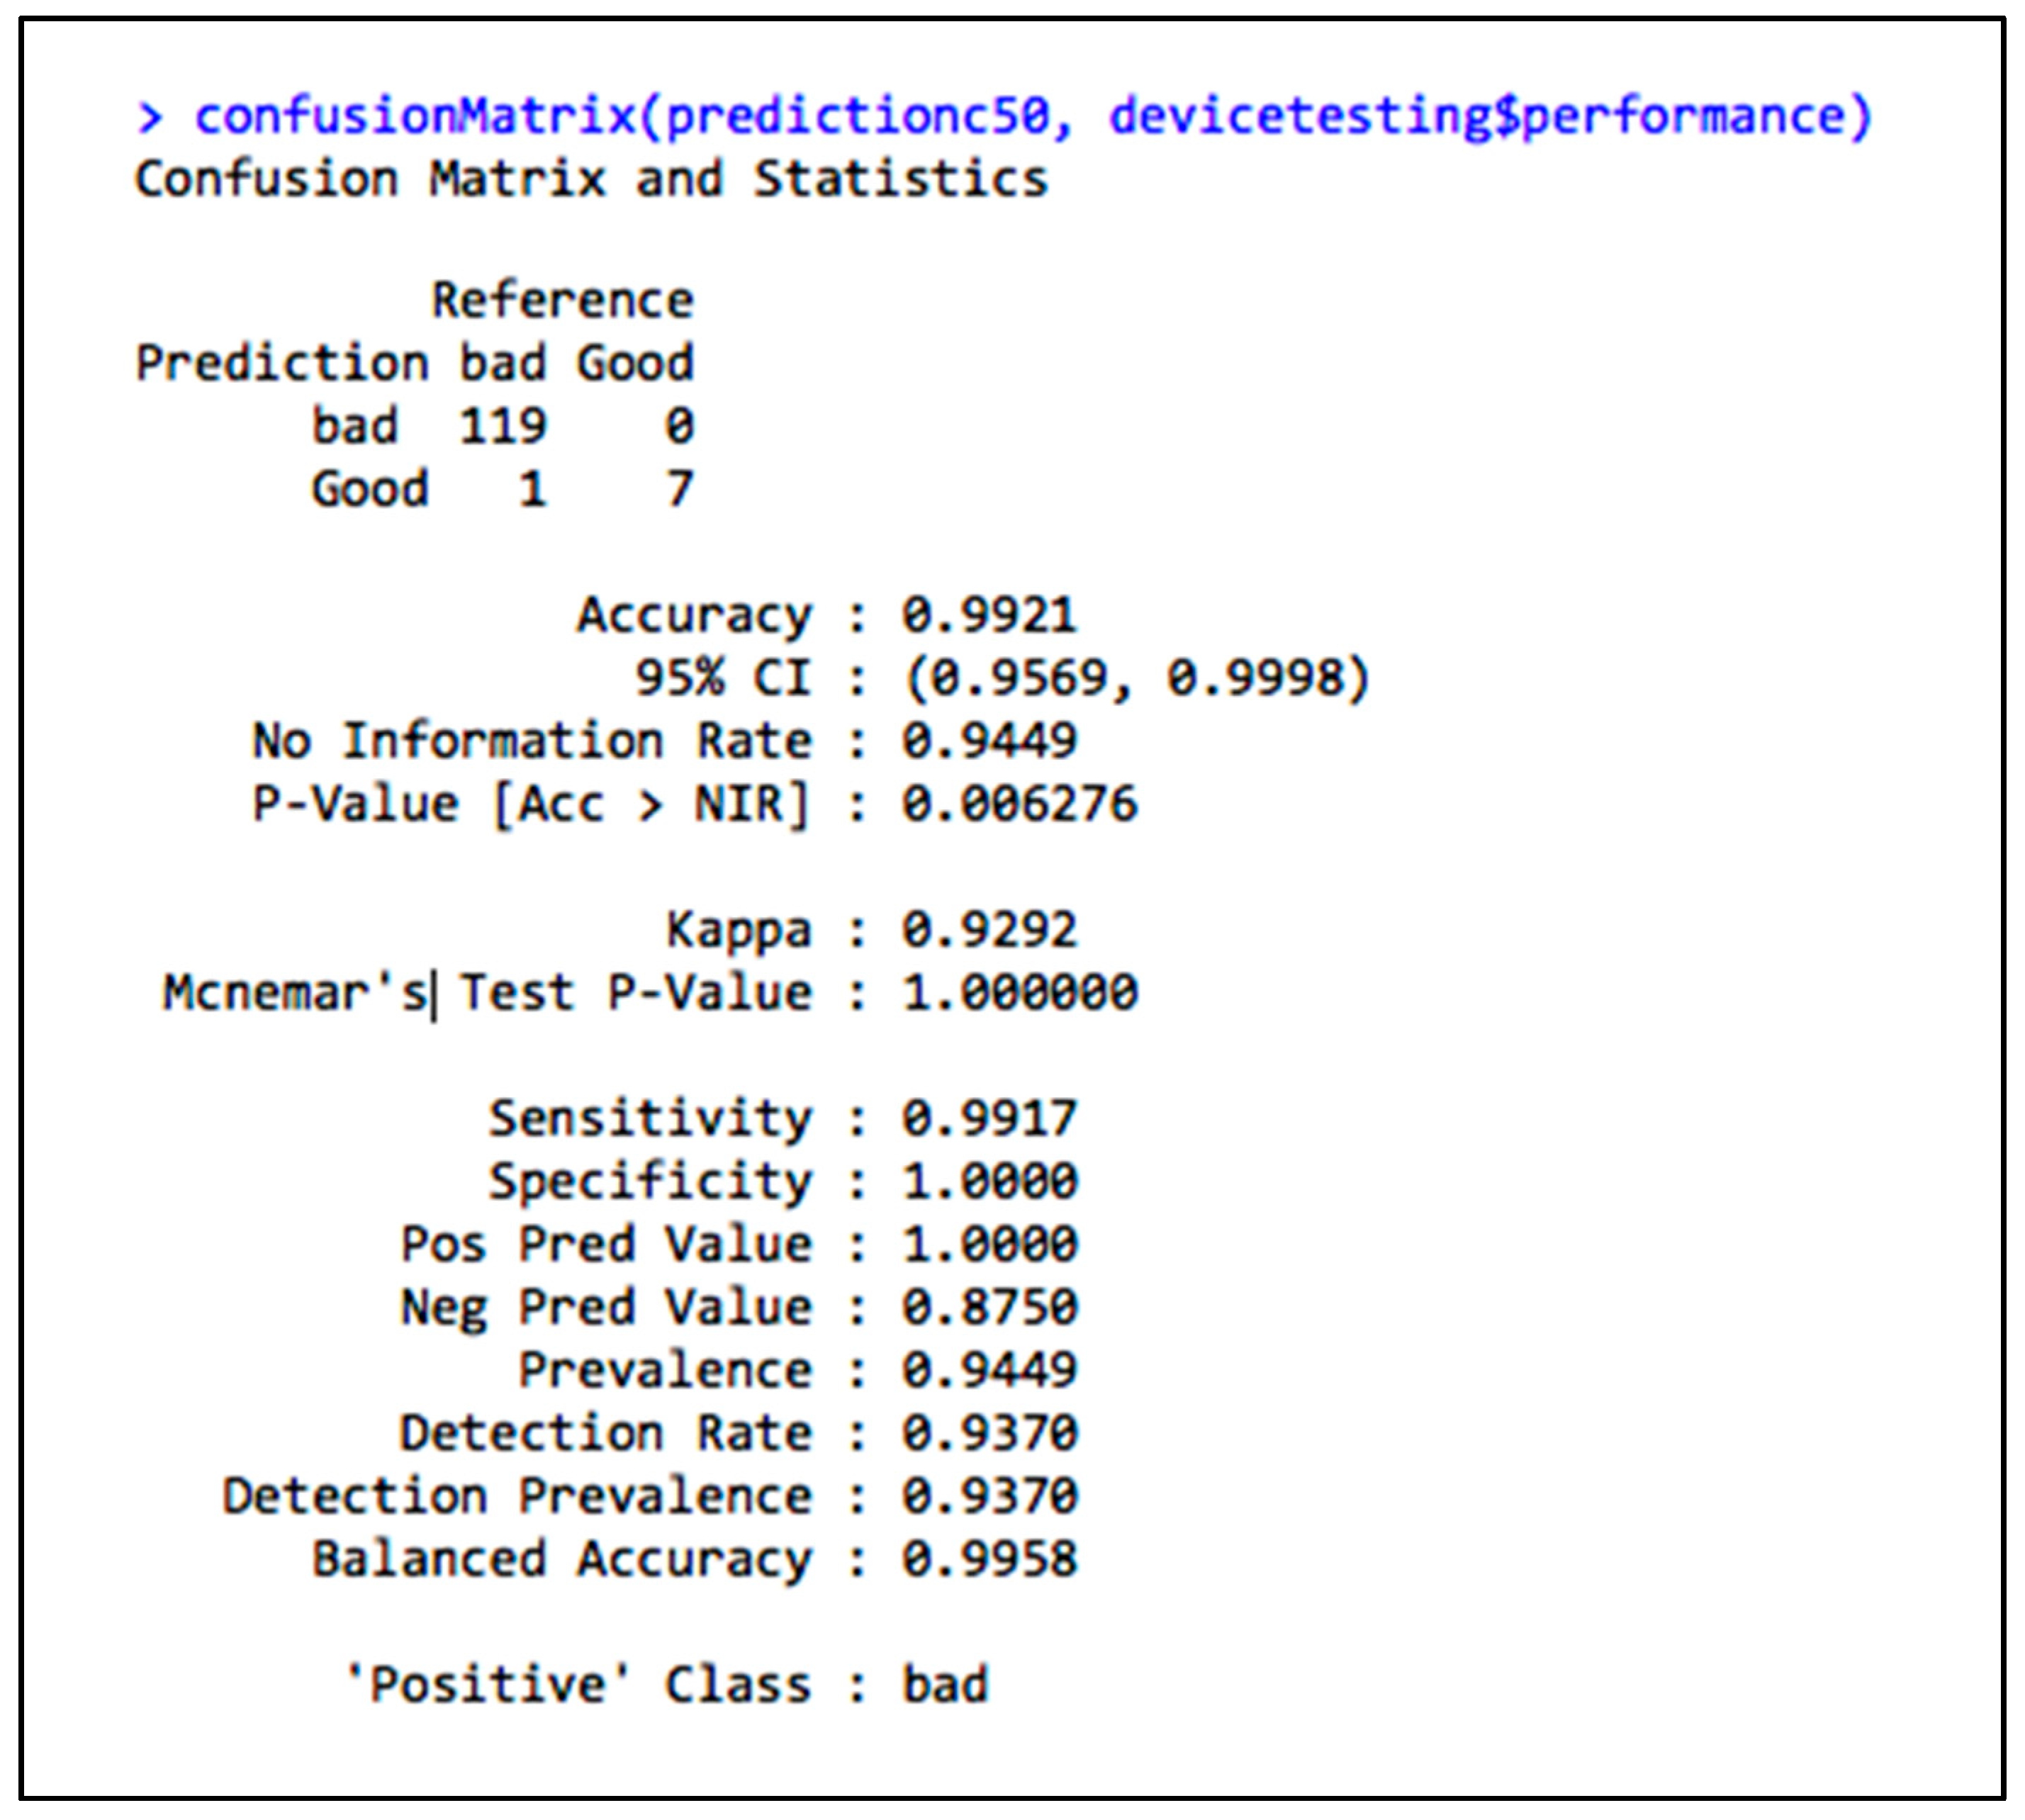
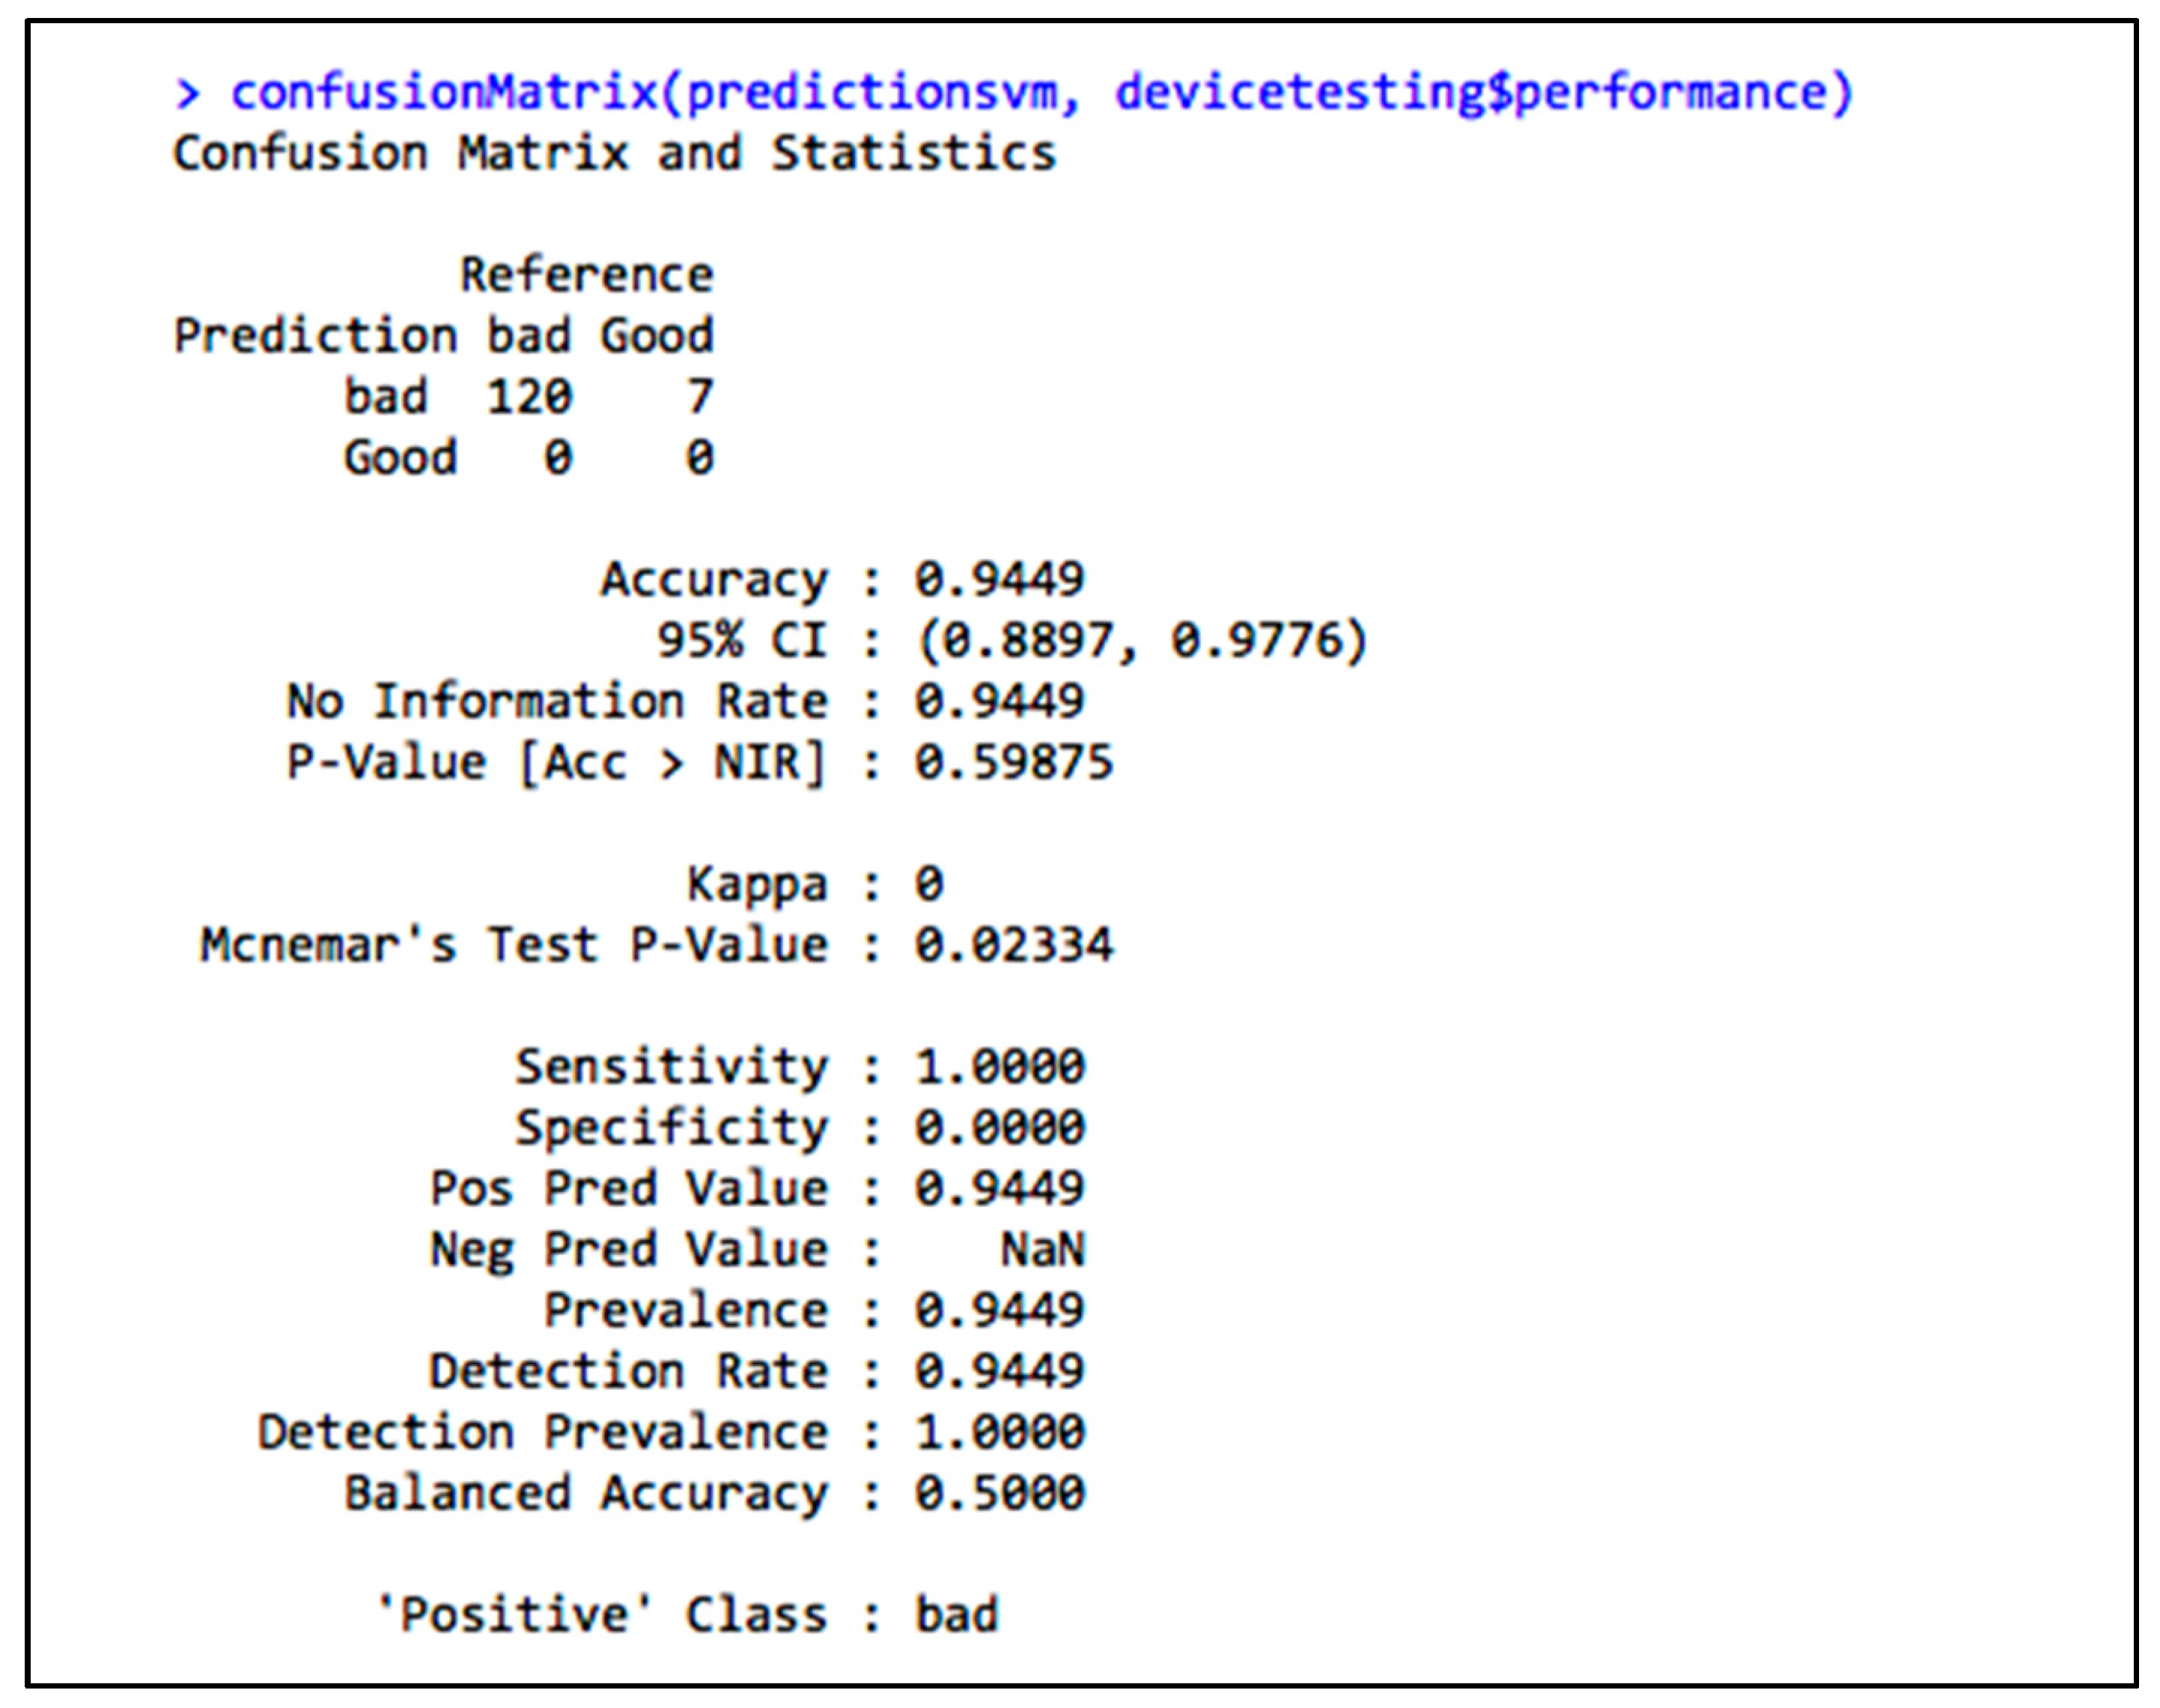
Figure 14,
Figure 15 and
Figure 16 respectively show the performance of the machine learning algorithms, C50 algorithm and SVM algorithm on the testing dataset. We can conclude that using the C50 algorithm, because of its excellent performance on the testing set, will allow us to predict poorly performing devices in the future.
10. Conclusions
This paper introduces the concept of IoT and MTC with a focus on devices and associates data analytics with machine learning to showcase the importance of device monitoring. In line with this idea, a conceptual model of a device monitoring system is presented through data analytics use cases and predictive applications. The C50 model presented a better performance on both the training and the testing datasets. The matricidal system model provides a foundation for use cases that can be used to monitor device behavior. Latency, packet loss, throughput, and DNS performance were considered as performance indicators in the experiment, and represent the foundation for the current KPI monitoring that, among the many other network requirements, needs to be carefully monitored.
11. Future Studies
IoT and MTC are technologies that will overwhelm the market in the future. They are emerging technologies, and many open holes are being identified and researched by scientists. As connected devices increase, more challenges open up in the area of data security. Data protection and security are two topics that are being looked at by many researchers [
26]. Many kinds of studies will address the challenges of the current network infrastructure and the migration to 5G, providing smooth communication for end devices so as to support high-definition video streaming at a Gbps level [
27].

 ,
, 


