Article

An Improved OTSU Algorithm Using Histogram Accumulation Moment for Ore Segmentation

School of Mechanical Electronic and Information Engineering, China University of Mining and Technology (Beijing), Beijing 100089, China
*
Author to whom correspondence should be addressed.
Symmetry 2019, 11(3), 431; https://doi.org/10.3390/sym11030431
Submission received: 26 February 2019 / Revised: 15 March 2019 / Accepted: 20 March 2019 / Published: 22 March 2019

Abstract

:
When using image processing technology to analyze mineral particle size in complex scenes, it is difficult to separate the objects from the background with traditional algorithms. This paper proposes an ore image segmentation algorithm based on a histogram accumulation moment, which is applied to multi-scenario ore object location and recognition. Firstly, the multi-scale Retinex color restoration algorithm is used to improve the contrast in the dark region and eliminates the shadows generated by the stacked adhesion ores. Then, the zero-order and first-order cumulative moments close to the selected gray level are calculated, reducing the error caused by noise. Finally, the selected gray level gradually approaches the optimal threshold to avoid falling into local optimum. It can segment mineral images with unimodal or insignificant bimodal characteristic histogram effectively and accurately. Ore images in three different scenarios are used to verify the accuracy and effectiveness of the proposed method. The experimental results demonstrate that the proposed algorithm provides better segmentation results than other methods.

1. Introduction

Mineral separation is the process of separating useful minerals from useless solid materials as much as possible to obtain the raw materials required for the smelting process [1]. The crushing of minerals is an important part of mineral separation. The minerals are gradually made smaller by the multi-stage crusher. The quality of the crushing directly affects the technology of mineral separation and the granularity of the minerals is a significant indicator to measure the crushing process [2]. Many studies have focused on the particle size detection of the mineral selection. Nowadays, most mineral factories in China detect the granularity by manual screening. The whole process is highly labor intensive and of poor efficiency and the results are susceptible to human mood.
In recent years, with the rapid development of artificial intelligence and pattern recognition technology, the method of detecting mineral particle size by machine vision has gradually increased [3,4]. Researchers use image processing algorithms to segment minerals automatically [5,6]. This not only avoids the error caused by manual screening but also reflects the result of the mineral granularity detection visually. The shape of the mineral can be described, and the mineral particle size measured with rich analytical data by extracting geometric characteristics of the particles. Image segmentation is one of the important steps in mineral particle size detection. The quality of image segmentation directly affects the result of particle size detection. According to the mineral collection environment, researchers use the specific segmentation algorithm to achieve particle recognition and localization under specific environment. Many articles have mentioned the method of image processing to segment mineral particles. For example, Wang et al. [7] used the modified marker watershed algorithm to segment copper particles. The grain surface area was estimated from perimeter analysis of sectioned particles and 3D volume grade was established. However, the copper particles were not compact and stacked and the segmentation algorithm did not involve particle adhesion. Cemal et al. [8] suggested a simple normalized color-based statistical segmentation algorithm for ore images. The objects are determined by the color components of the minerals, so the method is not suitable for ores containing only one mineral. Heydari et al. [9] employed watershed transform and morphological methods to estimate the size distribution of iron-ore green pellets. The shape of iron-ore targets is close to a circle and the collected images with large gap pixels are easy to segment. However, the method is not effective for irregular minerals in complex scenes. Zhang et al. [10] argued that the contrast of a coal pile image was improved by a combination of multiple filters and the double-threshold method was used to allocate the coal particles. Then, the particle size was calculated by extracting the perimeter. However, compared with the ore image, the surface of the coal pile is too smooth, so it is not proper for ore with large noise.
Since most segmentation methods set a specific detection environment, they are unsuitable for ores in complex scenes. OTSU [11] based on statistical measurement is a classic global threshold segmentation, having the advantages of speediness, stabilization and high universality [12,13]. Hua et al. [14] obtained the aggregate size by using OTSU. Gajalakshmi et al. [15] advised that the grain boundaries of various metals were determined using OTSU and Canny edge detection techniques. Chi et al. [16] introduced a threshold selection method combined with OTSU to calculate the volume distribution of nanoparticles in brain parenchyma. Ahmed et al. [17] detected the cracks in concrete image using OTSU and multiple filtering. However, the OTSU method merely considers the gray-scale information. For an image with unimodal or inconspicuous bimodal histogram distribution, it tends to fall into local optimum and cannot effectively find the global optimal threshold.
In response to the mentioned problems, some scholars have proposed some improved OTSU algorithms. Malarvel et al. [18] offered an improved OTSU method for segmentation of weld defects on radiography images. Although the threshold value always lies at the left bottom side of the unimodal distribution, it is only suitable for images with a dull and large proportion background. Yuan et al. [19] suggested an improved OTSU method using the weighted object variance for defect detection. It cannot meet the requirement for ore images, as the noise is mixed with the target pixel. Azeroual et al. [20] presented a fast image edge detection based on the Faber Schauder Wavelet and OTSU. Harb et al. [21] put forward an improved image magnification algorithm based on OTSU thresholding. Zhang et al. [22] proposed a double-window OTSU algorithm to solve the problem of uneven gray distribution. Still, this method needs to select the window size according to the ore target.
The ore images have many noises and are prone to over-segmentation and under-segmentation because of the influence of the collection environment. The traditional OTSU algorithm is difficult to select an appropriate threshold accurately for unimodal or inconspicuous bimodal histogram distribution image. By analyzing the problems existing in OTSU and its improved methods, this paper proposes an improved OTSU algorithm for ore image segmentation based on histogram accumulation moments. The contributions of the proposed algorithm are summarized as follows:
Ore images are very noisy and are prone to over-segmentation and under-segmentation due to the influence of the collection environment. It is difficult to select an appropriate threshold accurately for unimodal or inconspicuous bimodal histogram distribution image using the traditional OTSU algorithm. By analyzing the problems existing in OTSU and its improved methods, this paper proposes an improved OTSU algorithm for ore image segmentation based on histogram accumulation moments. The contributions of the proposed algorithm are summarized as follows:
(1)
The object contrast in dark areas is improved and the shadow from stacked and adhesive ores is eliminated by using the multi-scale Retinex color restoration algorithm;
(2)
An improved OTSU algorithm is proposed. It reduces the error caused by image background and noise by calculating the gray-level zero-order and first-order cumulative moments closed to the selected area. The selected gray level gradually approaches the optimal threshold to avoid falling into the local optimum. This algorithm can be used in the segmentation of mineral images with unimodal or insignificant bimodal properties;
(3)
The validity and accuracy of the proposed algorithm is verified from the qualitative and quantitative analysis in multi-scenario ore image segmentation.

2. Problems of OTSU for Ore Segmentation

As a global thresholding segmentation method, OTSU uses the variance of the gray level distribution to find the threshold and divides the image pixels into two categories: Object and background. The optimal threshold is chosen to maximize the between-class variance and the minimum within-class variance. The OTSU algorithm for extracting the global threshold is described as follows:
(1) The probability and gray mean value of object and background
The gray level of the image f ( x , y ) is [ 0 , 1 , , l 1 ] . The threshold t ( 0 t l 1 ) splits f ( x , y ) into two categories: Object and background. The object class probability is P O and the background class probability is P B .
P O = i = 0 t p i
P B = i = t + 1 l 1 p i
where p i is the ratio of the number of pixels n i in the gray level i to the overall image, indicating the occurrence probability of gray levels i .
p i = n i n
M O and M B represent the gray mean of the object and background class, respectively.
M O = i = 0 t i p i P O
M B = i = t + 1 l 1 i p i P B
(2) The zero-order, first-order and second-order of cumulative moment
Let P O ( t ) = i = 0 t p i representing the zero-order cumulative moment of the gray histogram. It is the occurrence probability of the gray level from 0 to t .
P O ( t ) = P O
Making M O ( t ) represents the first-order cumulative moment of the gray histogram. It is the average gray value from 0 to t .
M O ( t ) = i = 0 t i p i
The average gray of the entire image is M T .
M T = i = 0 l 1 i p i
From Equations (1)–(8), have the following relationship for any t .
P O + P B = 1 , P O M O + P B M B = M T
Each class of variance is defined by using the second-order cumulative moment of the gray histogram, which is expressed as the object class variance σ O 2 and the background class variance σ B 2 , respectively.
σ O 2 = i = 0 t ( i M O ) 2 p i P O
σ B 2 = i = t + 1 l 1 ( i M B ) 2 p i P B
(3) The relationship of between-class variance, within-class and total-variance
The variance between the object and background class is σ b e t w e e n 2 .
σ b e t w e e n 2 = P O ( M O M T ) 2 + P B ( M B M T ) 2
The within-class variance of two classes is σ w i t h i n 2 .
σ w i t h i n 2 = P O σ O 2 + P B σ B 2
The overall variance of the image is σ t o t a l 2 .
σ t o t a l 2 = i = 0 l 1 ( i M T ) 2 p i
Equations (12)–(14) satisfy the following relationship.
σ t o t a l 2 = σ b e t w e e n 2 + σ w i t h i n 2
(4) The selection of optimal threshold
After derivation, for the threshold t, the variance between the object and background class is recorded as σ o t s u 2 ( t ) .
σ o t s u 2 ( t ) = [ M T P O ( t ) M O ( t ) ] 2 P O ( t ) [ 1 P O ( t ) ]
Discriminant analysis is performed based on σ o t s u 2 ( t ) to find the maximum gray level of σ o t s u 2 ( t ) as the optimal threshold t * .
t * = a r g   max 0 t l 1 { σ o t s u 2 ( t ) }
There is a jump in the gray value between the object and background and the variance can reflect the change of the object–background boundary. The OTSU method involves unsupervised selection of thresholds, automatic optimization through simple calculations and does not need parameter control. It can steadily and accurately segment images with bimodal characteristic gray histograms.
The ores are spread over the entire image and the non-ore parts account for a small proportion of the image. The original ore image is shown in Figure 1. Figure 1a–c shows crushing ore.
There are many ore objects in ore images. The surface of stones is smooth and strongly reflects light. The gray level of the ore object is mainly concentrated in the left half of the peak region, while the gray level in the right half and at both sides is either too dark or too bright, which represents the background and noise. The gray histogram of the image shows a unimodal state. Figure 2 shows the gray histogram distribution of Figure 1a and OTSU threshold.
It is difficult to determine an obvious gray level to separate the object and background pixels since both of them are intermingled in the histogram distribution. Choosing the optimal threshold presents the following challenges:
(1)
The ore image is affected by uneven illumination, dust and mud coverage. The noise is serious, the target edge is blurred and the contrast between the object and background is low;
(2)
The mineral is scattered, bulky and stacked. Due to the crushing, the ore particles with sharp edges, angular corners and complex internal texture are stacked and adhered;
(3)
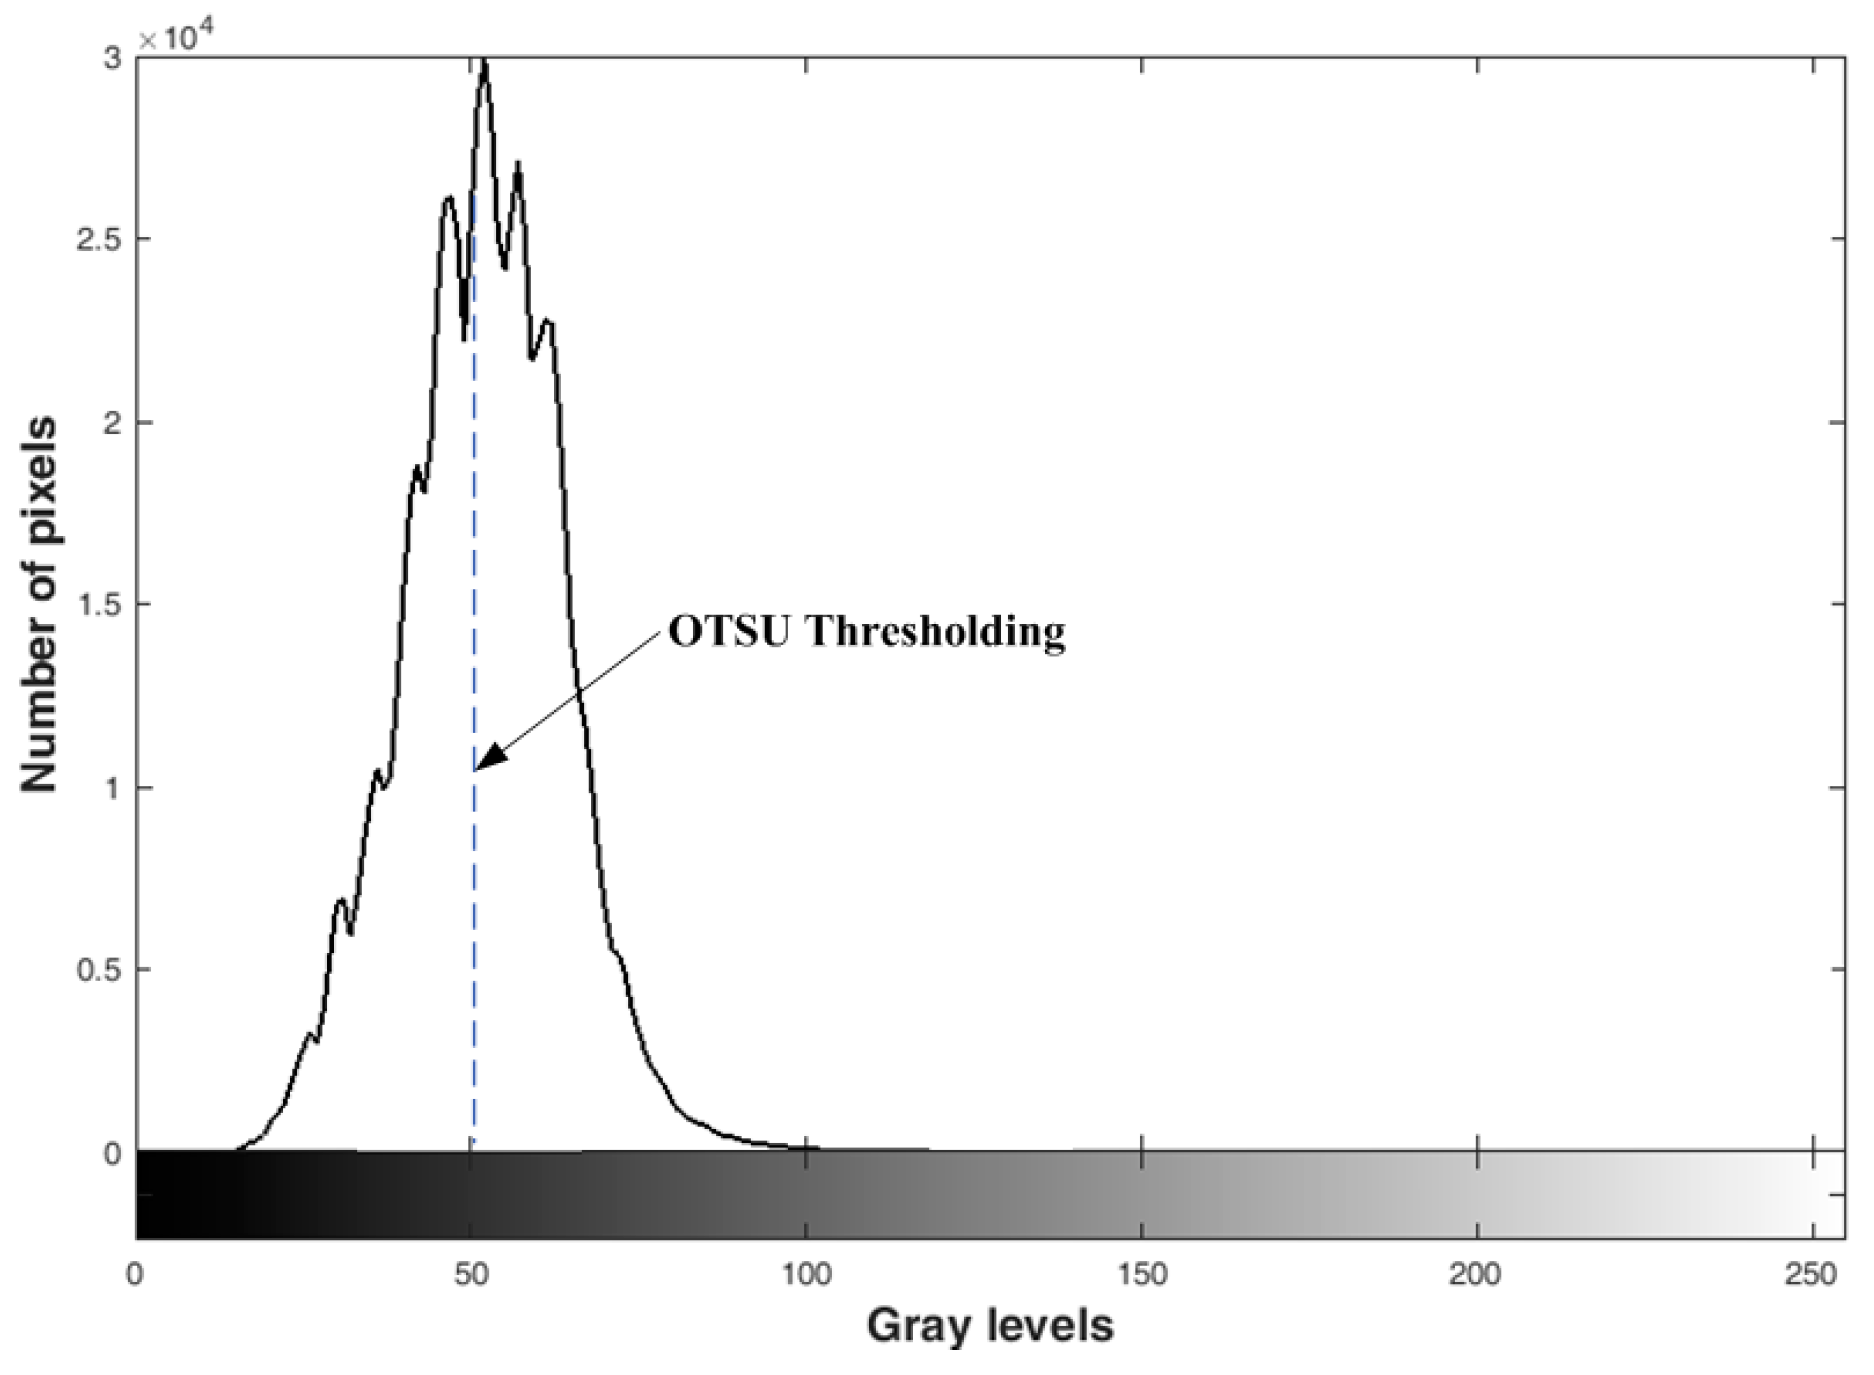
The object and the background pixels in the image are cross-aliased, mostly resulting in unimodal or inconspicuous bimodal gray histogram distribution.
The OTSU algorithm is susceptible to image noise. When the target and background have basically the same area, the segmentation result is better. However, when the difference of both areas is large, and the gray histogram appears unimodal or inconspicuous bimodal, it is difficult to separate the object from the background effectively and accurately with OTSU. The threshold obtained by OTSU is liable to fall into the local optimum and the global threshold cannot be effectively found. Figure 3 shows the segmentation result of OTSU.
By analyzing the problems of existing threshold methods and the complexity of the mineral image itself, an improved OTSU algorithm is proposed for ore segmentation. It aims to realize the mineral identification and localization quickly, effectively and accurately for complex scenes.

3. Improved Ore Image Segmentation Algorithm

Ore images are affected by uneven illumination and include dust and slurry. The multi-scale Retinex color restoration algorithm is used to eliminate the influence of illumination. It can enhance the local color and dark details and truly reproduce the ore image in complex scenes. Our improved algorithm calculates the zero-order and first-order cumulative moments close to the object and background parts instead of analyzing the entire gray level distribution. Hence, it reduces the error caused by noise. The optimal threshold is selected to avoid falling into the local optimal, which is not only suitable for bimodal distribution histogram but also effective for segmenting ore images with a unimodal or nearly unimodal distribution.

3.1. Multiscale Retinex Color Restoration Algorithm

Factors such as collecting device and shooting environment bring many problems for the object recognition. To overcome the problems, image enhancement technology can highlight the gaps between the ore target and background, making the dark or occlusion area clearer. The traditional enhancement algorithm is mainly for gray images, which lead to lacking color information and losing the details of the original image. Conversely, color image enhancement makes the image colorful, detailed and vivid.
Land [23] proposed a color image enhancement method based on Retinex theory. The method can avoid the influence of illumination light and obtain the innovative appearance by object reflection. The image enhancement based on Retinex can enhance edges and remove over-exposures or under-exposures [24]. It is appropriate for different types of images. The multiscale retinex color restoration algorithm[25] (MSRCR) adjusts the ratio between the three channels of the image based on single-scale and multi-scale Retinex. MSRCR emphasizes the dark region information and eliminates the problem of color image distortion.
The image f ( x , y ) can be expressed as the product of the incident and the reflected component.
f ( x , y ) = r ( x , y ) l ( x , y )
where the object reflection component r ( x , y ) reflects the image high-frequency detail information and the incident component l ( x , y ) represents change slowly low-frequency part in image.
The logarithm is taken on both sides. Then the incident component l ( x , y ) is removed, indicating the influence of illumination is evaded. The reflection component r ( x , y ) is obtained to achieve image enhancement effect.
log ( r ) = log ( f ) l o g ( l )
Since the Gaussian filter can smooth the image while suppressing noise, it is usually used to estimate the incident component. Taking the green channel image f g ( x , y ) for example, f g ( x , y ) is filtered by a Gaussian convolution function G ( x , y , σ ) to obtain a flat incident component estimate log ( l ^ g ) .
log ( l ^ g ) = log [ G ( x , y , σ ) * f g ( x , y ) ]
The smoothness log ( l ^ g ) is subtracted from the original channel image, removing the influence of the incident component. The faster-changing part is obtained, which is the remaining single channel image detail R g ( x , y ) .
R g ( x , y ) = log   f g ( x , y ) log ( l ^ g )
The original image has R, G and B three channels. The scale factor k and the weighting factor  are added for adjusting the three channels. The filtering at different scales eliminates the illumination effect on image color. The weighting and summing operations enhance the local color and detail of the image. Then the green channel image detail R g m s r ( x , y ) at multiple scales is obtained.
R g m s r ( x , y ) = k = 1 M w k R g ( x , y )
where M is the number of scales and w k is the weight at the k-th scale.
Different scales make the ratio of the restored RGB channels different from the original image, which changes the color of the local area and causes the color distortion of the image. The three-channel color ratio relationship is adjusted by introducing a color recovery factor to reduce the effect of color distortion. R g m s r c r ( x , y ) is the restored green channel image detail.
R g m s r c r ( x , y ) = R g m s r ( x , y ) C g ( x , y )
where C g ( x , y ) is the recovery factor of the green channel to adjust the proportion of three channel. It is generally expressed as
C g ( x , y ) = log   ( c f g ( x , y ) f r ( x , y ) + f g ( x , y ) + f b ( x , y ) )
where c is the color correction constant, typically 125.
By adjusting the ratio between the three channels, the MSRCR algorithm highlights the object edge information of the dark area, removes the influence of the light and reestablishes the real scene to a high degree. The image enhancement result based on the MSRCR algorithm is shown in Figure 4 below.

3.2. Improved OTSU Segmentation Based on Histogram Accumulation Moment

The MSRCR enhances the edge information of the dark region and removes the influence of uneven illumination. An improved OTSU segmentation algorithm based on histogram accumulation moment (HCM_OTSU) is proposed. The ore object is separated from the background. Then the targets are extracted from the ore image at complex scenes.
The specific steps of the HCM_OTSU segmentation algorithm are as follows.

3.2.1. The Selection of Random Gray Value

The ore image after MSRCR is recorded as f m s r c r ( x , y ) . The gray level is { 0 , 1 , , l 1 } and the gray value g is randomly selected from the gray levels as the reference threshold. Then, the whole gray levels are divided into two parts { 0 , 1 , , g } and { g + 1 , g + 2 , , l 1 } . The gray level probability distributions at different gray value g are distinctive.

3.2.2. Improvement of Zero-Order and First-Order Cumulative Moments

The traditional OTSU method calculates the cumulative moment over the entire gray level. The selection of the threshold is susceptible to non-effective pixels, resulting in incomplete segmentation or over-segmentation. The improved zero-order and first-order cumulative moments are used to calculate the partial gray-scale pixels. It can suppress the disturbance caused by noise and reduce the error produced by irrelevant pixels, which is convenient for finding the optimal threshold.
(1) Calculation of cumulative moment at gray level { 0 , 1 , , g }
For each gray level h o in { 0 , 1 , , g } , the occurrence probability from h o to the random gray value g is calculated. The histogram zero-order cumulative moment of gray level { h o ,   h o + 1 ,   , g }   is W 0 ( h o ) .
W 0 ( h o ) = i = h o g p i
That is, the 0th order cumulative moment of [0, h o −1] is subtracted from that of the gray level range [0, g]:
W 0 ( h o ) = i = 0 g p i i = 0 h o 1 p i
where, the range of h o is h o [ 0 , g ] .
For each gray level h o in { 0 , 1 , , g } , the average gray level from h o to the random gray value g is calculated and the first order cumulative moment μ 0 ( h o ) of { h o , h o + 1 , , g } is
μ 0 ( h o ) = i = h o g i p i
That is, the first-order cumulative moment of [0, h o −1] is subtracted from that of [0, g]:
μ 0 ( h o ) = i = 0 g i p i i = 0 h o 1 i p i
where, the range of h o is h o [ 0 , g ] .
(2) Calculation of cumulative moment at gray level { g + 1 , g + 2 , , l 1 }
For each gray level h b in { g + 1 , g + 2 , , l 1 } , the occurrence probability from h b to the gray value l − 1 is calculated. The zero-order cumulative moment W 1 ( h b ) of gray level { h b , h b + 1 , , l 1 } is
W 1 ( h b ) = i = h b l 1 p i
That is, the 0th order cumulative moment of [0, h b −1] is subtracted from that of the gray level range [0, l − 1]:
W 1 ( h b ) = i = 0 l 1 p i i = 0 h b 1 p i
where, the range of h b is h b [ g + 1 , l 1 ] .
For each gray level h b in { g + 1 , g + 2 , , l 1 } , the average gray level from h b to the gray value l − 1 is calculated and the first order cumulative moment μ 1 ( h b ) of { h b , h b + 1 , , l 1 } is
μ 1 ( h b ) = i = h b l 1 i p i
That is, the first-order cumulative moment of [0, h b −1] is subtracted from that of [0, l − 1]:
μ 1 ( h b ) = i = 0 l 1 i p i i = 0 h b 1 i p i
where, the range of h b is h b [ g + 1 , l 1 ] .

3.2.3. Selection of Optimal Threshold

For the reference threshold g , the whole image is divided into two categories, in which the object class set is recorded as { 0 , 1 , , g } and the background class set is { g + 1 , g + 2 , , l 1 } . Each gray level is taken from the two categories. The object gray level is h o [ 0 , g ] and background gray level is h b [ g + 1 , l 1 ] . The variances are respectively recorded as σ o 2 ( h o ) and σ b 2 ( h b ) .
σ o 2 ( h o ) = [ M T W 0 ( h o ) μ 0 ( h o ) ] 2 W 0 ( h o ) [ 1 W 0 ( h o ) ]
σ b 2 ( h b ) = [ M T W 1 ( h b ) μ 1 ( h b ) ] 2 W 1 ( h b ) [ 1 W 1 ( h b ) ]
The variances of the object and the background are compared separately. The gray levels of the variance maximum are found by using discrimination the analysis, which are respectively recorded as t o and t b .
t o = a r g   max 0 t l 1 { σ o 2 ( h o ) }
t b = a r g   max 0 t l 1 { σ b 2 ( h b ) }
Determining whether the mean value of t o and t b is equal to the reference threshold g . If they are equal, making g as the optimal threshold t H C M _ O T S U . Otherwise, returning into Section 3.2.1 and continuing to select the appropriate random threshold. The selected threshold is avoided falling into the local optimum.
t H C M _ O T S U = g , i f g = t o + t b 2

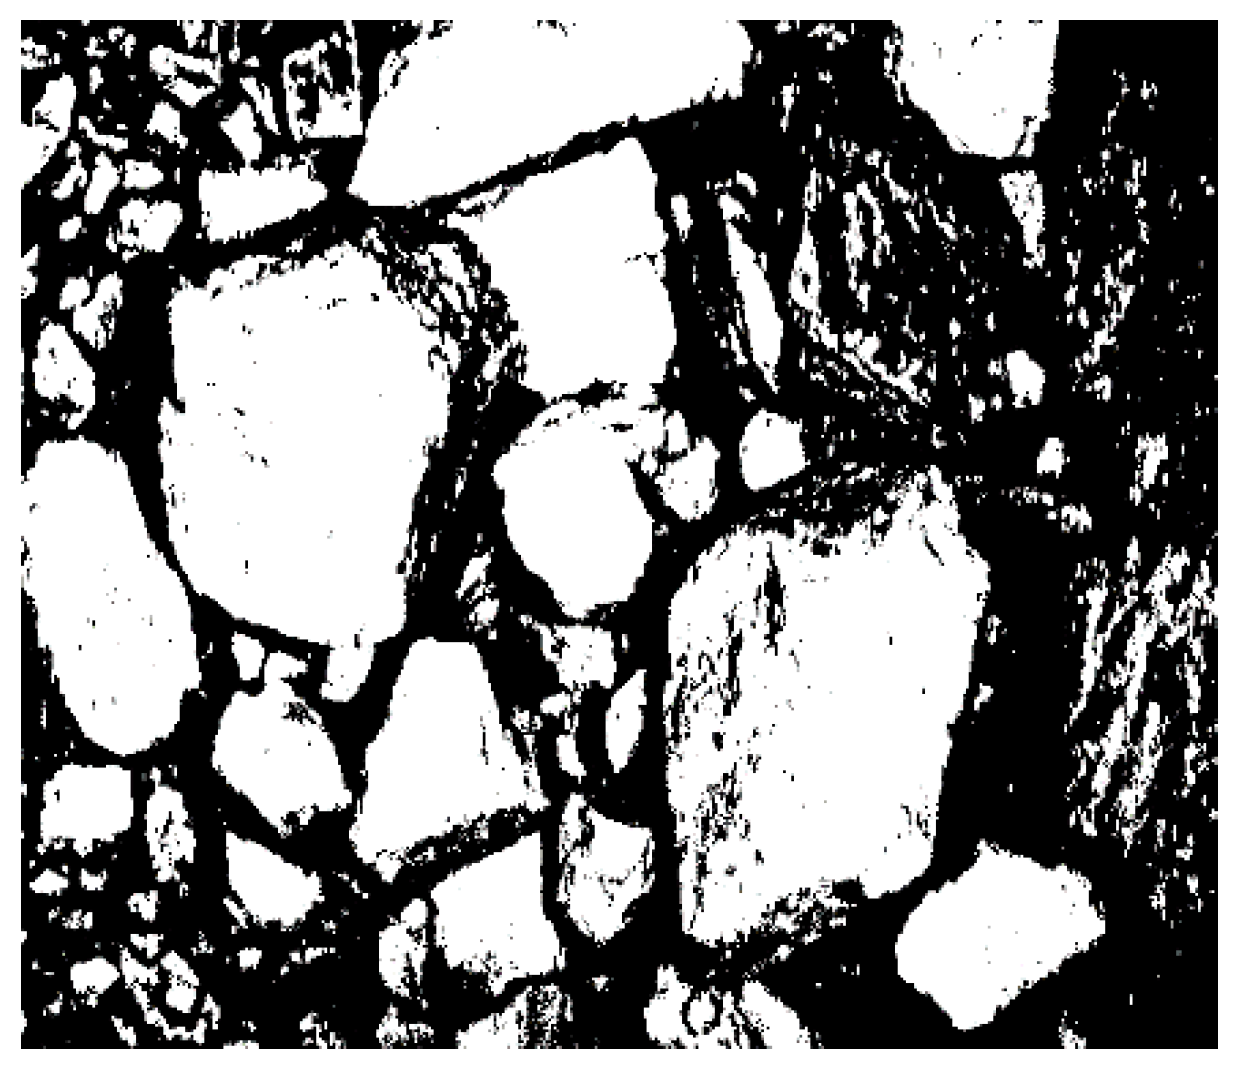
3.2.4. Image Binarization

The average of t o and t b is chosen as the optimal threshold t H C M _ O T S U for each pixel p . The larger pixels are considered as ore targets, while the smaller pixels are used as background. f b m s r c r ( x , y ) represents the generated binary image. “1” in the Formula (38) represents the ore object pixels and “0” is the background pixels.
f b m s r c r ( x , y ) = { 1 , f ( x , y ) > t H C M _ O T S U 0 , otherwise

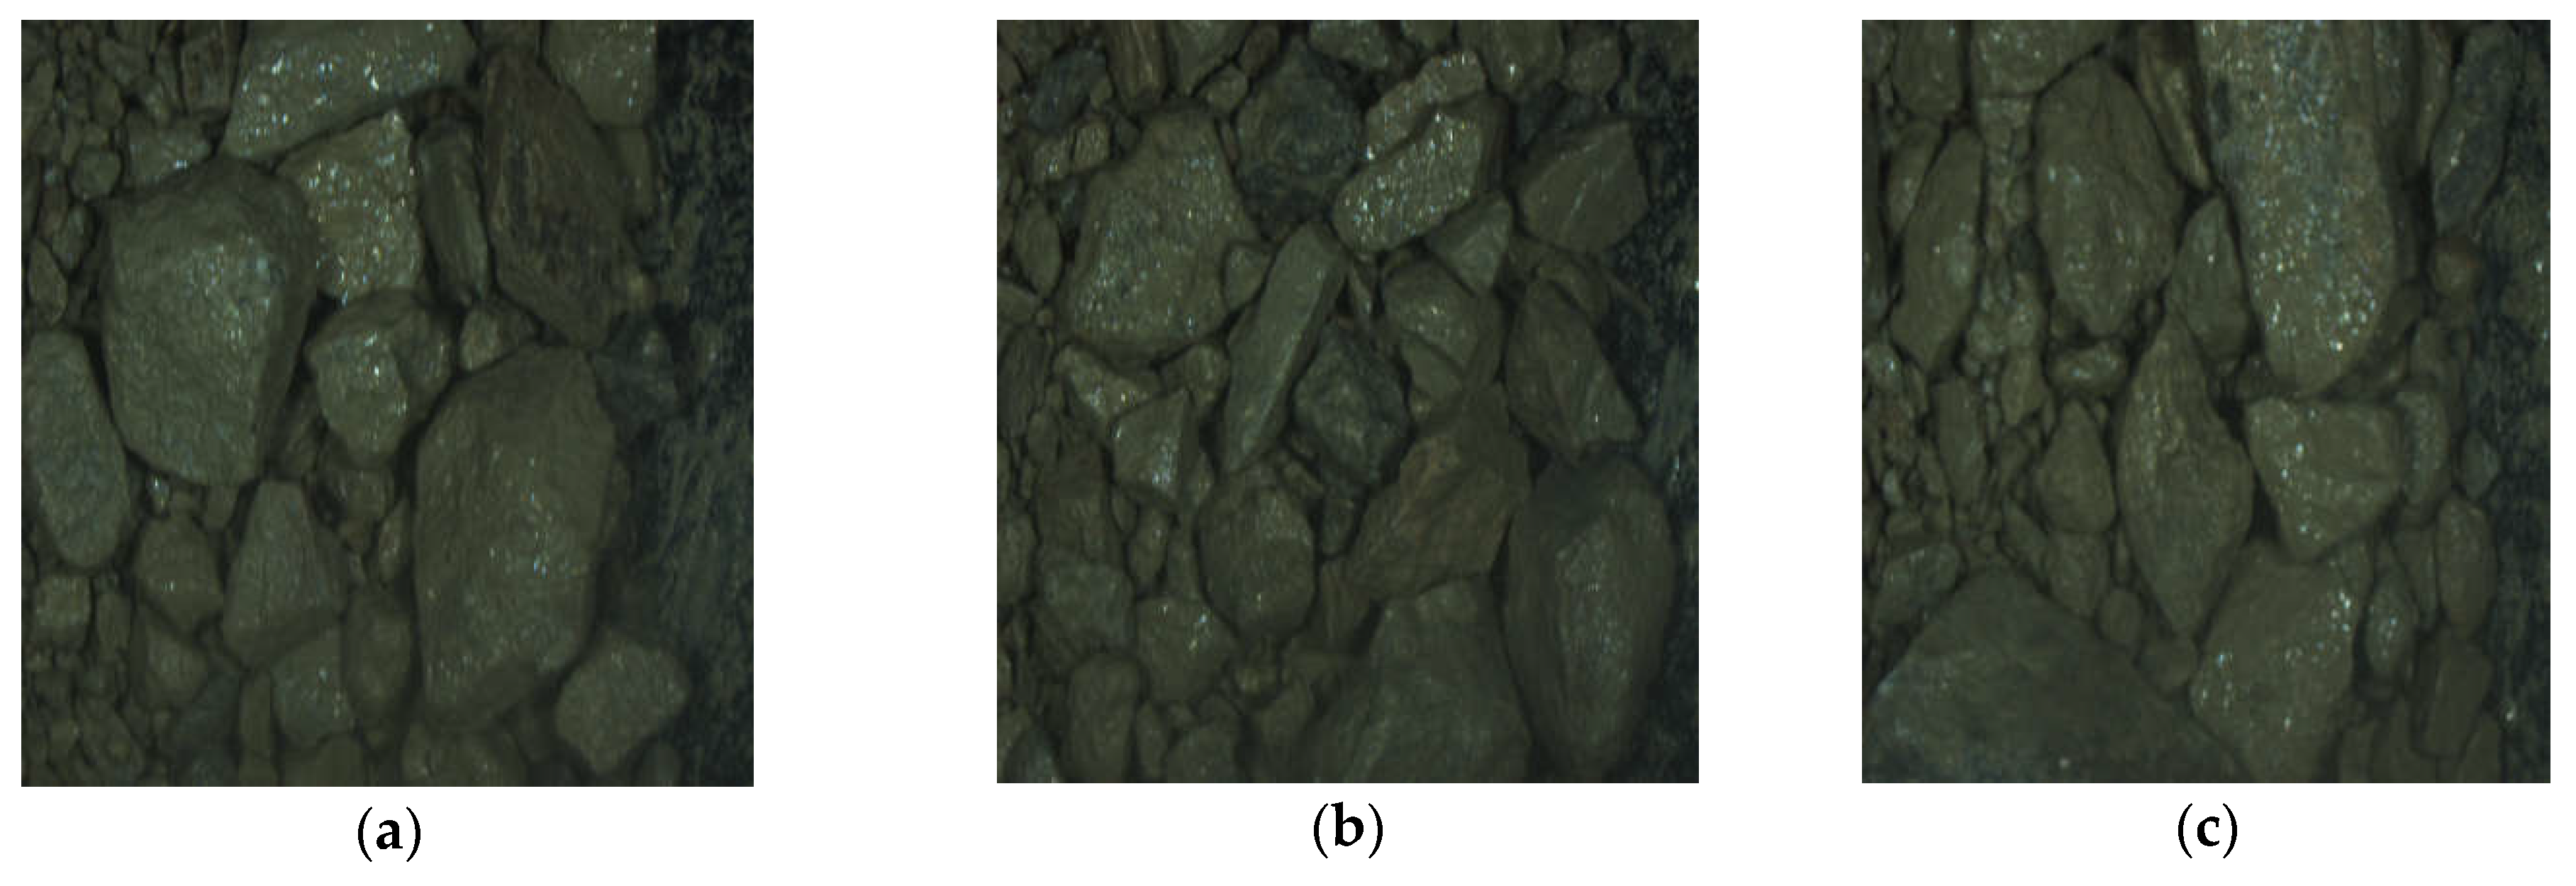
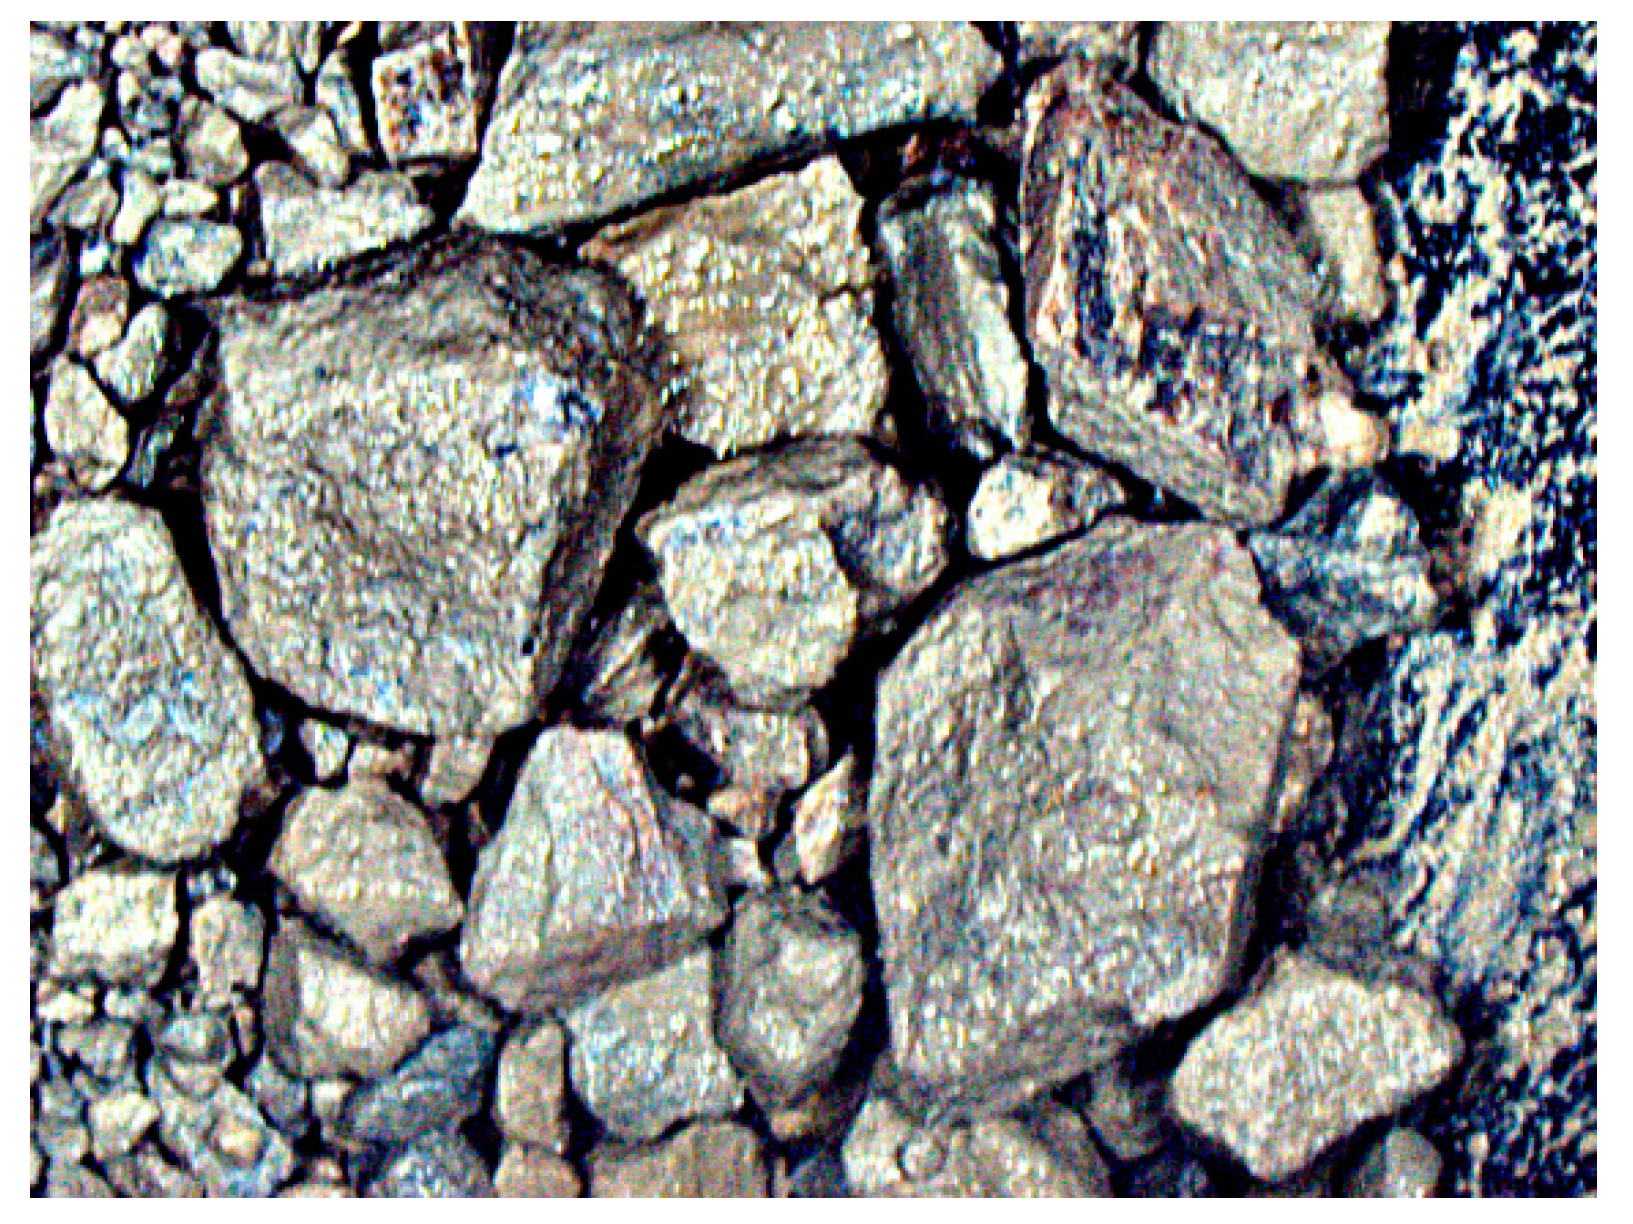
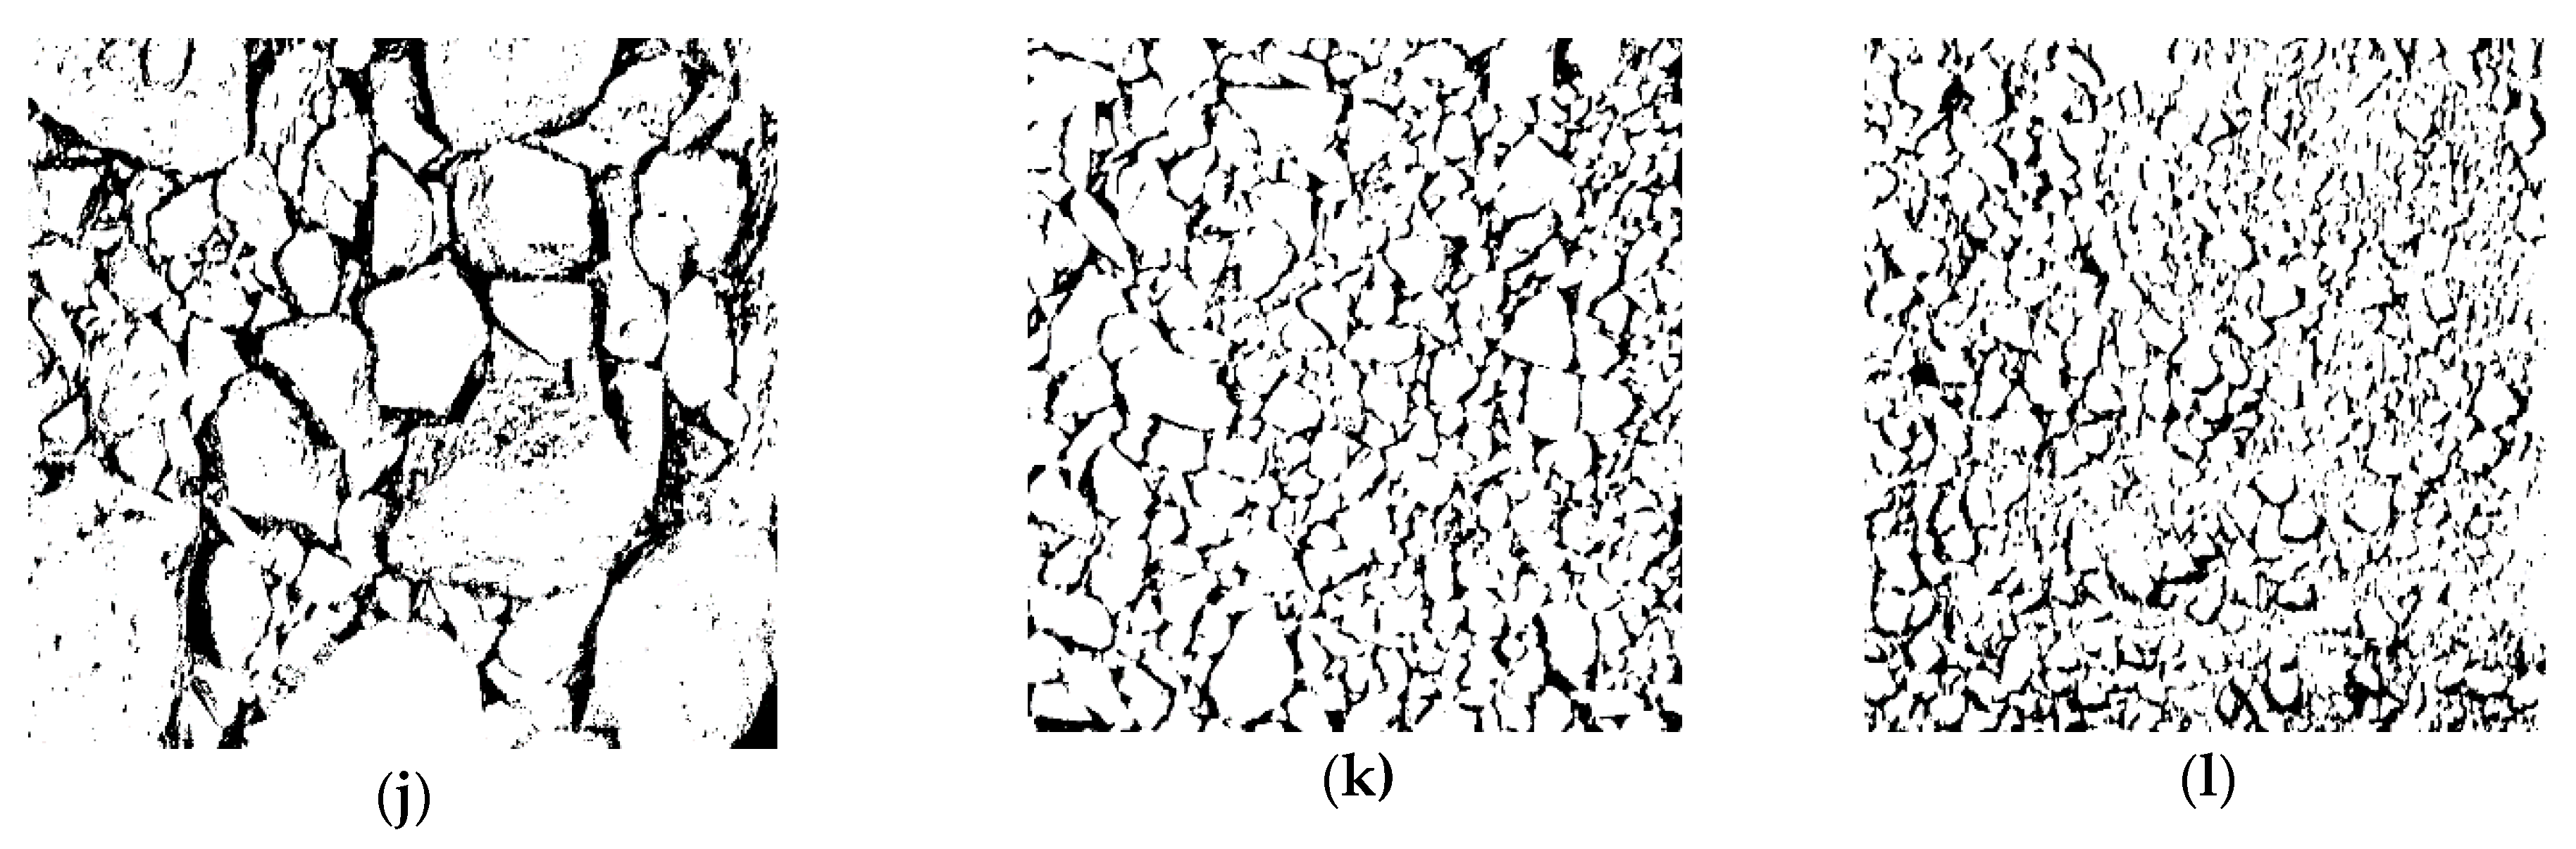
4. Experimental Results and Analysis

The Jiaojia and Sanshandao gold ores were selected as research objects. An industrial camera was installed vertically above the conveyor belt of the crushing plant and symmetric light sources were placed on both sides. Three kinds of ore images (coarse, middle and fine) were selected as the test images. The objects were segmented from the background pixels by the HCM_OTSU segmentation algorithm.
Part of the experimental results is shown in Figure 5. Columns 1, 4 and 7 of Figure 5 are the original ore images ground by three kinds of crushers, columns 2, 5 and 8 of Figure 5 are enhanced results processed by MSRCR and columns 3, 6 and 9 of Figure 5 are the results of the HCM_OTSU algorithm segmentation.
The proposed HCM_OTSU segmentation algorithm is compared with the traditional ore segmentation methods such as OTSU and double-window OTSU. The subjective and objective results are analyzed, respectively.

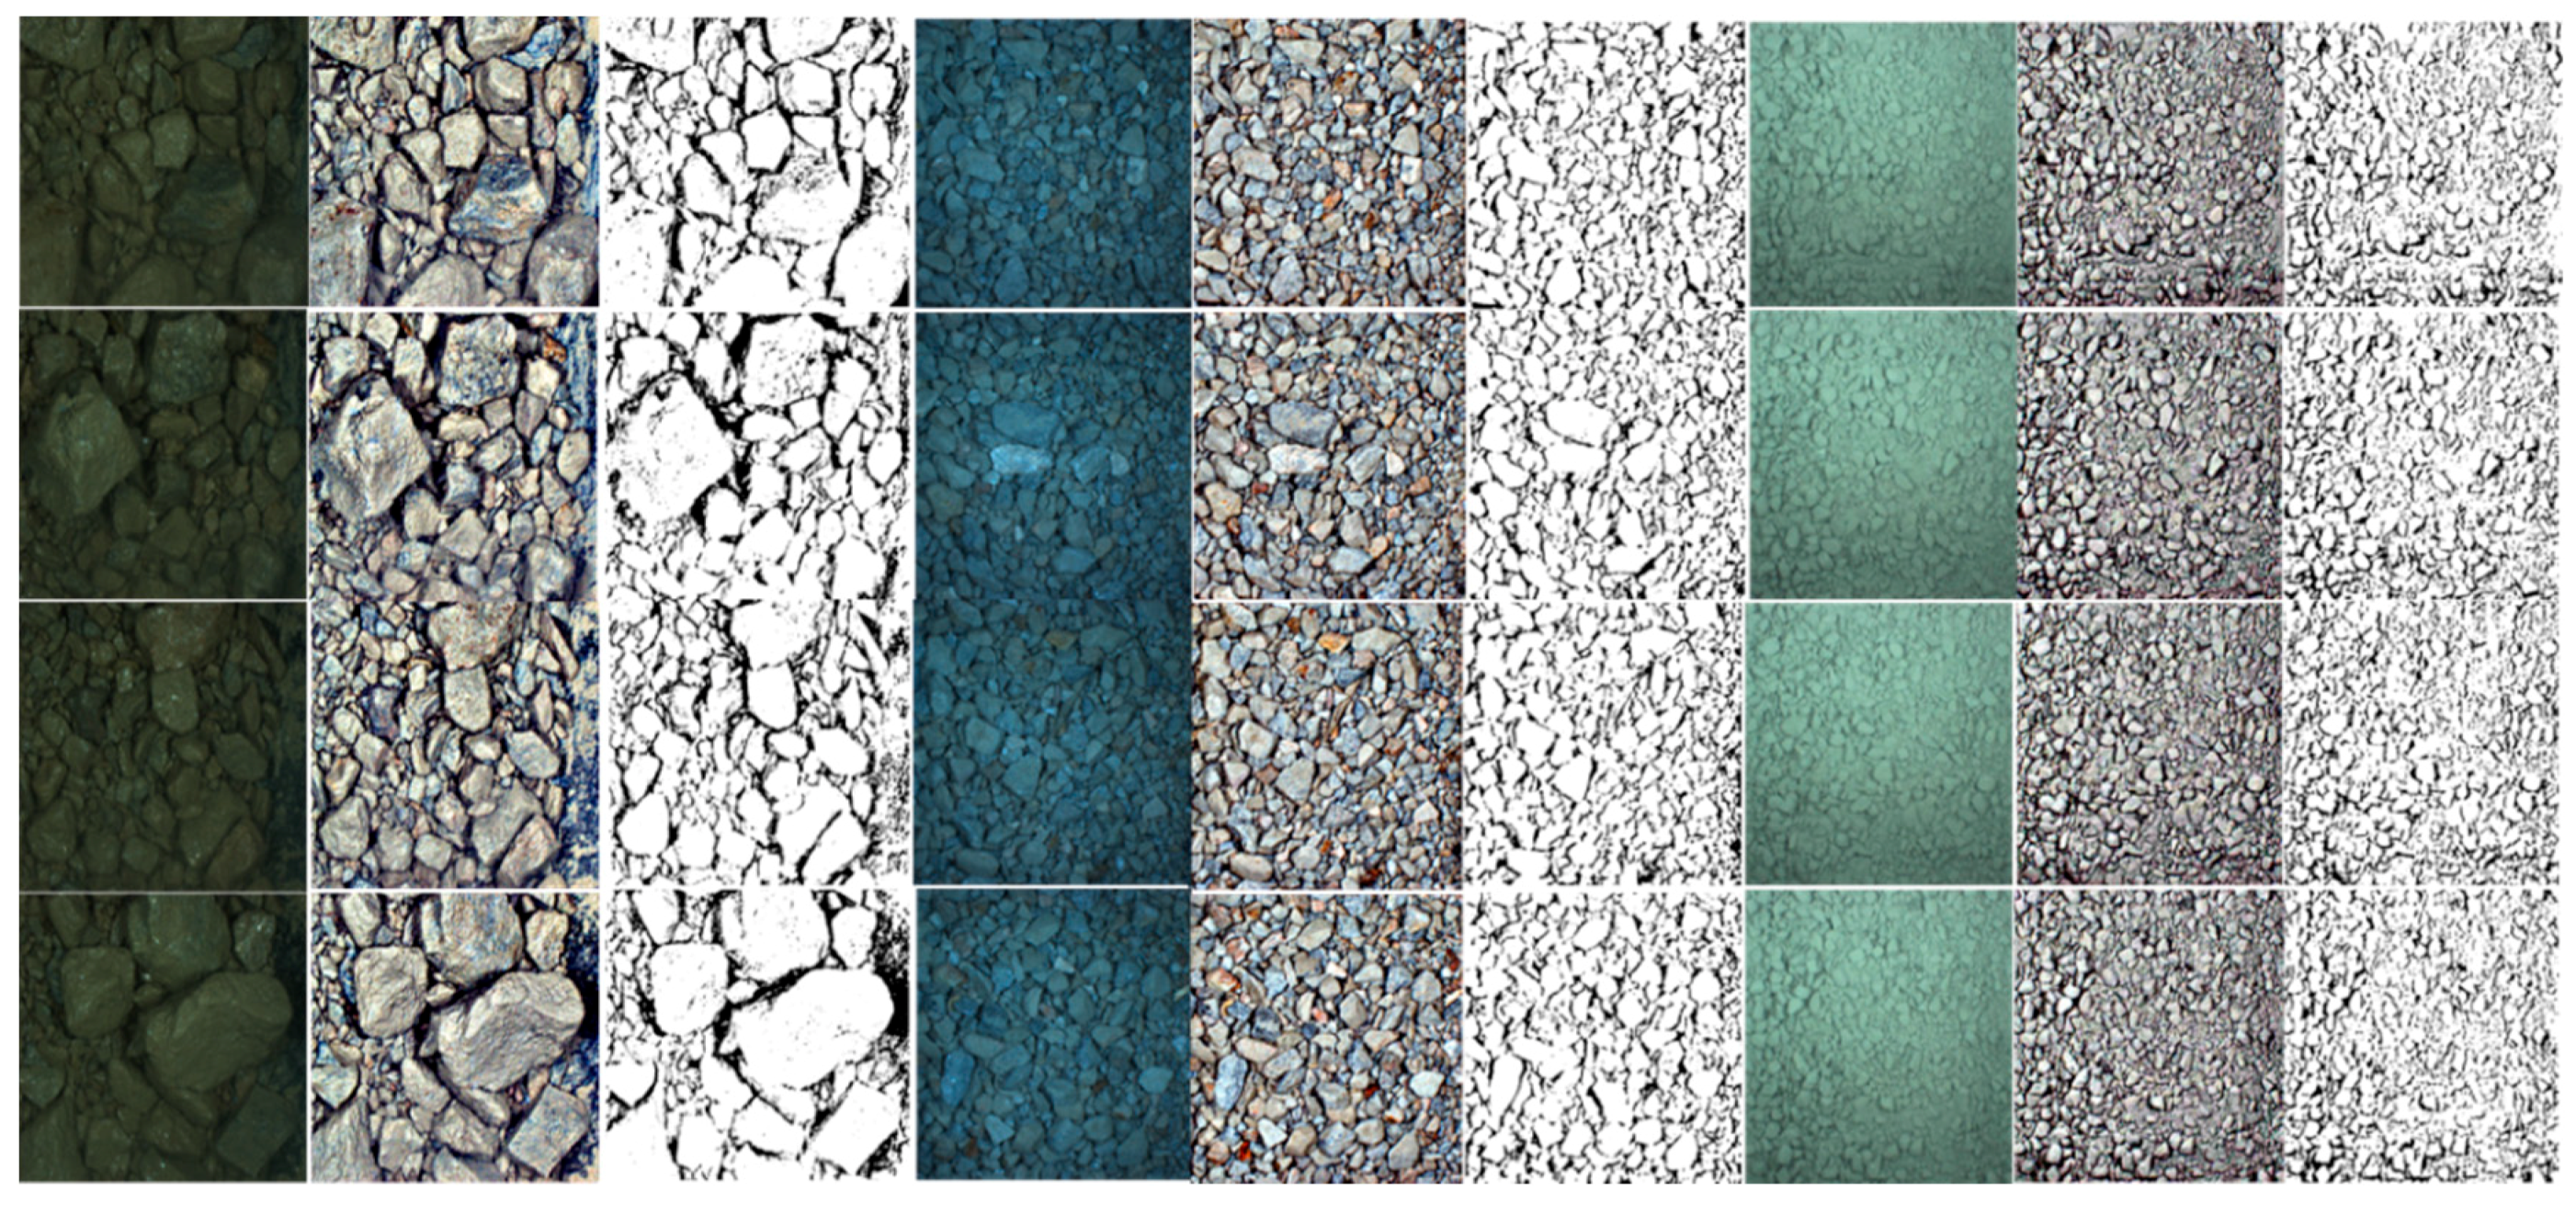
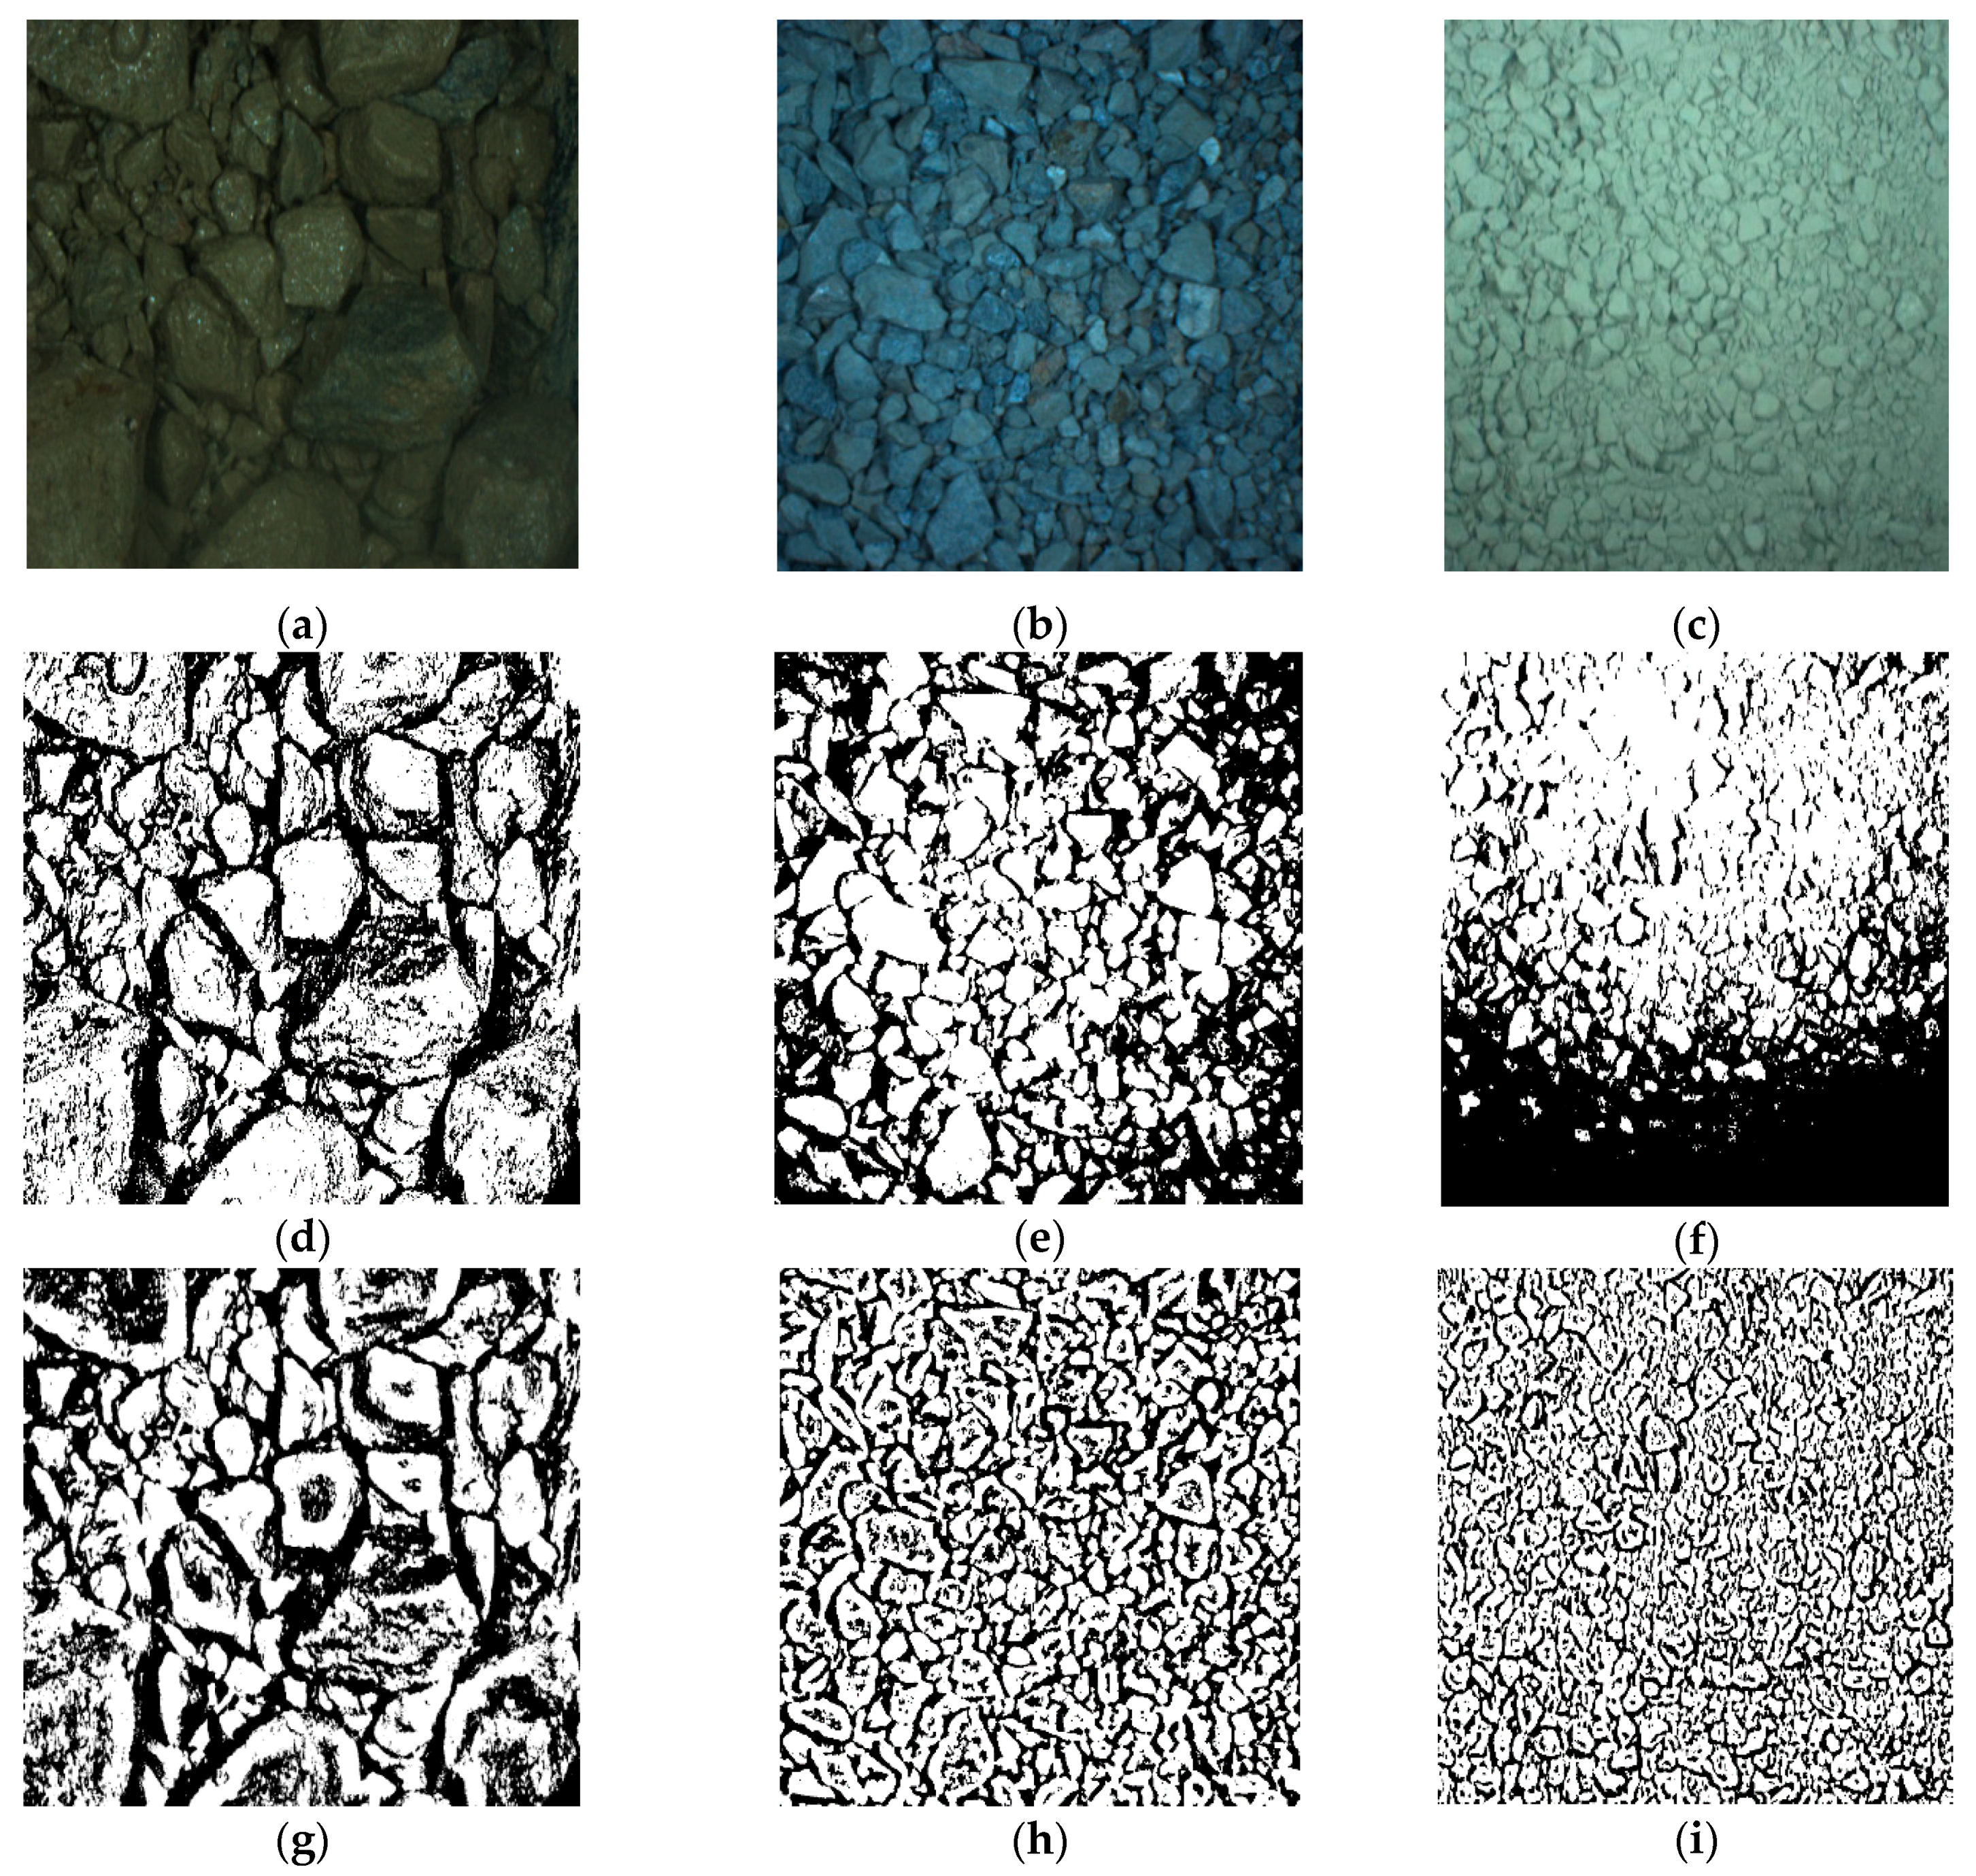
4.1. Qualitative Analysis

Three different types of ore images are used to test the segmentation results and the subjective performance of the HCM_OTSU algorithm is evaluated by comparison with other segmentation methods. The segmentation result is shown in the figure below.
Figure 6a shows the coarse crushing ore image. The large size, rough surface and sharp edges of the particles are the majority, while small irregular ores is a minority. A few mineral is covered by mud and the overall image is dull due to insufficient light.
Figure 6b displays the middle crushing ore image. The difference of overall size is not large, and the stone particles are round and full. The exposure in the middle of the image is too high.
Figure 6c is the fine ore image. The image is unevenly illuminated and the whole image is mixed with powdery particles.
After the contrast of the image is enhanced by MSRCR algorithm, the objects are segmented using different threshold algorithms.
Figure 6d–f are OTSU segmentation results for coarse, middle and fine ore images, respectively.
Figure 6g–i are double-window OTSU results for these three ore images, respectively.
Figure 6j–l are the HCM_OTSU segmentation results.
The three algorithms of OTSU, double-window OTSU and HCM_OTSU are compared and analyzed as follows:
The first column is comparison result of the three algorithms for coarse ores. Figure 6d is the mineral object result segmented by the OTSU methods. It is difficult to divide the large-sized ore completely because of being susceptible to internal texture and sharp angular.
Figure 6g is the result segmented by the double-window OTSU. From the result, large area of noise appears inside ore profile. It cannot adaptively select the threshold because we need to select the window size by practical experience.
Figure 6j shows the result of the HCM_OTSU. The overall mineral object is clear and the noise of object interior is less. We can realistically segment the ore object.
The second column is the comparison result of the three algorithms for middle minerals. Figure 6e is the result of OTSU. Under the influence of exposure, the objects in the four corners of ore image are submerged in the background. The object is lost, and some boundaries are incomplete. Figure 6h is the result of the double-window OTSU. Most object outlines are clear but there are a lot of voids inside the target. So, the segmentation is incomplete. Figure 6k is the result of the HCM_OTSU algorithm. The overall ore particle is distinct although the boundary of individual is adhesive and incomplete.
The third group is the comparison result of the three algorithms for fine minerals. Figure 6f is the result of OTSU. Affected by uneven illumination, large part of target is submerged in the background. Most mineral objects have serious “sticky” phenomenon. Figure 6i is the result of the double-window OTSU threshold algorithm. The threshold is selected in a small window and the object contours are better preserved. But the "internal holes" noise is serious. Figure 6l is the HCM_OTSU result. It retains the object boundaries and fills the internal holes although a few mineral edges are stuck.
The ore particles are transferred by different conveyor belts and crushed at all levels. The surface of the minerals is rough, and the boundaries are distinct. At the same time, the images of the minerals are photographed in severe environment. So, the traditional threshold method is difficult to segment effectively and accurately. An OTSU segmentation algorithm based on histogram accumulation moment is proposed. It can not only effectively separate ore images with unimodal or insignificant bimodal gray histogram but also have a high noise immunity by improving the 0th order and 1st order cumulative moment of the histogram, not depending on the gray level pixels of the whole image, only considering the effective pixels, selecting the optimal threshold step by step.

4.2. Quantitative Analysis

In order to further verify the effectiveness of the proposed method, we compare the results of the HCM_OTSU algorithm with manually drawn by experts. Various analysis indicators are used to evaluate the threshold segmentation performance: mis-segmentation rate, detection rate of ore object and false alarm detection. The mis-segmentation rate is divided into the false negative rate and the false positive rate. The false negative rate reflects that the target pixel is erroneously judged as the background pixel, while the false positive rate represents the background pixel is wrongly divided into the object pixel.
The false negative rate is referred to as F n r . It represents the result of the algorithm is subtracted from the experts and the ratio of the number of missing pixels to the total number of pixels is obtained.
F n r = G T ( G T M T ) G T + N T
where the experts result G T represents as a theoretical segmentation reference, M T is the algorithm segmentation result as the actual segmentation and N T is the number of pixels appearing in the actual segmentation but not including in the expert reference image.
The false positive rate is F p r . It counts the number of extra pixels appearing in the algorithm but not in the reference image. Then, the ratio of the number of extra pixels to the total number of pixels is calculated.
F p r = N T G T + N T
The smaller F n r and F p r , the better the segmentation and the closer the segmentation algorithm is to the ideal effect. Table 1 shows the false negative rate and the false positive rate of the three methods for different crushing ore images.
Compared with the results of OTSU and double-window OTSU algorithm, the F n r of HCM_OTSU algorithm are greatly reduced by 0.244 and 0.371 and F p r are reduced by 0.049 and 0.055, respectively. The false negative rate and false positive rate of the proposed algorithm are the smallest, which means that it achieves the balance between the preserving object boundary and the removing noise. Our method is better for segmenting coarse ore images.
Compared with the other two methods, the F n r of our proposed algorithm is decreasing in terms of middle ore image, which is reduced by 0.303 and 0.306, respectively. Although the F p r of our method is 0.145 smaller than OTSU, it is increased by 0.012 compared with double-window OTSU. It indicates that the internal noise is eliminated but a few target boundaries are incomplete. Our method can divide middle ore image well.
The F n r of our method is reduced by 0.302 and 0.078 and the F p r is dropped by 0.045 and 0.157 in the fine ore, respectively. The false negative rate and false positive rate of the proposed algorithm are the smallest but there are over-segmentation and under-segmentation to some extent. Our method can roughly segment the fine particle size and the mis-segmentation can be reduced by some subsequent process.
Detection rate and false alarm rate are commonly used in pattern recognition and are widely applied in ore object detection. The related definitions are as follows:
Detection rate D R is the correctly identified number of ore target samples.
D R = N c N t
where N c is the number of ore samples correctly detected and N t is the total number of ore samples.
The false alarm rate F A R is the ratio of being wrongly detected as ore objects in the total number of non-ore targets.
F A R = N e N b
where N e is the number of non-ore samples detected as ore and N b is the total number of non-ore samples.
Table 2 shows the detection rate and false alarm detection rate of three algorithms for different crushed ore images. It can be seen that the detection rate of the proposed algorithm is 89.6% for the ore objects, which is 34.5% and 29.3% higher than OTSU and double-window OTSU, respectively. The false alarm detection rate is 17.4%, which is 19.5% and 45.8% lower than OTSU and double-window OTSU. Therefore, the proposed algorithm has high detection rate and low false detection rate.
The OTSU has the lowest detection rate, which is due to the fact that the threshold selection is biased towards the larger between-class variance. The double-window OTSU has a higher detection rate, while the highest false detection rate. It is because background and dusts are detected as mineral objects mistakenly.
The proposed algorithm is better than the other two methods, which is due to the fact that the threshold only considers pixels closed to the object or background. It can reduce random noise, avoid falling into local optimum and be suitable for mineral images with unimodal or insignificant bimodal. The proposed algorithm can effectively segment the mineral images under different scenarios, meeting the requirement of the visual system for particle size detection.
Our method exhibits high detection rate and low false detection rate in mineral particle size detection. In general, the proposed algorithm can separate object from background pixels accurately and effectively at complex scenes.

5. Conclusions

An OTSU segmentation algorithm based on the histogram accumulation moment, namely HCM_OTSU, is proposed for ore location and detection in complex scenes. The multi-scale Retinex color restoration algorithm is used to improve the contrast of the target in the dark area and eliminate the shadows generated by the accumulated adhesion ore. The zero-order and first-order accumulation moments close to the selected gray level are calculated, reducing the error caused by image background and noise. The gray level gradually approaches the optimal threshold to avoid falling into local optimum. This algorithm can be used in the segmentation of mineral images with unimodal or insignificant bimodal characteristics. Compared with traditional methods, the proposed algorithm achieves better segmentation results in ore object detection. Additionally, the proposed method is simple and easy to operate and can be applied to real-time ore particle size detection in complex scenes. Future work will focus on the more efficient and accurate edge extraction of ore particle sizes.

Author Contributions

Writing—Original Draft Preparation, Y.Z.; Writing—Review & Editing, Y.Z.; Visualization, G.Z.; Supervision, G.Z.

Funding

This research received no external funding.

Conflicts of Interest

The authors declare no conflict of interest.

References

  1. Yang, X. Beneficiation studies of tungsten ores—A review. Miner. Eng. 2018, 125, 111–119. [Google Scholar] [CrossRef]
  2. Leroy, S.; Pirard, E. Mineral recognition of single particles in ore slurry samples by means ofmultispectral image processing. Miner. Eng. 2019, 132, 228–237. [Google Scholar] [CrossRef]
  3. Charikinya, E.; Bradshaw, S.; Becker, M. Characterising and quantifying microwave induced damage in coarsesphalerite ore particles. Miner. Eng. 2015, 82, 14–24. [Google Scholar] [CrossRef]
  4. Pérez-Barnuevo, L.; Lévesque, S.; Bazin, C. Automated recognition of drill core textures: A geometallurgical tool formineral processing prediction. Miner. Eng. 2018, 118, 87–96. [Google Scholar] [CrossRef]
  5. Muter, D.; Pedersen, S.; Sorensen, H.O.; Feidenhans’l, R.; Stipp, S.L.S. Improved segmentation of X-ray tomography data from porous rocks usinga dual filtering approach. Comput. Geosci. 2012, 49, 131–139. [Google Scholar] [CrossRef]
  6. Chatterjee, S.; Bhattacherjee, A.; Samanta, B.; Pal, S.K. Image-based quality monitoring system of limestone ore grades. Comput. Ind. 2010, 61, 391–408. [Google Scholar] [CrossRef]
  7. Wang, Y.; McClung, C.; Lin, C.L.; Miller, J.D. Stereological correction of perimeter based estimates of exposed grainsurface area. Miner. Eng. 2018, 126, 64–73. [Google Scholar] [CrossRef]
  8. Kose, C.; Alp, I.; Ikibas, C. Statistical methods for segmentation and quantification of mineralsin ore microscopy. Miner. Eng. 2012, 30, 19–32. [Google Scholar] [CrossRef]
  9. Heydari, M.; Amirfattahi, R.; Nazari, B.; Rahimi, P. An industrial image processing-based approach for estimation of iron oregreen pellet size distribution. Powder Technol. 2016, 303, 260–268. [Google Scholar] [CrossRef]
  10. Zhang, Z.; Yang, J.; Su, X.; Ding, L.; Wang, Y. Multi-scale image segmentation of coal piles on a belt based on theHessian matrix. Particuology 2013, 11, 549–555. [Google Scholar] [CrossRef]
  11. Otsu, N. A threshold selection method from gray-level histogram. IEEE Trans. Syst. Man Cybern. 1979, 9, 62–66. [Google Scholar] [CrossRef]
  12. Fan, H.; Xie, F.; Li, Y.; Jiang, Z.; Liu, J. Automatic segmentation of dermoscopy images using saliency combinedwith Otsu threshold. Comput. Biol. Med. 2017, 85, 75–85. [Google Scholar] [CrossRef]
  13. Goh, T.Y.; Basah, S.N.; Yazid, H.; Safar, M.J.A.; Saad, F.S.A. Performance analysis of image thresholding: Otsu technique. Measurement 2018, 114, 298–307. [Google Scholar] [CrossRef]
  14. Hua, J.; Qian, Z.; Wang, D.; Oeser, M. Influence of aggregate particles on mastic and air-voids in asphaltconcrete. Construct. Build. Mater. 2015, 93, 1–9. [Google Scholar] [CrossRef]
  15. Gajalakshmi, K.; Palanivel, S.; Nalini, N.J.; Saravanan, S.; Raghukandan, K. Grain size measurement in optical microstructure usingsupport vector regression. Optik 2017, 138, 320–327. [Google Scholar]
  16. Chi, D.L.; Song, E.; Gaudin, A.; Saltzman, W.M. Improved threshold selection for the determination of volume ofdistribution of nanoparticles administered by convection-enhanceddelivery. Comput. Med Imaging Graph. 2017, 62, 34–40. [Google Scholar] [CrossRef] [PubMed]
  17. Mahgoub, A.; Talab, A.; Huang, Z.; Xi, F.; HaiMing, L. Detection crack in image using Otsu method and multiple filtering in image processing techniques. Optik 2016, 127, 1030–1033. [Google Scholar]
  18. Malarvel, M.; Sethumadhavan, G.; Bhagi, P.C.R.; Kar, S.; Thangavel, S. An improved version of Otsu’s method for segmentation ofweld defects on X-radiography images. Optik 2017, 142, 109–118. [Google Scholar] [CrossRef]
  19. Yuan, X.; Wu, L.; Peng, Q. An improved Otsu method using the weighted object variance fordefect detection. Appl. Surf. Sci. 2015, 349, 472–484. [Google Scholar] [CrossRef]
  20. Azeroual, A.; Afdel, K. Fast Image Edge Detection based on Faber Schauder Wavelet and Otsu Threshold. Heliyon 2017, 3, e00485. [Google Scholar] [CrossRef]
  21. Harb, S.M.E.; Isa, N.A.M.; Salamah, S.A. Improved image magnification algorithm based on Otsu thresholding. Comput. Electr. Eng. 2015, 46, 338–355. [Google Scholar] [CrossRef]
  22. Zhang, G.Y.; Liu, G.Z.; Zhu, H.; Qiu, B. Ore image thresholding using bi-neighbourhood Otsu’s approach. Electron. Lett. 2010, 46, 1666–1668. [Google Scholar] [CrossRef]
  23. Land, E.H.; McCann, J.J. Lightness and Retinex theory. J. Opt. Soc. Am. 1971, 61, 1–11. [Google Scholar] [CrossRef] [PubMed]
  24. Wang, G.; Dong, Q.; Pan, Z.; Zhang, W.; Duan, J.; Bai, L.; Zhang, J. Retinex theory based active contour model for segmentation of inhomogeneous images. Digit. Signal Process. 2016, 50, 43–50. [Google Scholar] [CrossRef]
  25. Jobson, D.J.; Rahman, Z.; Woodell, G.A. A multiscale retinex for bridging the gap between color images and the human observation of scenes. IEEE Trans. Image Process. 1997, 6, 965–976. [Google Scholar] [CrossRef]
Figure 1. Images of the original ore. (ac) are crushing ore in Jiaojia gold mine.
Symmetry 11 00431 g001
Figure 2. The gray histogram of ore image and OTSU threshold.
Symmetry 11 00431 g002
Figure 3. The segmentation result of OTSU.
Symmetry 11 00431 g003
Figure 4. The image enhancement based on MSRCR.
Symmetry 11 00431 g004
Figure 5. The image enhancement based on MSRCR. Partial results of the proposed algorithm.
Symmetry 11 00431 g005
Figure 6. The comparison of ore segmentation result. (a) is coarse ore; (b) is middle ore; (c) is fine ore; (df) are OTSU results for (ac); (gi) are double-window OTSU results for (ac); (jl) are the HCM_OTSU results for (ac).
Symmetry 11 00431 g006aSymmetry 11 00431 g006b
Table 1. The false negative rate and the false positive rate of the three methods.
Data SetOTSUDouble-Window OTSUOur Method
FnrFprFnrFprFnrFpr
Coarse images0.2590.0570.3860.0630.0150.008
Middle image0.3090.2840.3120.1270.0060.139
Fine image0.5870.3430.3630.4550.2850.298
Table 2. The detection rate and false alarm detection rate of three algorithms.
Detection IndicatorOTSUDouble-Window OTSUOur Method
DR55.1%60.3%89.6%
FAR36.9%63.2%17.4%

