Article

Performance Improvement of a Liquid Molten Salt Pump: Geometry Optimization and Experimental Verification

1
National Research Center of Pumps and Pumping System Engineering and Technology, Jiangsu University, Zhenjiang 212013, China
2
Institute of Fluid Engineering Equipment, Jiangsu Industrial Technology Research Institute (JITRI), Zhenjiang 212009, China
3
TE Connectivity (Suzhou) Ltd., Suzhou 215121, China
4
School of Mechanical and Aerospace Engineering, Gyeongsang National University, Jinju 660701, Korea
*
Authors to whom correspondence should be addressed.
Symmetry 2019, 11(3), 423; https://doi.org/10.3390/sym11030423
Submission received: 1 February 2019 / Revised: 11 March 2019 / Accepted: 20 March 2019 / Published: 22 March 2019

Abstract

:
In order to enhance the hydraulic efficiency of a liquid molten salt pump, the improvement on the pump was carried out through numerical and experimental methods. The internal flow field obtained by the numerical simulation was analysed. The results show that there are low-velocity area in the scroll region and large curvature of the streamline at the outlet. Geometric modification was made by trimming the back-blades of the impeller and filleting the sharp corner of the outlet pipe. The modified pump performance was verified by the experiments. The hydraulic efficiency, the pressure fluctuation, vibration characteristics between the original and modified pump were compared. The results showed that the hydraulic efficiency of the modified pump increased 7.4%. In addition, the pressure fluctuation and vibration intensity were also reduced compared with the original pump. This result shows that the geometric modification improves not only the hydraulic performance but also the structural properties.

1. Introduction

A liquid molten salt pump is a vertical submerged centrifugal pump that is mainly used to transport high-temperature substances, including nitrate, nitrite, and ionic membrane caustic soda. It is widely used in nuclear reactors, salt manufacturing, alkali manufacturing, and other chemical industries. As the high-speed rotating equipment in the primary system of the fourth-generation molten salt reactor, the molten salt pump is described as the heart of the reactor. Current research regarding molten salt pumps mainly focuses on the internal flow in the flow-passage components, and two-phase flow. Shao [1] analyzed the dimensionless characteristics of a molten salt pump through a combination of experiment and simulation, and established the modeling experiment that using water instead of molten salts. Li [2] studied the influence of the guide vanes on the internal flow field of a molten salt pump through numerical simulation and found that the rotor-stator interference between the impeller and the guide vanes is very obvious. Cheng [3,4] numerically studied the performance characteristics of molten salt pumps under different numbers of blade. Zhu [5] studied the operation stability of the pump transporting high-temperature molten salt, and obtained the deformation of the pump rotor by numerical simulation. Shao [6] numerically studied the flow field of a molten salt pump under different viscosity. Wang [7] studied the electromagnetic pump for liquid sodium by experiments and proposed a theoretical model between flow rate and developed pressure of EMP after detailed deduction based on equivalent circuit theory. Hammitt [8] studied the cavitation characteristics of the centrifugal pump during operation with a molten salt medium. Guo et al. [9] analysed the thermodynamic properties of a molten salt pump at high temperature and studied its structural reliability. Yang et al. [10] proposed a space guide-vane to reduce the secondary flow and vortex in the guide-vane, improving its efficiency. Wang et al. [11] added splitter blades to a high-temperature molten salt pump and discovered that they could reduce motor vibration. Shao et al. [12] used PIV to measure the flow field in a molten salt pump and analysed the velocity field in the impeller and the volute. To reduce the pressure maldistribution of a molten salt pump, Kang et al. [13] installed an axial vane on the impeller outlet and analysed its influence on the pump’s inner flow and performance. Shao et al. [14] analysed external performance and internal flow of a molten salt pump that transported fluids with different viscosities. They found that the pump’s efficiency decreased as the viscosity increased.
Most of the previous researches on molten salt pumps mainly have concentrated on the liquid molten salt pump in the chemical industries [15,16]. The research of high-temperature molten salt in nuclear reactors is still Insufficient. In this study, we investigate the performance improvement of a liquid molten salt pump prototype next introduced in Section 2.1 by geometric modification. First, the numerical analysis was carried out and the results were used to guide the modification. Later, the hydraulic performance, pressure characteristics and vibration characteristics were measured and analysed.

2. Numerical and Experimental Method of Geometry Optimization

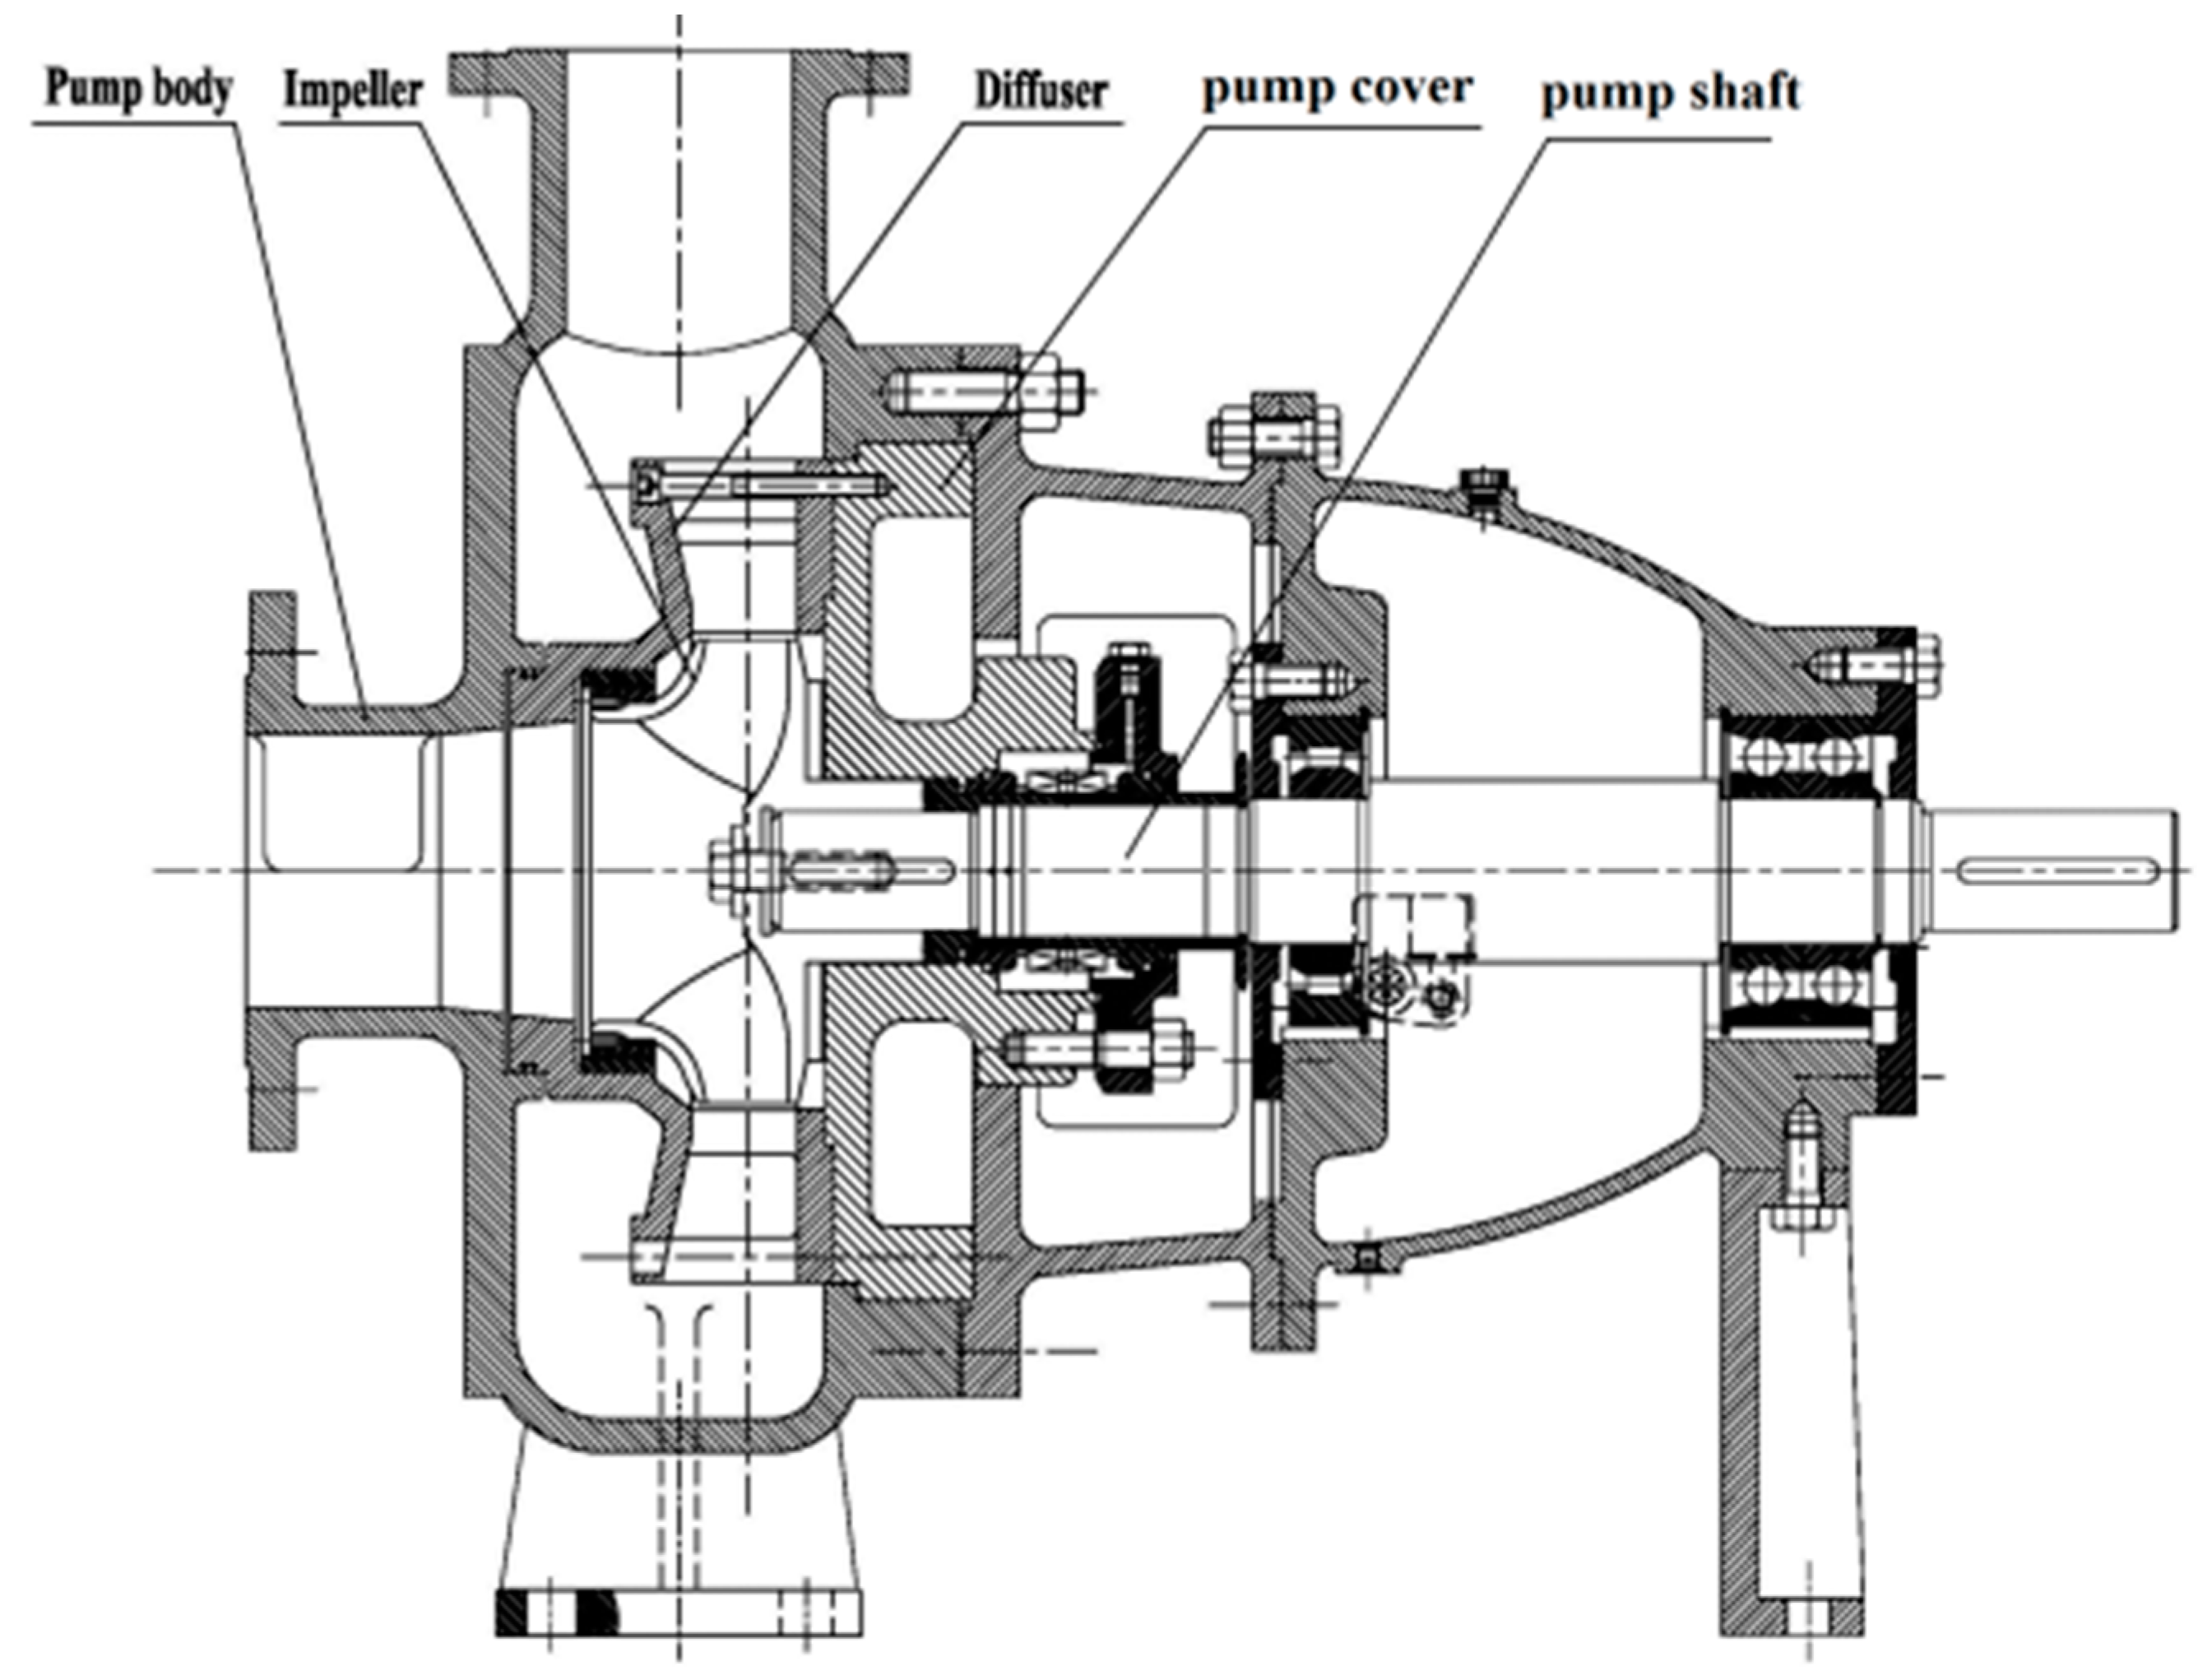
2.1. Prototype Liquid Molten Salt Pump

The components of the molten salt pump are placed in a pressure stabilizing tank, which is filled with high temperature molten salt to maintain the pressure and temperature in the tank. In order to solve the problem of thermal deformation of structure caused by high temperature molten salt, the annular chamber with symmetrical structure is used in molten salt pump. The annular chamber can’t eliminate effectively the velocity circulation of fluid because the cross-section area remains unchanged. And the excessive velocity of media in the annular chamber will lead to the larger radial force, which will cause a heavy load on the shaft. So a diffuser is used to eliminate the velocity circulation of the medium. In order to reduce the probability of collision between different parts due to the thermal deformation of different parts at high temperature, the central plane of impeller, diffuser and volute is designed on one surface and the width of volute inlet is designed to be much larger than that of impeller outlet.
Design parameters of a prototype liquid molten salt pump for a molten salt reactor are as follows. The design flow rate Qd is 270 m3/h, the head Hd is 15 m, the efficiency η is 75%, and the rotation speed n is 1450 rpm. A structural diagram of prototype pump is shown in Figure 1. It mainly consists of a pump body, impeller, diffuser, pump shaft, and pump cover. The main flow passage components are shown in Figure 2.
The pump body, impeller, and diffuser are made of stainless steel. The diffuser and impeller are made from wax models by 3D printing, as shown in Figure 2a,b. Impeller, diffuser and pump body are shown in Figure 2c.

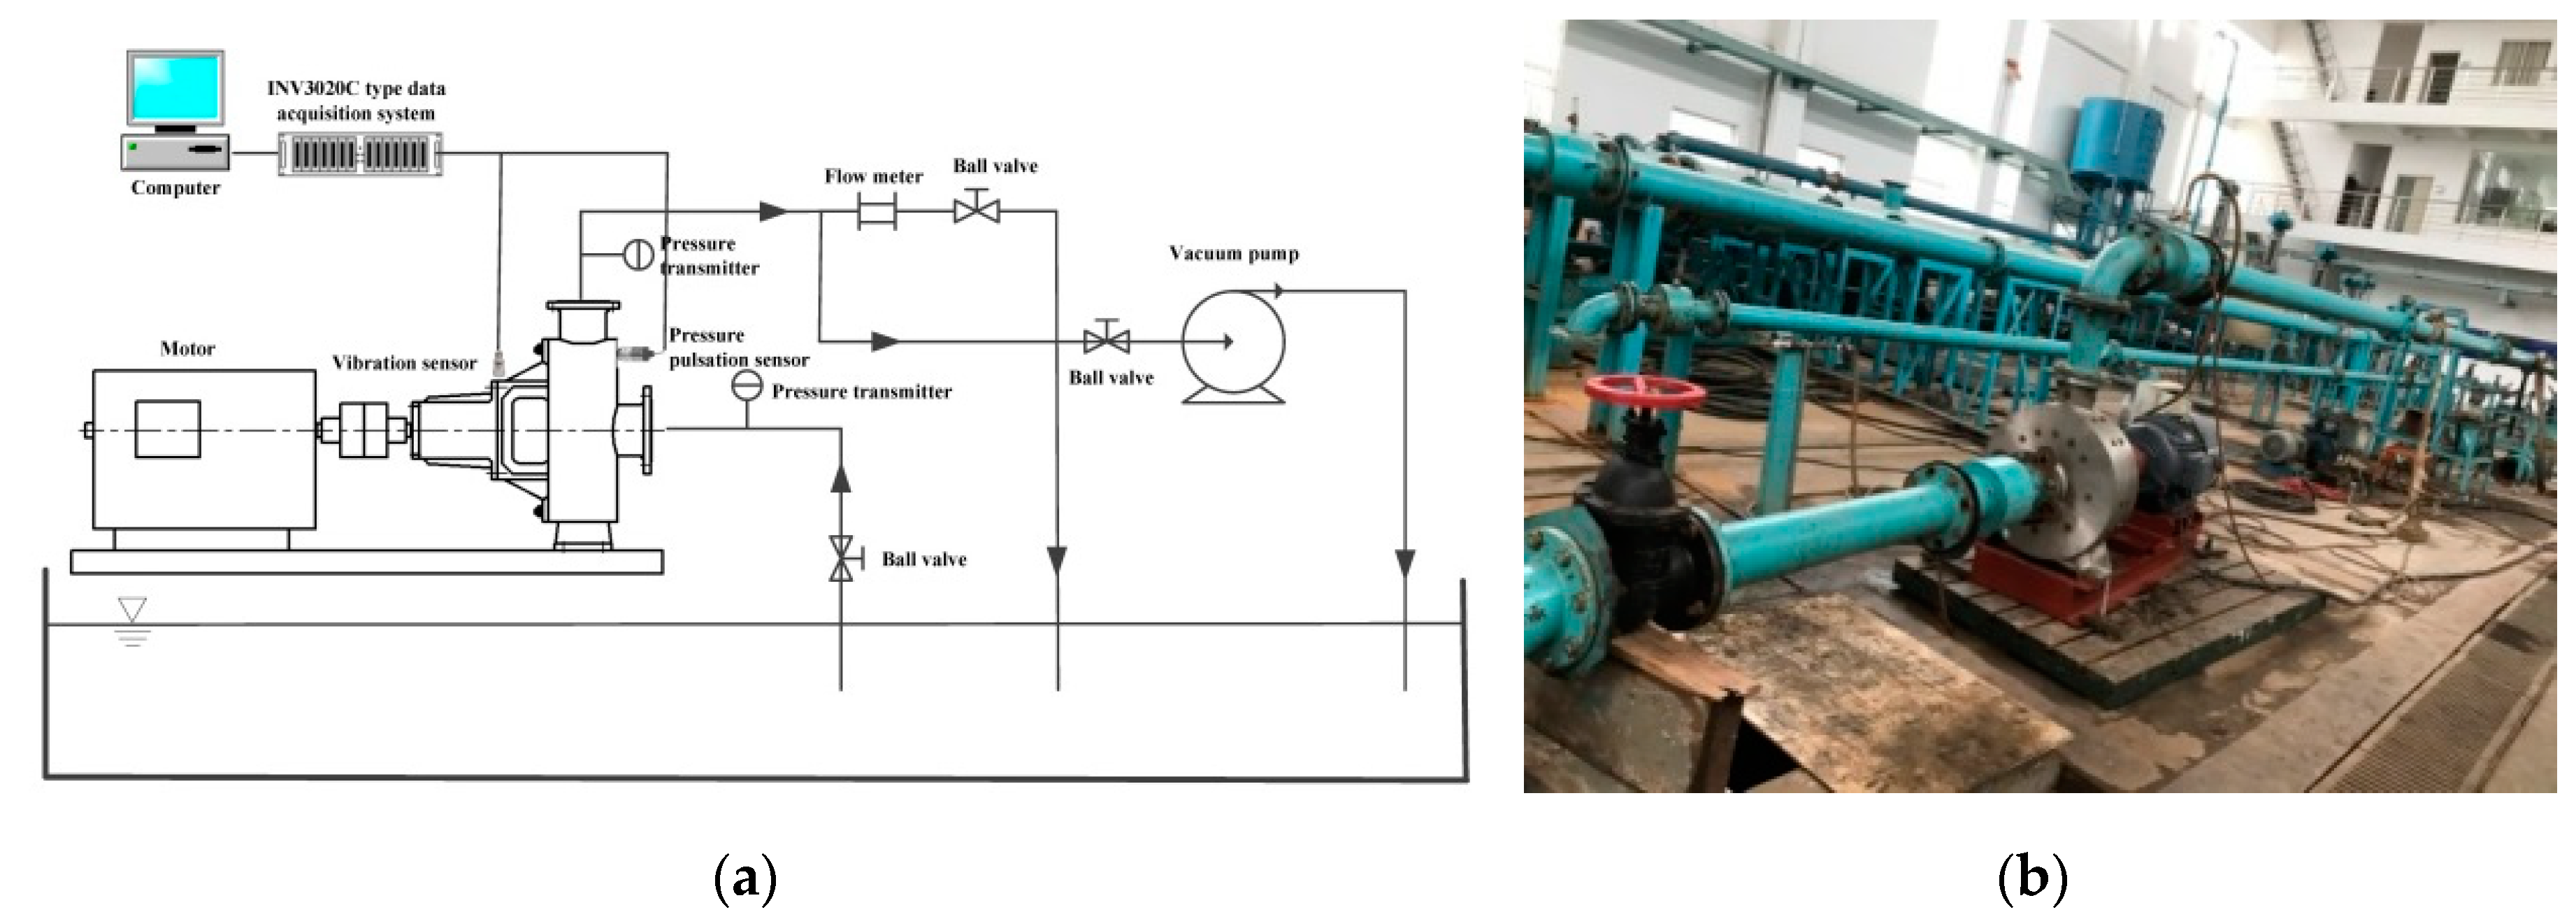
2.2. Performance Experiment

Experiment bench of the prototype pump is shown in Figure 3. As shown in the components sketched, the experiment bench includes two pressure transmitters for measuring pressure, a flow meter for measuring the flow rate, a vibration sensor, a pressure pulsation sensor, a INV3020C type data acquisition system for collecting data, and a computer.
Figure 4 shows the pump performance curve of the prototype pump obtained by experiment. The experiment using water as a medium is carried out to verify the optimization results because the performance of the pump changes in a consistent manner in both water and molten salt media. It can be seen form Figure 4 that under the design flow rate, the head of the pump is 15.03 m and the pump’s efficiency is 71.5%. Because the pump’s efficiency does not meet the design requirement of 75%, the structure of the prototype pump needs to be modified.
The specifications of sensors are shown in Table 1. Based on several experiments under the same conditions, we obtain the uncertainty of the experiment, which is shown in Table 2.

2.3. Numerical Simulation Method

2.3.1. Grid independence Analysis

The model and assembly of the pump were carried out by Pro/E. ICEM was chosen for hexahedral mesh generation, as shown in Figure 5. In order to select the appropriate grid number, mesh sensitivity analysis was carried out. Table 3 shows results of grid independence analysis. As can be seen from Table 3, with the increase of grids number, head and efficiency of the pump under design flow rate will gradually approach the results of the experiment, and the simulation results tend to be unchanged. Therefore, considering the calculation time, No. 4 scheme was selected for the subsequent simulation.

2.3.2. Boundary Conditions

The numerical simulation was carried out by CFX. This study focuses on the improvement of hydraulic performance, so the Fluid medium was water that is consistent with experimental medium. The impeller and back-blades of impeller were arranged in a rotation domain with a rotational speed of 1450 r/min. Other domains were set to be static domains. There are three pairs of static and dynamic interfaces. They are impeller and gap, back-blades of impeller and gap, impeller and suction chamber. Other interfaces were defined as static interfaces. The inlet pressure was set as the total pressure of 1 atm, and the outlet was set to be the calculated mass flow rate. The walls were set as no-slip condition and the roughness was 0.025 mm. Standard k-ε model was chosen for the subsequent simulation.
For the unsteady calculation, the interface between the static domains and rotation domain was set to "transient rotor-stator" in order to capture the strong unsteady interaction phenomenon. The time step for this calculation method was set to 1.15 × 10⁻⁴ s.

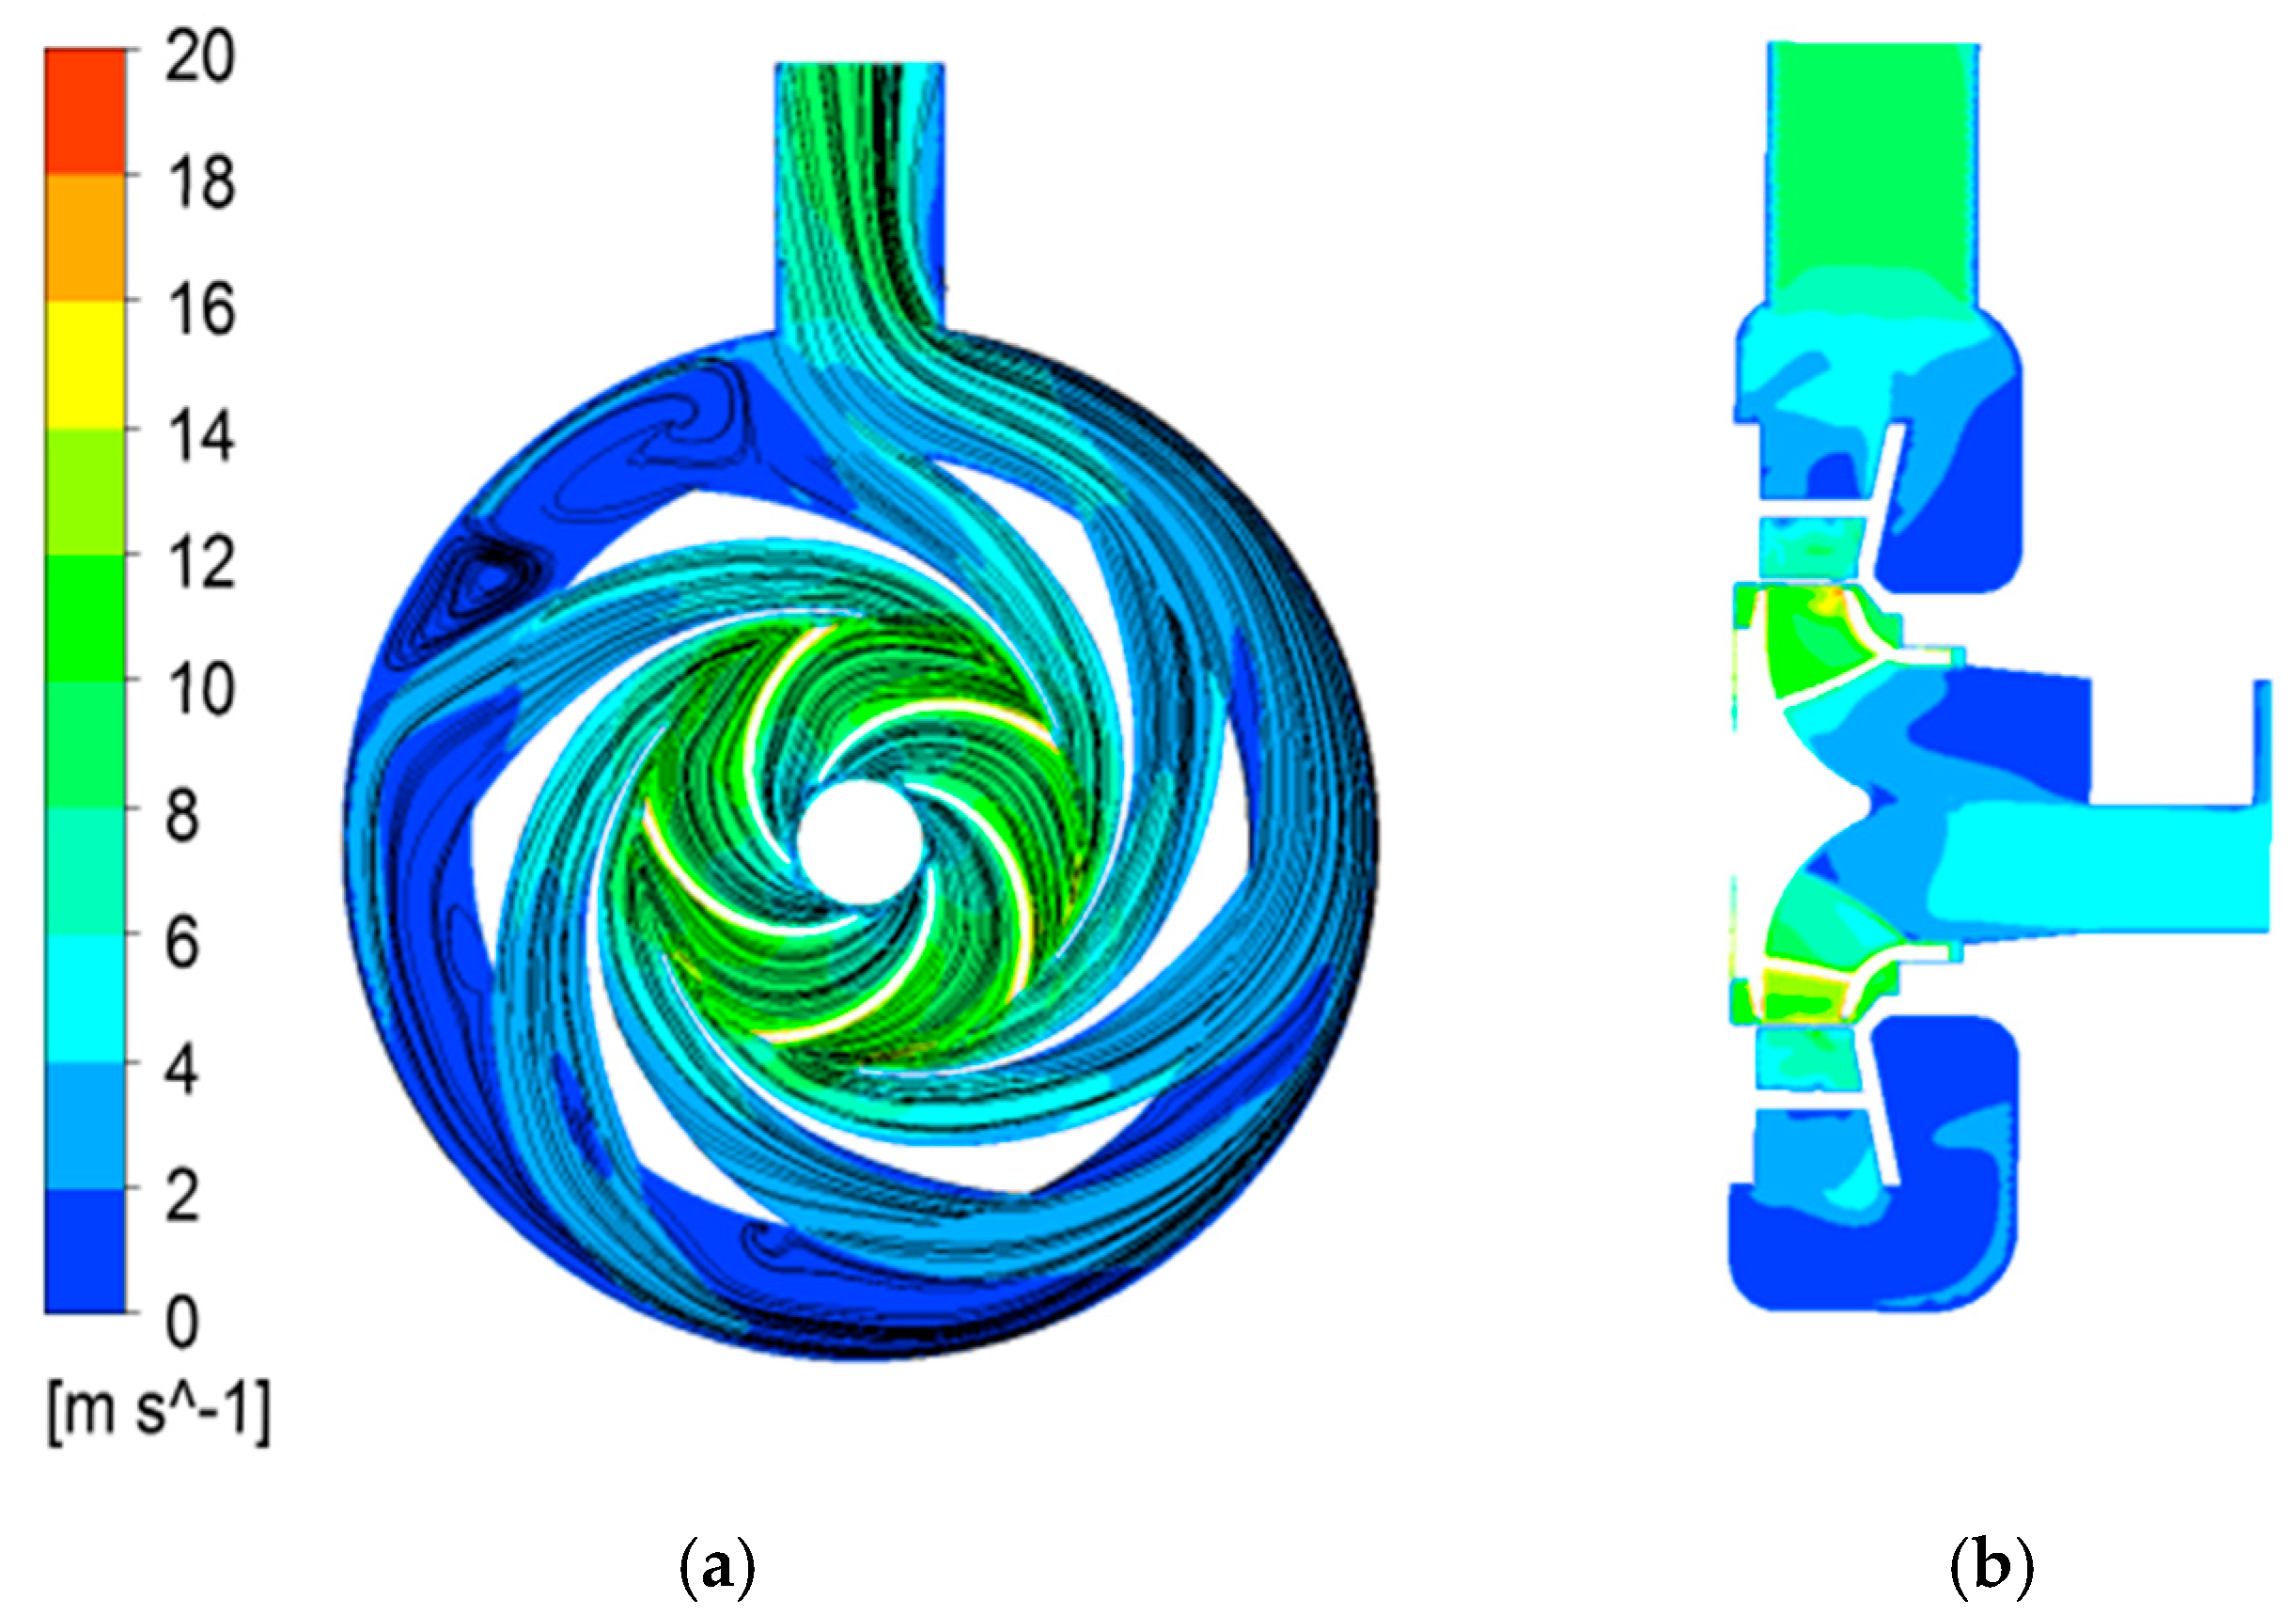
2.4. Analysis of Internal Flow Field of the Prototype Pump

To analyze the flow loss in the molten salt pump, internal flow in the pump under the design flow rate was simulated numerically. Figure 6 shows the absolute velocity in distribution on the middle and axial planes of the pump under design flow rate.
From Figure 6, we can observe that the absolute velocity gradient increases with the increases of radius. The absolute velocity of fluid decreases gradually as fluid flows from the impeller to the diffuser. A low-velocity zone exists in the left part of the scroll. Near the sharp corner of the exit pipe, there is a separated flow region, which will cause pressure pulsation. The geometric modification was applied at those two areas.

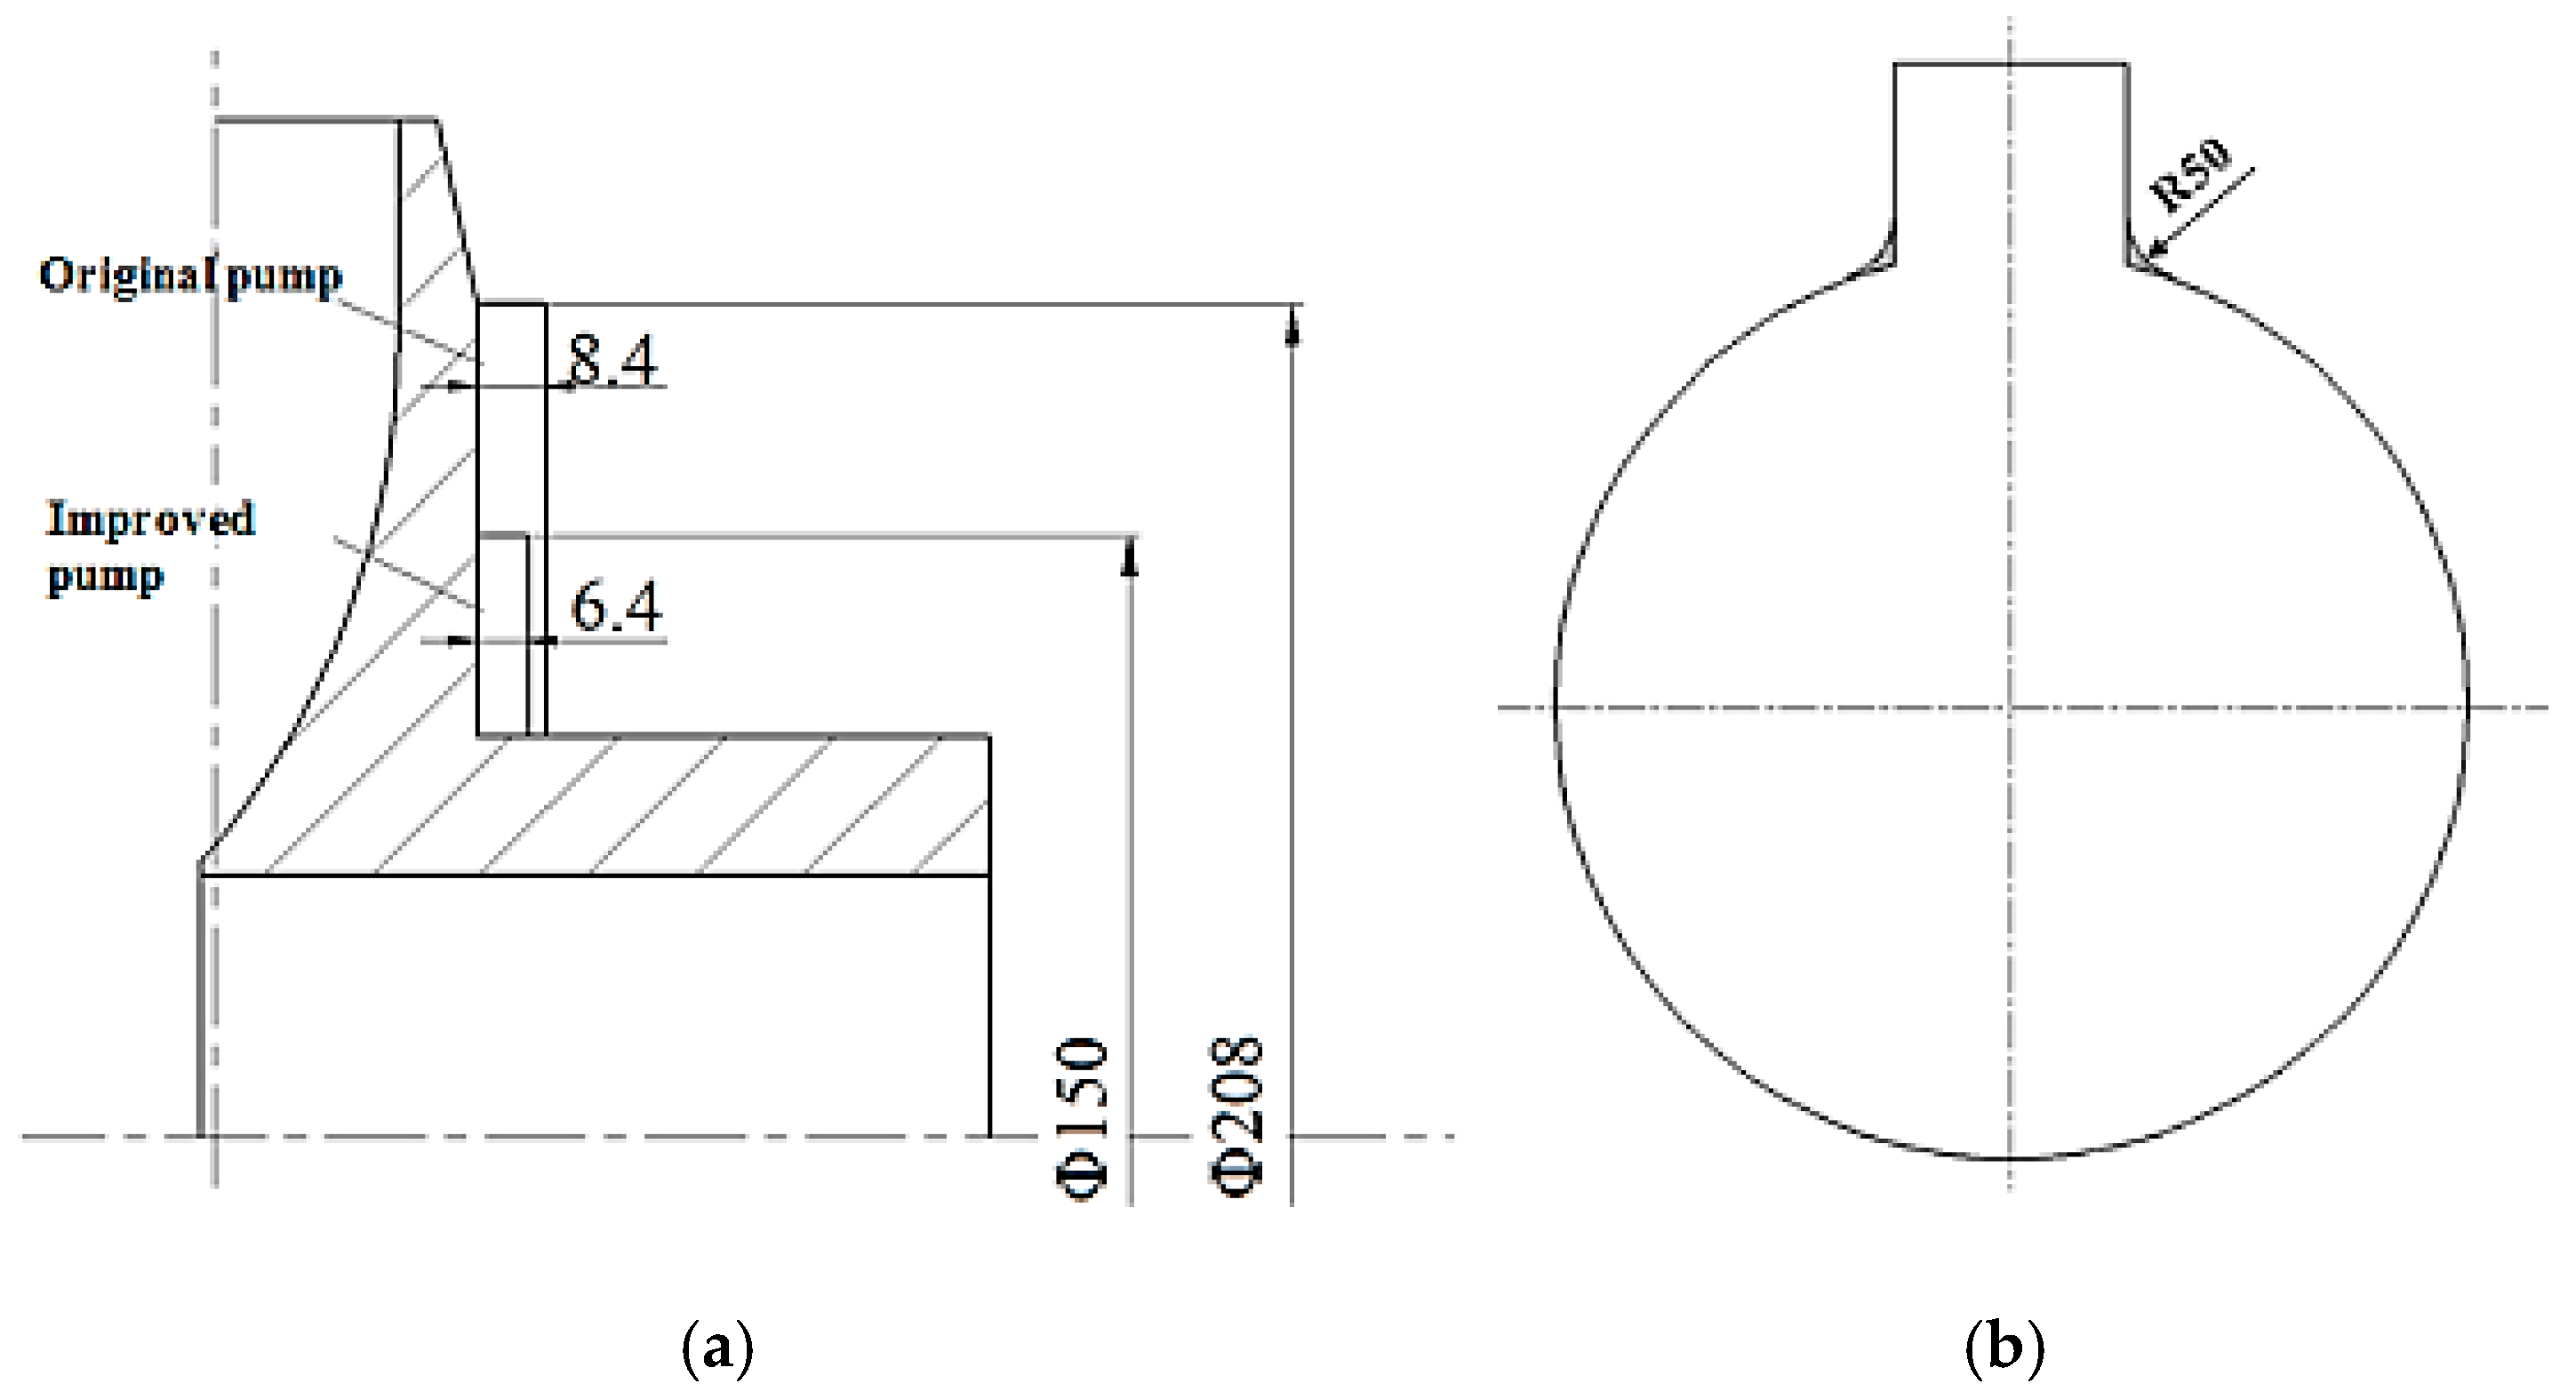
2.5. Geometric Modification

To reduce power caused by the back-blades of the impeller and enhance the pump’s efficiency, the outer diameter and width of the back-blades are trimmed, as shown in Figure 7. The outer diameter of the back-blades is trimmed from 208 mm to 150 mm, and the width is trimmed from 8.4 mm to 6.4 mm. Moreover, to improve the inner flow field near the outlet of the pump, a sharp corner near the outlet pipe of the annular chamber is changed to a radius of 50 mm.

3. Comparison and Analysis of Experiment Results

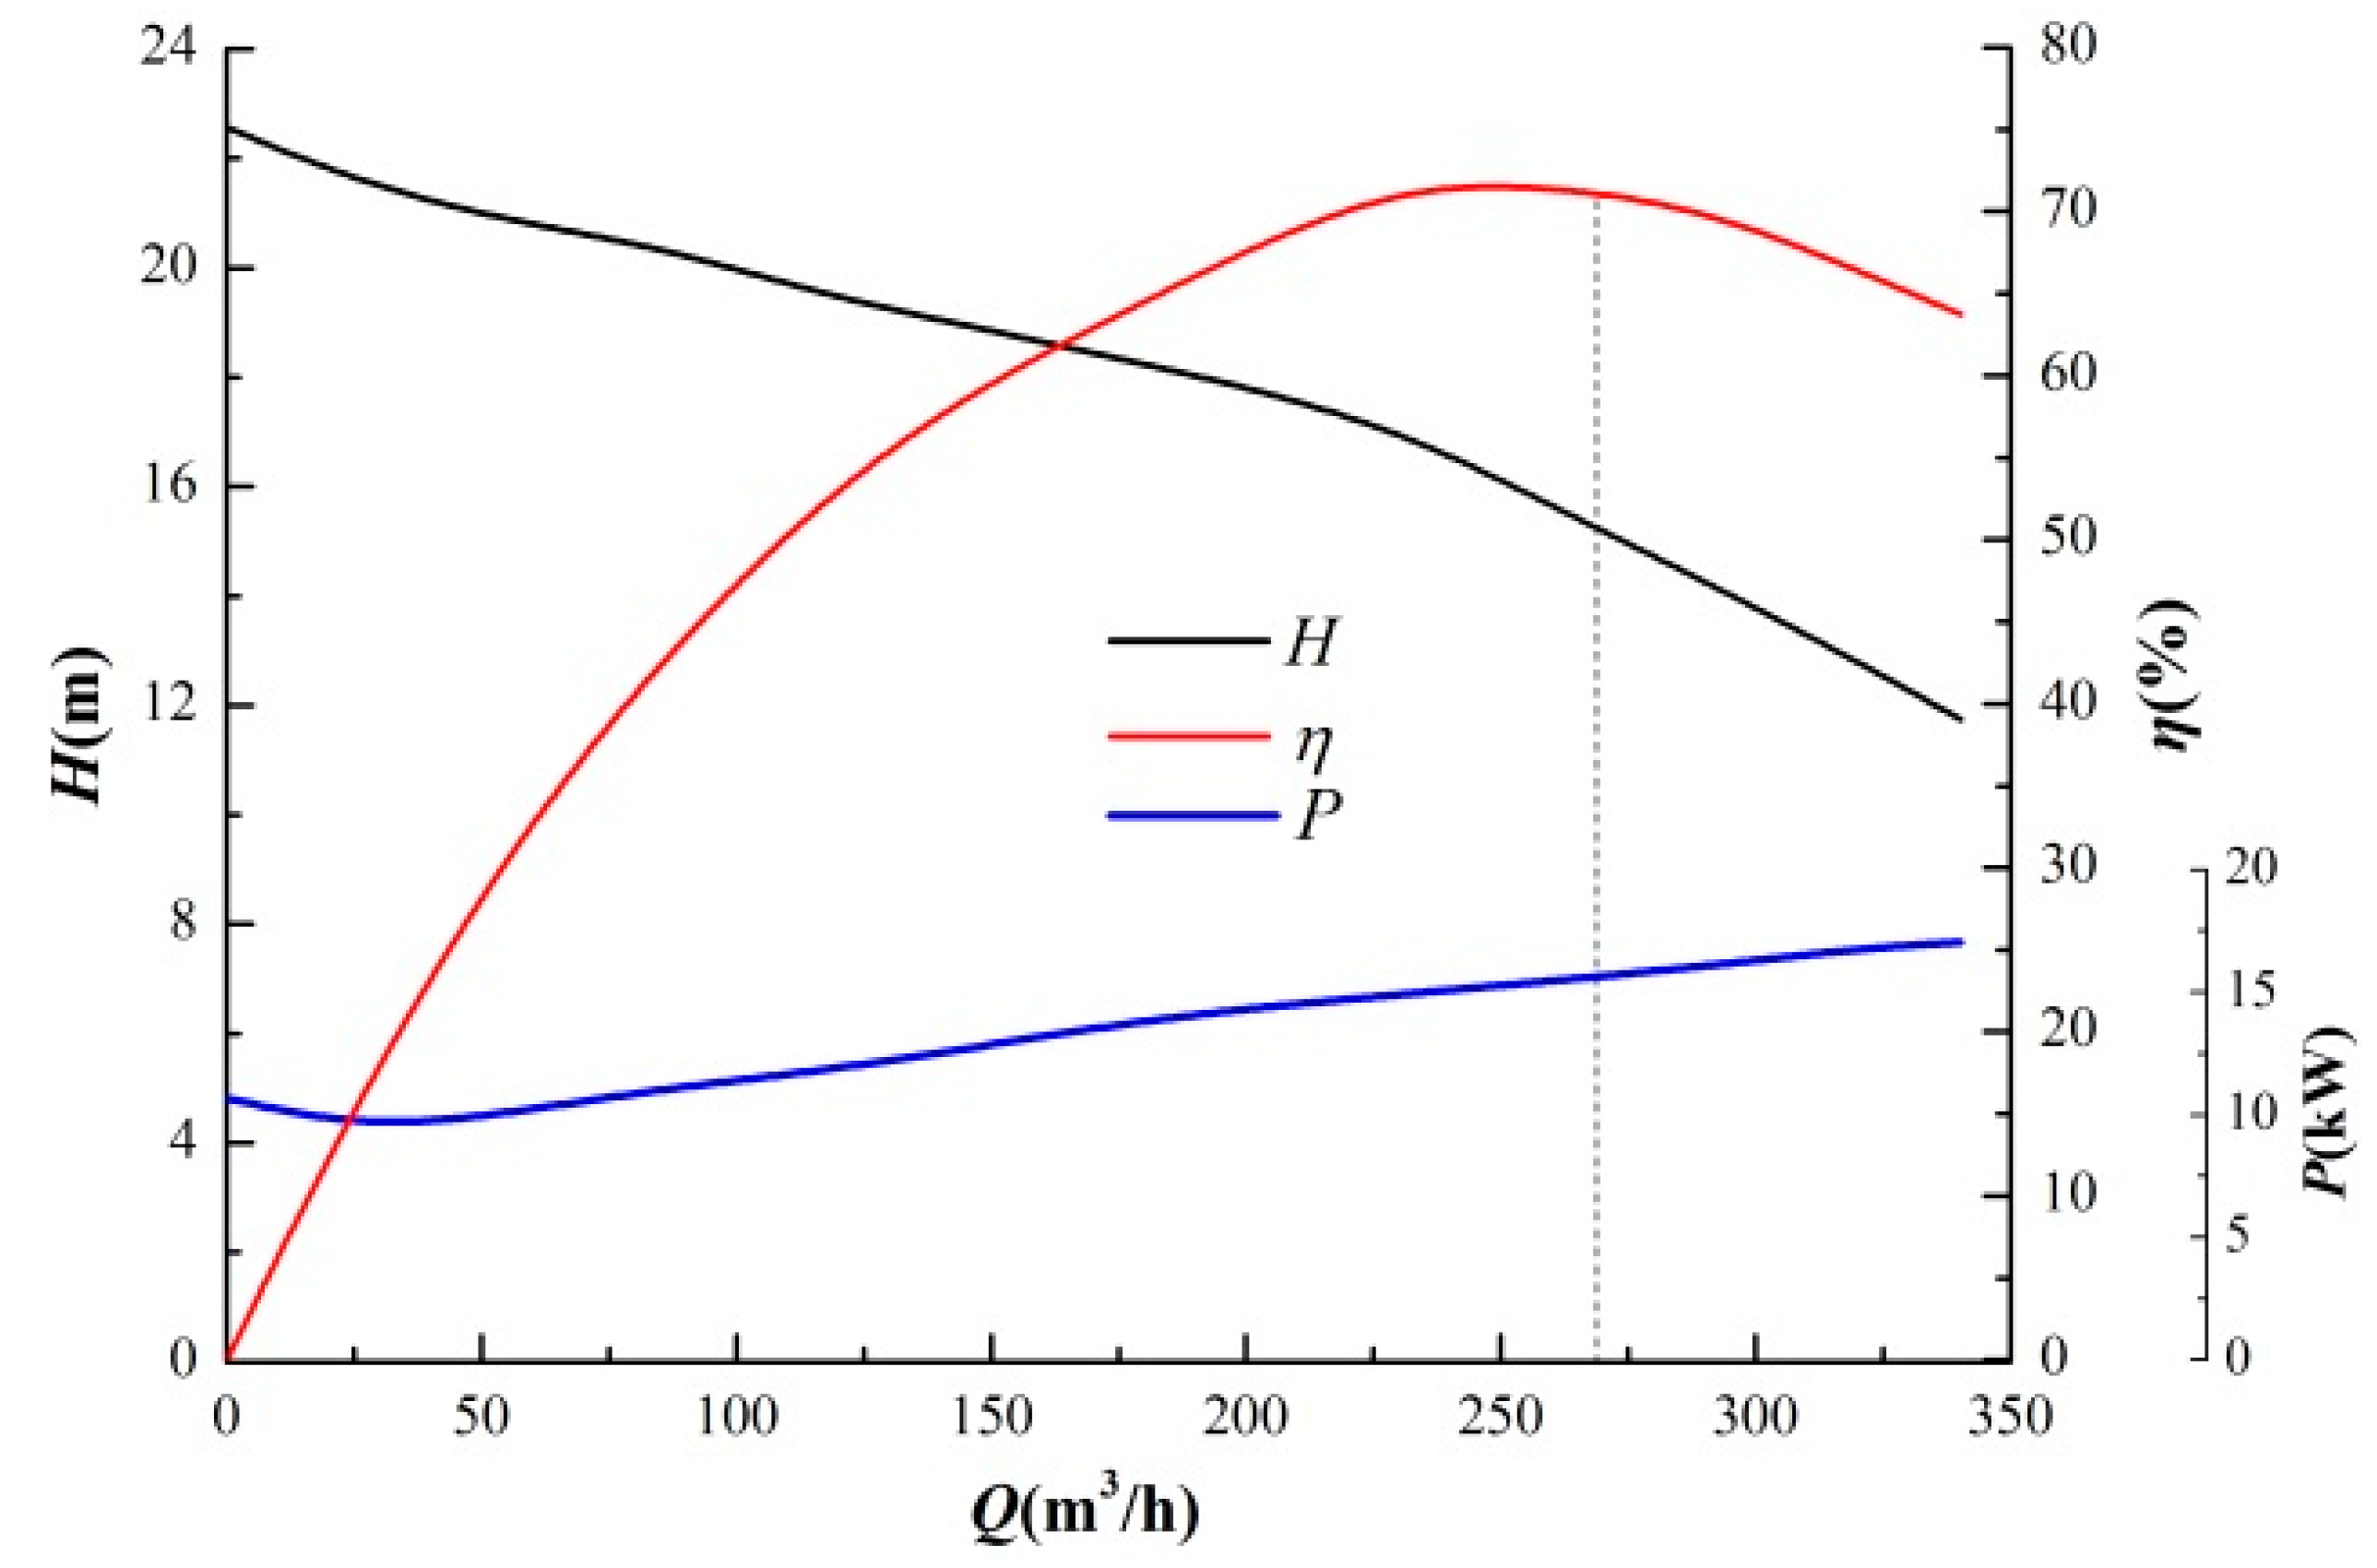
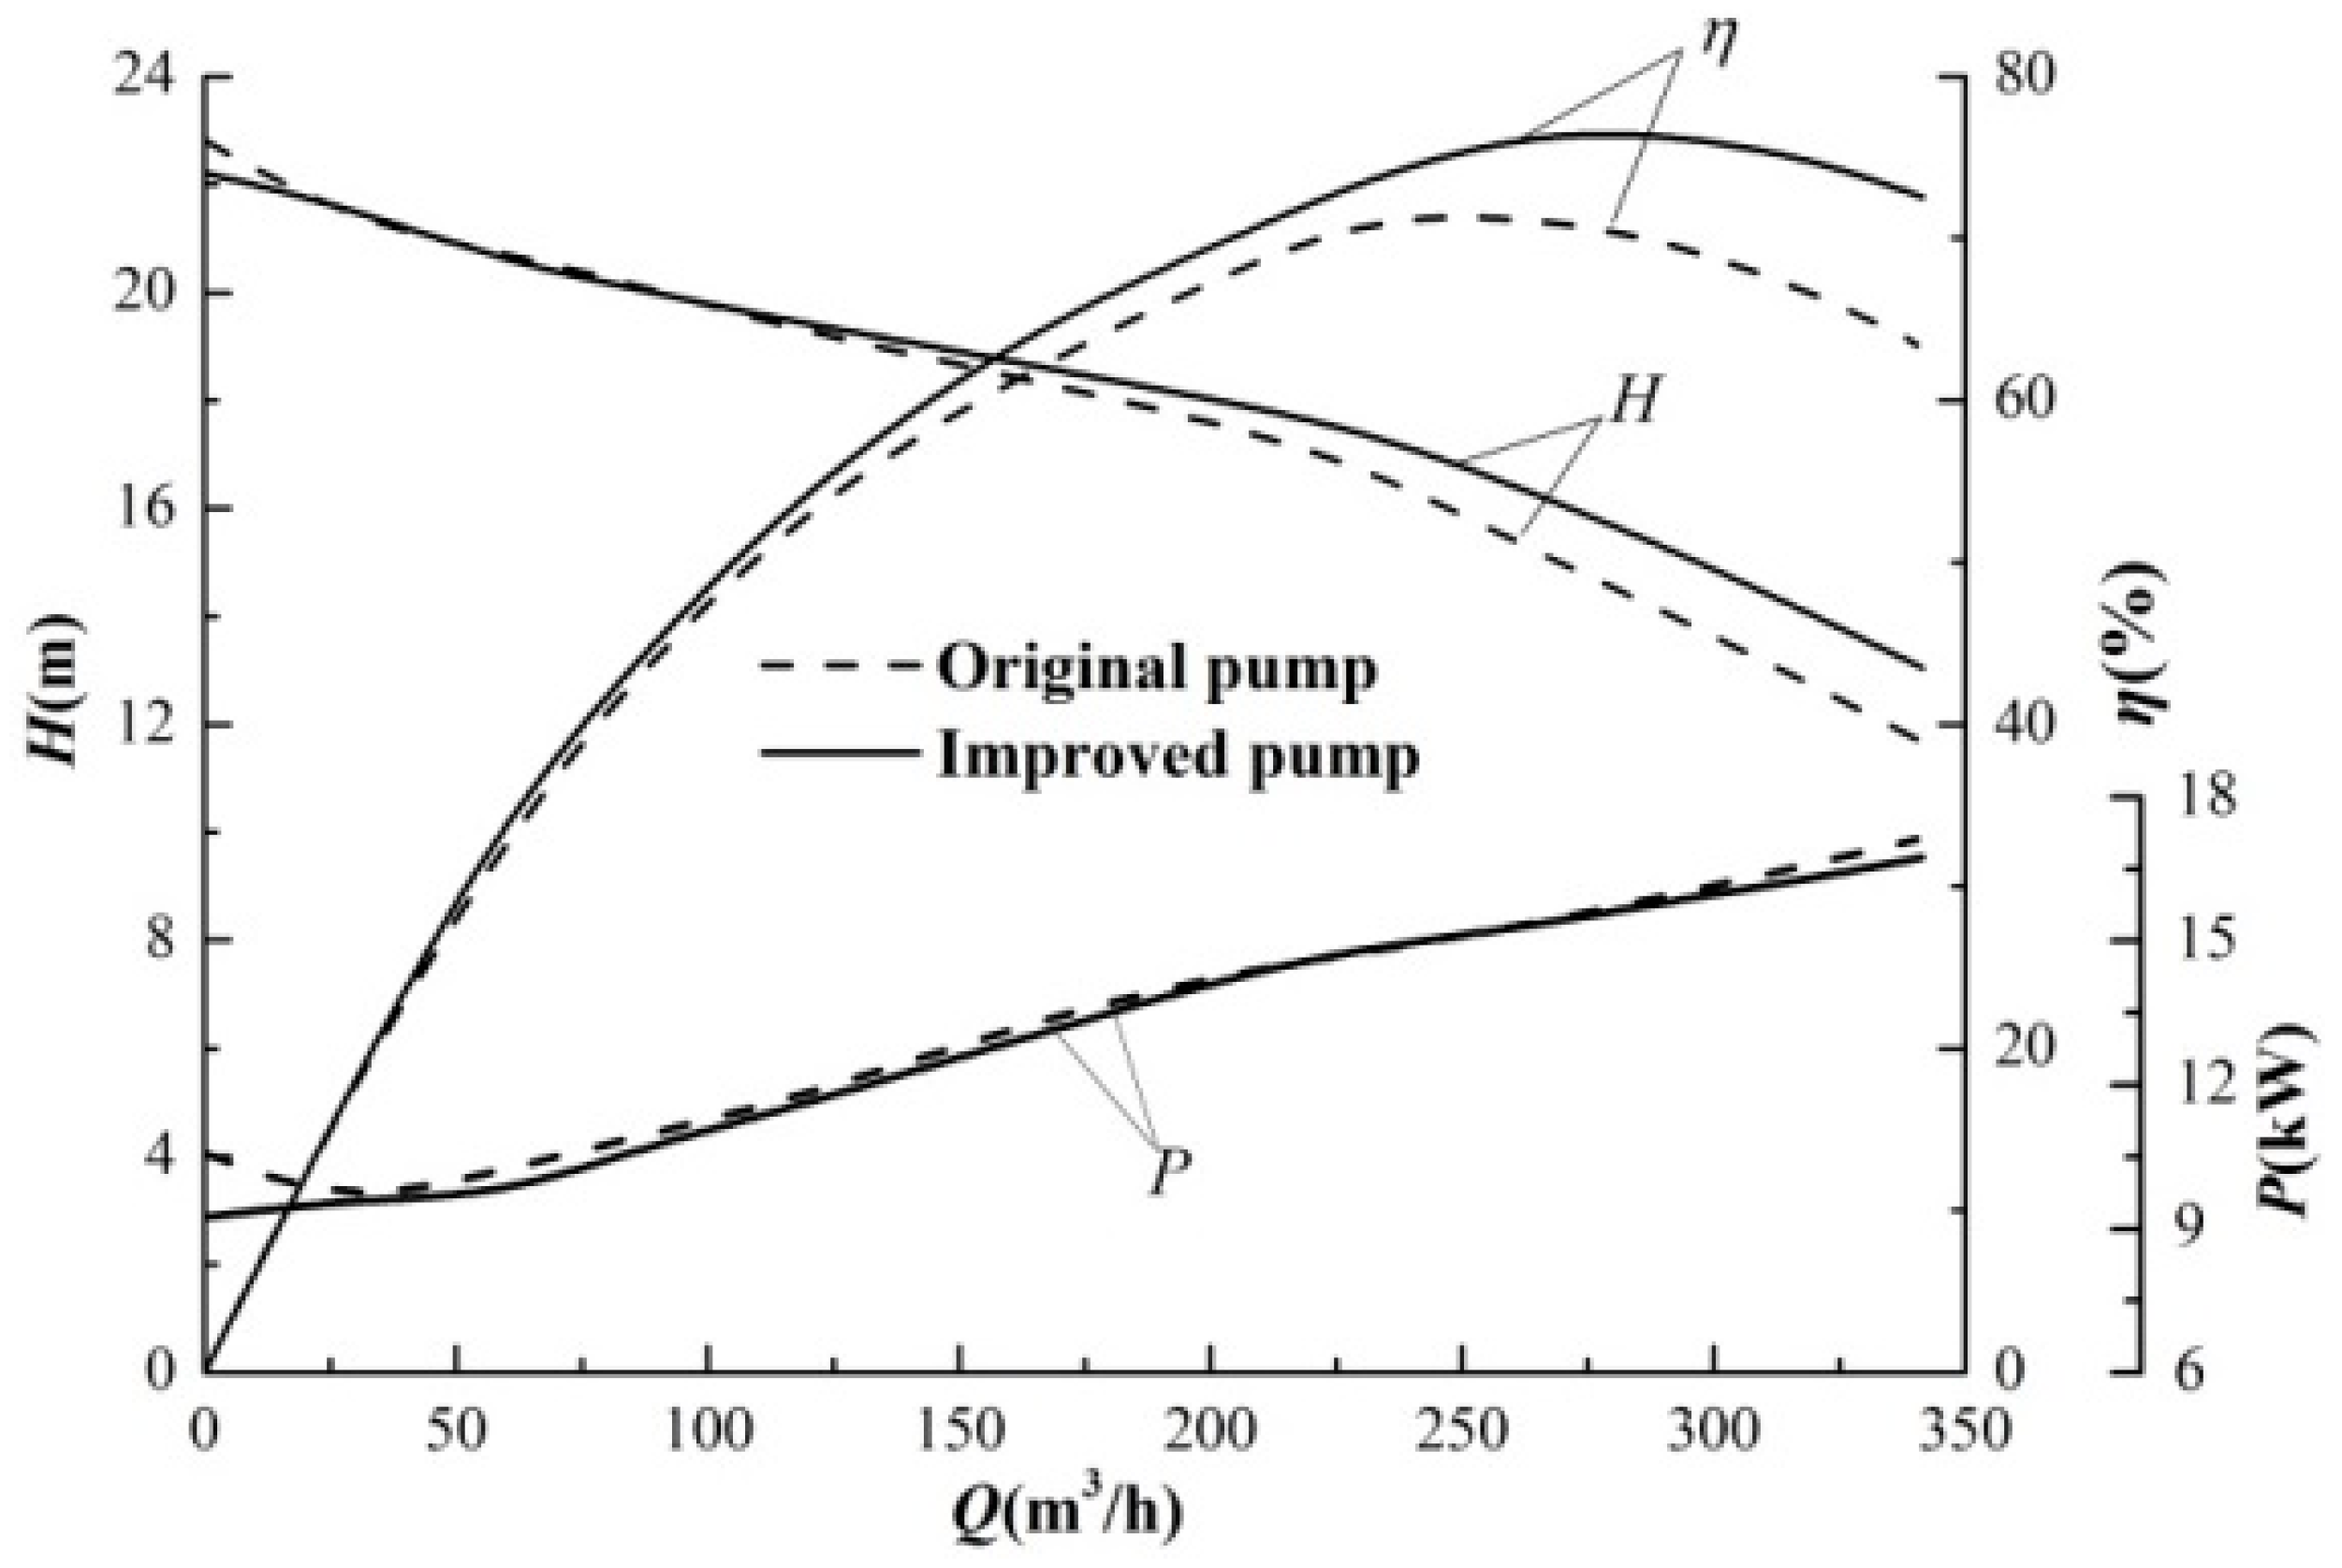
3.1. Energy Performance

The experiment results of the energy performance of the improved pump and the original pump are shown in Figure 8. We see that the improved pump is more efficient than the original. Regarding the design flow rate, efficiency of the improved pump is 76.7%, which meets the design requirement and is 5.26 percentage points higher than that of the original pump.

3.2. Pressure Pulsation Characteristics

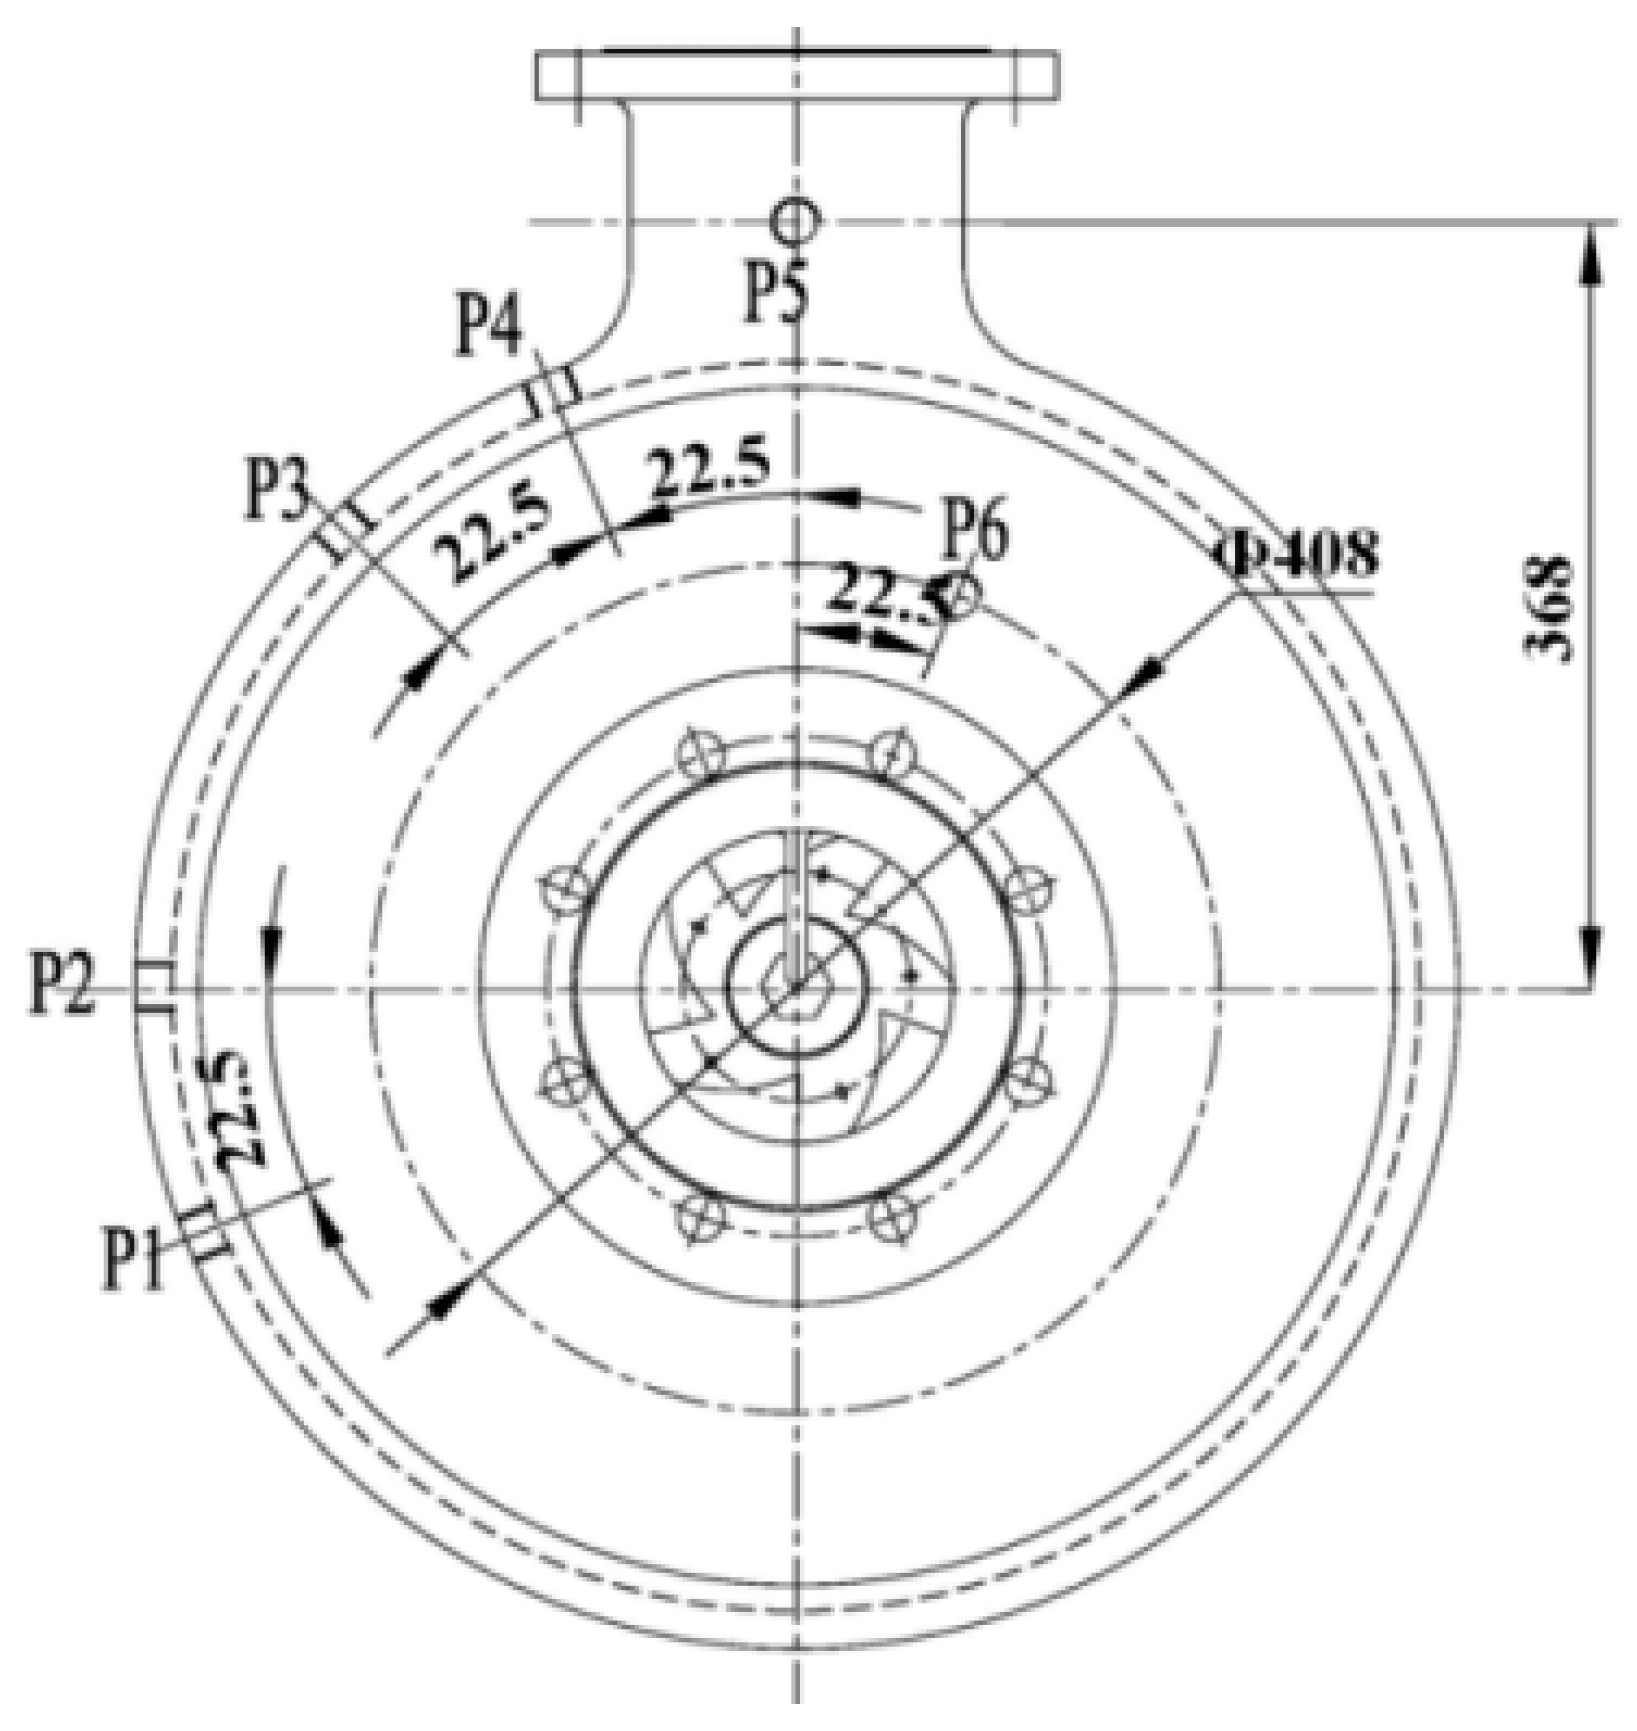
3.2.1. Arrangement of Monitoring Points of Pressure Pulsation

In the above analysis of the internal flow field, six monitoring points P1–P6 are selected to analyze the pressure pulsation of the pump. The positions of the six monitoring points are shown in Figure 9.
In this experiment, the rotation speed of the pump n is 1450 r/min, so axial frequency is 25 Hz. Because the impeller has five blades, the blade-passing frequency of the impeller is 125 Hz (5 times the axial frequency).

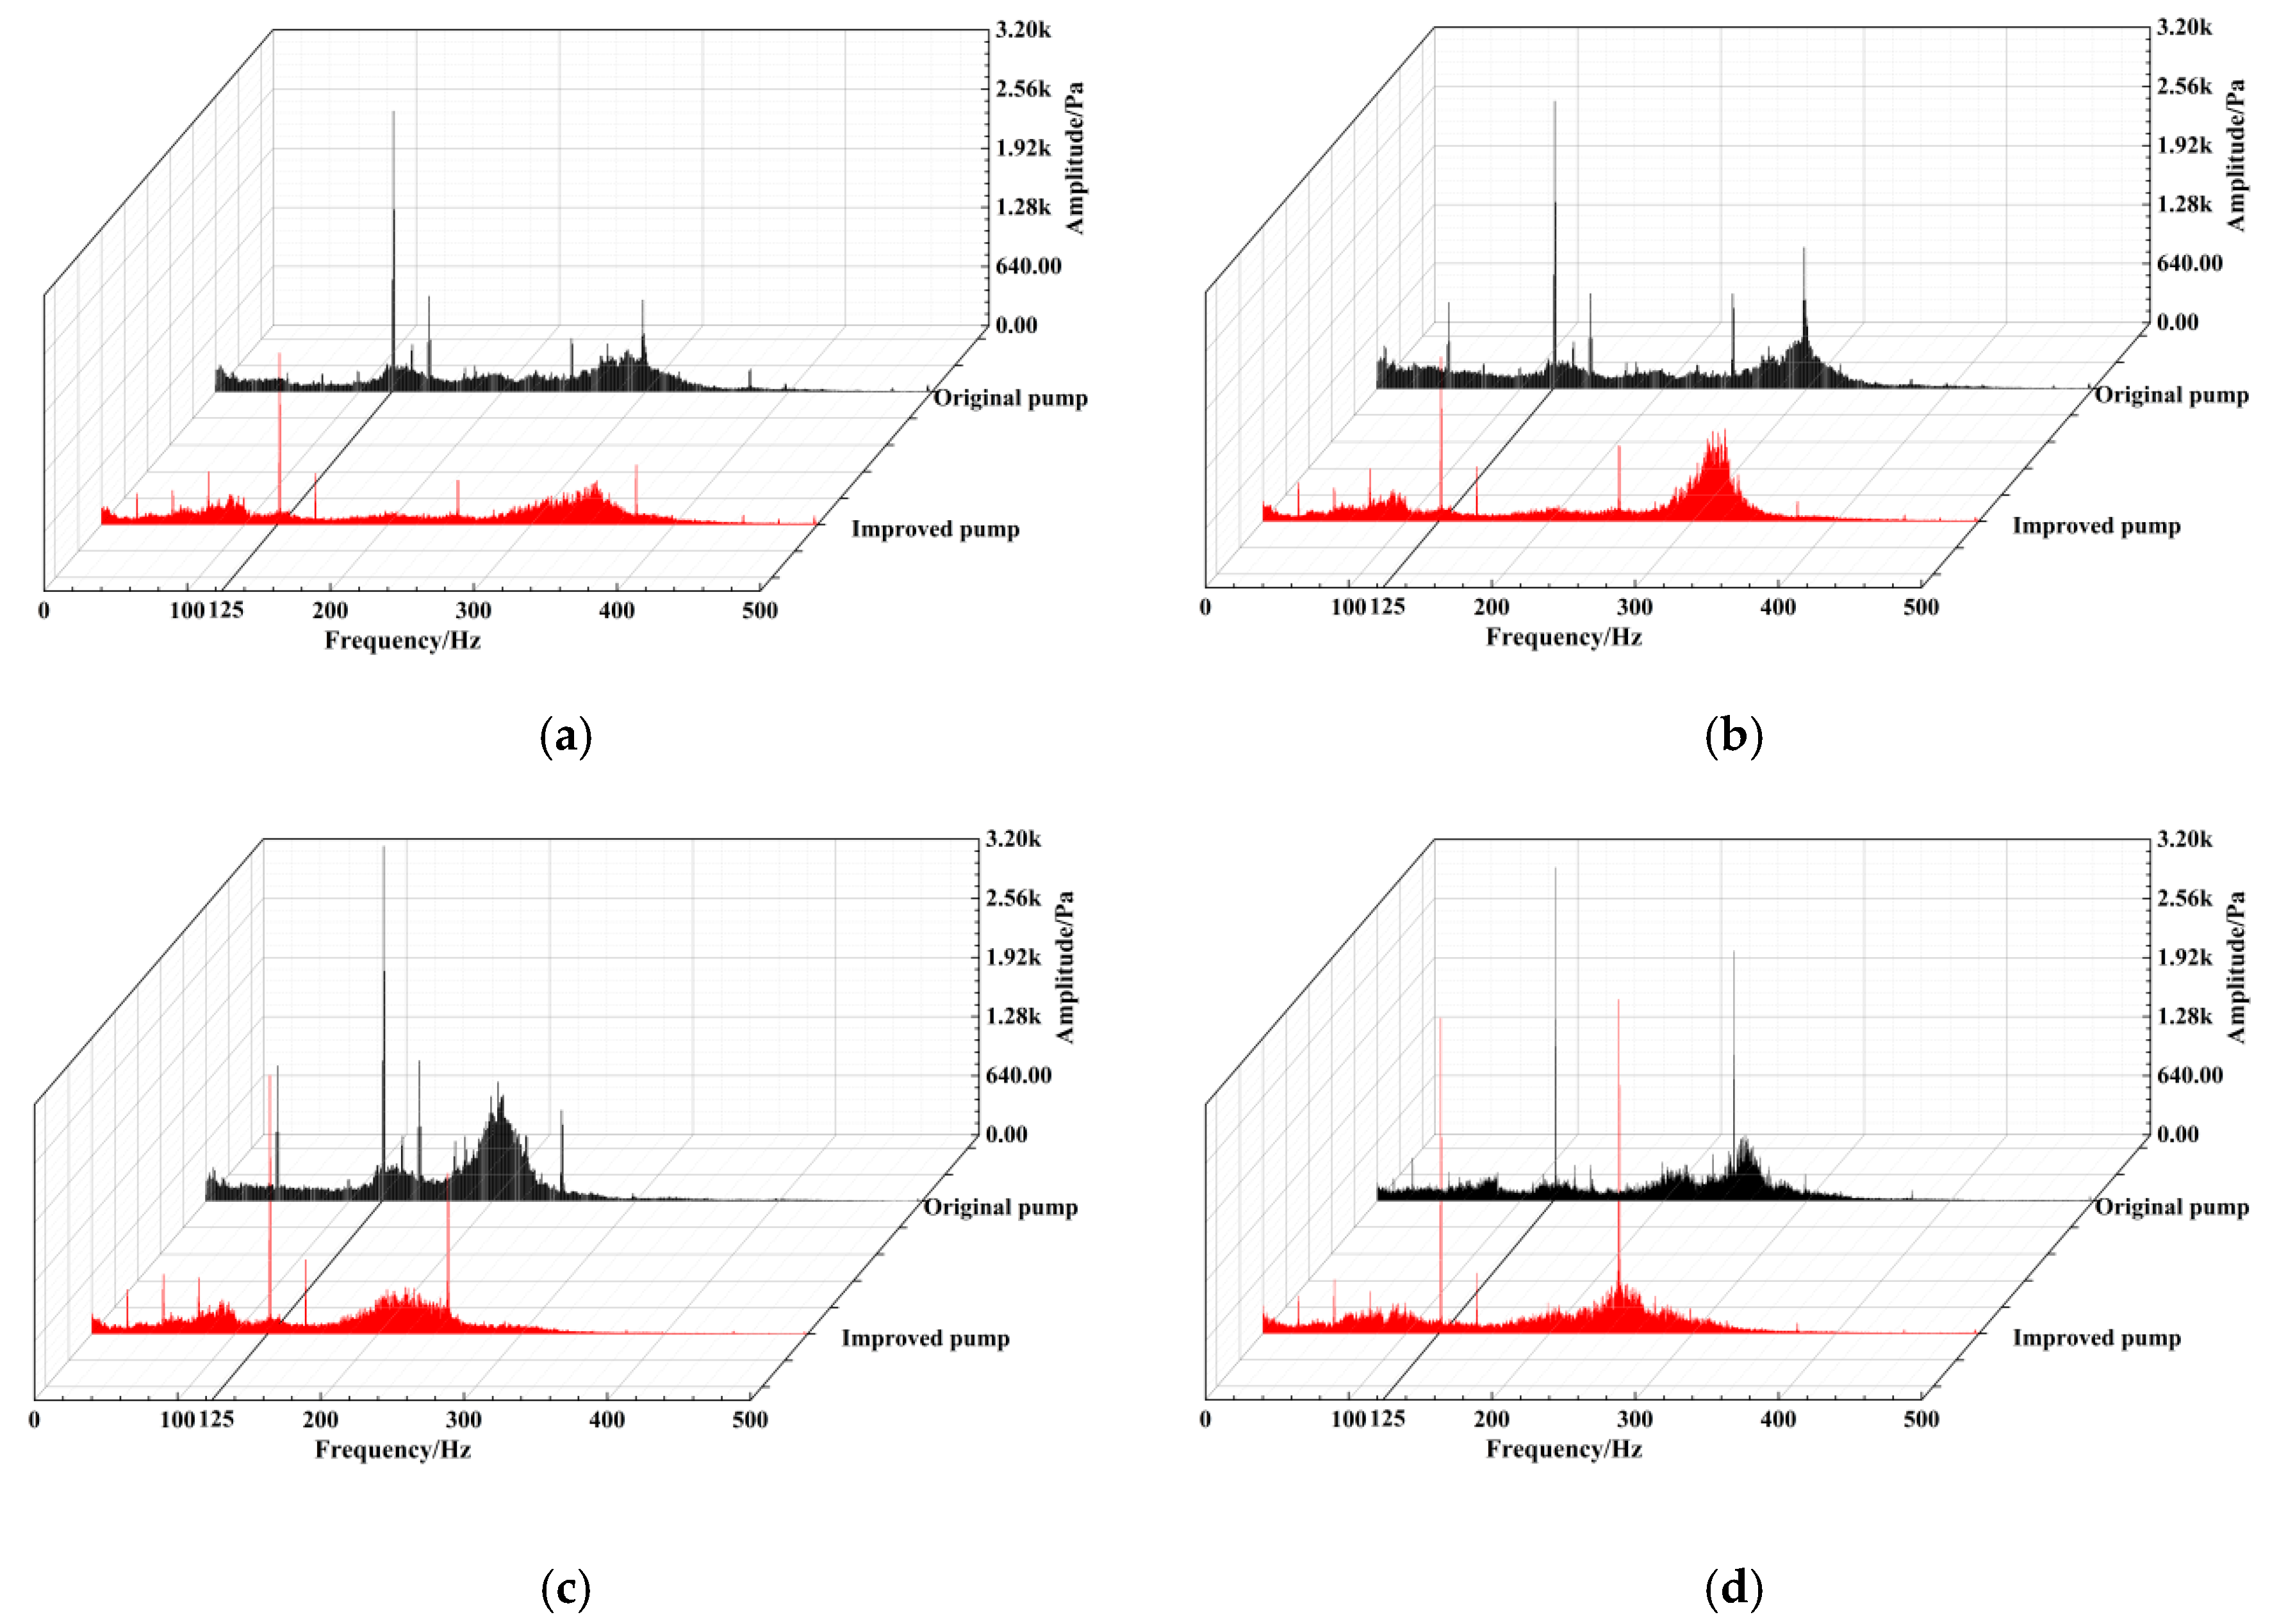
3.2.2. Pressure Pulsation Results at P1–P4

The time domain of pressure pulsation at monitoring points P1–P4 under the design flow rate was obtained experimentally and shown in Figure 10. It can be observed that there are no obvious five peaks and troughs in the pressure pulsation curve at these four monitoring points, because the position of monitoring points that at annular discharge chamber is far from the impeller outlet and the pressure fluctuation caused by rotor-stator interference gradually weakens during delivery. Pressure fluctuations at P3 and P4 are noticeably intense, with more peaks and troughs, because most of the fluid will flow downstream out of the diffuser, but some will flow directly to the outlet section of the annular chamber, which results in reflux or vortex. Amplitudes of pressure pulsation at P1 and P2 are less than at P3, and are less at P4 than at the other three monitoring points.
Figure 11 shows the frequency domain of pressure pulsation at monitoring points P1–P4. We can see that the pressure-pulsation curve of the improved pump is basically identical to that of the original pump. The amplitude of pressure pulsation in the improved pump is smaller than that of the original pump. Matching the position of the monitoring point, we can see that the reduction of the amplitude of pressure pulsation at monitoring points becomes increasingly obvious as the position of monitoring is located close to the upstream. It might because the downstream pressure-pulse signal is monotonic.
The dominant frequency of P1–P4 all is the blade-passing frequency, and the rotor-stator interaction of the impeller outlet is still the main signal source of pressure pulsation on the wall of the annular chamber. The amplitudes of the domain frequency in the improved pump at P1–P4 are reduced by 38.9%, 42.85%, 27.1%, and 5.4%, respectively, from those in the original pump.

3.2.3. Pressure Pulsation Results at P5

Monitoring point P5 is in the outlet pipe of the pump. Because energy loss of the improved pump under the design flow rate decreases, the head of the improved pump is higher than that of the original pump, causing the pressure value at the outlet of the pump to increase. It can be observed from Figure 12 that the dominant frequency of pressure pulsation in the improved pump at P5 is the same as in the original pump, which is 1 times the blade-passing frequency. The wide frequency band of the improved pump appears at 700–900 Hz, which is significantly less than in the original pump.

3.2.4. Pressure Pulsation Results at P6

Monitoring point P6 is in the outlet section of the diffuser. Pressure pulsation at P6 is mainly affected by the rotor-stator interaction of the impeller, and is basically free of interference from other pressure-pulsation signals. It can be noted from Figure 13 that the peak-to-peak value of the time domain of the improved pump is reduced by 71.4% from that of the original pump. The dominant frequency of pressure pulsation at the improved pump also is 1 times the blade-passing frequency. The amplitude of pulsation in the improved pump is 32.5% less than in the original pump.

3.3. Vibration Characteristics

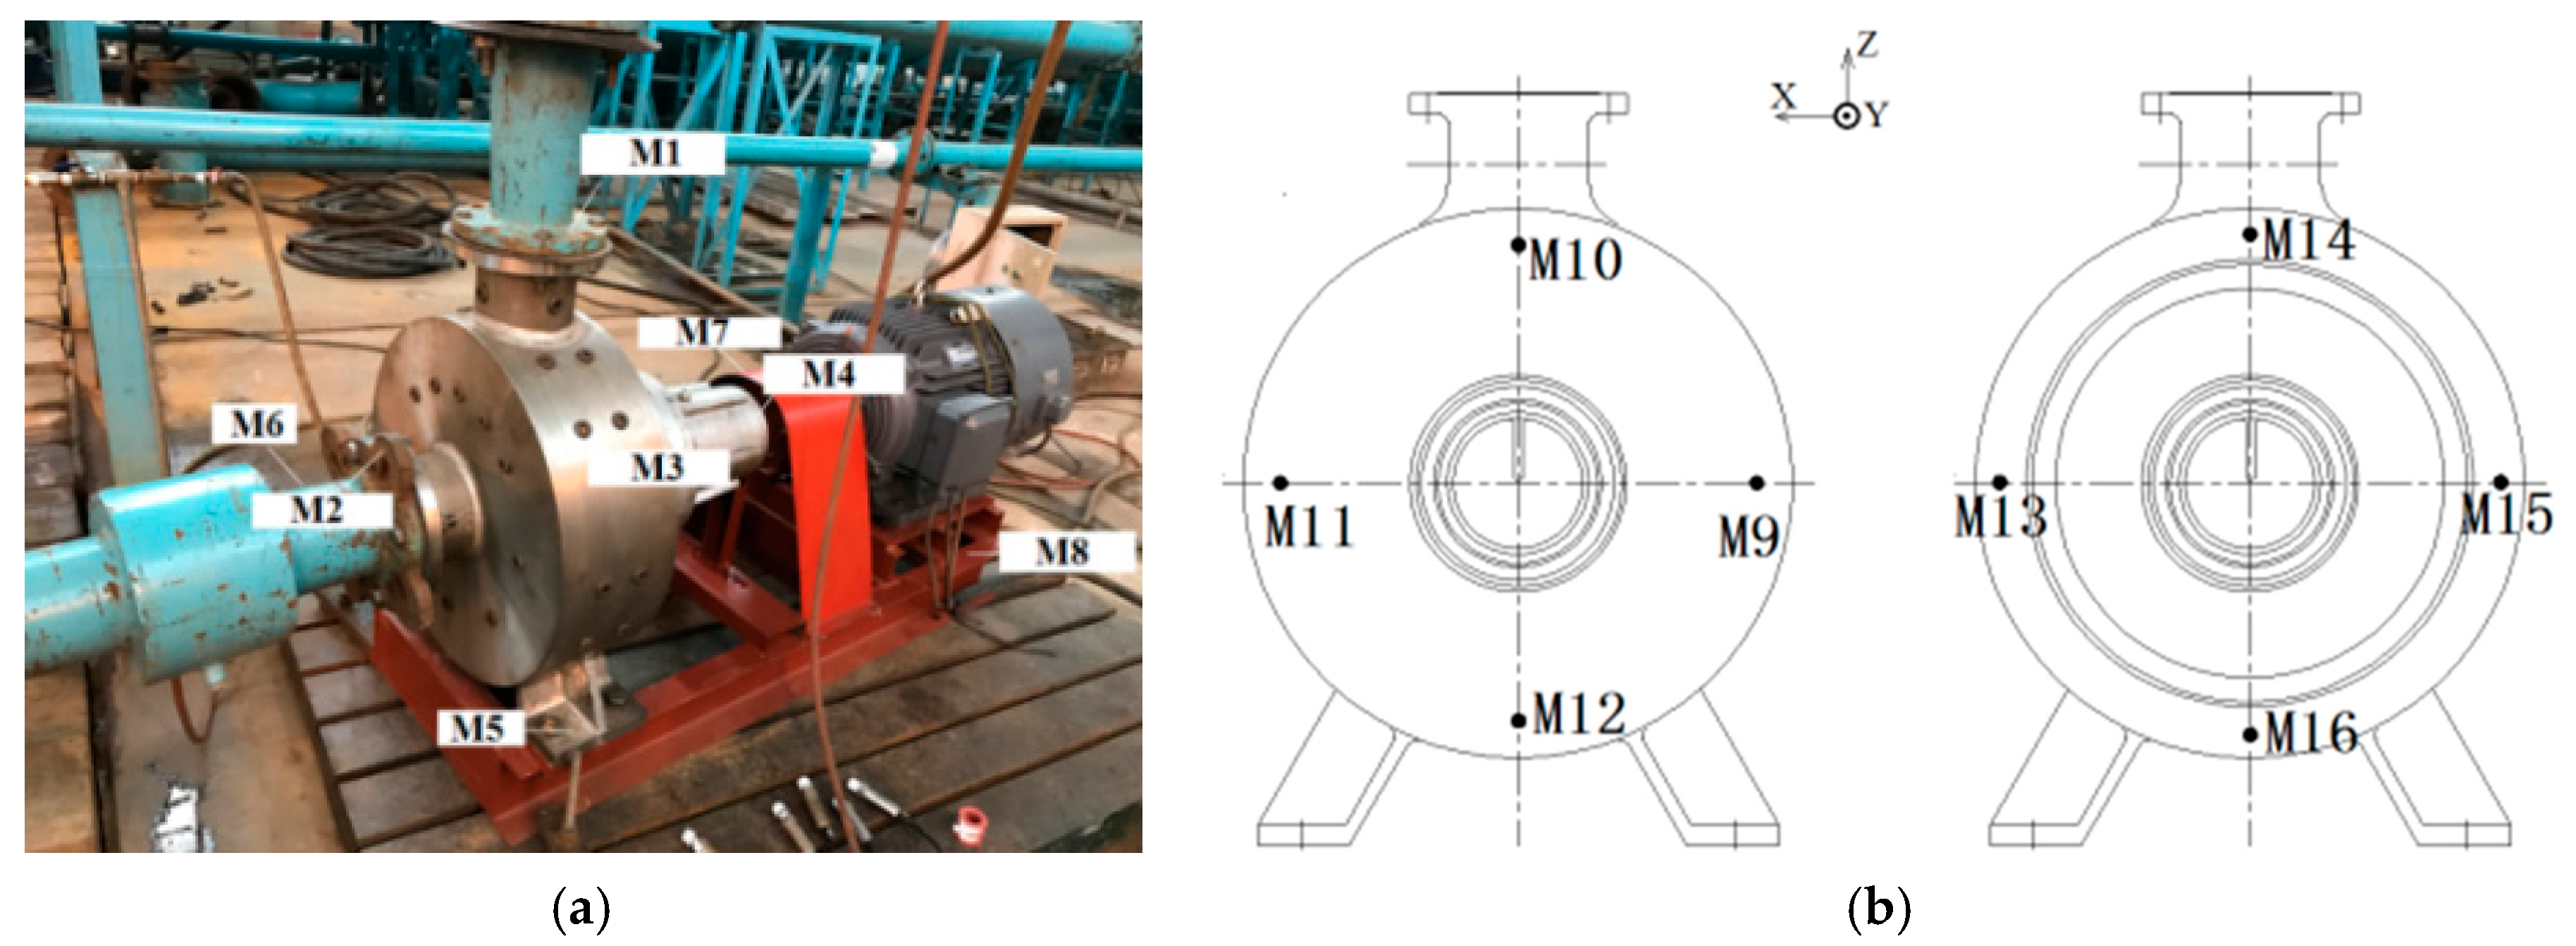
3.3.1. Arrangement of Monitoring Points of Vibration

In this experiment, we fixed the entire pump by using four foundation bolts to ensure reliable vibration data. We selected 16 monitoring points (Figure 14) to measure vibration characteristics. The main points are at the outlet flange (M1); the inlet flange (M2); the left and right bearing casings (M3 and M4); the pump base and motor base (M5–M8); and the pump body (M9–M16). During the analysis, we selected four typical measuring points and three directions to collect data. The definition of the vibration direction is shown in Figure 14b. Monitoring point M1 is at the outlet flange. Monitoring point M5 is at the pump base. M10 and M16 are on the pump body.

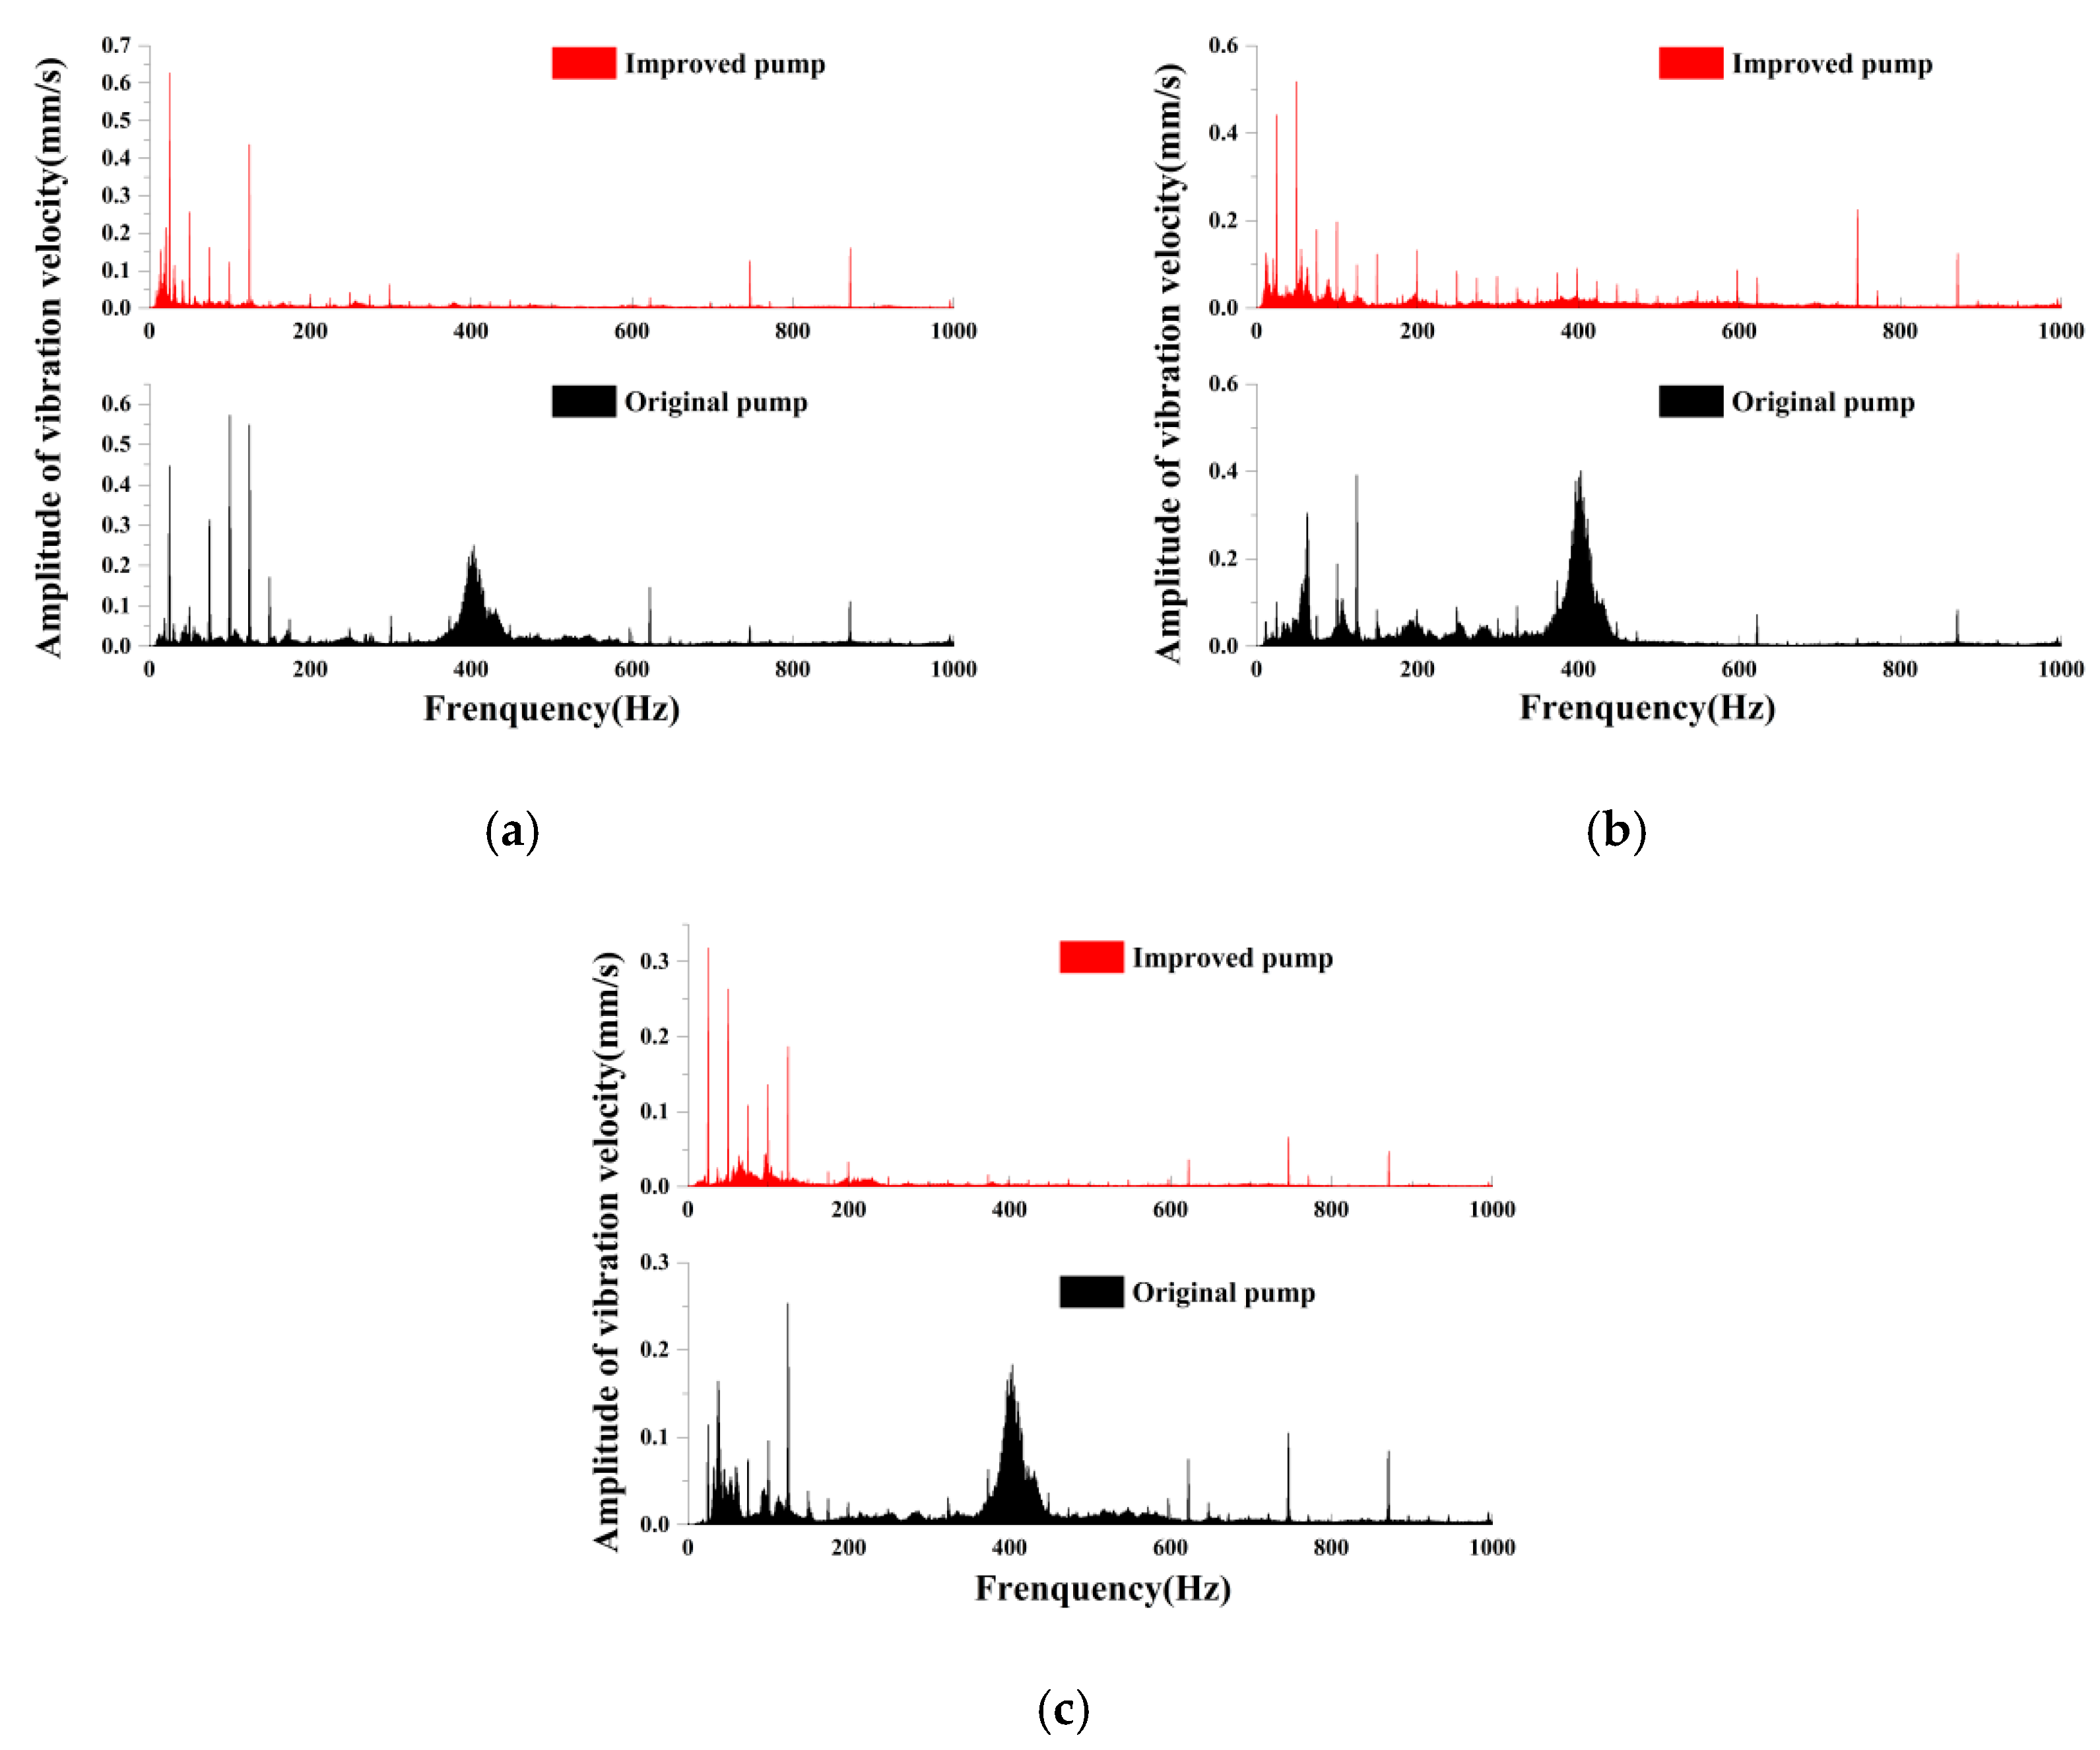
3.3.2. Vibration Results at M1

Figure 15 presents the frequency domain of vibration characteristics in three directions at M1. It can be clearly seen from Figure 15 that:
(1)
In the X, Y, and Z directions, the main excitation frequencies of the improved pump at M1 are the axial frequency (25 Hz), twice the axial frequency (50 Hz), 4 times the axial frequency (100 Hz), and the blade-passing frequency (125 Hz), and the maximum frequency of vibration amplitude is the axial frequency.
(2)
Vibration of both the original and improved pumps is mainly in the X and Y directions, while the vibration amplitude in the Z direction is the smallest.
(3)
Vibration amplitudes of the improved pump in the X, Y, and Z directions increased by 8.7%, 12%, and 8.7%, respectively, from those of the original pump.
(4)
Both the original and improved pumps have high-frequency vibration because the outlet flange is connected with the outlet pipe, and high-frequency vibration will be produced by pipeline vibration transmitted to the outlet flange.
(5)
The original pump has an evident wide-frequency band between 300–500 Hz. There is no wide-frequency band in the vibration spectrum of the optimized model, because the pressure pulsation (300–500 Hz) at the outlet of the optimized pump is significantly lower than that of the original model.

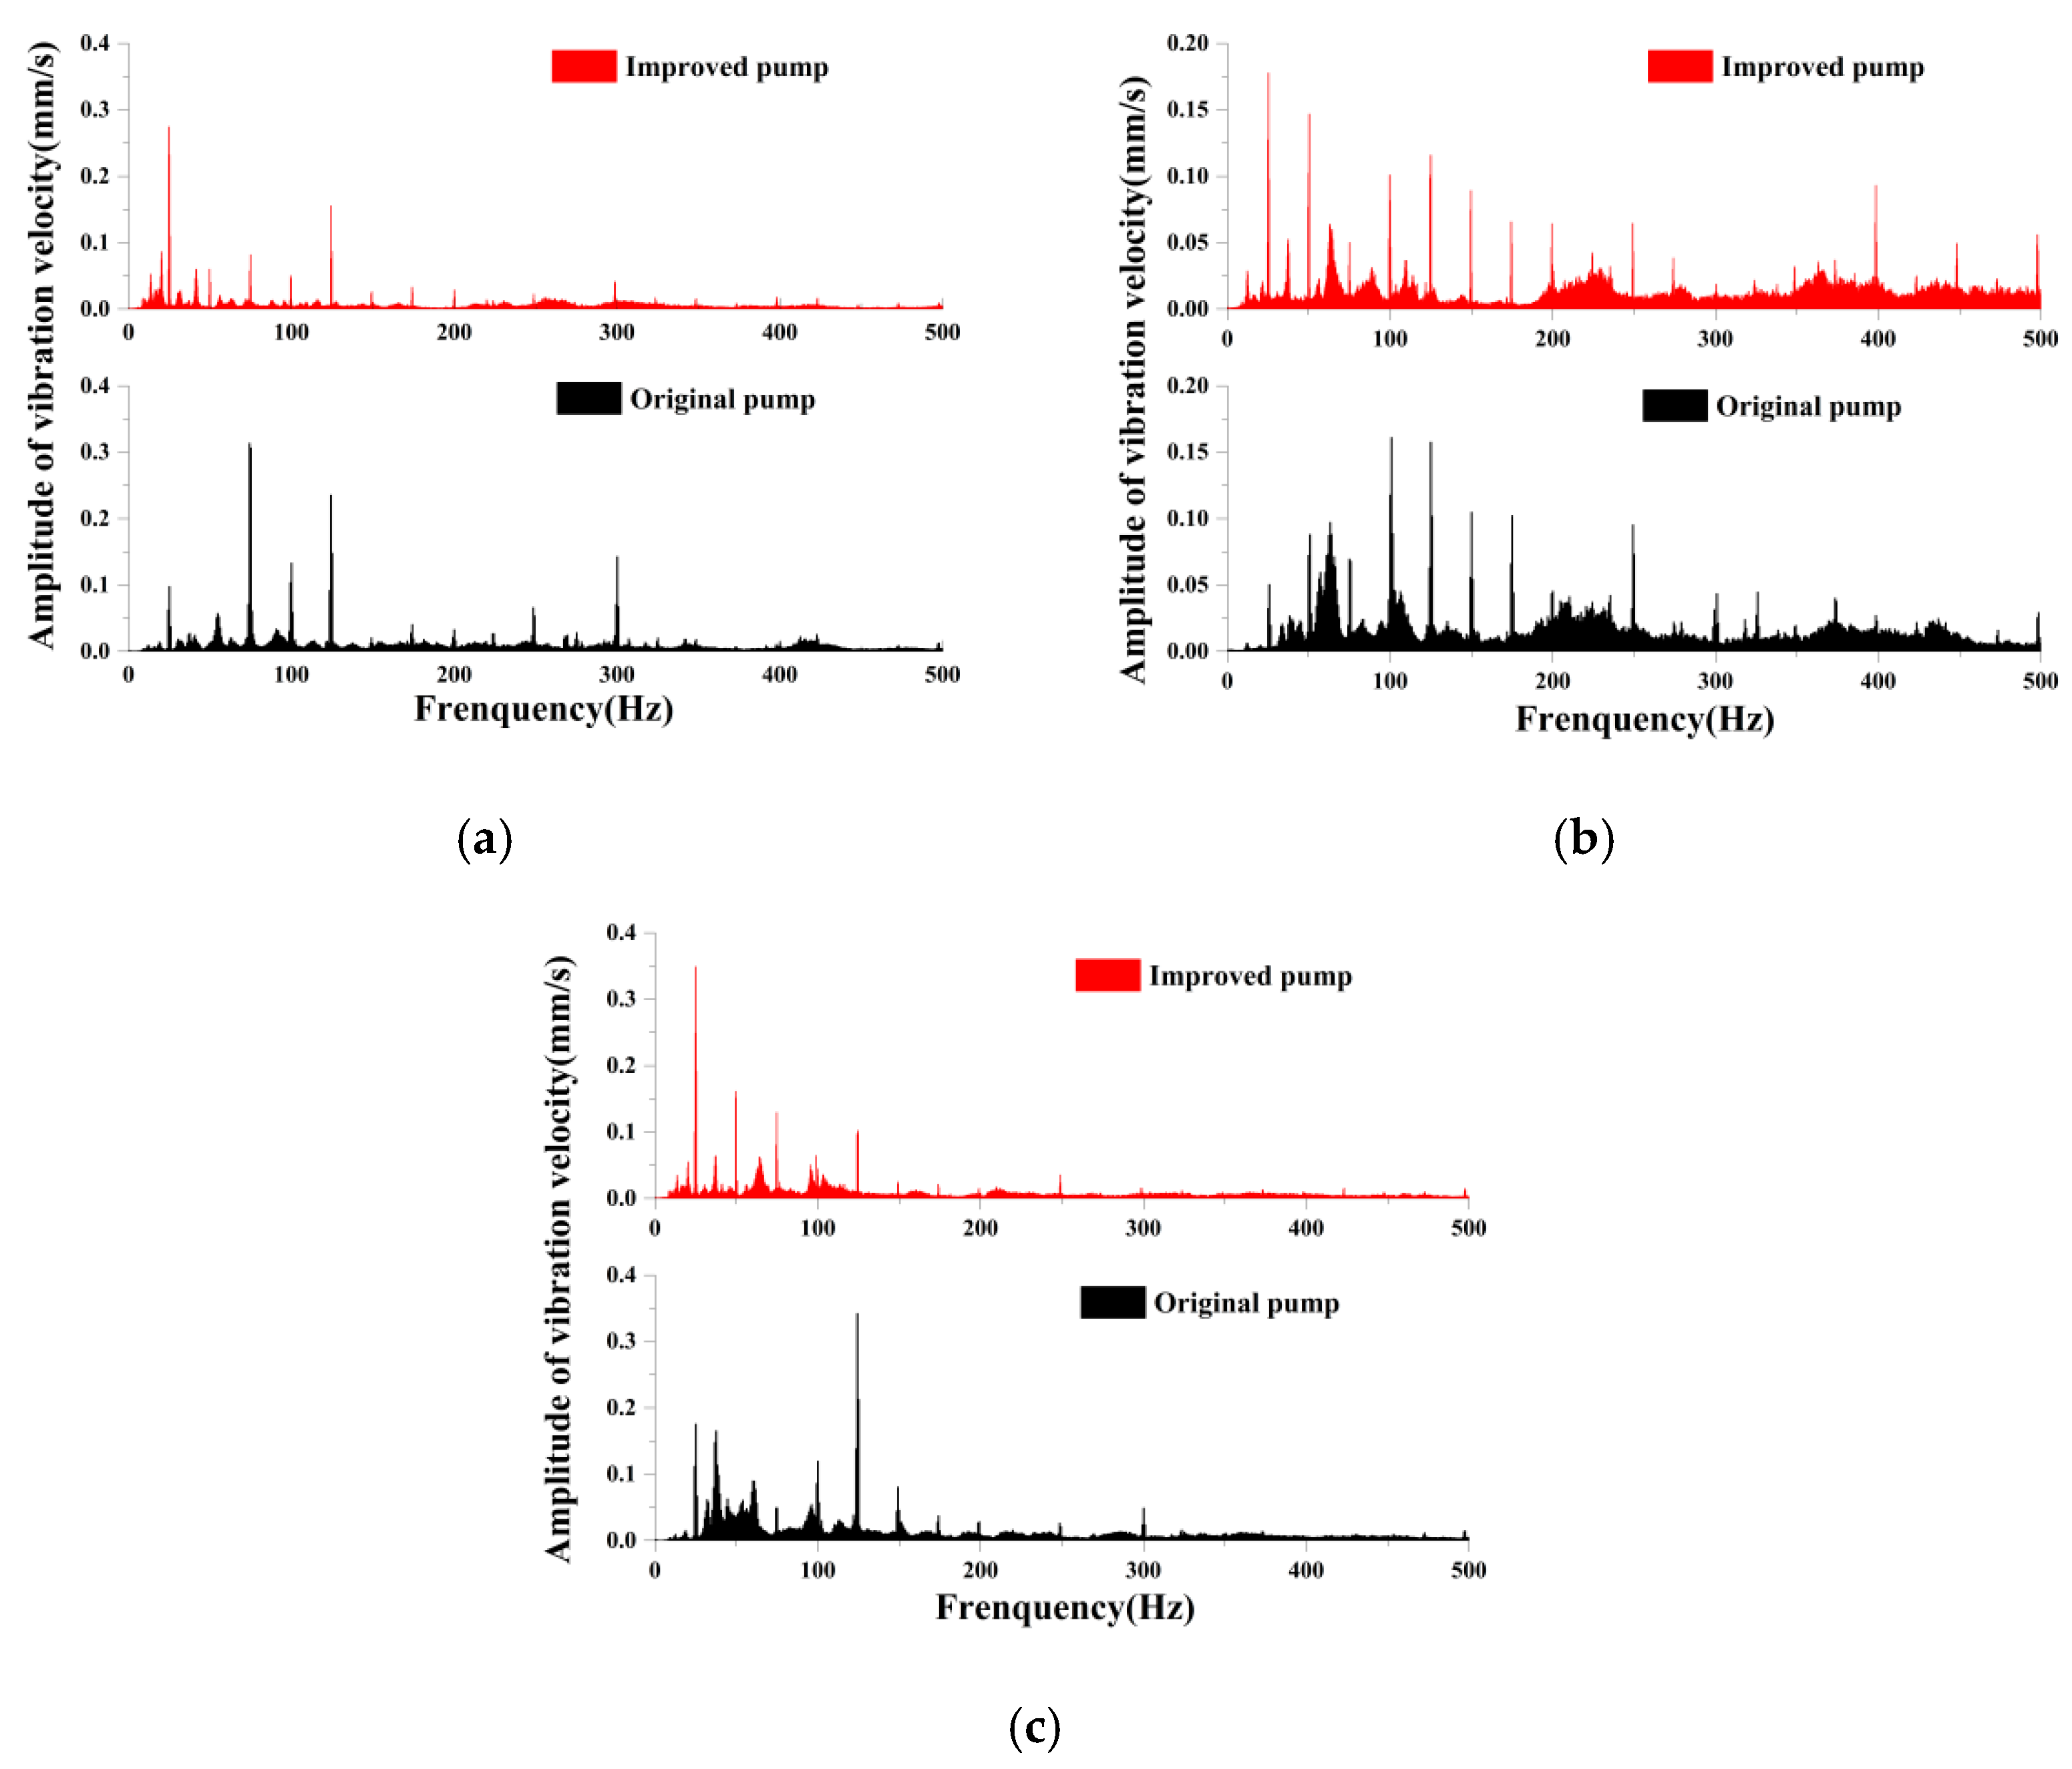
3.3.3. Vibration at M5

Figure 16 shows the frequency domain of vibration characteristics in three directions of M5 under the design flow rate. We find that:
(1)
In the X, Y, and Z directions, the main excitation frequencies of the improved pump at M5 are the axial frequency (25 Hz), twice the axial frequency (50 Hz), and 4 times the axial frequency (100 Hz). The maximum frequency of vibration amplitude is the axial frequency (25 Hz).
(2)
Vibration frequency of both the original and improved pump is mainly in the X and Z directions, while the vibration amplitude in the Y direction is the smallest. But there are wide frequency bands with 50 Hz, 220 Hz, and 400 Hz in the Y direction, which are syntony frequencies.
(3)
Vibration amplitudes of the improved pump in the X, Y, and Z directions increased by 29.6%, 1.3%, and 3.1%, respectively, from those of the original pump.

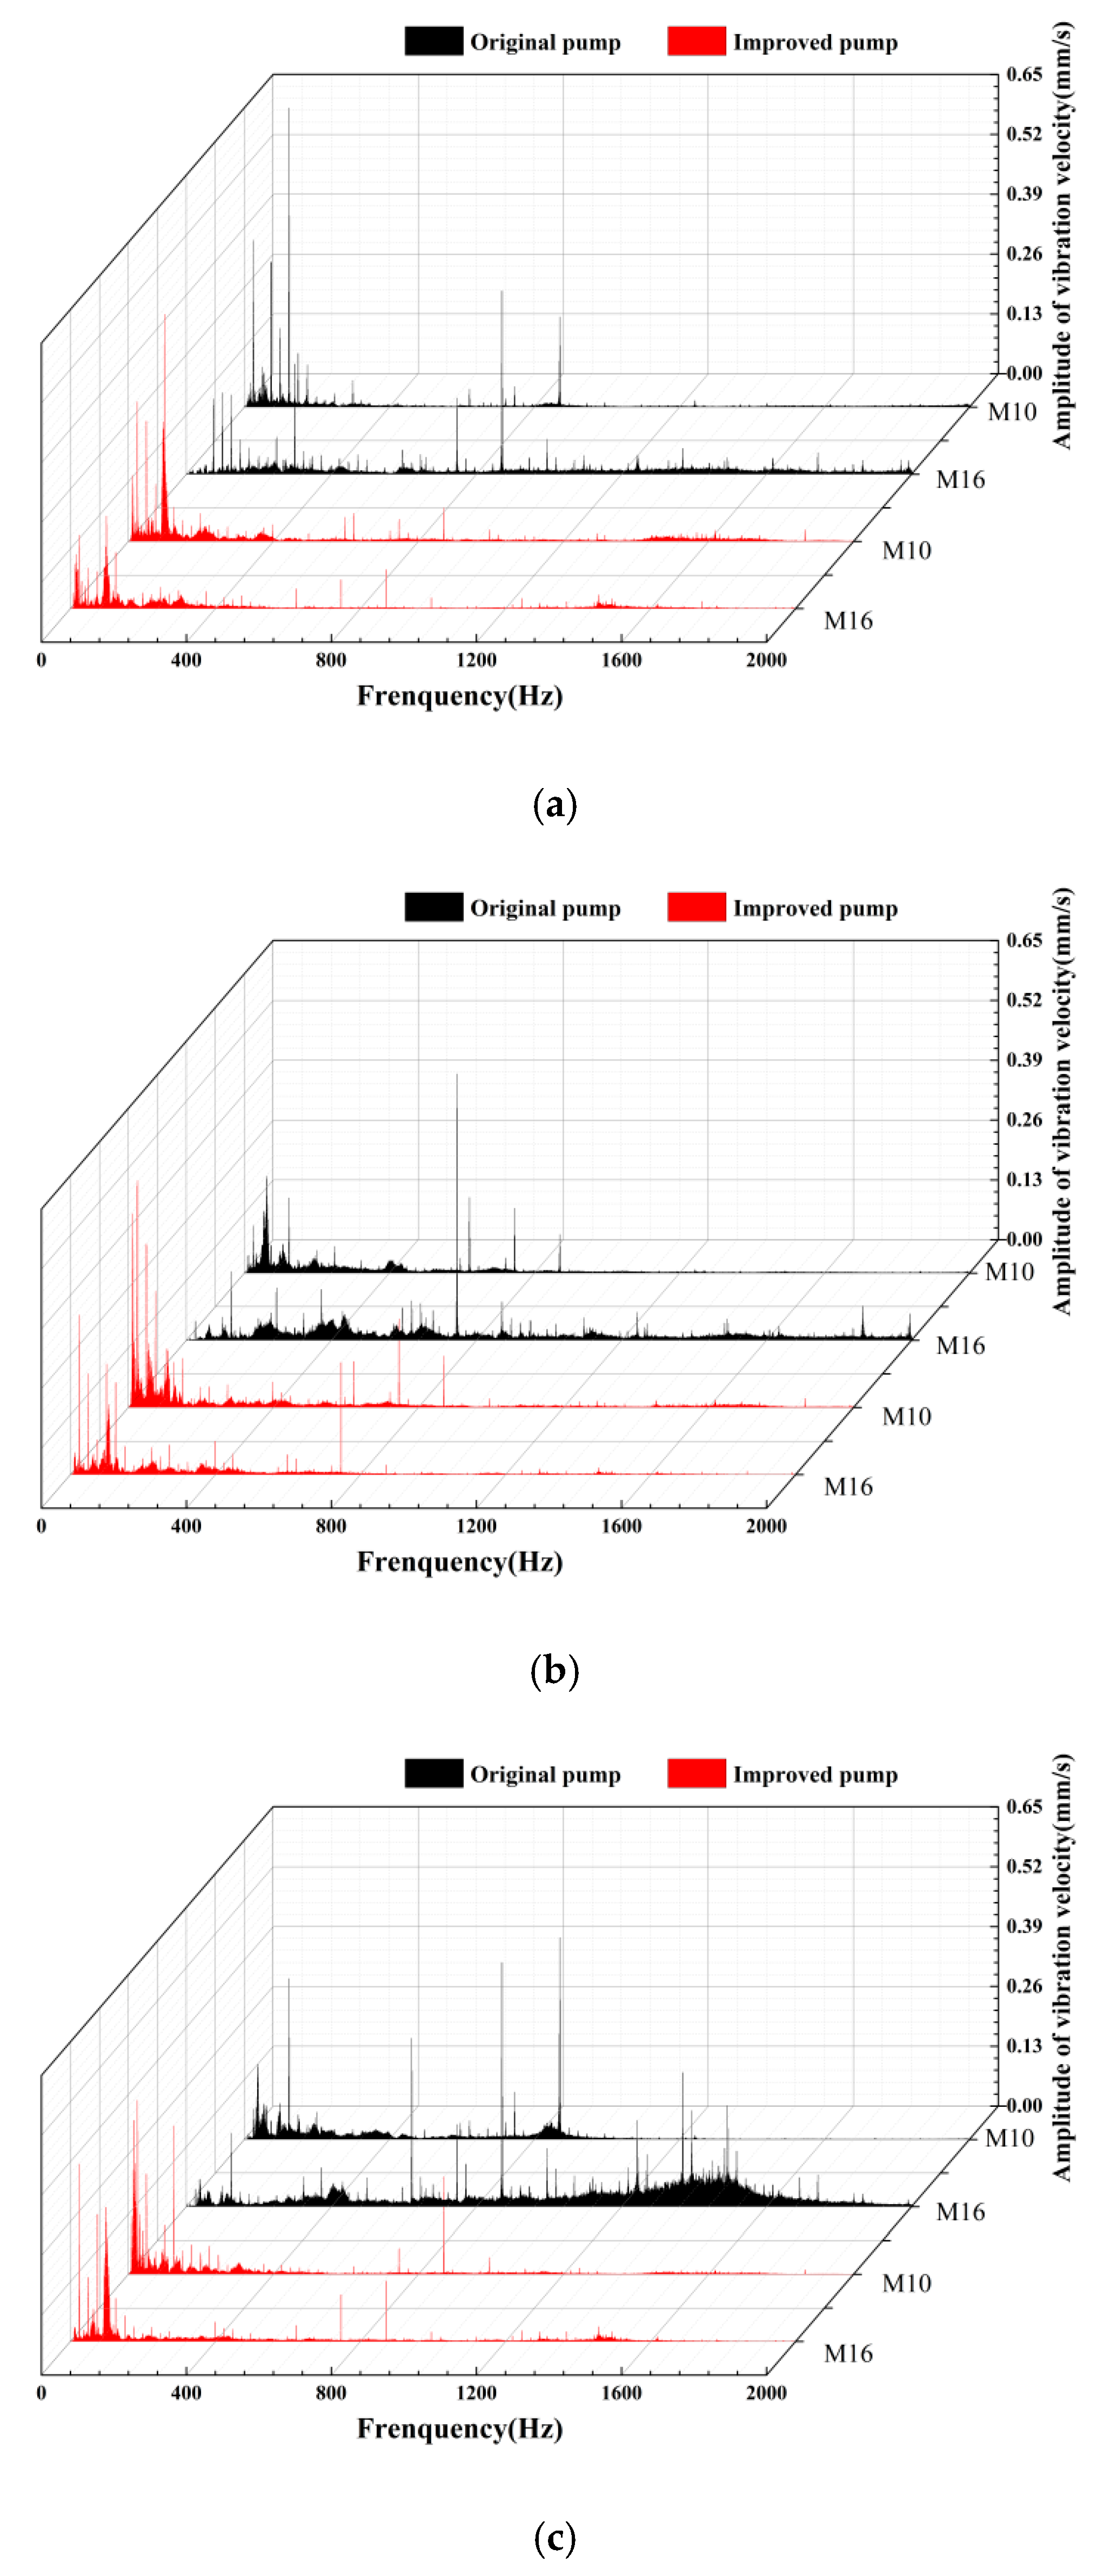
3.3.4. Vibration at M10 and M16

Vibration intensity is an important parameter used to measure the vibration state of machine. The calculated value of the vibration intensity Vmax is the maximum value of the root-mean-square of the vibration velocity in the X, Y and Z directions and can be obtained by the following equation.
V ims = 1 N n = 0 N 1 v 2 ( n )
where N is the number of discrete points of the measured signal, v is the vibration velocity of the pump and Vims is the root-mean-square of the vibration velocity.
Figure 17 shows a comparison of vibration at M10 and M16 in the three directions. It can be observed that the main vibration source in the improved pump is flow-induced vibration from rotor-stator interaction. The dominant frequency of vibration in the improved pump is the axial frequency, and there is little high-frequency vibration. Yet there is more syntony-frequency and high-frequency vibration in the original pump, with wide frequency bands at 1,600 Hz in the Z direction. The high-frequency vibration in the original pump may be caused by syntony of mechanical vibration and flow-induced vibration.

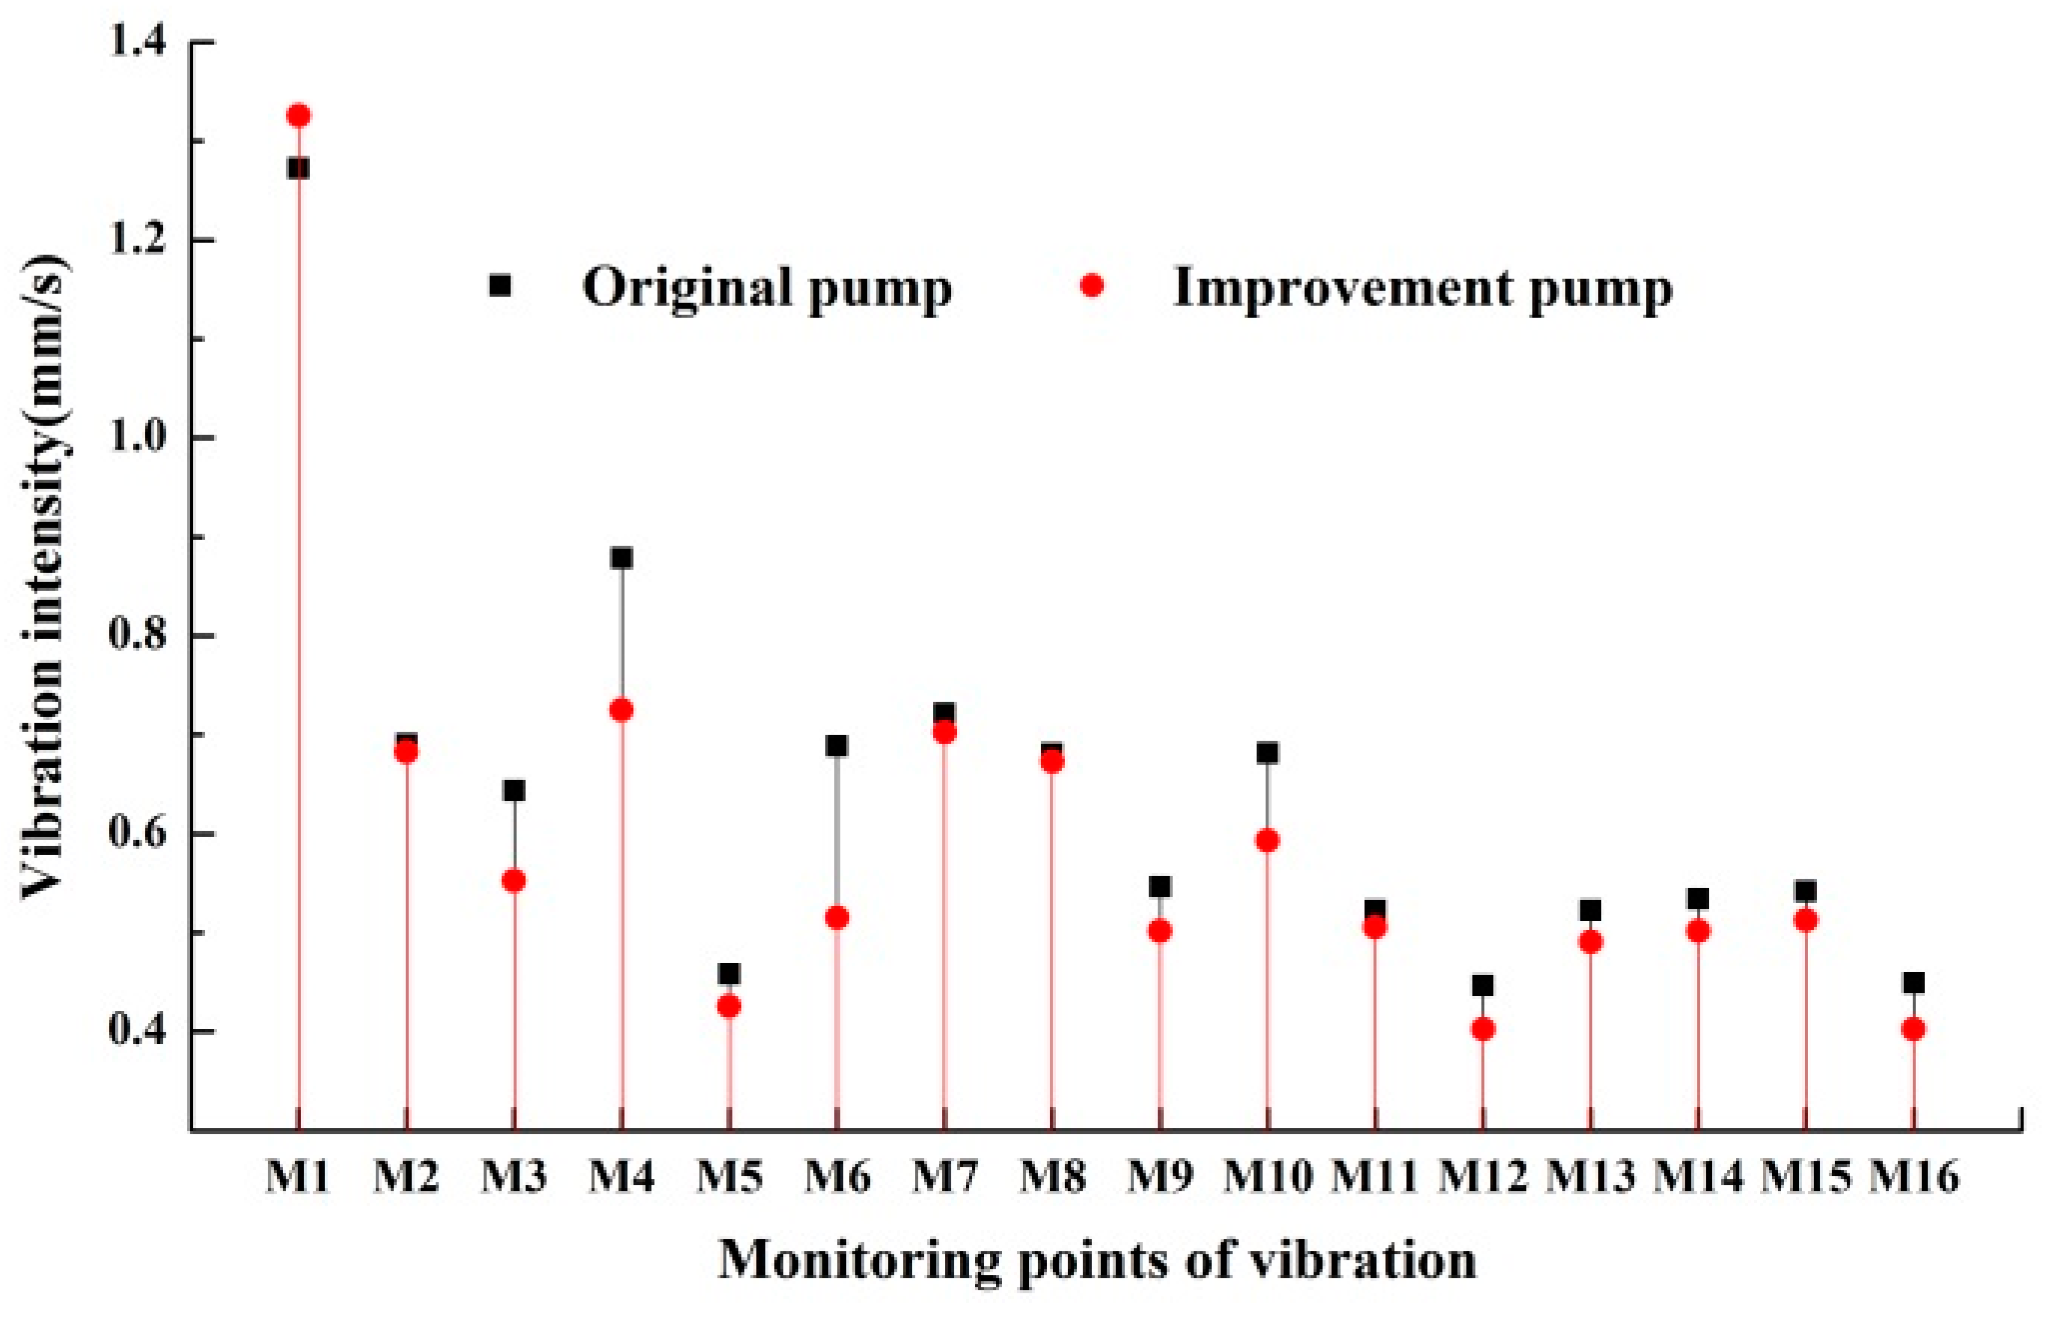
3.3.5. Vibration Intensity at Each Measuring Point

Figure 18 presents the vibration intensity of the improved and original pumps. It can be seen that vibration intensities decrease at all monitoring points except for the monitoring point at the outlet flange. The magnitude of vibration intensity in the improved pump is the same as in the original pump, and for both pumps they are related as follows: inlet flange > both sides of the bearing > motor base > pump base > pump body. The reduction of vibration intensity at the inlet flange and motor base are less than in other monitoring points because the unstable flow in the pump has a slight effect on vibration at those monitoring points. Vibration intensity at the outlet flange in the improved pump is 4% greater than in the original pump. The vibration intensities of M3 and M4 on both sides of the two bearings in the improved pump are respectively 14.2% and 17.5% less than in the original pump. Compared with the original pump, vibration intensity at the right of the pump base in the improved pump obviously decreases.
Vibration intensities at monitoring points M3 and M4 are shown in Table 4. Vibration intensity at M4 is generally greater than at M3 because M4 is near the right bearing, which is close to the motor. Vibration intensities at M3 and M4 decrease gradually with the increase of the flow rate. Vibration intensities at M3 and M4 in the improved pump are less than in the original pump in three directions. The maximum vibration intensity at M4 in the improved pump is 1.04 mm/s, which is 18.1% less than 1.27 mm/s in the original pump.

4. Conclusions

To improve the efficiency of a prototype liquid molten salt pump for a molten salt reactor, geometric modifications were made by trimming the back-blades of the impeller and smoothing a sharp corner near the outlet pipe of the annular chamber. The improvement was verified by energy-performance, pressure-pulsation, and vibration experiments. Some conclusions follow.
(1)
Under the design flow rate, the efficiency of the improved pump is 76.7%, which is 5.26 percentage points greater than that of the original pump.
(2)
Compared with the original pump, the amplitude of pressure pulsation at points P1, P2, P3, and P4 in the improved pump decrease by 38.9%, 42.9%, 27.1%, and 5.4%, respectively. At P6, the peak-to-peak value of the time domain of pressure pulsation in the improved pump is 71.4% less than in the original pump, and the amplitude of the frequency domain in the improved pump decreases by 32.5%.
(3)
The wide frequency band at M1 in the improved pump disappears, and wide frequency bands at other vibration monitoring points also decrease or disappear. The maximum vibration intensity at M4 in the improved pump is 1.04 mm/s, which is 18.1% less than 1.27 mm/s in the original pump.
This manuscript mainly studies the influence of geometrical changes on the hydraulic performance of molten salt pump and improves efficiency of the pump. However, in the course of the study, the influence of the physical properties of the molten salt on the energy performance and stability of the pump was not considered. Therefore, in the subsequent research, a comprehensive study about the physical properties of the molten salt needs to be carried out.

Author Contributions

Conceptualization, H.L.; methodology, K.W.; software, Y.L. and X.H.; validation, H.L. and K.W.; formal analysis, Y.L.; investigation, X.H.; resources, K.W.; data curation, K.W.; writing—original draft preparation, X.L.; writing—review and editing, H.-B.K.; visualization, X.H.; supervision, H.L.; project administration, H.L.; funding acquisition, H.L. and K.W.

Funding

This research was funded by the National Natural Science Foundation of China, grant number 51579117 and 51779108, and Six Talent Peaks Project in Jiangsu Province of China, grant number 2018-GDZB-154.

Conflicts of Interest

The authors declare no conflict of interest.

References

  1. Shao, C.L.; Zhao, Y. Numerical Study of the Dimensionless Characteristics and Modeling Experiment of a Molten Salt Pump that Transports Viscous Fluids. Int. J. Numer. Methods Heat Fluid Flow 2017, 27, 2131–2153. [Google Scholar] [CrossRef]
  2. Li, H. Unsteady Numerical Simulation of 3D Turbulent Flow in Molten Salt Pump. Master’s Thesis, Jiangsu University, Zhenjiang, China, 2008. (In Chinese). [Google Scholar]
  3. Cheng, W.J.; Gu, B.Q.; Shao, C.L.; Wang, Y. Hydraulic Characteristics of Molten Salt Pump Transporting Solid-liquid Two-phase Medium. Nucl. Eng. Des. 2017, 324, 220–230. [Google Scholar] [CrossRef]
  4. Cheng, W.J.; Gu, B.Q.; Shao, C.L. A Numerical Study on the Steady Flow in Molten Salt Pump under Various Conditions for Improved Hydraulic Performance. Int. J. Numer. Method Heat Fluid Flow 2017, 27, 1870–1886. [Google Scholar] [CrossRef]
  5. Zhu, Y.; Kang, C.; Li, Q. Investigation of Structural Dynamic Characteristics of Molten-Salt Pump Rotor Based on Fluid-Thermal-Structure Coupling. Chin. J. Process Eng. 2018, 18, 957–964. [Google Scholar]
  6. Shao, C.L.; Zhou, J.F.; Cheng, W.J. Effect of Viscosity on the External Characteristics and Flow Field of a Molten Salt Pump in the View of Energy Loss. Heat Mass Transf. 2018. [Google Scholar] [CrossRef]
  7. Wang, L.; Hou, Y.; Shi, L.; Wu, Y.W.; Tian, W.X.; Song, D.K.; Qiu, S.; Su, G.H. Experimental Study and Optimized Design on Electromagnetic Pump for Liquid Sodium. Ann. Nucl. Energy 2019, 124, 426–440. [Google Scholar] [CrossRef]
  8. Hammitt, F.G. Discussion: Cavitation Damage to Centrifugal Pump Impellers during Operation with Liquid Metals and Molten Salt at 1050-1400F. J. Basic Eng. 1963, 85, 335–336. [Google Scholar] [CrossRef]
  9. Guo, B. Design and Reliability Analysis of Molten Salt Pump at High Temperature. Master’s Thesis, Jiangsu University, Zhenjiang, China, 2016. (In Chinese). [Google Scholar]
  10. Yang, M.G.; Shao, T.; Gao, B.; Li, Z.; Wang, D. Interior Flow and Unsteady Performance of Molten Salt Pump with Splitter Space Guide Vane. J. Drain. Irrig. Mach. Eng. 2015, 33, 306–310. [Google Scholar]
  11. Wang, Y.F.; Zhang, J.F.; Yuan, S.Q.; Huang, X.; Zhang, X. Influence of Splitter Blades in the Structural Dynamic Characteristics on a High-temperature Molten Salt Pump. Fluid Mach. 2016, 44, 38–44. [Google Scholar]
  12. Shao, C.L.; Zhou, J.F.; Gu, B.Q.; Cheng, W.J. Experimental Investigation of the Full Flow Field in a Molten Salt Pump by Particle Image Velocimetry. J. Fluids Eng. 2015, 137, 104501. [Google Scholar] [CrossRef]
  13. Kang, C.; Zhou, L.; Wang, W.F.; Yang, M.G. Influence of Axial Vane on Inner Flow and Performance of a Molten-salt Pump. In Proceedings of the ASME-JSME-KSME 2011 Joint Fluids Engineering Conference, Hamamatsu, Japan, 24–29 July 2011; pp. 249–255. [Google Scholar]
  14. Shao, C.L.; Zhou, J.F.; Cheng, W.J. Experimental and Numerical Study of External Performance and Internal Flow of a Molten Salt Pump that Transports Fluids with Different Viscosities. Int. J. Heat Mass Transf. 2015, 89, 627–640. [Google Scholar] [CrossRef]
  15. Yang, M.G.; Gao, B.; Jia, W.D.; Wang, C.L.; Wu, N.X. Analysis of Cooling and Lubricating System of Bearings in Pumps for Melted Salts. J. Jiangsu Univ. (Nat. Sci. Ed.) 2005, 26, 149–152. [Google Scholar]
  16. Wang, Z.; Naterer, G.F.; Gabriel, K.S.; Secnik, E.; Gravelsins, R.; Daggupati, V. Thermal Design of a Solar Hydrogen Plant with a Copper–Chlorine Cycle and Molten Salt energy Storage. Int. J. Hydrog. Energy 2011, 36, 11258–11272. [Google Scholar] [CrossRef]
Figure 1. Prototype liquid molten salt pump.
Symmetry 11 00423 g001
Figure 2. Component parts: (a) wax models of impeller; (b) wax models of diffuser; (c) Component parts.
Symmetry 11 00423 g002
Figure 3. Experiment bench of the prototype pump. (a) Schematic diagram; (b) Photo.
Symmetry 11 00423 g003
Figure 4. Pump characteristics curve of the prototype pump.
Symmetry 11 00423 g004
Figure 5. Mesh generation.
Symmetry 11 00423 g005
Figure 6. Absolute velocity distribution in the prototype pump: (a) Middle plane; (b) Axial plane.
Symmetry 11 00423 g006
Figure 7. Structural improvement scheme: (a) Trimming back-blades of impeller; (b) Smoothing sharp corner.
Symmetry 11 00423 g007
Figure 8. Comparison of energy performance.
Symmetry 11 00423 g008
Figure 9. Arrangement of monitoring points of pressure pulsation.
Symmetry 11 00423 g009
Figure 10. Comparison of time domain of pressure pulsation at P1–P4: (a) P1; (b) P2; (c) P3; (d) P4.
Symmetry 11 00423 g010
Figure 11. Comparison of frequency domain of pressure pulsation at P1–P4: (a) P1; (b) P2; (c) P3; (d) P4.
Symmetry 11 00423 g011
Figure 12. Comparison of pressure pulsation at P5: (a) Time domain; (b) Frequency domain.
Symmetry 11 00423 g012
Figure 13. Comparison of pressure pulsation at P6: (a) Time domain; (b) Frequency domain.
Symmetry 11 00423 g013
Figure 14. Arrangement of monitoring points of vibration: (a) M1–M8; (b) M9–M16.
Symmetry 11 00423 g014
Figure 15. Comparison of vibration in X, Y and Z direction at M1: (a) X direction; (b) Y direction; (c) Z direction.
Symmetry 11 00423 g015
Figure 16. Comparison of vibration in X, Y and Z direction at M5: (a) X direction; (b) Y direction; (c) Z direction.
Symmetry 11 00423 g016
Figure 17. Comparison of vibration in X, Y and Z direction at M10 and M16: (a) X direction; (b) Y direction; (c) Z direction.
Symmetry 11 00423 g017
Figure 18. Comparison of vibration intensity at each measuring point.
Symmetry 11 00423 g018
Table 1. The specifications of sensors.
The pressure Pulsation SensorThe Vibration Sensor
CategoryParameterCategoryParameter
Scope of measurement0–1 MpaScope of measurement0.5–8 kHz
Precision0.25% FSSensitivity10 mV/ms−2
Scope of measurement0–2 kHzInstallation resonance frequency25 kHz
Operating temperature−10–80 °CVerification conditionsTemperature 20 °C Humidity 50%
Table 2. Comprehensive uncertainty value of each measurement parameter (%).
ParameterFlow RateHeadSpeedVibration
Random uncertainty±0.02±0.03±0.01±0.19
Systematic uncertainty±0.22±0.24±0.08±0.11
Uncertainty±0.22±0.24±0.08±0.22
Standard±2.00±1.50±0.40±3.60
Table 3. Grid independence analysis.
No.Grid NumberHead (m)Efficiency (%)
11524185416.0572.98
24821023116.0873.06
35014316316.1073.18
45247370216.1173.22
56101647016.1173.23
Table 4. Vibration intensity at M3 and M4 (unit: mm/s).
DirectionFlow RateOriginal PumpImproved Pump
M3M4M3M4
X0.8Qd0.631.270.611.04
1.0Qd0.560.850.530.79
1.2Qd0.530.740.480.67
Y0.8Qd0.590.620.550.53
1.0Qd0.520.530.490.45
1.2Qd0.410.450.350.40
Z0.8Qd0.630.930.600.88
1.0Qd0.640.880.620.81
1.2Qd0.590.830.560.75

