Article

Optimizing MSE for Clustering with Balanced Size Constraints

School of Computer Science and Communication Engineering, Jiangsu University, Zhenjiang 212013, China
*
Author to whom correspondence should be addressed.
Symmetry 2019, 11(3), 338; https://doi.org/10.3390/sym11030338
Submission received: 7 February 2019 / Revised: 26 February 2019 / Accepted: 1 March 2019 / Published: 6 March 2019

Abstract

:
Clustering is to group data so that the observations in the same group are more similar to each other than to those in other groups. k-means is a popular clustering algorithm in data mining. Its objective is to optimize the mean squared error (MSE). The traditional k-means algorithm is not suitable for applications where the sizes of clusters need to be balanced. Given n observations, our objective is to optimize the MSE under the constraint that the observations need to be evenly divided into k clusters. In this paper, we propose an iterative method for the task of clustering with balanced size constraints. Each iteration can be split into two steps, namely an assignment step and an update step. In the assignment step, the data are evenly assigned to each cluster. The balanced assignment task here is formulated as an integer linear program (ILP), and we prove that the constraint matrix of this ILP is totally unimodular. Thus the ILP is relaxed as a linear program (LP) which can be efficiently solved with the simplex algorithm. In the update step, the new centers are updated as the centroids of the observations in the clusters. Assuming that there are n observations and the algorithm needs m iterations to converge, we show that the average time complexity of the proposed algorithm is O ( m n 1.65 ) O ( m n 1.70 ) . Experimental results indicate that, comparing with state-of-the-art methods, the proposed algorithm is efficient in deriving more accurate clustering.

1. Introduction

In the fields of data mining, machine learning, and social science, the most widely studied and fundamental method is clustering. Clustering is to partition observations into clusters so that similar observations are put together while dissimilar observations are separated [1]. There are sophisticated clustering algorithms. Unfortunately, they are not suitable for applications that impose the equally large cluster sizes as a constraint. For example, in marketing campaigns, the given customers need to be partitioned into clusters so that each cluster is allotted to a salesman. For the purpose of fairness and efficiency, each salesman should have the same workload [2]. In [3], the authors considered organizing sensor nodes into clusters of similar size so that the workloads are distributed evenly on all the master nodes. There are also other examples like circuit designing [4], document clustering [5], and image searching [6]. The balanced size constraints are introduced into clustering because of the application requirements rather than the actual distribution of the data. Moreover, according to [7], the balance of clusters is an important issue in clustering. The lack of size constraints in traditional clustering algorithms could lead to extremely unbalanced clustering.
With the demands of the balanced size-constraint clustering, many approaches have been proposed in the last decades. Most of the size-constraint clustering methods are based on soft size constraints. They could ease the problem of extremely unbalanced clustering caused by traditional clustering algorithms. However, they are not suitable for the applications where the observations are required to follow a strictly even distribution. Although there are plenty of such application requirements, only few studies have been dedicated to the hard size-constraint problem. More importantly, existing clustering methods based on hard size constraints can be hardly used due to the low accuracy or efficiency.
In this paper, we propose a novel approach to solve the problem of clustering with hard balance size constraints. Given a set of n observations, the task is to find a scheme to partition them into k clusters so that the sizes of all the clusters are approximately the same ( ± 1 ) while the mean squared error (MSE) is minimized. Similar to the k-means algorithm, our proposed method is a gradient descent solution which runs in an iterative way. Each iteration consists of two steps, namely an assignment step and an update step. In the assignment step, the observations are evenly assigned to different clusters. The balanced assignment task here is modeled as an integer linear program (ILP). We prove that the corresponding constraint matrix is totally unimodular. Thus the ILP can be relaxed as a linear program (LP) which can be efficiently solved with the simplex algorithm [8]. In the update step, the task is relatively simpler: update the new centers as the centroids of the observations assigned to the clusters. Assuming that there are n observations and the algorithm needs m iterations to converge, we show that the average time complexity of the proposed algorithm is O ( m n 1.65 ) O ( m n 1.70 ) , which is much better than the O ( m n 3 ) method based on the Hungarian algorithm [9].
To evaluate the proposed method, experiments have been conducted. Both real and synthetic datasets are involved. The number of observations n ranges from 150 to 5000. The number of clusters k takes its value from the set of {3, 9, 21, 45, 93}, which covers both the situations when the number of observations could and could not be divisible by the number of clusters. We do not choose very large cluster numbers, because according to the rule of thumb [10], the number of clusters k for data of size n should be less than n / 2 . The evaluation criteria include the cost and running time of the balanced assignment algorithm as well as the number of iterations, MSE, and running time of the balanced clustering algorithm. From the experimental results, it can be concluded that the proposed method is a practical solution for the task of clustering with balanced size constraints.
The rest of this paper is organized as follows. Section 2 reviews some related work. Section 3 covers the details about our proposed balanced clustering algorithm. In Section 4, the experimental settings and results are given. The discussion is provided in Section 5. Finally, Section 6 concludes the paper and presents future directions of research.

2. Related Work

Since the problem of clustering with balanced size constraints is a special form of the size-constraint clustering, we will briefly review some studies related to clustering with size constraints. The constraints can be divided into two categories, namely soft size constraints and hard size constraints. The former ones refer to constraints that are not guaranteed to be satisfied, while the latter ones are compulsory conditions that must be satisfied during clustering process [11].

2.1. Soft Constraints

More work has been published about soft rather than hard constraints. Ref. [7] proposed frequency sensitive competitive learning (FSCL) for balanced clustering. A multiplicative term and an additive term are introduced into the objective function in order to penalize larger clusters. Thus larger clusters are less likely to win points so that the clustering will be balanced. Similarly, Ref. [6] proposed to apply a penalty mechanism in FSCL that only includes an additive term. Ref. [12] presented a scalable clustering algorithm that satisfies the balance constraints which runs in O ( k N l o g N ) time. The algorithm first clusters the sampled data points, then populates the clusters with the unsampled data points while simultaneously keeping the balanced size constraints. The ratio-cut algorithm that solves an objective function which embodies both min-cut and equipartition was described in [13]. Ref. [14] suggested a size regularized cut (SRcut). The sizes of clusters are utilized as prior knowledge in the clustering process. A regularization term measuring the balances of clusters is added to the cost function. The results suggest that it outperforms the normalized cut which impose indirect size constraints [15]. Ref. [16] proposed to incorporate the balance condition in the cost function, and the problem is solved by finding a partition close to the given partition. In [17], exclusive lasso is applied in the balanced k-means and min-cut method to represent the size constraints. The results suggest improved performance. Clustering with soft size constraints could ease the problem of extremely unbalanced clustering, yet it is not able to deal with applications that impose hard constraints on the sizes of clusters. In this paper, our focus is on the clustering with hard size constraints.

2.2. Hard Constraints

On the other hand, there are few studies of clustering with hard size constraints, although the topic is highly relevant in practice. The method in [9] presented a new direction to deal with this problem. It translates the k-means assignment step into the average assignment problem that is to evenly assign n observations to k clusters with minimum cost. The average assignment problem is then modeled as a bipartite matching problem that is readily solved by the Hungarian algorithm. The method works well when the number of observations n is divisible by the number of clusters k. However, it is awkward when n is not divisible by k because it is not known that which clusters should be assigned to n / k observations. Ref. [18] proposed a method for clustering with hard size constraints. It first applies the k-means algorithm to the data so that the partition A without any size constraints is obtained. Then the partition B with given size constraints is calculated by maximizing its agreement with partition A. The optimization problem is finally modeled as an ILP, which can be easily solved with an existing solver. The algorithm is quite convenient and efficient to implement. The experimental results also indicate that incorporating the size constraints improves the accuracy of the clustering algorithm. However, the algorithm fails to consider the similarity between observations in the mathematical model, which leads to a less optimized MSE. Refs. [19,20] presented a balanced k-means algorithm to solve the problem of partitioning areas for large scale vehicle routing. The traditional k-means algorithm is applied to divide the whole dataset into several areas at the first step. Then a heuristic algorithm is developed to adjust the clusters so that the balanced size constraints are satisfied. However, the heuristic algorithm can hardly guarantee the quality of clustering.
In case of local solutions with clusters that contain few observations or even empty clusters, a clustering method was proposed in [21] where it imposes lower bounds on the sizes of clusters. The problem is modeled as an ILP which is then transferred into a minimum cost flow (MCF) linear network optimization problem. An algorithm specifically tailored to network optimization is then applied to solve the problem. Refs. [22,23] put lower bounds and upper bounds on the sizes of clusters, respectively, and adapt heuristic algorithms to solve the size-constraint clustering. However, the objectives of these studies differ from what we are going to accomplish in this paper.
According to the above discussion, most of the current researches on clustering with size constraints are based on soft constraints. Few contributions have been dedicated to the problem of clustering with hard size constraints, and they are not competent for the problem. To fill the gap, in this paper we propose a novel method that is based on ILP to deal with the problem of clustering with hard size constraints.

3. Balanced Clustering Algorithm

3.1. Problem Formulation

Minimizing the Mean Squared Error (MSE) is one of the most common standards in clustering algorithms. In this paper, we are trying to optimize the MSE subject to hard balanced size constraints, i.e., all the clusters should have approximately the same number of observations ( ± 1 ). Given n observations, the objective is to divide them into k clusters, and each cluster contains n / k to n / k observations. So our problem can be formulated as:
M i n i m i z e E = ( 1 / n ) j = 1 k o i μ j o i c j 2 s . t . n / k μ j n / k
Here, o i is the i-th observation, μ j represents the set of data in the j-th cluster, μ j denotes the number of observations in the j-th cluster, c j represents the center of the j-th cluster, and o i c j 2 stands for the squared distance between o i and c j .
Let p denote the partition matrix, where p i , j = 1 indicates that observation o i belongs to cluster j, and p i , j = 0 indicates that o i does not belong to cluster j. Obviously, summing each row of p equals 1 since one observation can only be assigned to one cluster. Summing each column of p would be the number of observations in the corresponding cluster, which in the balanced case would be either n / k or n / k . In this way, the problem shown in Equation (1) can be reformulated as:
M i n i m i z e E ( c , p ) = ( 1 / n ) j = 1 k i = 1 n p i , j o i c j 2 s . t . n / k i = 1 n p i , j n / k , 1 j k j = 1 k p i , j = 1 , 1 i n p i , j { 0 , 1 } , 1 j k , 1 i n

3.2. Proposed Solution

Similar to the k-means algorithm, the gradient descent method, which runs in an iterative way, is applied to solve the above problem. Given n observations, we derive the initial k centers by k-means++ algorithm [24]. Then the algorithm proceeds by 2 steps, namely an assignment step and an update step.
In the assignment step, we need to evenly assign the observations to different clusters according to the distance between the observations and the cluster centers so that the MSE is minimized. The objective is to minimize E ( c , p ) with respect to p while holding c fixed (known). Therefore, Equation (2) becomes an ILP as shown in Equation (3), where u j , v j and g i , j are slack variables used to eliminate inequalities. Z is the set of integers. In the next subsection we will prove that the integer constraints can be removed from this ILP so that the ILP becomes an LP which can be efficiently solved with the simplex algorithm [8].
M i n i m i z e E ( c , p ) = ( 1 / n ) j = 1 k i = 1 n p i , j o i c j 2 s . t . i = 1 n p i , j + u j = n / k , 1 j k i = 1 n p i , j + v j = n / k , 1 j k j = 1 k p i , j = 1 , 1 i n p i , j + g i , j = 1 , 1 j k , 1 i n u j , v j , g i , j , p i , j 0 , 1 j k , 1 i n u j , v j , g i , j , p i , j Z , 1 j k , 1 i n
A concrete example of the above problem can be illustrated as a bipartite graph shown in Figure 1. Five observations need to be evenly assigned to two clusters, i.e., each cluster must be assigned to two or three observations. The weight attached to each edge w i , j is the squared distance between observation o i and cluster center c j , namely o i c j 2 . The green solid lines shown in Figure 1 indicate a possible solution where o 1 , o 3 , and o 4 are assigned to c 1 , while o 2 and o 5 are assigned to c 2 .
Once the observations are assigned, the new centers need to be updated so that the MSE is minimized. The objective is to minimize E ( c , p ) with respect to c while holding p fixed (known). Since p is fixed, we can remove all the constraints in Equation (2). Then the task of the update step becomes an optimization problem without any constraints as shown in Equation (4).
M i n i m i z e E ( c , p ) = ( 1 / n ) j = 1 k i = 1 n p i , j o i c j 2 = ( 1 / n ) j = 1 k i = 1 n p i , j ( o i c j ) ( o i c j ) T
The minimum value of E can be achieved when
d ( E ( c , p ) ) / d ( c ) = 0 i = 1 n p i , j c j i = 1 n p i , j o i = 0 c j = ( 1 / i = 1 n p i , j ) i = 1 n p i , j o i
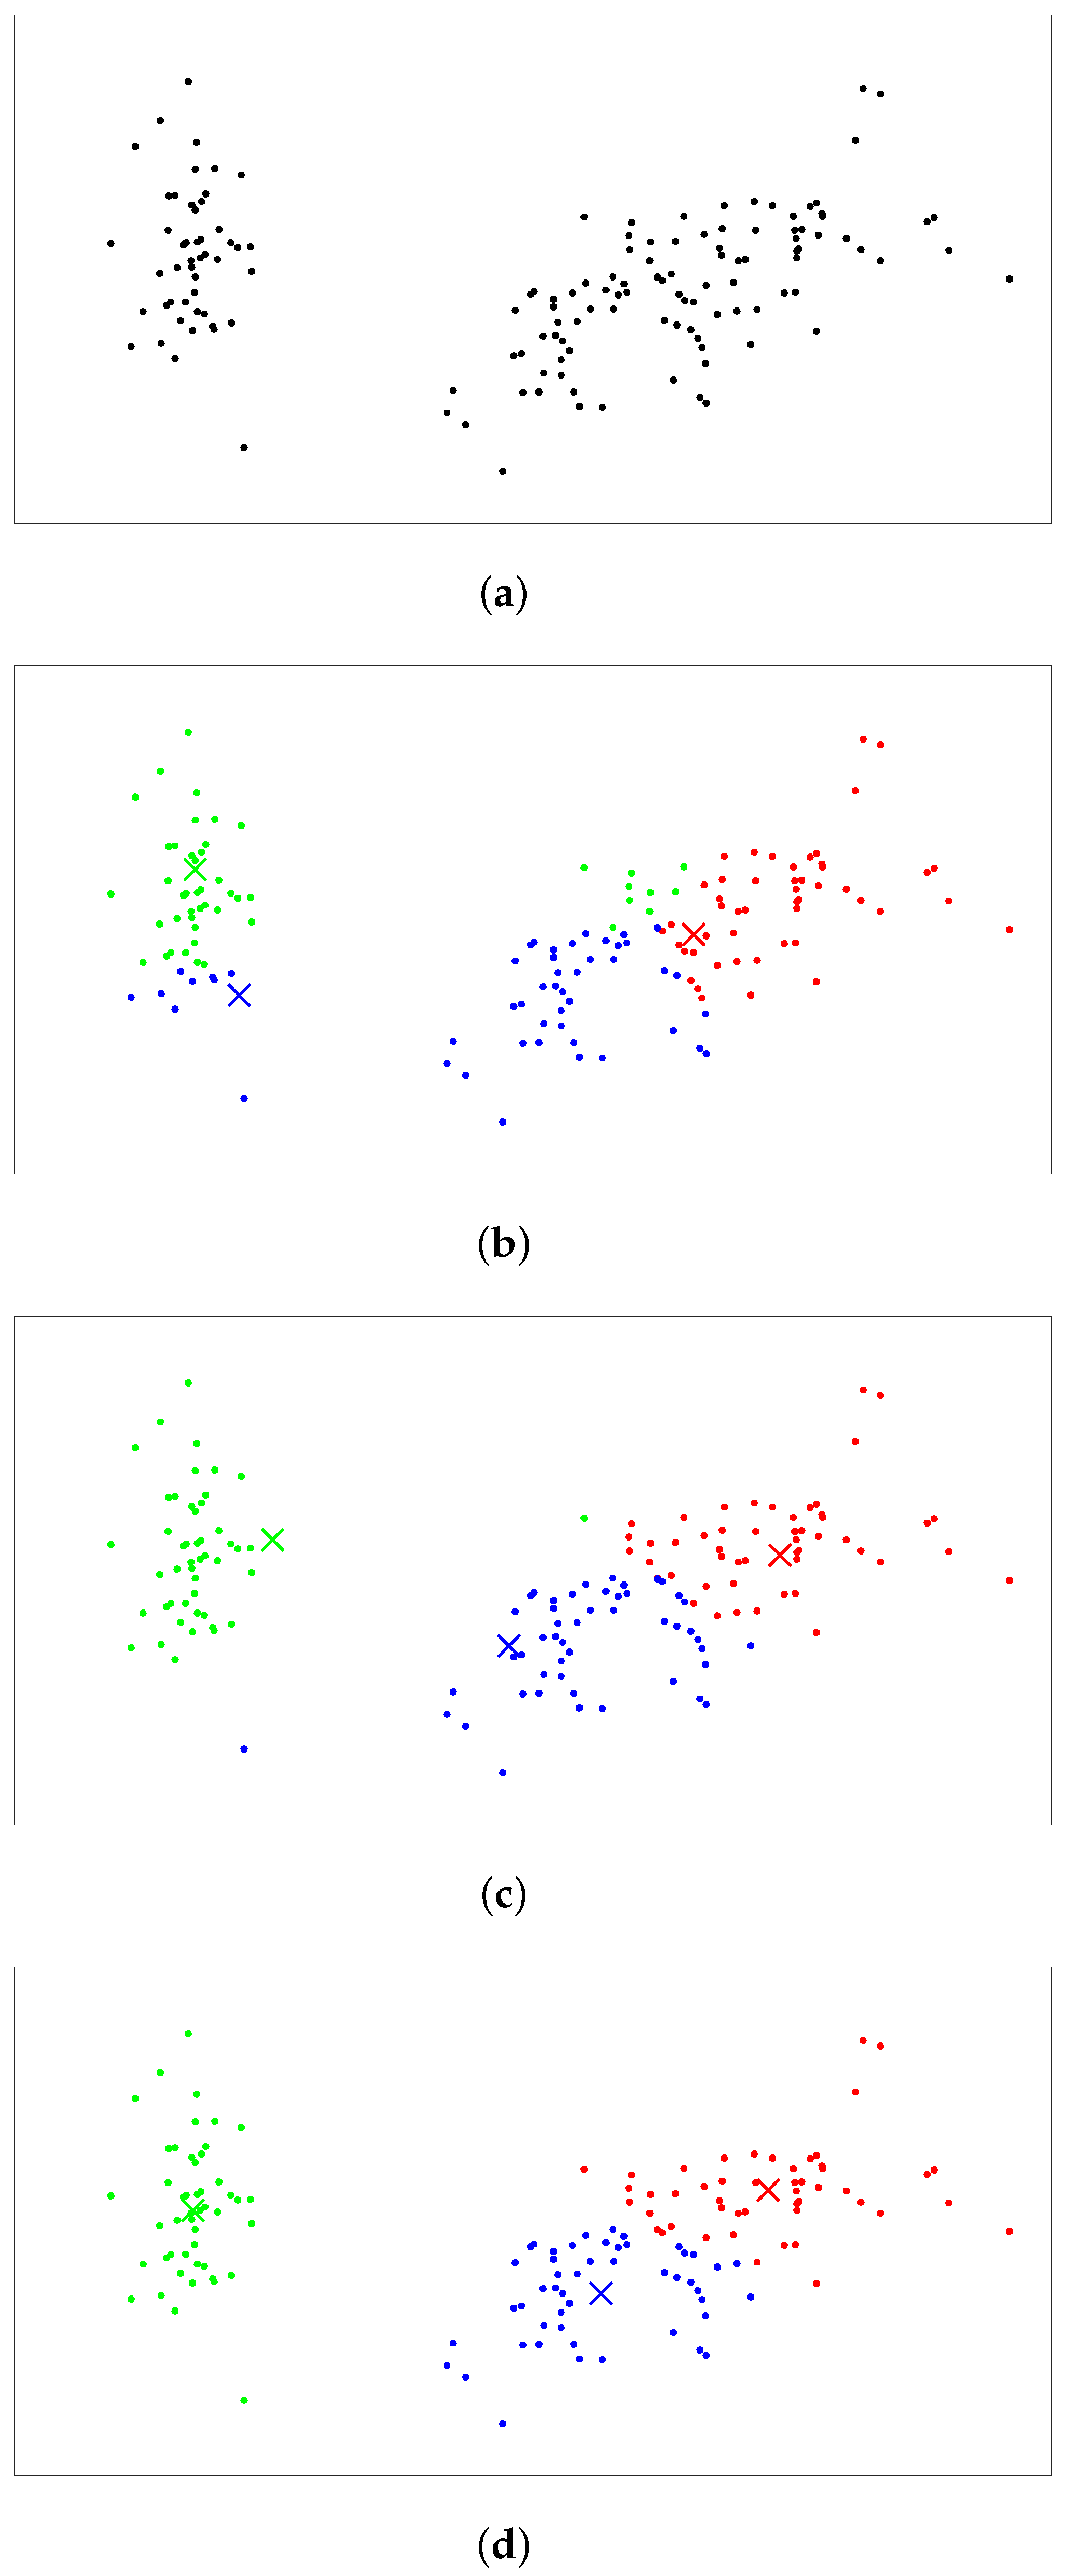
In summary, the proposed method can be detailed as Algorithm 1. A concrete example of our proposed algorithm can be found in Figure 2.
Algorithm 1 Clustering with balanced size constraints
Input: Observations O = { o 1 , o 2 , , o n } , number of clusters k
Output: Labels of the observations.
1:
Initialize k centers using the k-means++ algorithm;
2:
repeat
3:
    Assignment step: assign the observations to k clusters by solving Equation (3);
4:
    Update step: update the new centers of the clusters by solving Equation (5);
5:
until There is no more change to the partition matrix;
6:
return Labels of the observations.
Our algorithm is guaranteed to converge, but not always to the global optimum due to the non-convexity of the objective function. Assuming that p ( t ) , c ( t ) are the partition matrix and the centers at the end of the t-th iteration, p ( t ) must satisfy the constraints in Equation (3). In the assignment step of ( t + 1 ) -th iteration, we evenly assign all the observations to different clusters so that E ( c ( t ) , p ) is minimized, i.e., we optimize E ( c ( t ) , p ) with respect to p under the constraints in Equation (3) to get p ( t + 1 ) . Thus we have E ( c ( t ) , p ( t + 1 ) ) E ( c ( t ) , p ( t ) ) . In the update step, the new centers are updated, which further optimize the objective function. Thus we have E ( c ( t + 1 ) , p ( t + 1 ) ) E ( c ( t ) , p ( t + 1 ) ) . The value of E monotonically decreases during the course of our algorithm, so it converges.

3.3. Time Complexity

Each iteration of the proposed algorithm consists of two steps, namely an assignment step and an update step. According to Equation (5), the update step takes O ( n ) time, where n is the number of observations. Solving the ILP in the assignment step on the other hand is relatively more difficult. Typically, to handle the general ILP shown in Equation (6), the simplex algorithm needs to be executed multiple (at most exponential) times in a branch-and-bound way. However, according to [25], if the vector b is integral and the constraint matrix A is totally unimodular (a matrix is totally unimodular if and only if the determinant of every square sub-matrix is 0, 1, or −1), the solution to the relaxed LP (without integer constraints) is guaranteed to be integral, i.e., the integer constraints can be simply removed so that the ILP can be transformed into an LP which can be efficiently solved by the simplex algorithm.
M i n i m i z e E ( l , x ) = l x T s . t . A x T = b x 0 x Z t
Theorem 1.
The constraint matrix of the ILP for the balanced assignment problem shown in Equation (3) is totally unimodular.
Proof. 
Putting Equation (3) into the form of Equation (6), we have the variables.
x = x x
x and x represent the decision variables and slack variables, respectively.
x = p 1 , 1 p 1 , 2 p 1 , k p 2 , 1 p 2 , 2 p 2 , k p n , 1 p n , 2 p n , k
x = u 1 u 2 u k v 1 v 2 v k g 1 , 1 g 1 , 2 g n , k
Correspondingly, the constraint matrix can be derived.
A = A 1 A 1 A 2 A 2 A 3 A 3 A 4 A 4
Each row of matrix A contains the coefficients for each set of constraints shown in Equation (3). ( A 1 A 1 ) are the coefficients for the first set of constraints i = 1 n p i , j + u j = n / k , 1 j k . ( A 2 A 2 ) are the coefficients for the second set of constraints i = 1 n p i , j + v j = n / k , 1 j k . ( A 3 A 3 ) are the coefficients for the third set of constraints j = 1 k p i , j = 1 , 1 i n . ( A 4 A 4 ) are the coefficients for the final set of constraints p i , j + g i , j = 1 , 1 j k , 1 i n . ( A 1 A 2 A 3 A 4 ) T and ( A 1 A 2 A 3 A 4 ) T correspond to the coefficients for the decision and slack variables, respectively.
A 1 = I k × k I k × k I k × k A 1 = I k × k 0 k × k 0 k × n k
A 2 = A 1 A 2 = 0 k × k I k × k 0 k × n k
A 3 = 1 1 1 0 0 0 0 0 0 0 0 0 1 1 1 0 0 0 0 0 0 0 0 0 1 1 1 A 3 = 0 n × 2 k 0 n × n k
A 4 = I n k × n k A 4 = 0 n k × k 0 n k × k I n k × n k
Here, I k × k is the identity matrix of size k × k . 0 k × k is the zero matrix of size k × k .
According to Lemma 4, ( A 2 A 3 ) T is a totally unimodular matrix, as every column has two non-zero entries being ± 1 , and the sum of each column equals 0.
According to Lemma 2 and Lemma 3, ( A 1 A 2 A 3 ) T is totally unimodular, because multiplying A 1 with-1 results in a duplicate of A 2 , and duplication does not affect total unimodularity.
According to Lemma 1, ( A 1 A 2 A 3 A 4 ) T is totally unimodular, because every row of A 4 contains exactly one non-zero entry which is 1. Inserting A 4 to ( A 1 A 2 A 3 ) T would still result in a totally unimodular matrix.
According to Lemma 1, A is totally unimodular, because every column of ( A 1 A 2 A 3 A 4 ) T contains exactly one non-zero entry which is 1. Inserting ( A 1 A 2 A 3 A 4 ) T to ( A 1 A 2 A 3 A 4 ) T leads to a totally unimodular matrix.
All the lemmas can be found in [26].
According to the above description, the constraint matrix A for the ILP shown in Equation (3) is a totally unimodular matrix. □
Lemma 1.
The constraint matrix A remains totally unimodular if inserting a column (row) with only one non-zero entry being ± 1 .
Lemma 2.
The constraint matrix A remains totally unimodular if multiplying a column (row) with −1.
Lemma 3.
The constraint matrix A remains totally unimodular if duplicating a column (row).
Lemma 4.
The constraint matrix A is totally unimodular if it has at most two non-zero entries being ± 1 in each column (row), and, for every column (row) with two non-zero entries, the sum of the column (row) is 0.
The constraint matrix A in our problem is totally unimodular. In addition, the vector b is integral so that the linear program shown in Equation (3) can be simply solved by the simplex algorithm. The worst time complexity of the simplex algorithm is exponential. Fortunately, the simplex algorithm is remarkably efficient in practice, and it has polynomial time complexity in the average case [27,28]. More specifically, the average time complexity of the simplex algorithm is T = β s α t d 0.33 [29]. Here, s and t are the numbers of constraints and variables in the linear program, respectively. d is the percentage of non-zero entries in the constraint matrix. α and β are the two unknowns we need to find out.
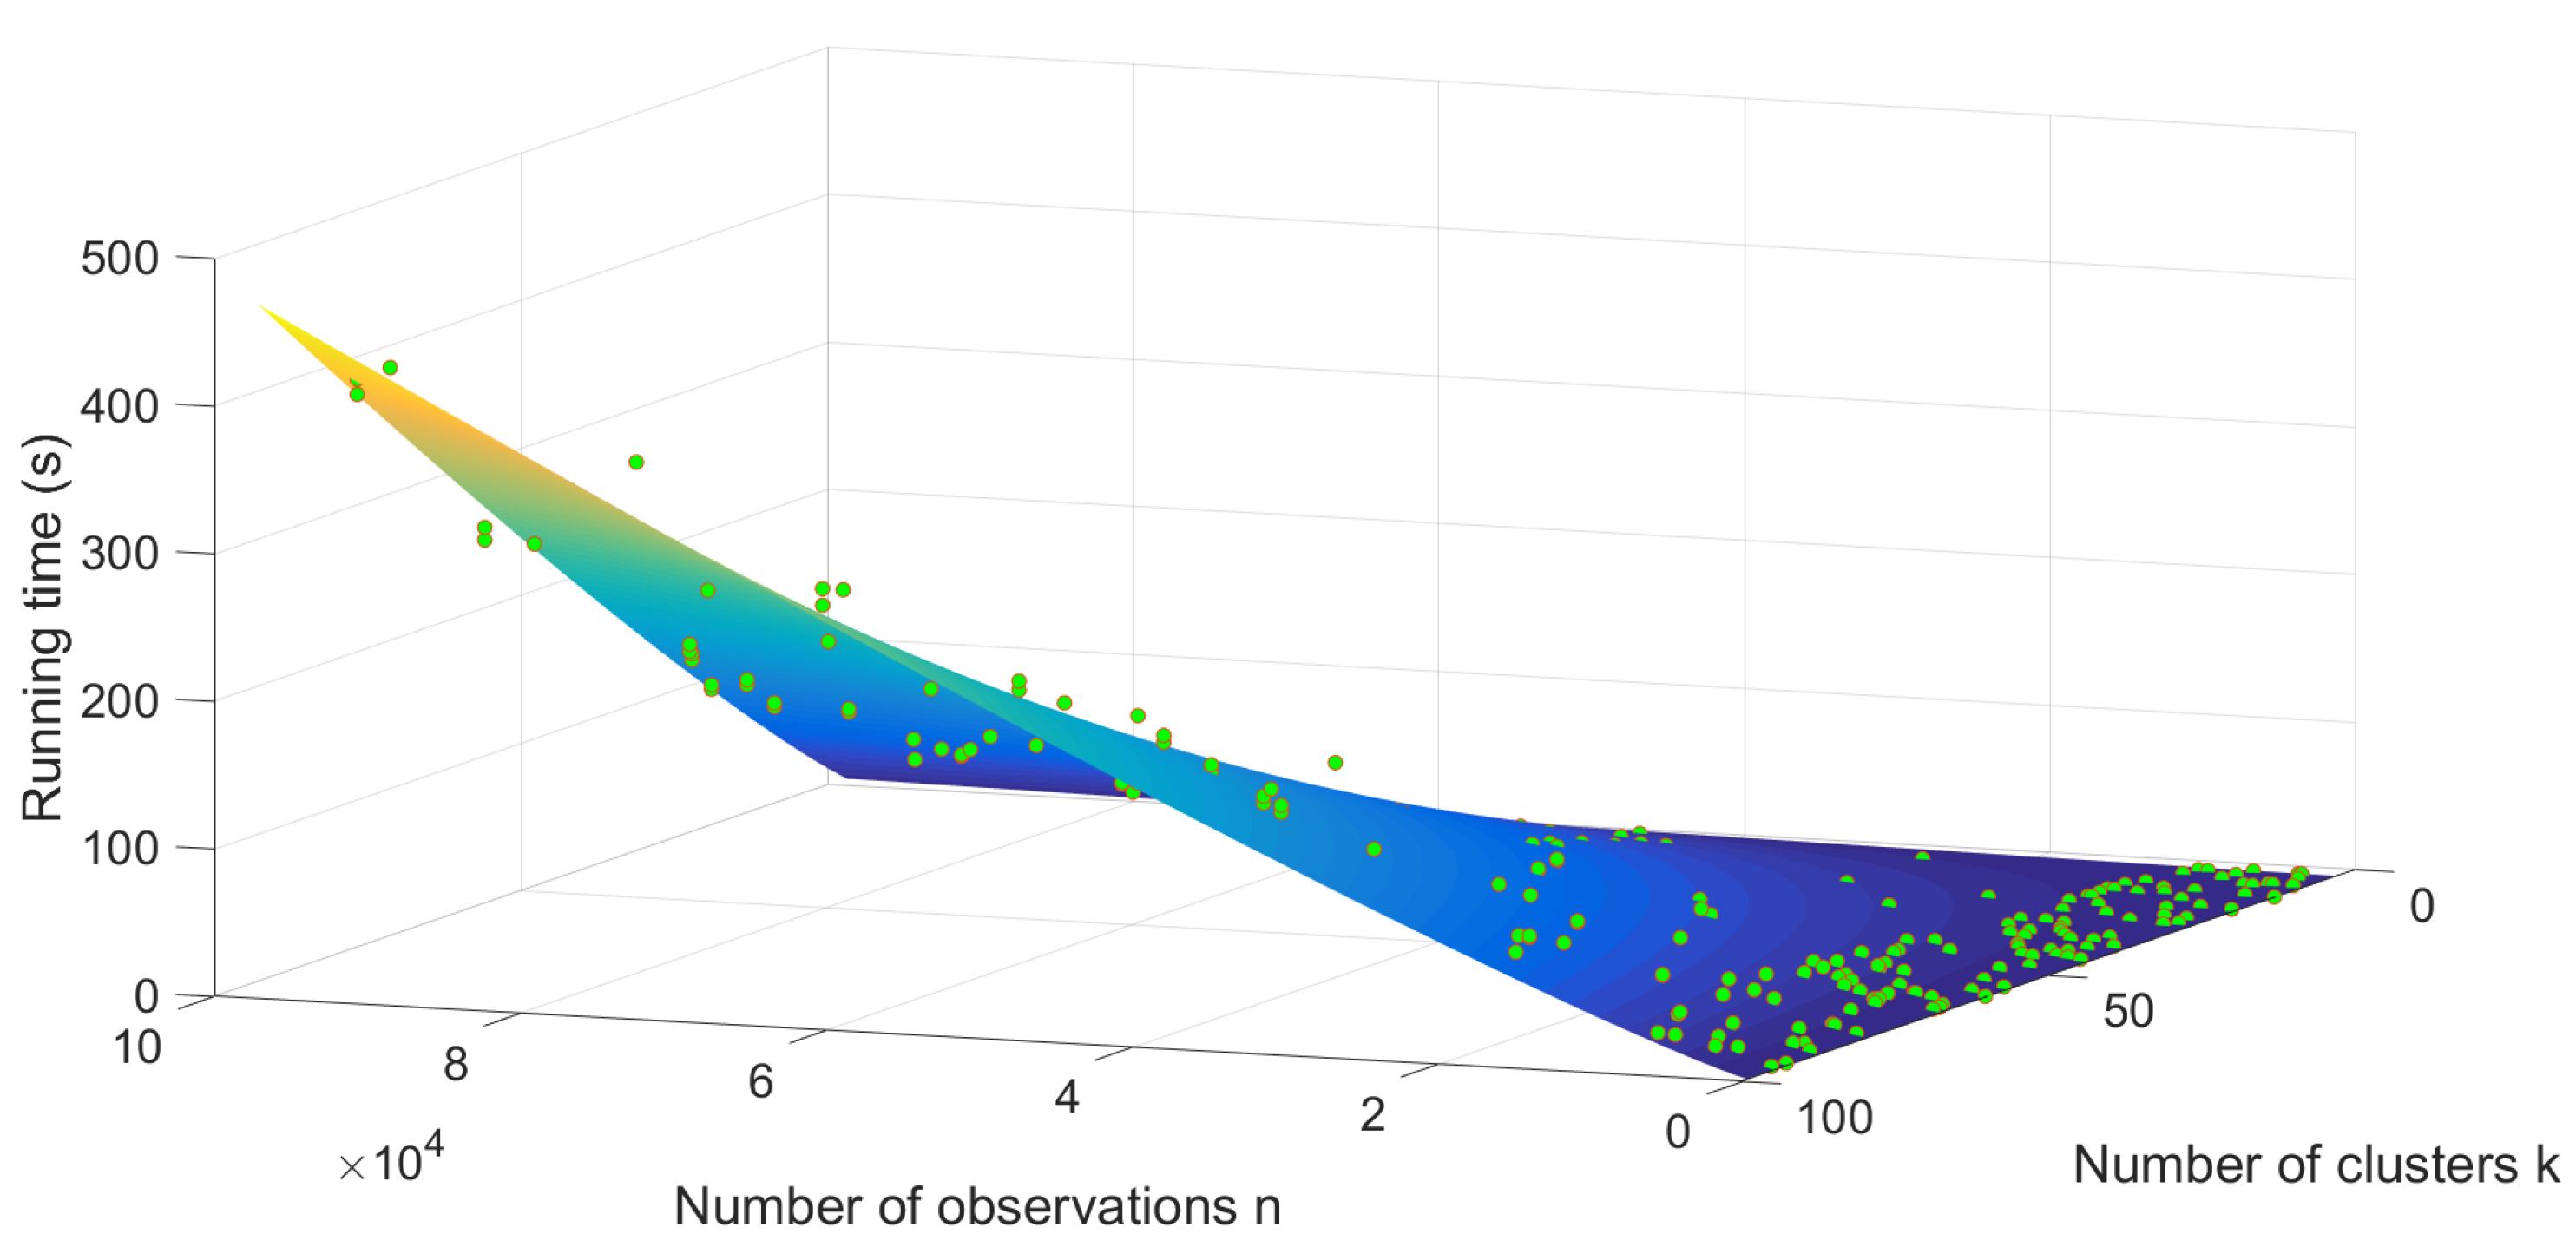
To evaluate α and β , we collected 240 different sets of data for regression of the form T / ( t d 0.33 ) = β s α . All the data are randomly generated. The number of observations n varies from 100 to 100,000. The number of clusters k varies from 3 to 100. It is found that α is in the range ( 0.43 , 0.46 ) , β is in the range ( 2.09 × 10 6 , 3.46 × 10 5 ) . The parameters related to the goodness of fit are S S E = 8.38 × 10 6 , R s q u a r e = 0.95 , A d j u s t e d R s q u a r e = 0.95 . Figure 3 illustrates the result of the regression. Furthermore, in our case, we have s = n + 2 k + n k , t = 2 n k + 2 k , and d = ( 5 n k + 2 k ) / ( s t ) . By placing everything together into T = β s α t d 0.33 , we have T = O ( ( n k ) 1.1 ) O ( ( n k ) 1.13 ) . Considering the maximum value of k is n / 2 [10], the average time complexity of each assignment step is approximately O ( n 1.65 ) O ( n 1.70 ) . Assuming that there are m iterations, the average time complexity of the balanced clustering algorithm is O ( m n 1.65 ) O ( m n 1.70 ) .

4. Experiments

4.1. Experimental Settings

In order to evaluate the performance of our proposed approach, both synthetic and real datasets are explored in our experiments. The synthetic datasets are generated from the standard uniform distribution on the interval (0, 100). The real datasets are from the UCI machine learning repository [30]. Table 1 shows the details of the datasets in our experiments.
We compare the balanced clustering performances between our proposed method and state-of-the-art methods which include the balanced clustering method presented by [9] and the size-constraint clustering method proposed in [18]. Notice that for each run, all the algorithms start with the same set of initial centers derived from the k-means++ algorithm so that the comparison is objective. In addition, since [9] and we both model each iteration as a balanced assignment problem, the performances of the balanced assignment algorithms are also compared to provide a deeper insight. Notice that the approach in [18] is not an iterative approach, so it is not included in this comparison.
For the evaluation of the balanced assignment algorithm, we consider the cost and running time (measured in seconds). For the evaluation of the balanced clustering algorithm, we record the number of iterations, MSE, and running time (measured in seconds). It should be noted that we do not record the number of iterations for the method in [18] as it is not an iterative method. Furthermore, to evaluate the stability of the clustering algorithms, the coefficient of variation for the number of iterations, MSE and running time are collected. All the metrics mentioned above are calculated and averaged over 10 runs. For the sake of compactness, we round all the metrics to two decimal places. In addition, all trailing zeros are omitted. The best results are highlighted with the bold format in all the tables.
The number of clusters for all the data in our experiments takes its value from the set of {3, 9, 21, 45, 93}. We do not choose very large cluster number, as according to the rule of thumb [10], the number of clusters k for data of size n should be less than n / 2 . For the datasets involved in our experiments, the largest number of observations is 5000, and 5000 / 2 = 50 so that the range of k is enough for us to evaluate the clustering algorithm.
All the algorithms involved in this paper are implemented in MATLAB which ran on an Intel i7-7700HQ 2.8 GHz processor with 16 GB memory. The code can be downloaded from https://github.com/IGGIUJS/BalancedClustering.

4.2. Experimental Results

4.2.1. Balanced Assignment

From Table 2 and Table 3, we can observe two differences. (1) Although occasionally the assignment method in [9] produces equal cost, more frequently, the proposed method achieves a better cost for the balanced assignment problem. (2) Our proposed assignment method takes much less time than the method in [9].

4.2.2. Balanced Clustering

From Table 4 and Table 5, we can observe three differences. (1) Compared with the method in [18], the proposed method achieves much lower MSE with bearable loss of efficiency. (2) Compared with the method in [9], the proposed method leads to a better MSE, while at the same time, it is much faster. (3) The proposed method generally converges with fewer iterations than the method in [9].
The coefficient of variation (C.V. = standard deviation/mean) is explored to evaluate the stability of the proposed algorithm. From Table 6 and Table 7, we can observe two differences. (1) Our method is as stable as the method in [9]. In fact, the standard deviations of these measures in our method are mostly lower than that in the method of [9], and the means of these measures in our method are even lower (better). (2) Compared with the method in [18], the running time of the proposed method is less stable while the MSE is more stable.

5. Discussion

As we can see in Table 4 and Table 5, in most cases, our method produces a lower MSE than the method based on the Hungarian algorithm [9]. However, there are situations when the method in [9] achieves equal or even better MSE, such as the cases when dividing the dataset R2 into 3 clusters, dividing the dataset Iris into 3 clusters, and dividing R5 into 45 clusters. There are two main reasons for this. (1) When the number of observations n is divisible by the number of clusters k, the Hungarian algorithm is more likely to get the same result as our assignment method and this will lead to an equal MSE. (2) From Table 2 and Table 3, we can see that the proposed method always produces a balanced assignment with equal or lower cost. However, it is an iterative method and does not always converge to the global optimum.
When the number of observations n is not divisible by the number of clusters k, the sizes of clusters vary from n / k to n / k . The proposed method could adaptively determine the size of each cluster during the process of optimization, while for the method based on the Hungarian algorithm, the sizes of clusters must be pre-settled. The awkward situation is that it is not known which clusters should have size n / k , and which clusters should have size n / k in advance. Thus, theoretically, in each assignment step, the Hungarian algorithm needs to be executed C n % k n times in order to get the optimal assignment, where % is the modulus operator.
Our proposed method is suitable for applications which impose upper and (or) lower bounds on the sizes of clusters. The balanced size-constraint clustering in this paper is actually a special case when the upper bounds are n / k and the lower bounds are n / k . It is straightforward to see that the constraint matrix is totally unimodular when there are both upper bounds and lower bounds on the sizes of clusters. In situations when only upper (lower) bounds are available, the constraint matrix would still be totally unimodular. We will skip the proof here, as it is similar to the proof to Theorem 1.

6. Conclusions

In this paper, we propose a novel approach to address the issue of balanced clustering which has many applications in practice. Each iteration of the proposed algorithm consists of two steps, namely an assignment step and an update step. In the assignment step, observations are evenly assigned to different clusters, and the problem is modeled as an ILP. We prove that the constraint matrix of the ILP is totally unimodular so that the ILP can be efficiently solved with the simplex algorithm. In the update step, the new centers are updated as the centroids of the observations in the clusters. The regression result suggests that the average time complexity of the proposed method is O ( m n 1.65 ) O ( m n 1.70 ) , which is much faster than the O ( m n 3 ) method based on the Hungarian algorithm. Experiments on both synthetic and real data validate that the proposed method achieves both high quality and efficiency in the task of clustering with balanced size constraints.
There are several issues we can consider in our future work. For instance, the proposed method could be adapted into a general size-constraint clustering algorithm, and the clustering accuracy could be evaluated. Moreover, the proposed algorithm is a variant of the k-means algorithm. The hard size constraints are incorporated into the objective function of the k-means algorithm. Similarly, the hard constraints could be applied to other clustering algorithms, such as spectral clustering. Furthermore, in addition to the cluster-level constraints considered in this paper, instance-level constraints could be studied. For example, the observations o i and o j must (or must not) be in the same cluster. Finally, it is interesting to investigate the applications of the proposed method.

Author Contributions

Conceptualization, Y.Y. and W.T.; methodology, Y.Y., W.T. and L.Z.; writing original draft preparation, W.T. and Y.Y.; writing-review and editing, L.Z. and Y.Z.; supervision, Y.Z.; funding acquisition, Y.Y. and W.T.

Funding

This work was supported by the National Natural Science Foundation of China (Grant No. 61402205), China Postdoctoral Science Foundation (Grant No. 2015M571688), and Postgraduate Research & Practice Innovation Program of Jiangsu Province (Grant No. KYCX18_2258).

Acknowledgments

The authors are deeply thankful to the editors and reviews for their valuable suggestions to improve the quality of this manuscript.

Conflicts of Interest

We declare that we have no conflict of interests. And this article does not contain any studies with human participants or animals performed by any of the authors.

References

  1. Xu, R.; Wunsch, D.C. Survey of clustering algorithms. IEEE Trans. Neural Netw. 2005, 16, 645–678. [Google Scholar] [CrossRef] [PubMed]
  2. Yang, Y.; Padmanabhan, B. Segmenting customer transactions using a pattern-based clustering approach. In Proceedings of the International Conference on Data Mining, Melbourne, FL, USA, 19–22 November 2003; pp. 411–418. [Google Scholar]
  3. Liao, Y.; Qi, H.; Li, W. Load-Balanced Clustering Algorithm with Distributed Self-Organization for Wireless Sensor Networks. IEEE Sens. J. 2013, 13, 1498–1506. [Google Scholar] [CrossRef]
  4. Hagen, L.; Kahng, A. Fast spectral methods for ratio cut partitioning and clustering. In Proceedings of the IEEE International Conference on Computer-Aided Design, Santa Clara, CA, USA, 11–14 November 1991; pp. 10–13. [Google Scholar]
  5. Issal, C.; Ebbesson, M. Document Clustering. IEEE Swarm Intel. Symp. 2010, 38, 185–191. [Google Scholar]
  6. Dengel, A.; Althoff, T.; Ulges, A. Balanced Clustering for Content-Based Image Browsing. Gi-Informatiktage 2008, 27–30. [Google Scholar]
  7. Banerjee, A.; Ghosh, J. Frequency-sensitive competitive learning for scalable balanced clustering on high-dimensional hyperspheres. IEEE Trans. Neural Netw. 2004, 15, 702–719. [Google Scholar] [CrossRef] [PubMed]
  8. Koberstein, A. Progress in the dual simplex algorithm for solving large scale LP problems: techniques for a fast and stable implementation. Comput. Optim. Appl. 2008, 41, 185–204. [Google Scholar] [CrossRef]
  9. Malinen, M.I.; Fränti, P. Balanced k-means for Clustering. In Proceedings of the Joint IAPR International Workshops on Statistical Techniques in Pattern Recognition (SPR) and Structural and Syntactic Pattern Recognition (SSPR), Joensuu, Finland, 20–22 August 2014; pp. 32–41. [Google Scholar]
  10. Mardia, K.V.; Kent, J.T.; Bibby, J.M. Multivariate analysis. Math. Gazette 1979, 37, 123–131. [Google Scholar]
  11. Grossi, V.; Romei, A.; Turini, F. Survey on using constraints in data mining. Data Mining Knowl. Discov. 2017, 31, 424–464. [Google Scholar] [CrossRef]
  12. Banerjee, A.; Ghosh, J. Scalable Clustering Algorithms with Balancing Constraints. Data Mining Knowl. Discov. 2006, 13, 365–395. [Google Scholar] [CrossRef]
  13. Luxburg, U.V. A tutorial on spectral clustering. Stat. Comput. 2007, 17, 395–416. [Google Scholar] [CrossRef]
  14. Chen, Y.; Zhang, Y.; Ji, X. Size Regularized Cut for Data Clustering. In Proceedings of the Advances in Neural Information Processing Systems 18, Vancouver, BC, Canada, 5–8 December 2005; pp. 211–218. [Google Scholar]
  15. Shi, J.; Malik, J. Normalized cuts and image segmentation. IEEE Trans. Pattern Anal. Mach. Intell. 1997, 22, 888–905. [Google Scholar]
  16. Kawahara, Y.; Nagano, K.; Okamoto, Y. Submodular fractional programming for balanced clustering. Pattern Recognit. Lett. 2011, 32, 235–243. [Google Scholar] [CrossRef]
  17. Chang, X.; Nie, F.; Ma, Z.; Yang, Y. Balanced k-means and Min-Cut Clustering. arXiv. 2014. Available online: https://arxiv.org/abs/1411.6235 (accessed on 5 March 2019).
  18. Zhu, S.; Wang, D.; Li, T. Data clustering with size constraints. Knowl.-Based Syst. 2010, 23, 883–889. [Google Scholar] [CrossRef]
  19. He, R.; Xu, W.; Sun, J.; Zu, B. Balanced k-means Algorithm for Partitioning Areas in Large-Scale Vehicle Routing Problem. In Proceedings of the International Symposium on Intelligent Information Technology Application, Nanchang, China, 21–22 November 2009; pp. 87–90. [Google Scholar]
  20. Tai, C.L.; Wang, C.S. Balanced k-means. In Intelligent Information and Database Systems; Nguyen, N.T., Tojo, S., Nguyen, L.M., Trawiński, B., Eds.; Springer International Publishing: Cham, Switzerland, 2017; pp. 75–82. [Google Scholar]
  21. Bennett, K.; Bradley, P.; Demiriz, A. Constrained k-Means Clustering; Technical Report; Microsoft Research: Redmond, WA, USA, 2000. [Google Scholar]
  22. Yuepeng, S.; Min, L.; Cheng, W. A Modified k-means Algorithm for Clustering Problem with Balancing Constraints. In Proceedings of the International Conference on Measuring Technology and Mechatronics Automation, Shanghai, China, 6–7 January 2011; pp. 127–130. [Google Scholar]
  23. Ganganath, N.; Cheng, C.T.; Chi, K.T. Data Clustering with Cluster Size Constraints Using a Modified k-means Algorithm. In Proceedings of the International Conference on Cyber-Enabled Distributed Computing and Knowledge Discovery, Shanghai, China, 13–15 October 2014; pp. 158–161. [Google Scholar]
  24. Arthur, D.; Vassilvitskii, S. k-means++: The advantages of careful seeding. In Proceedings of the Eighteenth ACM-SIAM Symposium on Discrete Algorithms, New Orleans, LA, USA, 7–9 January 2007; pp. 1027–1035. [Google Scholar]
  25. Papadimitriou, C.H.; Steiglitz, K. Combinatorial Optimization: Algorithms and Complexity; Prentice Hall: Mineola, NY, USA, 1998. [Google Scholar]
  26. Schrijver, A. Theory of Linear and Integer Programming; John Wiley & Sons, Inc.: Hoboken, NJ, USA, 1986. [Google Scholar]
  27. Spielman, D.A.; Teng, S. Smoothed analysis of algorithms: why the simplex algorithm usually takes polynomial time. J. ACM 2004, 51, 385–463. [Google Scholar] [CrossRef]
  28. Borgwardt, K.H. The Simplex Method: A Probabilistic Analysis; Springer Science & Business Media: Berlin/Heidelberg, Germany, 1987. [Google Scholar]
  29. Fang, S.C.; Puthenpura, S. Linear Optimization and Extensions: Theory and Algorithms; Prentice-Hall: Upper Saddle River, NJ, USA, 1993. [Google Scholar]
  30. Dheeru, D.; Taniskidou, E.K. UCI Machine Learning Repository; University of California: Irvine, CA, USA, 2019. [Google Scholar]
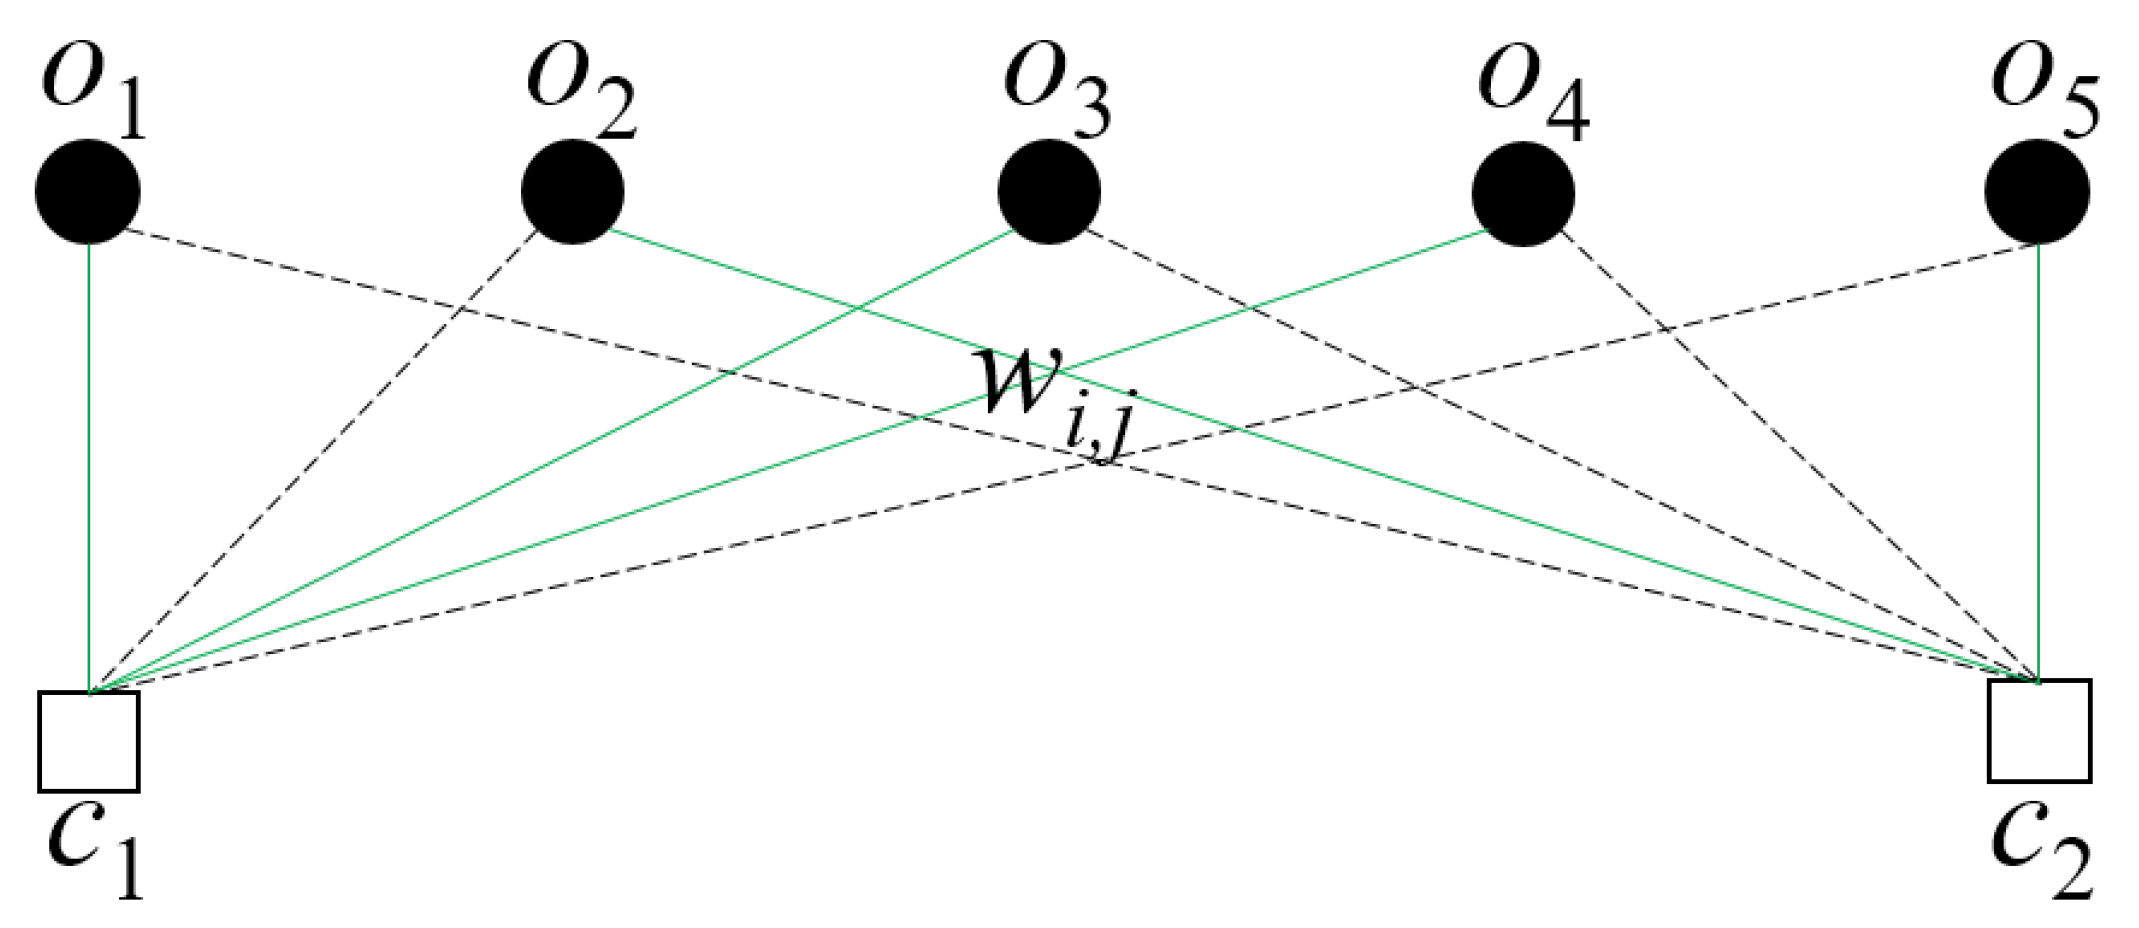
Figure 1. The bipartite graph (the green solid lines indicate a possible solution).
Symmetry 11 00338 g001
Figure 2. An example of our proposed method: (a) The data points. (b) The result after the first iteration. (c) The result after the second iteration. (d) The result after the last iteration.
Symmetry 11 00338 g002
Figure 3. The result of the regression.
Symmetry 11 00338 g003
Table 1. A brief summary of experimental datasets.
CategoryDataSizeDimension
RandomR12002
R26002
R310002
R420002
R550002
RealIris1504
Wine17814
Thyroid2155
Hill Valley (HV)606100
Anuran Calls Subset (ACS)150022
Table 2. Cost and running time for balanced assignment (synthetic data).
DataKCost
Ours/BK 1
Time
Ours/BK 1
R132.87/2.88 ( 10 5 ) 0.37/0.21
91.11/1.12 ( 10 5 ) 0.02/0.11
214.76/5.10 ( 10 4 ) 0.03/0.1
452.52/3.17 ( 10 4 ) 0.03/0.13
939.23/13.25 ( 10 3 ) 0.07/0.11
R231.15/1.15 ( 10 6 ) 0.02/14.54
94.22/4.25 ( 10 5 ) 0.03/3.19
211.84/1.9 ( 10 5 ) 0.05/1.94
458.01/8.66 ( 10 4 ) 0.09/1.35
933.66/4.6 ( 10 4 ) 0.17/1.26
R331.6/1.6 ( 10 6 ) 0.05/84.7
95.92/5.94 ( 10 5 ) 0.04/14.95
212.55/2.6 ( 10 5 ) 0.08/6.77
451.7/1.77 ( 10 5 ) 0.18/6.01
935.92/6.4 ( 10 4 ) 0.41/4.58
R432.86/2.86 ( 10 6 ) 0.14/1081.9
91.23/1.23 ( 10 6 ) 0.12/151.8
216.53/6.58 ( 10 5 ) 0.2/79.91
454.27/4.38 ( 10 5 ) 0.47/48.86
931.4/1.48 ( 10 5 ) 1.19/29.07
R536.81/6.81 ( 10 6 ) 0.68/59946
92.93/2.93 ( 10 6 ) 0.43/7582.1
211.52/1.53 ( 10 6 ) 0.75/2618.4
456.82/6.85 ( 10 5 ) 1.78/786.55
934.67/4.76 ( 10 5 ) 4.91/620.3
1 The method in [9].
Table 3. Cost and running time for balanced assignment (real data).
DataKCost
Ours/BK 1
Time
Ours/BK 1
Iris34.95/4.95 ( 10 14 ) 0.01/0.08
92.28/2.34 ( 10 14 ) 0.02/0.06
211.31/1.45 ( 10 14 ) 0.03/0.07
455.11/8.85 ( 10 13 ) 0.03/0.07
931.16/3.92 ( 10 13 ) 0.05/0.06
Wine35.12/5.13 ( 10 11 ) 0.02/0.13
93.74/3.75 ( 10 11 ) 0.02/0.1
212.45/2.54 ( 10 11 ) 0.04/0.1
451.68/1.71 ( 10 11 ) 0.04/0.15
938.62/10 ( 10 10 ) 0.06/0.08
Thyroid31.31/1.32 ( 10 15 ) 0.02/0.43
98.75/8.86 ( 10 14 ) 0.02/0.17
214.79/4.91 ( 10 14 ) 0.03/0.16
452.31/2.73 ( 10 14 ) 0.04/0.15
931.03/1.3 ( 10 14 ) 0.07/0.13
HV32.77/2.77 ( 10 13 ) 0.02/3.57
91.4/1.41 ( 10 13 ) 0.04/2.78
211.15/1.2 ( 10 13 ) 0.07/2.72
453.66/4.01 ( 10 12 ) 0.11/3.9
931.63/1.89 ( 10 12 ) 0.22/4.27
ACS31.31/1.31 ( 10 3 ) 0.04/198.75
9654.78/656.540.08/36.16
21478.67/4820.13/32.07
45299.23/307.210.25/41.05
93212.48/221.010.7/64.48
1 The method in [9].
Table 4. Mean squared error (MSE), running time, and iteration count for balanced clustering (synthetic data).
DataKMSE
Ours/BK 1 /BSCK 2
Time
Ours/BK 1 /BSCK 2
Iterations
Ours/BK 1
R13629.81/630.97/794.710.2/0.57/0.065.6/6.3
9168.88/169.1/440.240.11/0.53/0.035/6.1
2171.7/74.71/791.170.17/0.58/0.044.4/5.7
4528.13/31.9/711.570.24/0.51/0.063.2/4.8
939.93/12.64/669.440.36/0.35/0.122/3
R23645.78/645.78/721.070.13/5.69/0.034.1/5.1
9183.54/180.61/382.930.83/12.73/0.0611.3/16
2178.29/78.48/422.431.06/7.42/0.136.7/8.3
4534.06/34.68/492.251.81/7.74/0.295.5/7.6
9314.86/15.71/594.63.62/7.88/0.655.1/6.5
R33635.91/636.01/710.531.24/62.07/0.069.7/10.3
9190.61/190.67/382.461.64/26.72/0.137.4/8.8
2178.08/78.17/416.132.93/30.18/0.318.1/11.2
4535.26/35.6/437.297.62/34.15/0.7510.4/9.6
9315.9/16.28/459.4313.2/40.71/1.668.3/9.2
R43664.25/664.3/807.322.32/783.43/0.219/9.5
9190.78/190.86/343.394.68/223.61/0.5515.1/12.9
2179.59/79.8/376.084.81/210.67/1.2715.2/14.2
4534.82/34.92/360.018.5/272.93/2.8916.6/17
9316.65/16.76/443.8915.01/318.73/7.8313.6/13.2
R53664.54/664.58/800.0422.32/67500/0.3712.8/11.8
9184.39/184.40/283.197.88/1900/0.427.9/7.7
2179.84/79.84/252.6649.95/3100/1.3717.7/20
4536.53/36.45/366.7690.64/5100/5.3826.3/30.2
9317.32/17.37/327.9188.69/5100/22.9519.7/20.9
1 The method in [9]. 2 The method in [18].
Table 5. MSE, running time, and iteration count for balanced clustering (real data).
DataKMSE
Ours/BK 1 /BSCK 2
Time
Ours/BK 1 /BSCK 2
Iterations
Ours/BK 1
Iris39.35/9.35/23.5 ( 10 11 ) 0.03/0.15/0.011.6/2.6
94.08/4.2/28.3 ( 10 11 ) 0.11/0.36/0.026.2/6.1
212.18/2.32/25.4 ( 10 11 ) 0.15/0.37/0.035.2/5.9
451.09/1.26/26.6 ( 10 11 ) 0.17/0.29/0.043/4.1
936.07/19.4/212 ( 10 10 ) 0.18/0.41/0.091/4.9
Wine31.25/1.25/1.36 ( 10 9 ) 0.03/0.17/0.011/2.2
99.14/9.10/18.4 ( 10 8 )0.11/0.6/0.025.5/7.6
216.77/6.83/18.6 ( 10 8 ) 0.16/0.42/0.034.6/4.8
454.66/4.72/18.6 ( 10 8 ) 0.16/0.3/0.052/2.7
933.23/3.18/14 ( 10 8 ) 0.33/0.33/0.111.9/3.1
Thyroid33.46/3.47/11.9 ( 10 12 ) 0.1/2.71/0.026.2/7.6
91.88/1.89/16 ( 10 12 ) 0.12/1.48/0.025.3/7.6
219.15/9.46/106 ( 10 11 ) 0.24/1.16/0.046.1/6.4
453.97/4.35/86 ( 10 11 ) 0.31/1.02/0.073.6/4.8
931.94/2.35/55.3 ( 10 11 ) 0.48/0.81/0.132.5/4.4
HV32.75/2.75/24.89 ( 10 10 ) 0.21/13.56/0.112/2
98.44/8.5/349.29 ( 10 9 ) 0.12/8.16/0.062/2.3
212.04/2.18/359.52 ( 10 9 ) 0.25/12.49/0.123.4/3.1
456.59/6.98/3203.1 ( 10 8 ) 0.65/20.54/0.254.3/4.4
932.43/2.94/2449.2 ( 10 8 ) 1.57/32.64/0.544.9/5.3
ACS30.31/0.31/0.510.35/1008.9/0.077/7
90.14/0.14/0.471.11/268.08/0.1412.2/11.3
210.08/0.08/0.542.9/259.55/0.4217.6/13.6
450.06/0.06/0.544.56/287.23/114.6/14.7
930.04/0.05/0.549.71/265.17/3.2711/12
1 The method in [9]. 2 The method in [18].
Table 6. Coefficient of variation for MSE, running time, and iteration count (synthetic data).
DataKMSE C.V.
Ours/BK 1 /BSCK 2
Time C.V.
Ours/BK 1 /BSCK 2
Iterations C.V.
Ours/BK 1
R130.03/0.03/0.071.57/0.77/2.430.95/0.8
90.04/0.04/0.390.49/0.55/0.590.57/0.53
210.04/0.05/0.240.28/0.38/0.280.33/0.41
450.08/0.07/0.120.22/0.27/0.040.29/0.27
930.1/0.11/0.180.03/0.11/0.050/0.16
R230.03/0.03/0.050.76/0.63/0.070.94/0.75
90.06/0.04/0.330.63/0.78/0.030.68/0.77
210.03/0.02/0.170.36/0.24/0.030.42/0.23
450.05/0.03/0.130.24/0.4/0.050.27/0.47
930.03/0.03/0.110.23/0.28/0.050.28/0.29
R330/0/0.040.29/0.29/0.050.32/0.3
90.03/0.03/0.110.78/0.62/0.040.87/0.61
210.02/0.02/0.170.41/0.53/0.050.47/0.55
450.03/0.01/0.230.21/0.19/0.080.23/0.16
930.02/0.02/0.10.38/0.21/0.050.43/0.26
R430.01/0.01/0.041.52/1.51/0.051.55/1.52
90/0/0.110.78/0.95/0.050.82/0.88
210.01/0.01/0.210.58/0.41/0.050.59/0.43
450.03/0.03/0.190.4/0.32/0.070.38/0.34
930.01/0.01/0.170.22/0.24/0.050.23/0.3
R530.01/0.01/0.040.98/1.07/10.99/1.12
90.01/0.01/0.110.45/0.34/0.350.45/0.4
210.01/0.01/0.160.52/0.57/0.290.51/0.52
450.02/0.01/0.220.35/0.23/0.270.33/0.23
930.01/0.01/0.210.14/0.24/0.220.14/0.25
1 The method in [9]. 2 The method in [18].
Table 7. Coefficient of variation for MSE, running time, and iteration count (real data).
DataKMSE C.V.
Ours/BK 1 /BSCK 2
Time C.V.
Ours/BK 2 /BSCK 2
Iterations C.V.
Ours/BK 1
Iris30/0/0.890.37/0.7/0.070.6/0.37
90.03/0.04/0.330.51/0.44/0.060.6/0.45
210.03/0.07/0.260.24/0.25/0.050.31/0.27
450.07/0.17/0.180.2/0.17/0.040.27/0.18
930.4/0.09/0.120.02/0.17/0.030/0.2
Wine30/0/0.020.03/0.22/0.110/0.19
90.03/0.02/0.150.29/0.35/0.050.36/0.33
210.03/0.02/0.180.36/0.24/0.090.45/0.26
450.04/0.03/0.130.24/0.22/0.030.33/0.31
930.07/0.05/0.090.32/0.13/0.110.39/0.1
Thyroid30/0/0.370.07/0.09/0.050.07/0.07
90.09/0.09/0.180.31/0.35/0.060.37/0.27
210.01/0.01/0.20.24/0.13/0.060.25/0.13
450.03/0.03/0.120.11/0.11/0.130.14/0.13
930.07/0.08/0.060.21/0.12/0.040.28/0.29
HV30/0/0.062.61/0.02/2.370/0
90/0.01/0.251.08/0.07/0.350/0.21
210/0.03/0.160.15/0.08/0.110.15/0.1
450/0.04/0.10.19/0.09/0.120.11/0.12
930.06/0.09/0.020.07/0.06/0.110.12/0.13
ACS30/0/0.040.96/0.03/0.980/0
90.02/0.02/0.280.4/0.33/0.250.43/0.48
210.01/0.01/0.210.3/0.29/0.240.31/0.26
450.01/0.02/0.190.2/0.3/0.190.19/0.31
930.01/0.01/0.040.15/0.15/0.080.15/0.19
1 The method in [9]. 2 The method in [18].