3.1. Matching Model of Inertia and Torsional Stiffness of the DMF under the Idling Condition
The rotational speed of the engine under the idling condition is relatively low, usually around 800 r/min. For four stroke engines, the first order modal resonance under the 0.5th, 1st, 1.5th, and 2nd harmonic excitations will occur in this range of speed. In theory, the DMF can reduce the 1st natural frequency of the idling condition to be lower than the frequency corresponding to the idling speed by adjustment the inertias of the primary and secondary flywheels and torsional stiffness. However, in practice, many factors may influence the matching of the inertias of the DMF, such as the installation space, the dynamic load bearing capacity of the engine crankshaft, and the transmission shifting impact. Since the change interval of the inertias is limited, the natural frequency under the idling condition may be higher than the frequency corresponding to the idling speed. Therefore, two situations should be considered:
- (1)
When the 1st order modal resonance speed of the power transmission is lower than the idling speed, the 0.5th and 1st harmonic resonances should be avoided. In this case, we should compare the vector sums of the relative amplitudes of the 0.5th and the 1st harmonic orders to determine the main harmonic excitations that should be avoided.
- (2)
When the 1st order modal resonance speed of the power transmission is higher than the idling speed, the 1st, 1.5th, and 2nd harmonic resonances should be avoided. Under the idling condition, since nodes of the 1st order modal shape will not exist in the engine blocks, the main harmonic order will be the 2nd one for four-cylinder engines. In this instance, the 2nd order harmonic torsional vibration should be avoided.
Let the 1st order natural frequency be
f, the resonance and the idling speed be
and
, respectively, the harmonic order be I, and the resonance speed zone be
, where
. According to
vibration attenuation theories, the resonance speed zone,
, will be from
to
, that is,
[
20]. We will discuss the two cases respectively.
(1)
,
. In this case,
f should meet the following requirements:
For the 0.5th order harmonic excitation, the natural frequency is relatively low. Two situations will occur when using Equation (21) to design the natural frequency. Firstly, the torsional stiffness at the idling condition is so low that the torsional stiffness at driving conditions will be exclusively high. Thus, resonances will occur under driving conditions. Secondly, the engine starts at an instant speed of about 200 r/min, which will cause start-up resonance and difficulties in starting. Therefore, only Equation (22) will be available.
For the 1st order harmonic excitation, the 1.5th and 2nd order resonances will occur when using Equation (22) to design the natural frequency. Therefore, only Equation (21) will be available in this situation.
In a word, the natural frequency under the idling condition will be:
At the 1st mode, when the vector sum of the relative amplitude of the 0.5th harmonic is larger than that of the 1st harmonic, it is assumed that the resonance speed zone is
. Thus,
should satisfy Equation (24):
According to Equation (24), that is,
, so
can be valued at 0.7. Therefore,
can be calculated by:
At the 1st mode, when the vector sum of the relative amplitude of the 1st harmonic is larger than that of the 0.5th harmonic, it is assumed that the resonance speed zone is
. Thus,
should satisfy Equation (26):
According to Equation (26), that is,
, so
can be valued at
. Therefore,
can be calculated by:
(2) , .
Similarly, for each order harmonic excitation,
should also satisfy Equations (21) and (22), which can be expressed as:
In fact,
cannot satisfy Equation (28). Under such a circumstance, resonances under the 1st and 2nd order harmonic excitations can only be considered. Furthermore, since the 2nd order harmonic is the main one for the four-cylinder engine,
should firstly satisfy Equation (29), and then satisfy the Equation (30):
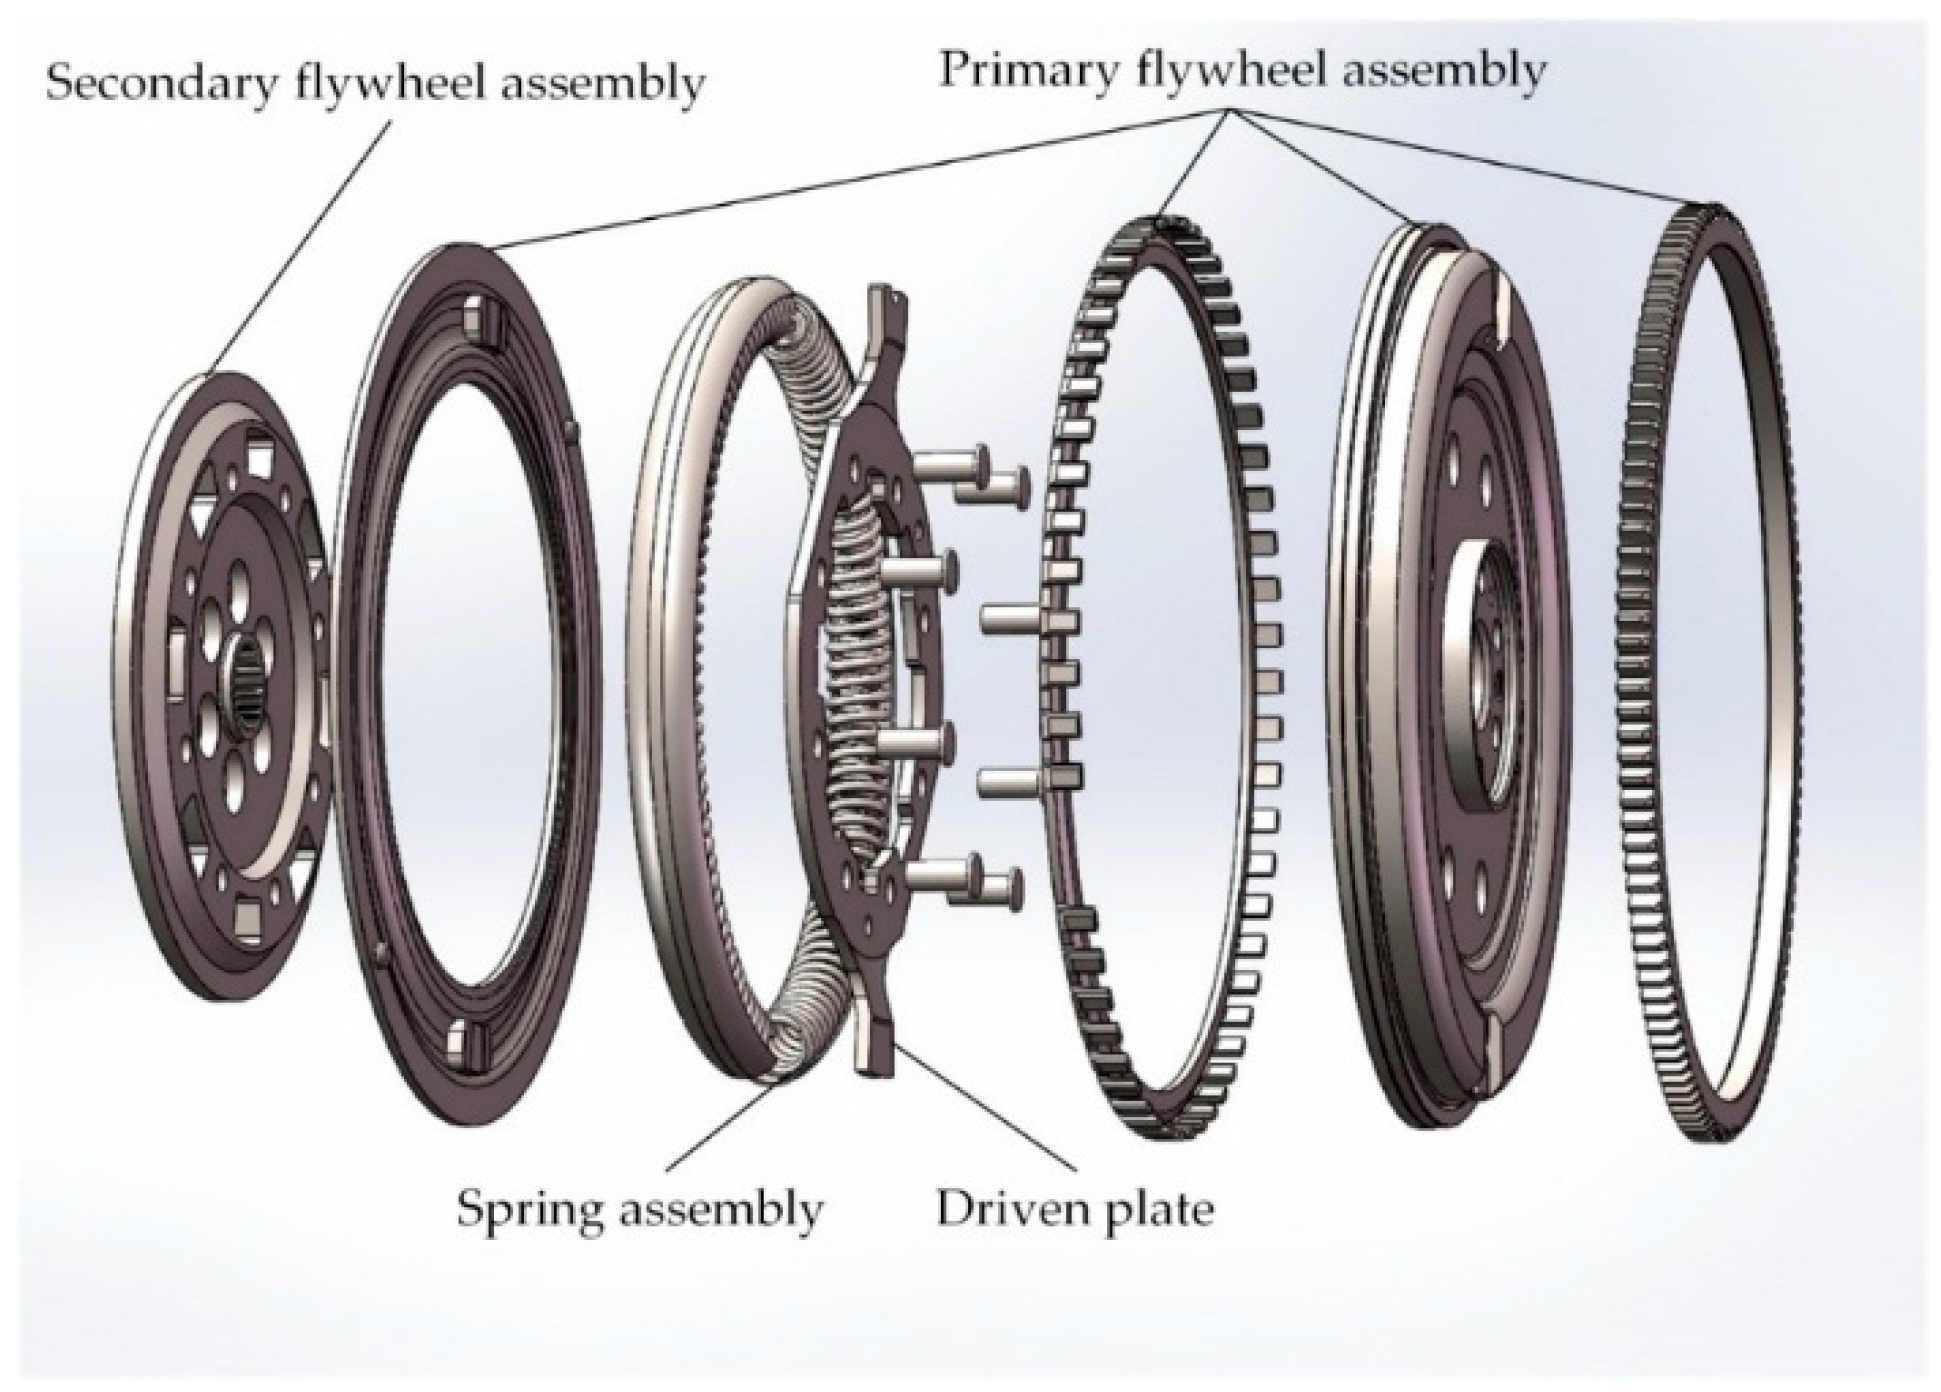
In summary, the 1st order natural frequency should be lower than the frequency corresponding to the idling speed as much as possible. Otherwise, the 1.5th order resonance will not be avoided. It is assumed that the inertias of the primary and secondary flywheel assembly are
and
, respectively, and the inertia of the single mass flywheel matched to the engine is
.
is provide by the engine manufacturer, and will usually be within a certain range; that is,
. Thus,
. Furthermore, the inertia ratio of the primary and secondary flywheel assembly can be obtained by the constraints of the inertias, the masses, and the installation spaces of the primary and secondary flywheel assembly. The inertia ratio can be expressed as
and
. With initial conditions, the initial values of
and
can be determined by:
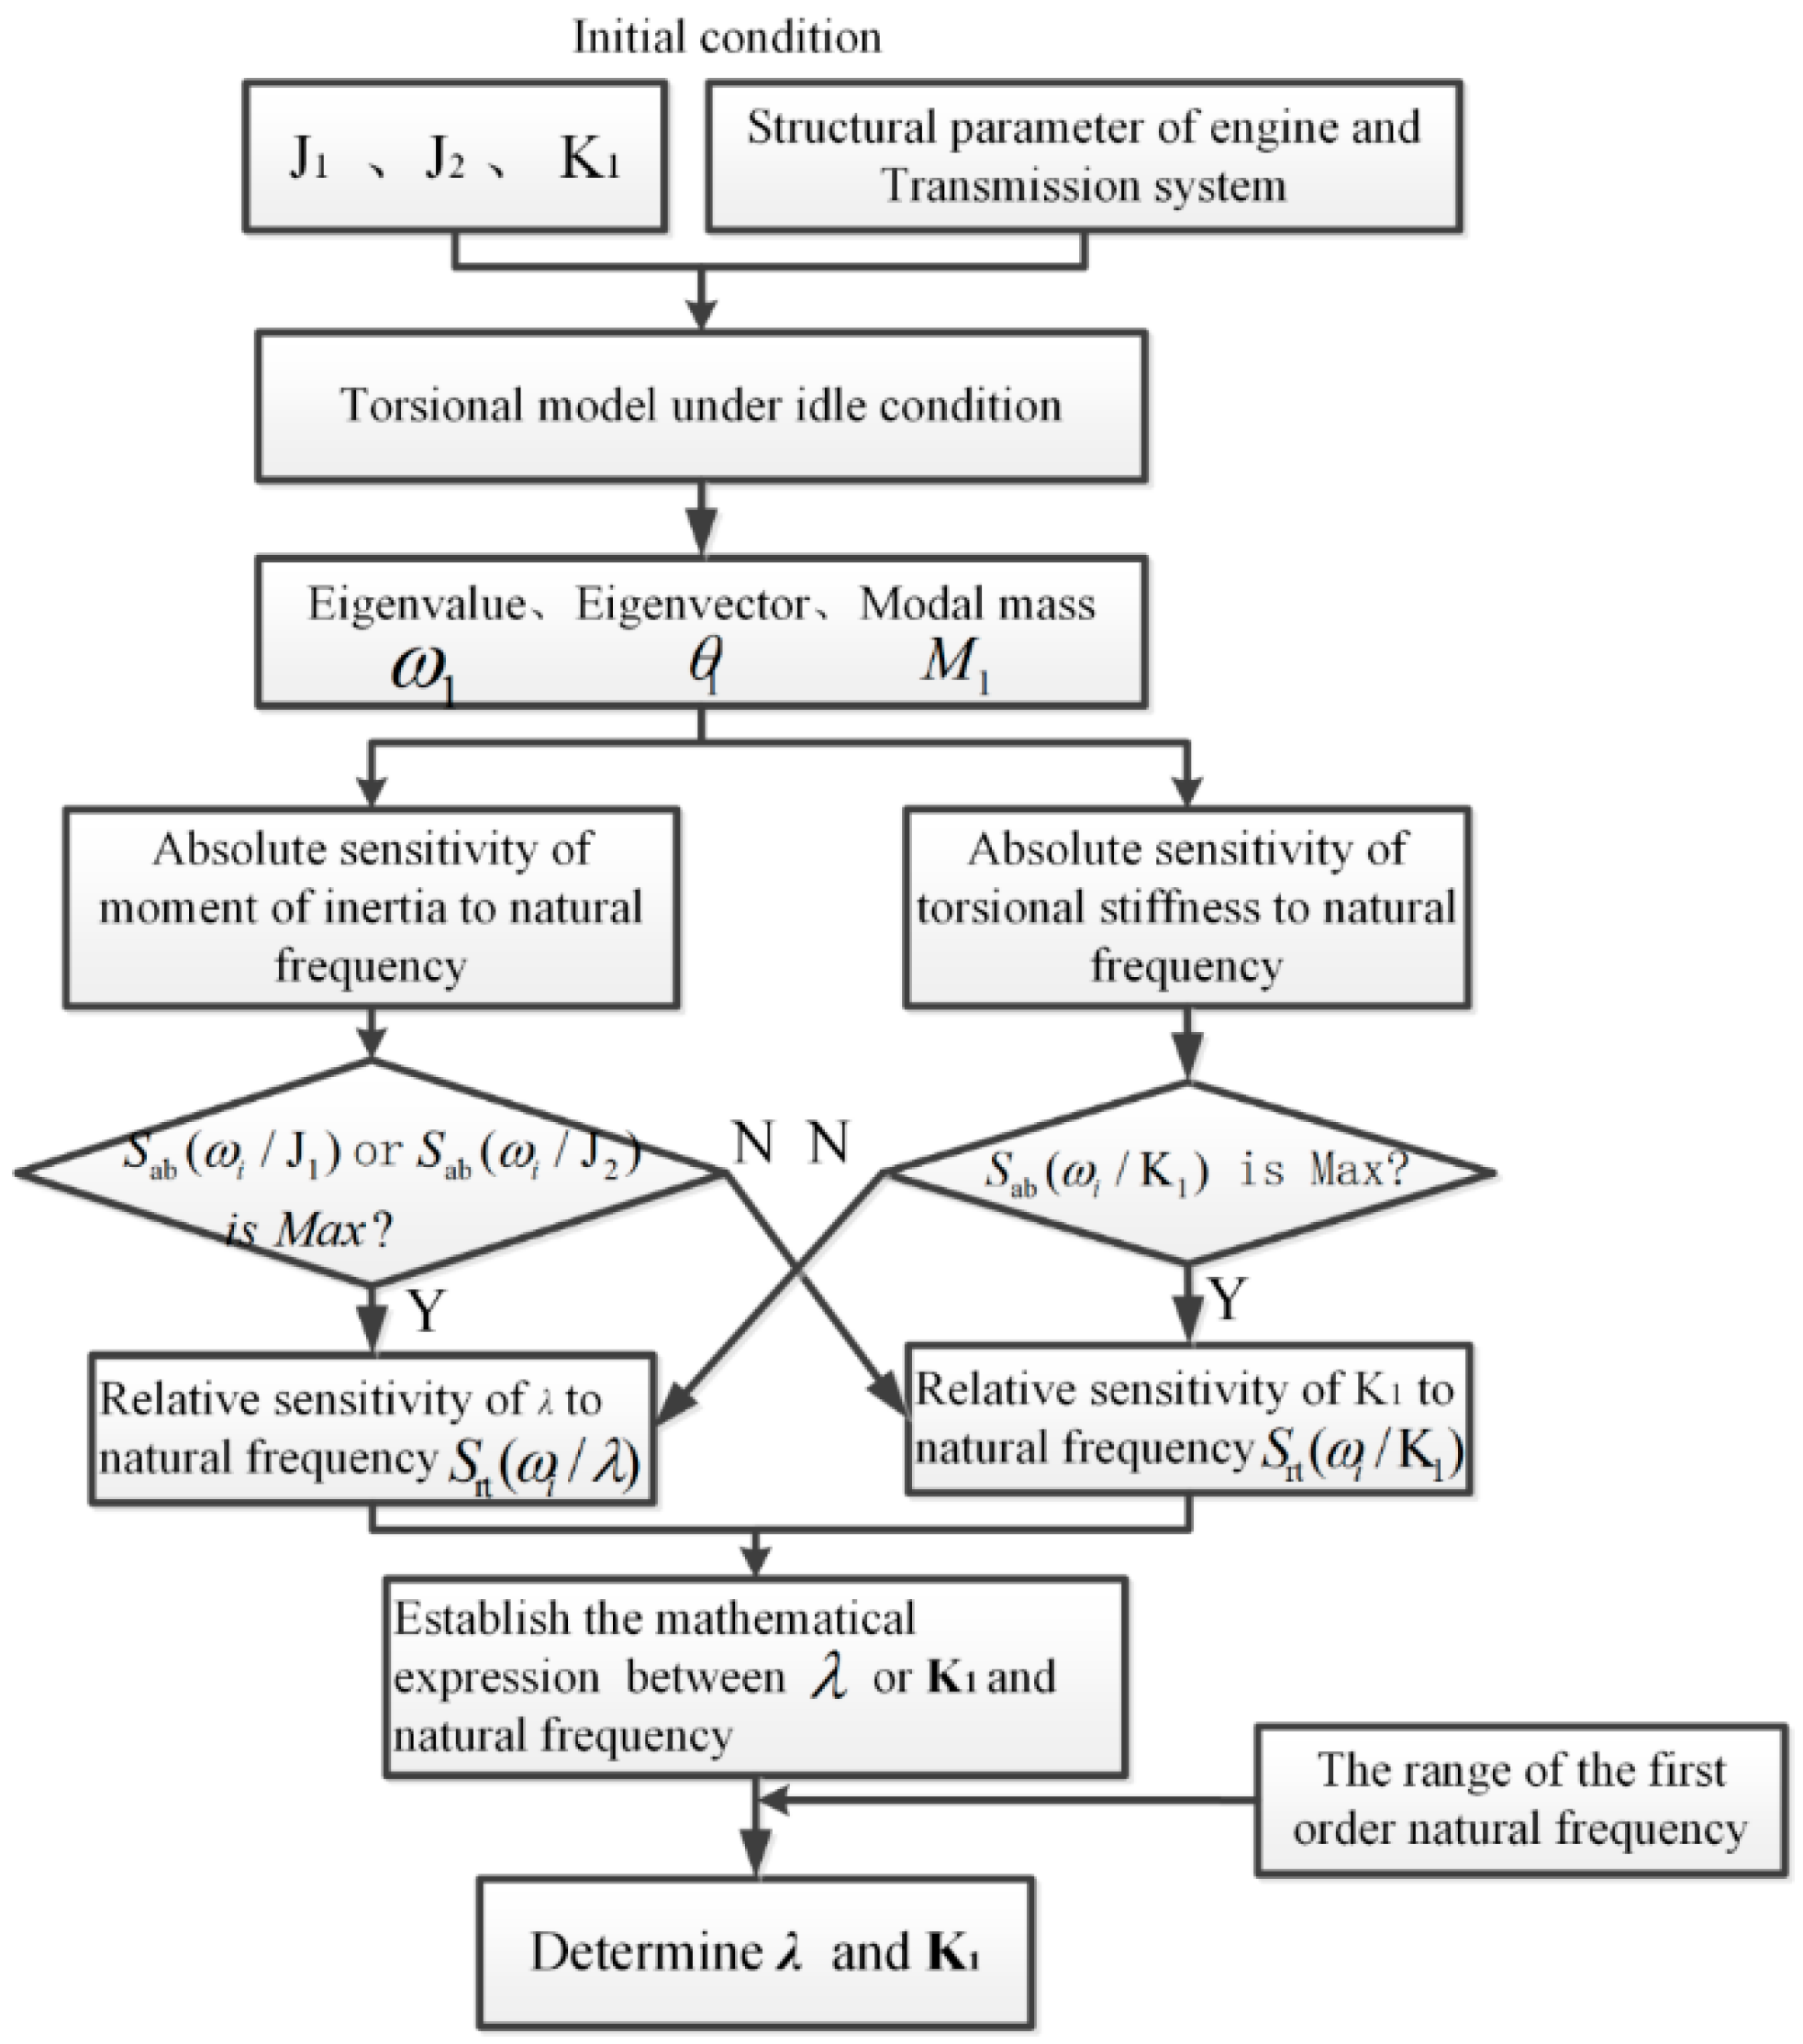
Let the torsional stiffness of DMF at the idling stage be
. Based on the initial conditions of the moment inertias of the primary and secondary flywheel assembly and the torsional stiffness at the idling stage, combined with the value range of the 1st order resonance and the analysis method of structural sensitivity, the matching of
,
, and
to the power transmission follows the procedure outlined in
Figure 4.
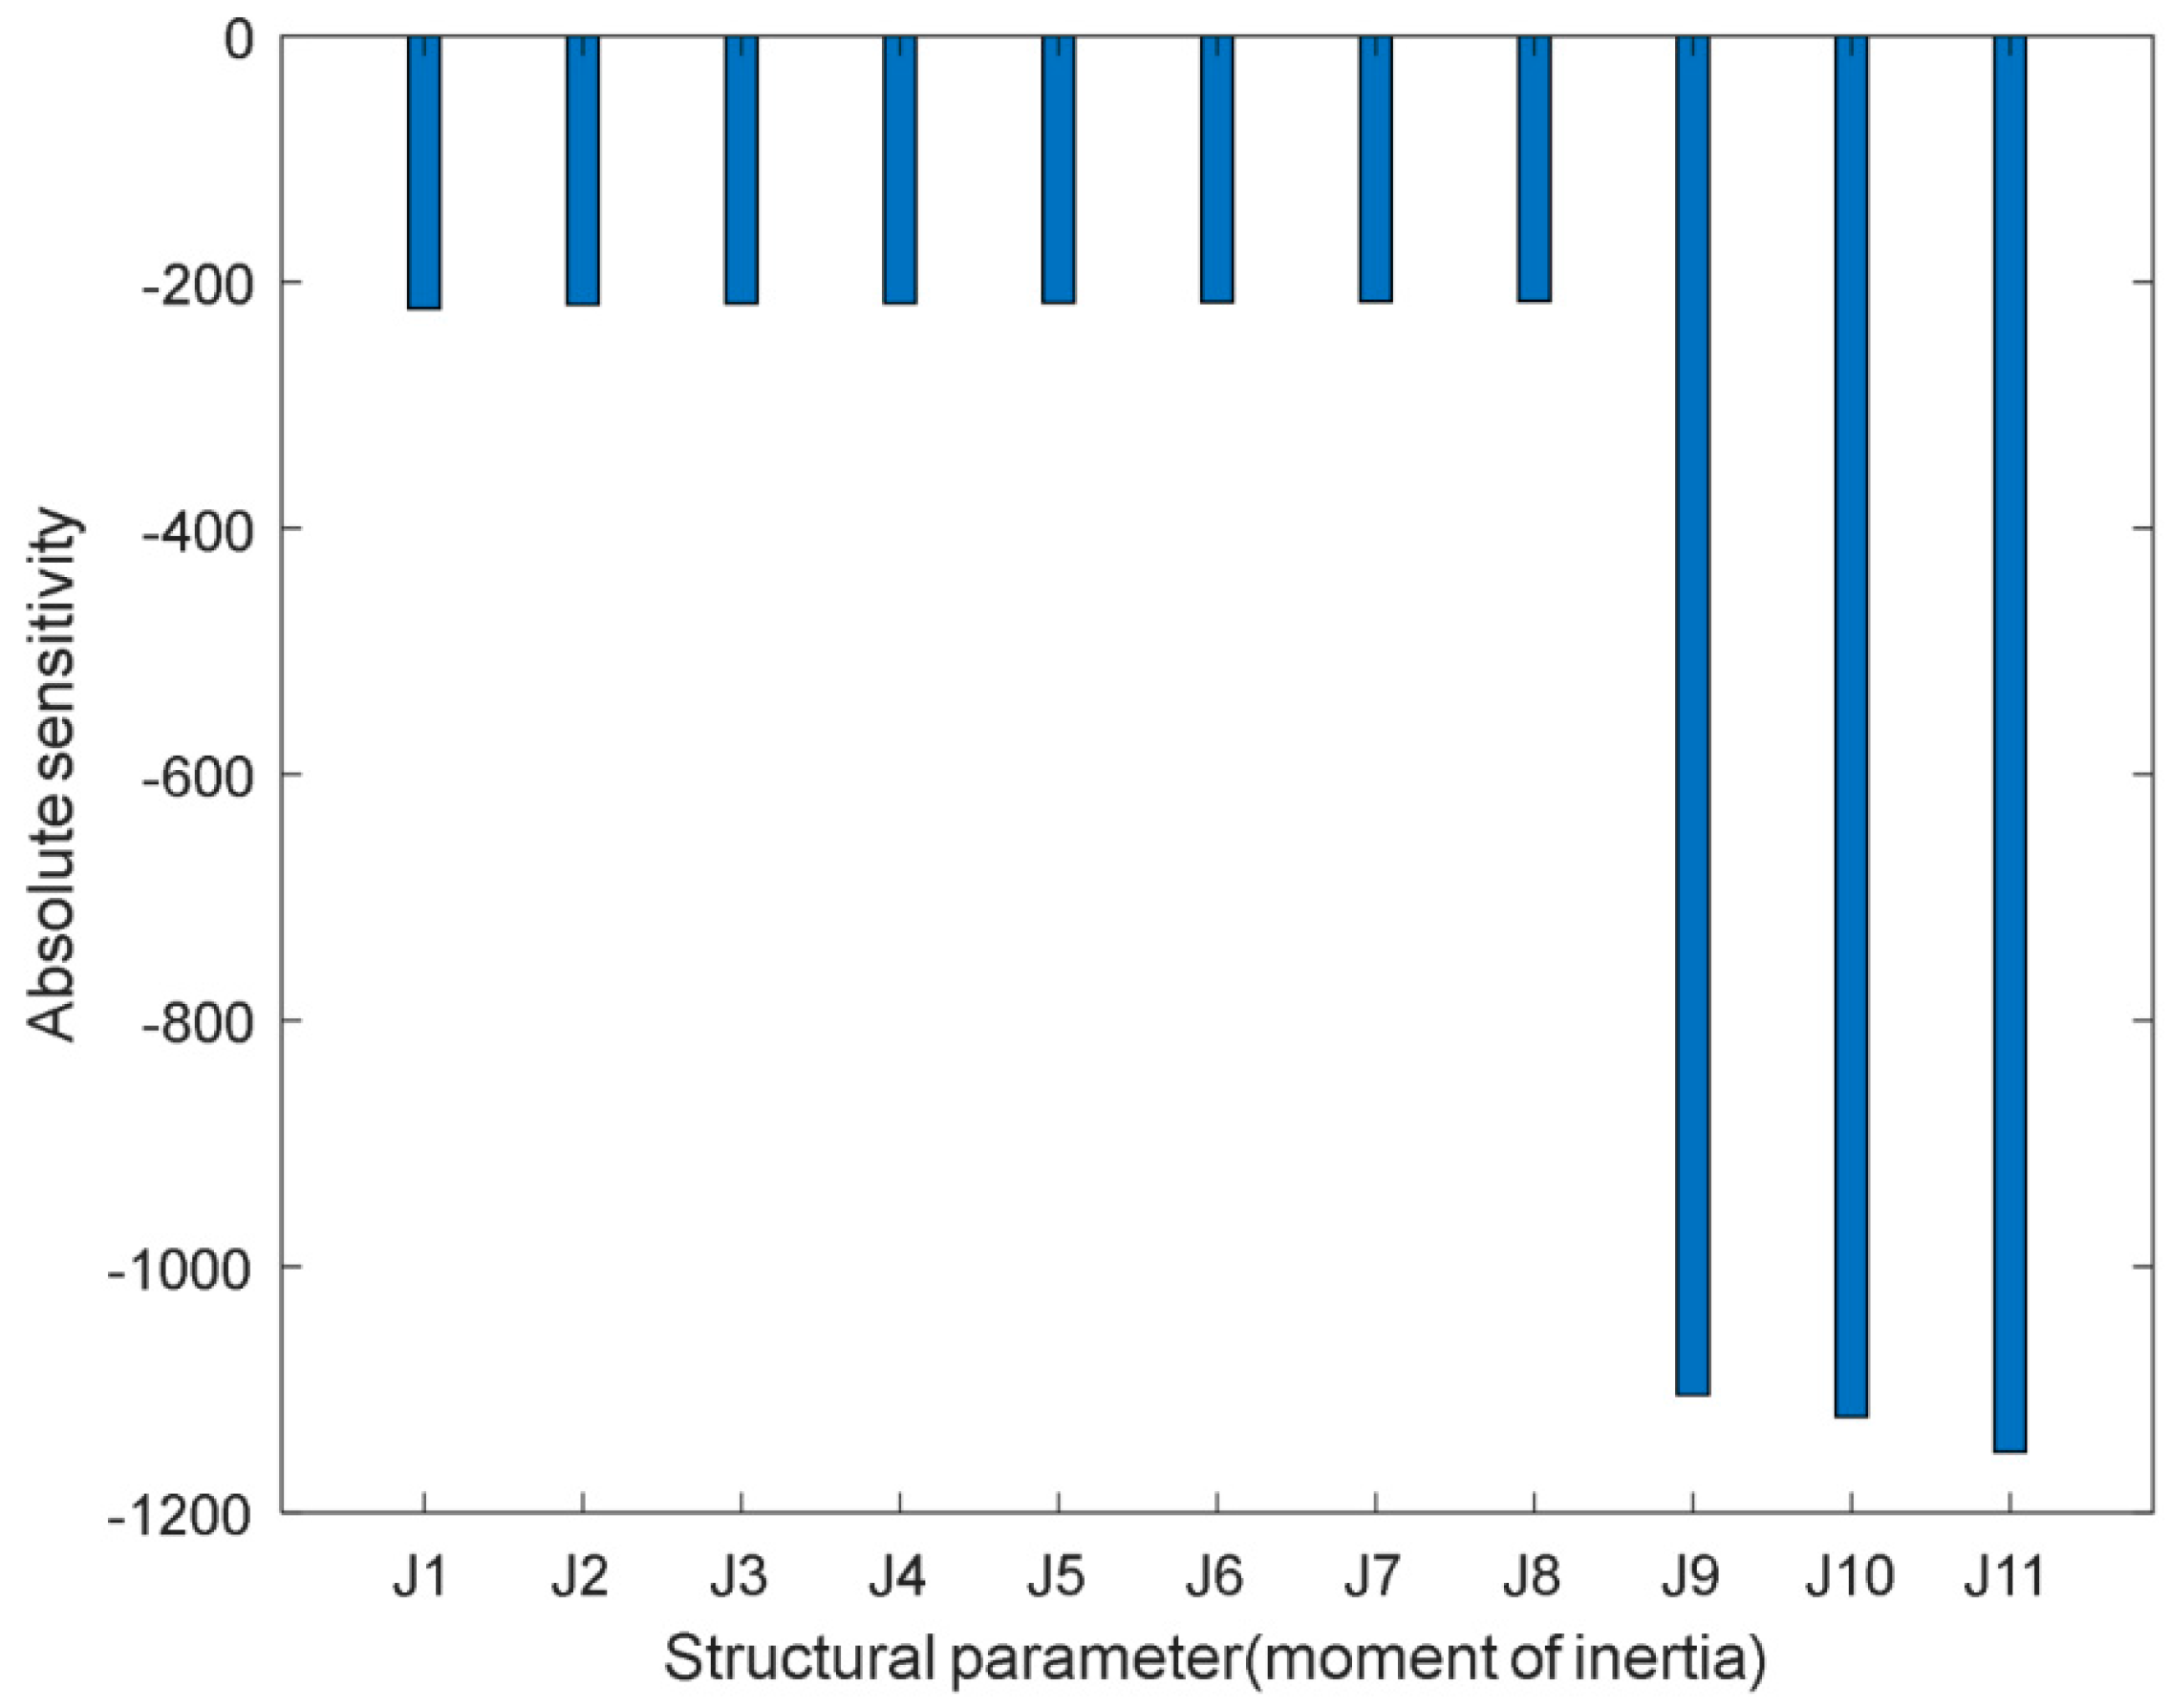
In
Figure 4,
and
denote the absolute sensitivities of the 1st order natural frequency to the moment of inertias of the primary and secondary flywheel assembly, respectively, and
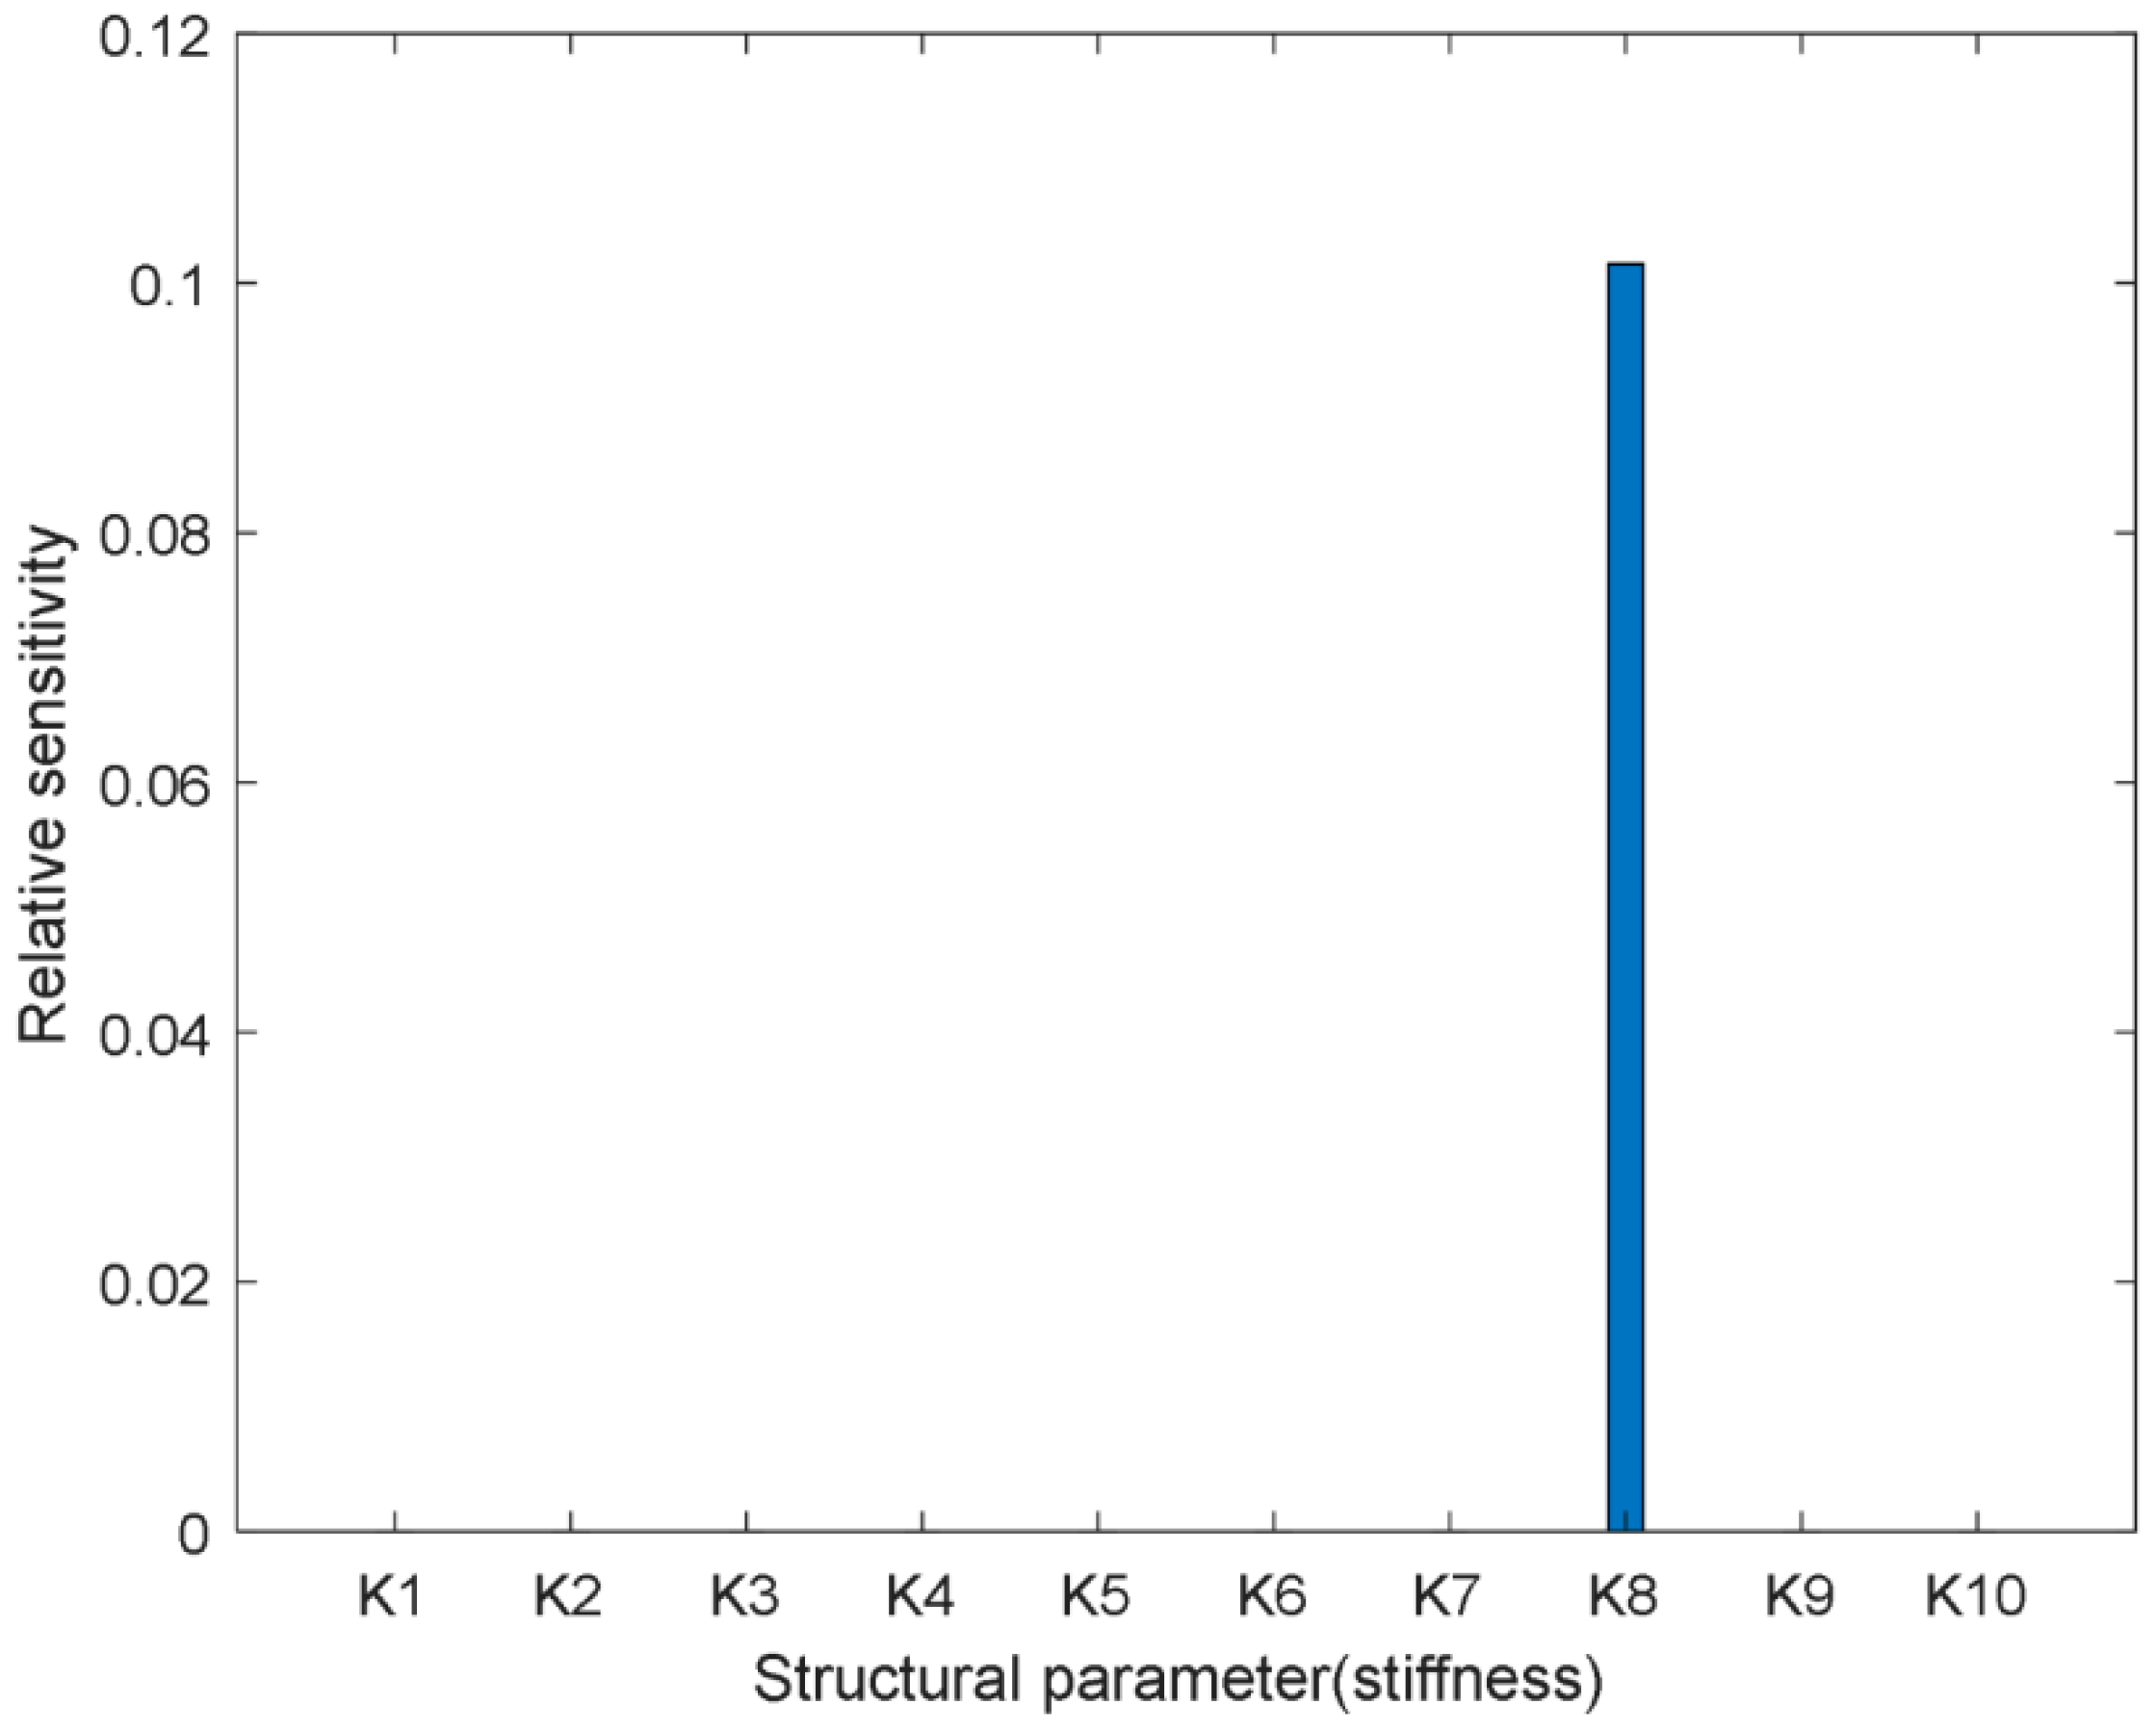
denotes the relative sensitivity of the 1st order natural frequency to the inertia ratio. Meanwhile,
and
are the absolute and relative sensitivities of the 1st order natural frequency to the torsional stiffness at the idling stage, respectively. If both
and
are not significant,
and
will not be the main structural parameters affecting the 1st order natural frequency. Thus,
should be the crucial structural parameter to tune the natural frequency. On the other hand, if
is not the largest sensitivity,
and
will be the key structural parameters to adjust the natural frequency. In addition, if all the three sensitivities are significant,
,
, and
will be the key parameters to adjust the natural frequency. In the matching process, because of the constraints of the primary and secondary flywheel assembly, any change of the moment of inertia of the flywheel assembly will cause the change of the other. Thus, the moment of inertia ratio,
, should be used instead of
and
as the structural parameter to conduct the calculations when analyzing the gradient relationship between the change of the primary and secondary flywheel assembly and that of the natural frequency. Therefore, Equation (16) involving
can be rewritten as:
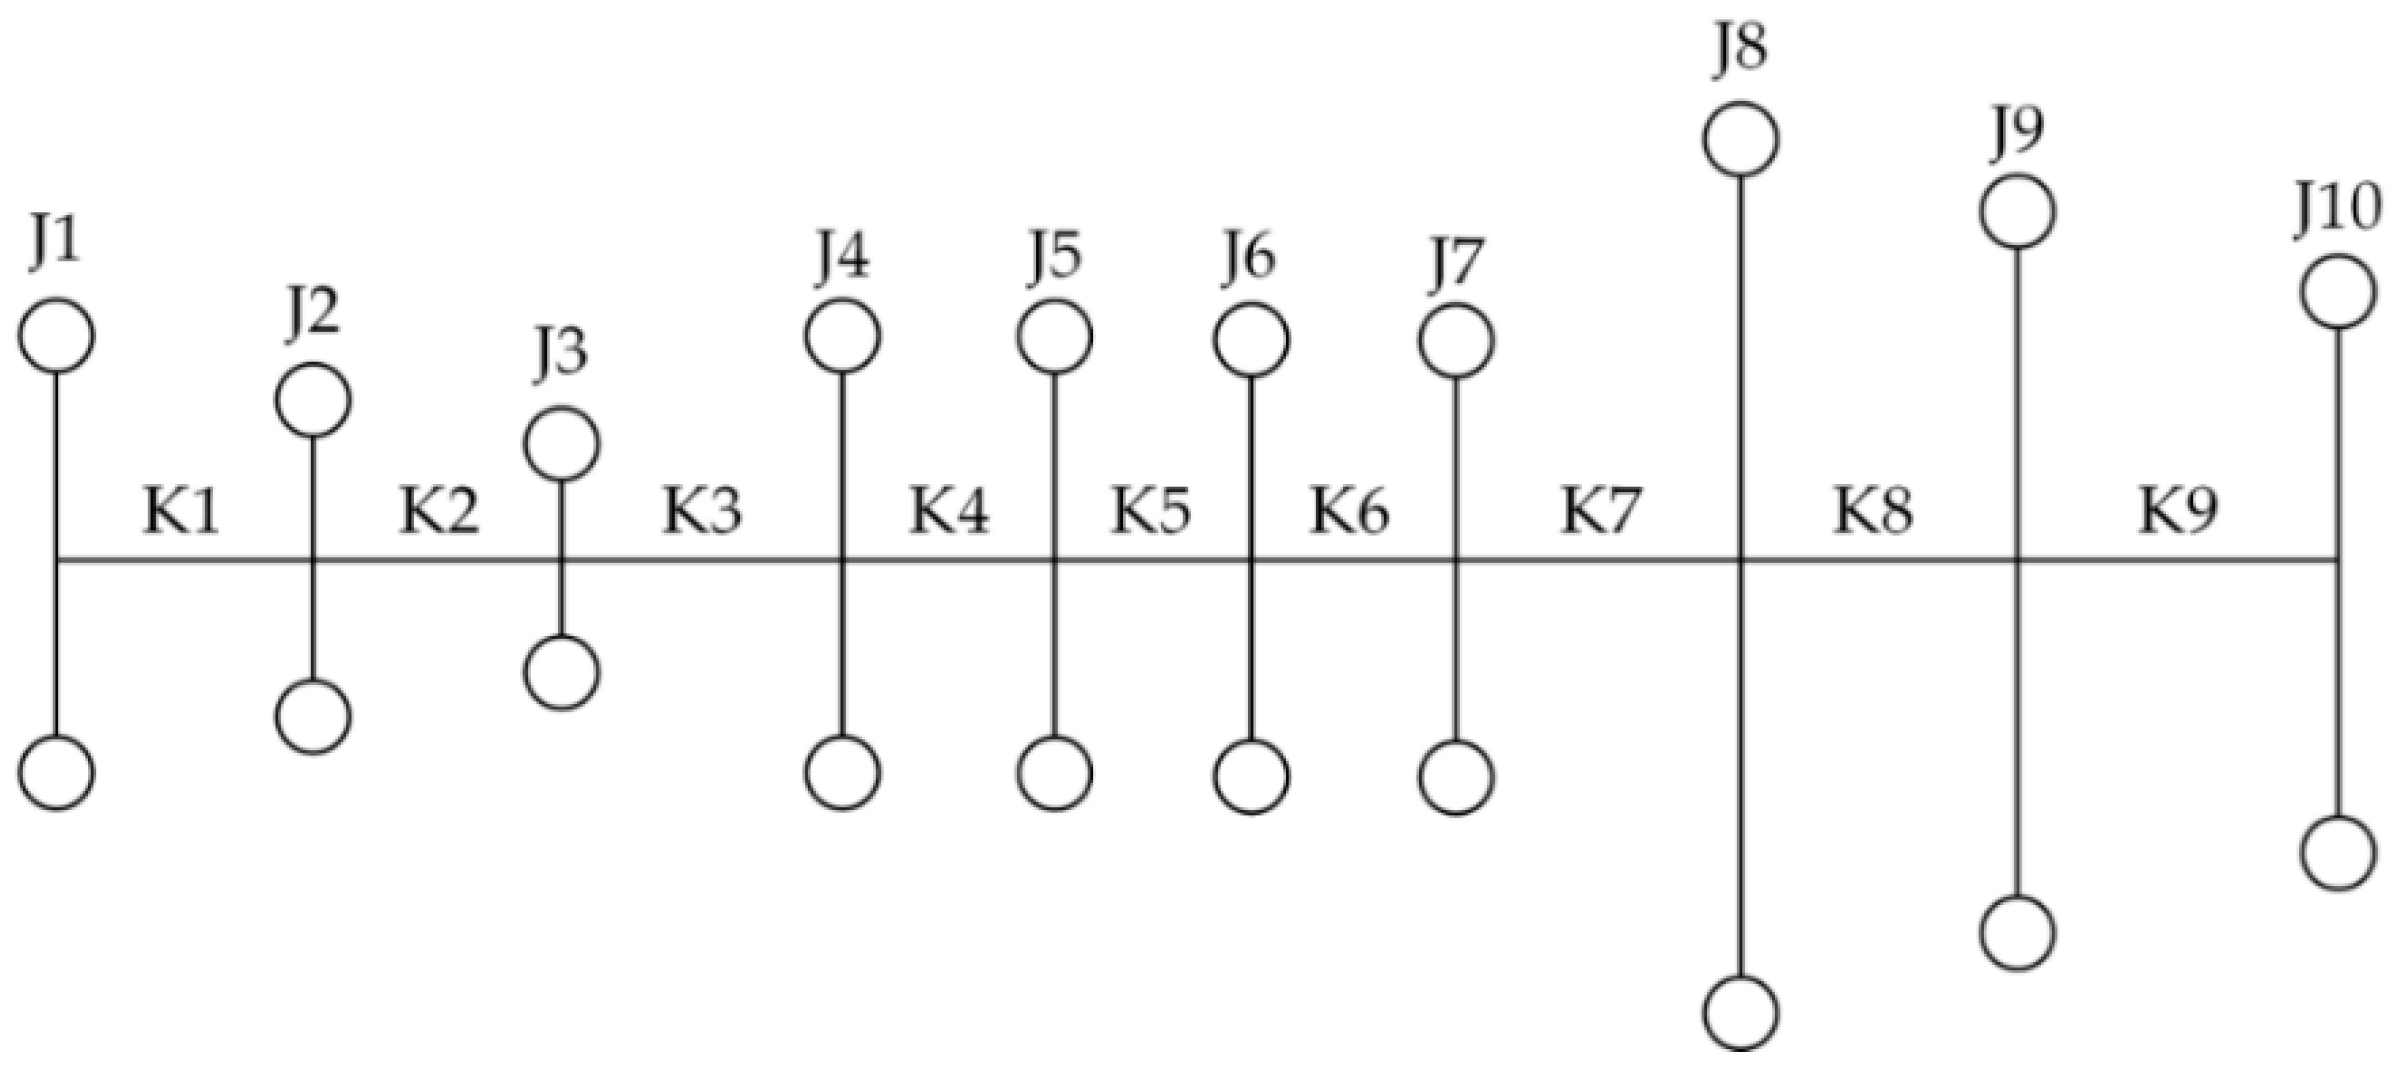
Let the
jth and
th units be the primary flywheel assembly and secondary flywheel assembly, respectively, then:
Substituting Equation (35) into Equation (33), it can be rewritten as:
According to
and
, the mathematical relationships between the 1st order natural frequency and
,
can be respectively established as:
where
is the variation based on the initial value of
λ,
is the variation of the 1st order natural frequency,
, based on the initial conditions, and
is the variation based on the initial value of
. Thus
,
, and
are obtained as:
can be determined by the difference between the actual value and the value range of . Then, the range of and can be determined by Equations (39) and (40). In this process, should be the structural parameter to be adjusted firstly. When it cannot meet the requirement, another structural parameter should be adjusted.
3.2. Matching Model of Inertia and Torsional Stiffness of the DMF under the Driving Condition
Under driving conditions, the torsional stiffness of the DMF at the driving stage that is
can both transfer the engine power and adjust the system natural frequency. Let the operating angle of DMF at
and
be
and
, respectively. Generally, the total torsion angle of the DMF springs being
is about 65°–70° [
5], thus,
.
can be primarily valued as:
where
is the moment of inertia of the power transmission under the idling condition, which is related to the inertias of the secondary flywheel assembly, the clutch and the input shaft of the transmission, and the angular accelerations of the starting motor. Accordingly,
can be primarily calculated as:
where
is the maximum torque from the engine, and
is the torque backup coefficient, which is related to the real car.
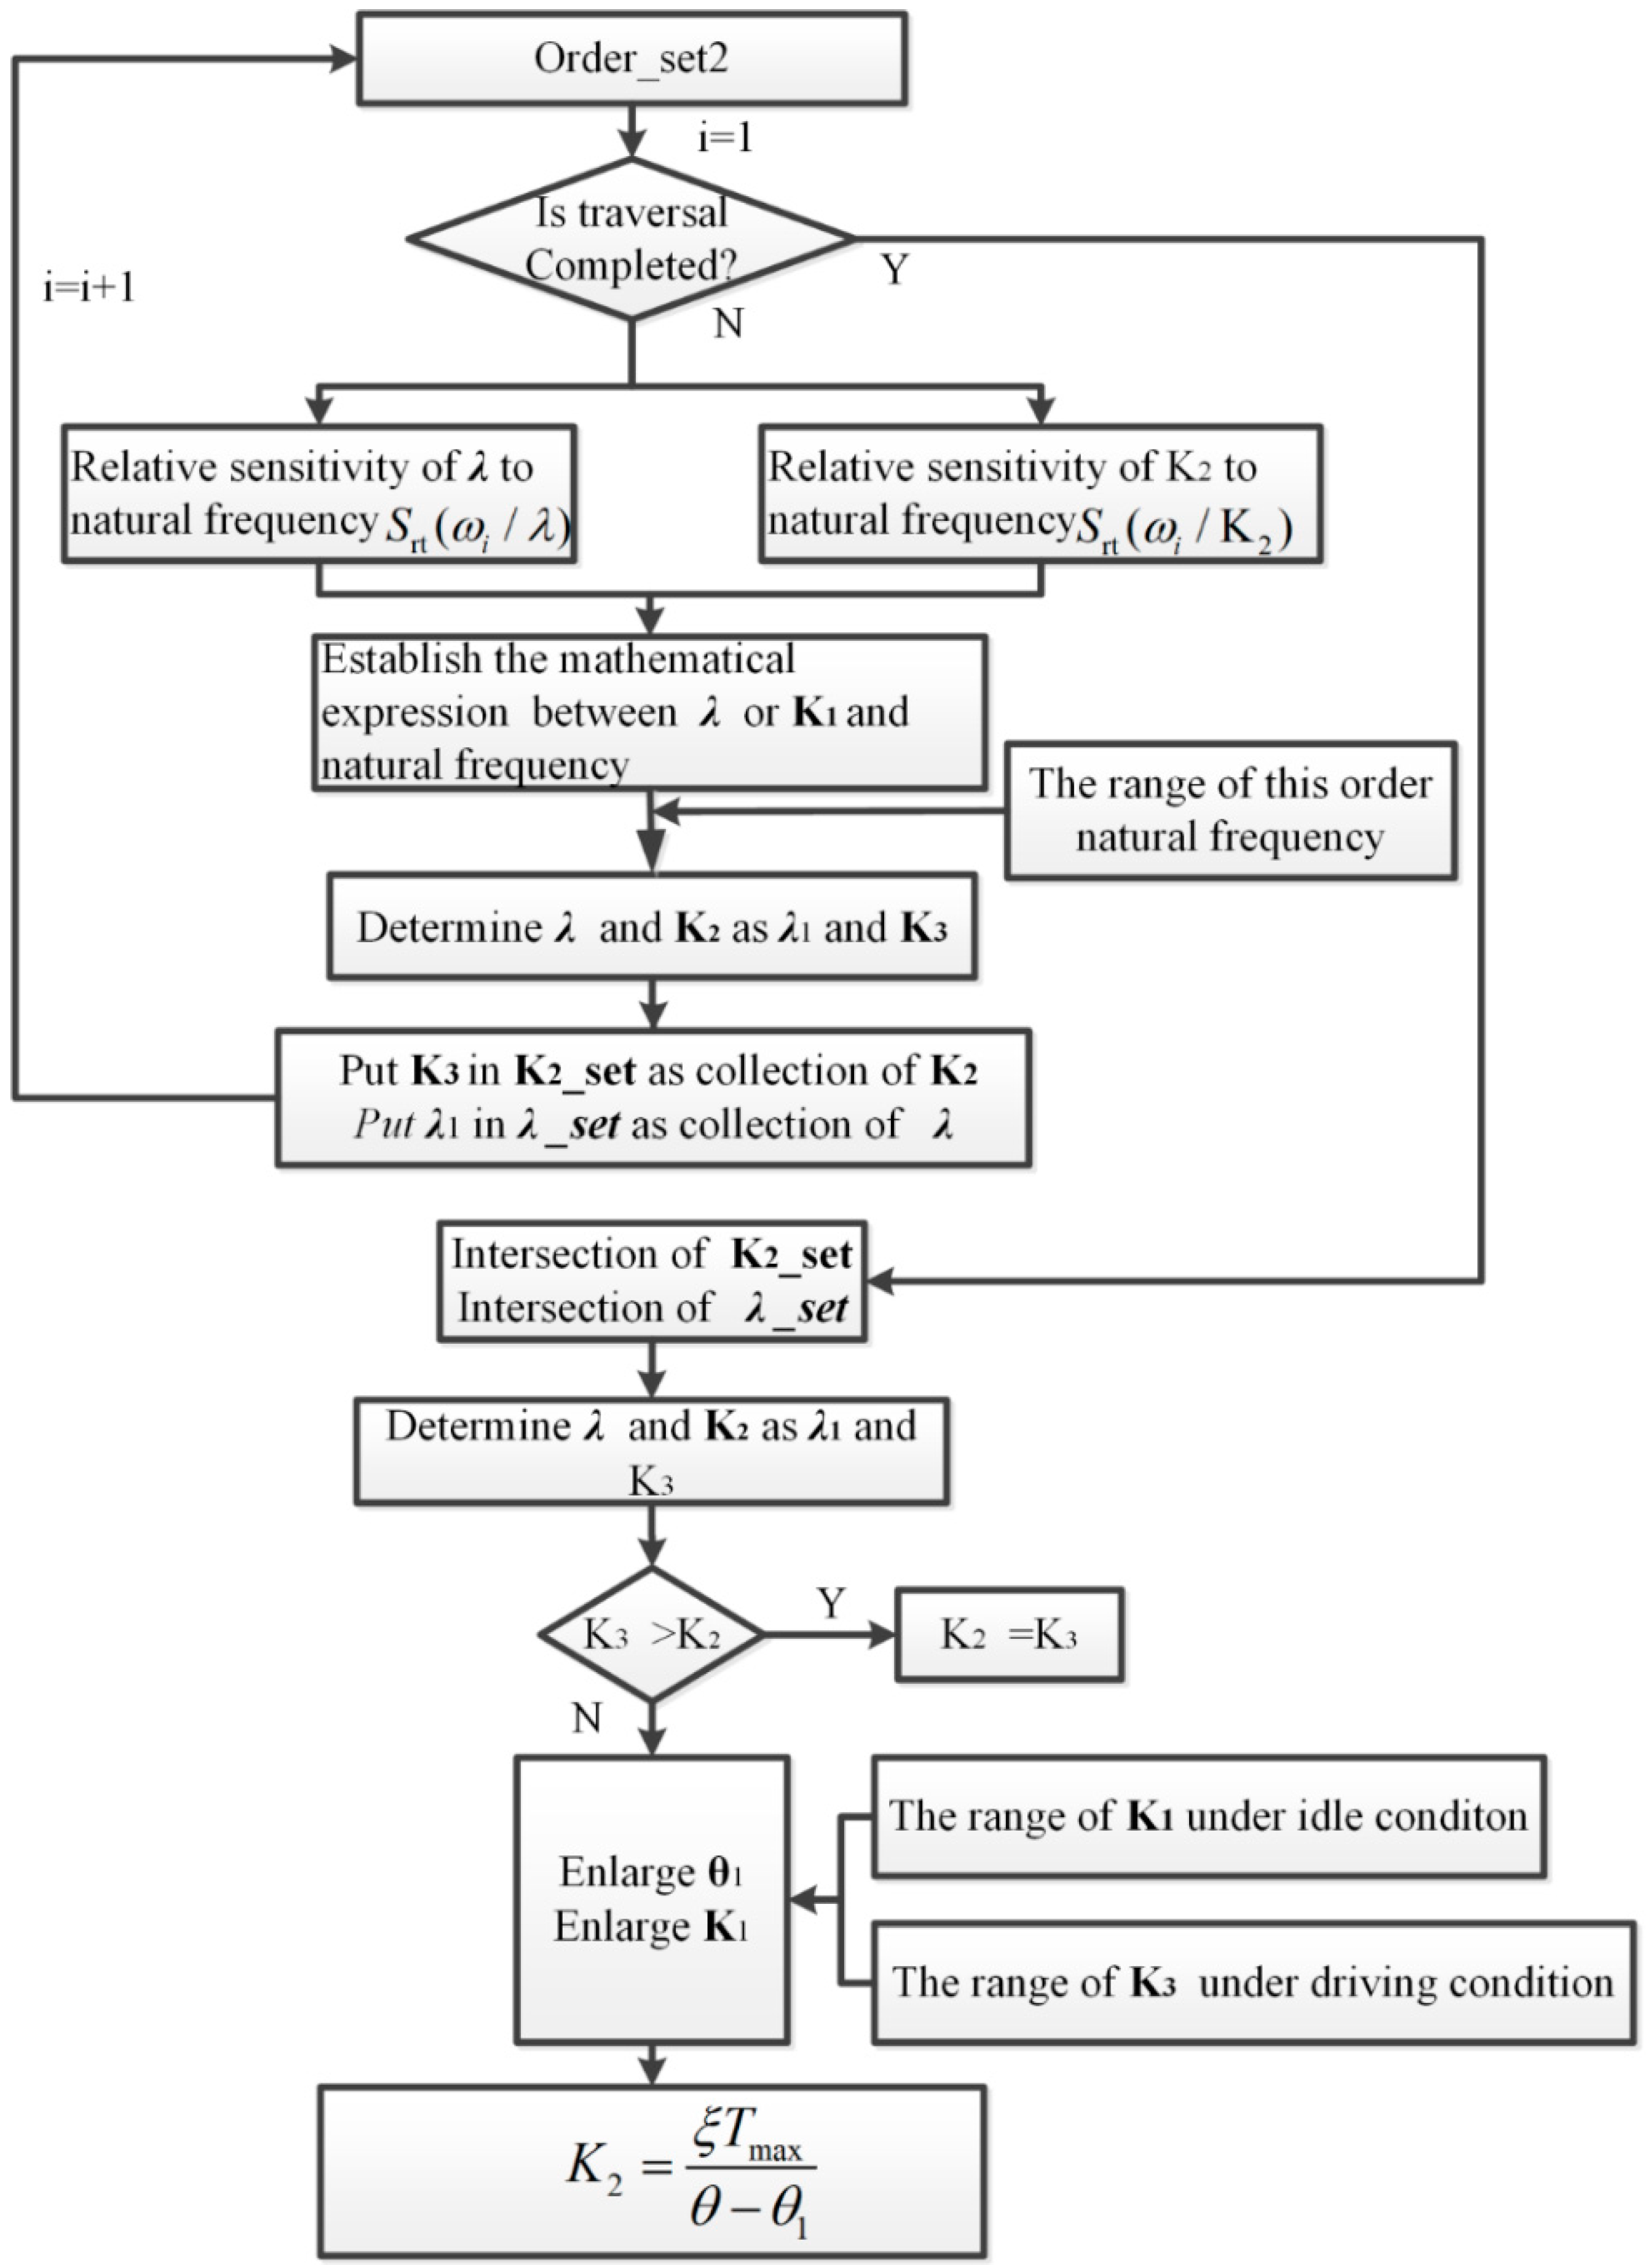
Figure 5 shows the matching process of the structural parameters of the DMF using the structural sensitivity analysis method. Taking
,
, and
as initial conditions, the torsional vibration model of the system can be established firstly. Then, modal analysis will be conducted to determine whether the resonance speed is in the low speed region. If the resonance speed deviates from the low speed region,
,
,
, and
will be the final structural parameters of DMF. Whereas, if the resonance speed is in the low speed region, we should firstly obtain the order set of resonances, which is order_set1. Then, the absolute sensitivities of
,
, and
to the natural frequency are analyzed for each order in order_set1 to obtain order_set2 associated with
,
, and
. Finally, the structural sensitivities of
and
are analyzed in order_set2, and their values are matched.
In this process, for the orders of resonance, the ranges of the natural frequency can be determined by Equations (21) and (22). Meanwhile, the relative sensitivities of and to each order natural frequency can be calculated. Then, referring to Equations (39) and (40), the ranges of and can be determined and stored in the K2_set and λ_set, respectively. After traversing order_set2, the intersection of all values in the λ_ set and K2_set will be obtained, and the values of and will be determined accordingly. After the above calculations under driving conditions, will change to be . If , we value the torsional stiffness of the DMF at the driving stage as ; that is . If , cannot meet the requirement of torque transmission. Therefore, in this case, the intersection of the ranges of and under the idling condition should be determined firstly. In this intersection, by increasing and its operating angle, , will finally be determined according to Equation (42).


