Article

Proteolysis of β-lactoglobulin by Trypsin: Simulation by Two-Step Model and Experimental Verification by Intrinsic Tryptophan Fluorescence

A.N. Nesmeyanov Institute of Organoelement Compounds, RAS, 28 ul. Vavilova, Moscow 119991, Russia
Symmetry 2019, 11(2), 153; https://doi.org/10.3390/sym11020153
Submission received: 30 December 2018 / Revised: 23 January 2019 / Accepted: 28 January 2019 / Published: 30 January 2019

Abstract

:
To distinguish differences in enzymatic hydrolysis of various proteins, we propose an algorithm using a dataset of fluorescence spectra obtained at different moments of hydrolysis t. This algorithm was demonstrated in the example of β-lactoglobulin (β-LG) proteolysis by trypsin. The procedure involved processing the spectra to obtain the wavelength of the maximum fluorescence λmax, which was found to be proportional to the fraction of tryptophanes in hydrated proteolysis products (demasked tryptophanes). Then, the dependence λmax(t) was fitted by biexponential function with two exponential terms, one of which was responsible for the fast part of the fluorescence change during proteolysis. The contribution of this term was quite different for various protein substrates—it was positive for β-LG and negative for β-casein. The observed differences in proteolysis of different substrates were explained by different demasking processes. Combining the fluorescence data with the degrees of hydrolysis of peptide bonds allowed us to analyze the hydrolysis of β-LG in the framework of the two-step proteolysis model and estimate the ratio of rate constants of demasking and hydrolysis and the percentages of initially masked and resistant peptide bonds. This model predicted the existence of a bimodal demasking process with a fast part at the beginning of proteolysis and lag-type kinetics of release for some peptides. Compared with monitoring proteolysis in terms of the degree of hydrolysis only, the fluorescence data are helpful for the recognition of proteolysis patterns.

1. Introduction

For all proteolysis patterns, it is important to know how the fragmentation of the polypeptide chain occurs over time—that is, the kinetics of proteolysis. Enzymatic hydrolysis of proteins (proteolysis) occurs under the action of proteolytic enzymes (proteases), which are natural chiral catalysts. As a result of the hydrolysis of peptide bonds, these enzymes hydrolyze proteins into shorter polypeptides, short peptides, and even amino acids. This process plays an important role in various fields of biology, biotechnology, and proteomics. Proteolysis is involved in biological processes at the level of cells and biological systems, including digestion, autolysis, activation of enzymes, cell regulation, etc. The wide application of protein hydrolysis in the food industry includes the processing of milk proteins by various proteolytic enzymes [1]. For all cases of proteolysis, it is important to know how the fragmentation of the polypeptide chain occurs over time—that is, the kinetics of proteolysis.
The mechanism of action and specificity of proteolytic enzymes has been intensively studied for synthetic substrates with ester or amide bonds and small peptides containing amino acid residues specific for a given enzyme [2]. Trypsin (EC 3.4.21.4) is a serine protease found in the digestive system, where it breaks up food proteins into peptides [3,4]. Its optimal catalyst conditions are pH 7.8 and a temperature of 37 °C [5]. Trypsin has a catalytic triad within its active site that involves Ser195, His57, and Asp102 residues. Positively charged side chains of Arg and Lys residues in protein substrates participate in electrostatic interactions with Asp189 at the bottom of the trypsin active site [6]. Therefore, trypsin cleaves predominantly peptide bonds at the carboxyl side of lysine and arginine (Arg-X, Lys-X bonds) unless they are followed by proline [4,5,6]. In addition, the rate of hydrolysis of these bonds depends also on other neighboring amino acid residues providing so-called secondary specificity. For small substrates with one bond to be hydrolyzed, the hydrolysis kinetics is of the Michaelis-Menten type.
Unlike the hydrolysis of small substrates, proteolysis is a polysubstrate process that involves the cleavage of peptide bonds of various specificities. Hydrolysis is complicated by unequal and often limited access of peptide bonds to the action of the enzyme since different sites in protein substrate are differently exposed to the surrounding solvent [7]. This steric effect, known as masking, was proposed to be a significant limiting factor of hydrolysis [7]. The degradation of the protein substrate and the corresponding demasking of the peptide bonds in the course of protein degradation are difficult to describe because of the complex nature of unfolding, dissociation, and solubilization of a large number of polypeptide fragments. Thus, the kinetic regularities of the total hydrolysis of peptide bonds are very complex and they do not obey the Michaelis-Menten law.
The main bovine whey protein is a small globular protein β-lactoglobulin (β-LG) [8]. In vivo, it has the ability to bind and transport small biomolecules, such as fatty acids and vitamin A. The monomeric β-LG consists of 162 amino acid residues (18.3 kDa), and its compact globule is stabilized by two disulfide bonds (Cys66-Cys160 and Cys106-Cys119) [9,10]. β-LG contains 15 lysine and three arginine residues, which are potentially specific for trypsin, and two tryptophan residues at positions 19 and 61, which mostly provide intrinsic fluorescence. β-LG is able to form dimers at physiological environment conditions and exists in monomeric form at high temperatures and pH values higher than eight [11].
Since Adler-Nissen’s first presentation—the degree of hydrolysis—the percentage of hydrolyzed peptide bonds has been widely used as a universal parameter for controlling proteolysis and optimizing the process [1]. An alternative to the degree of hydrolysis could be the degree of changes in a secondary structure and the conformation of protein substrate, as measured by an appropriate spectral technique. In recent years, some progress has been made in comparing spectral data obtained at different times of hydrolysis using fluorescence [12,13] and infrared spectroscopies [14,15,16,17]. It was demonstrated that the degradation of protein substrate can be quantified by a shift in tryptophan fluorescence [12,13]. This shift is caused by an increase in the polarity of the medium around Trp residues [18,19], being a result of the proteolytically induced degradation of the protein structure.
Proteolysis of β-LG by various proteases was intensively studied in connection with the practical importance of this process for food processing [20,21,22,23]. In addition to kinetic aspects, these studies revealed the main intermediate and final proteolysis products. For tryptic proteolysis of β-LG, the identification and quantification of peptides were accurately performed, opening the way for establishing the sequence of steps for protein fragmentation [10,22,23]. Using the simple fragmentation pathway, the hydrolysis kinetics was successfully described by the limited number of differential equations [23].
In proteolysis, a general tendency is the continuous degradation of the protein structure and thereby an increase in accessibility of the remaining peptide bonds to the enzyme. This process provides the peptide bond demasking [7,24], giving a local increase in the rate of hydrolysis at a certain period when most of the initially masked bonds become demasked. Owing to the demasking effect, the rate of accumulation of amino nitrogen (rate of hydrolysis) may be a non-monotonous function of the time of hydrolysis [7]. To reveal the subtle features of the hydrolysis mechanism, one can differentiate the hydrolysis degree by time and study the kinetics in terms of the rate of hydrolysis and the degree of hydrolysis [7]. Another possibility is to analyze the proteolysis kinetics in terms of the degree of hydrolysis and the degree of masking (or degree of demasking) using the two-step proteolysis model [7,12,13]. In this model, proteolysis is considered as a simple two-step process with consecutive demasking and hydrolysis steps [7]. The demasking step was quantified previously for the hydrolysis of β-casein (β-CN) by trypsin under the assumption that the degree of demasking is proportional to the fluorescence shift [12,13]. To analyze proteolysis in the framework of a two-step model, it is necessary to determine the numerical values of the rate constants included in the model [7,25].
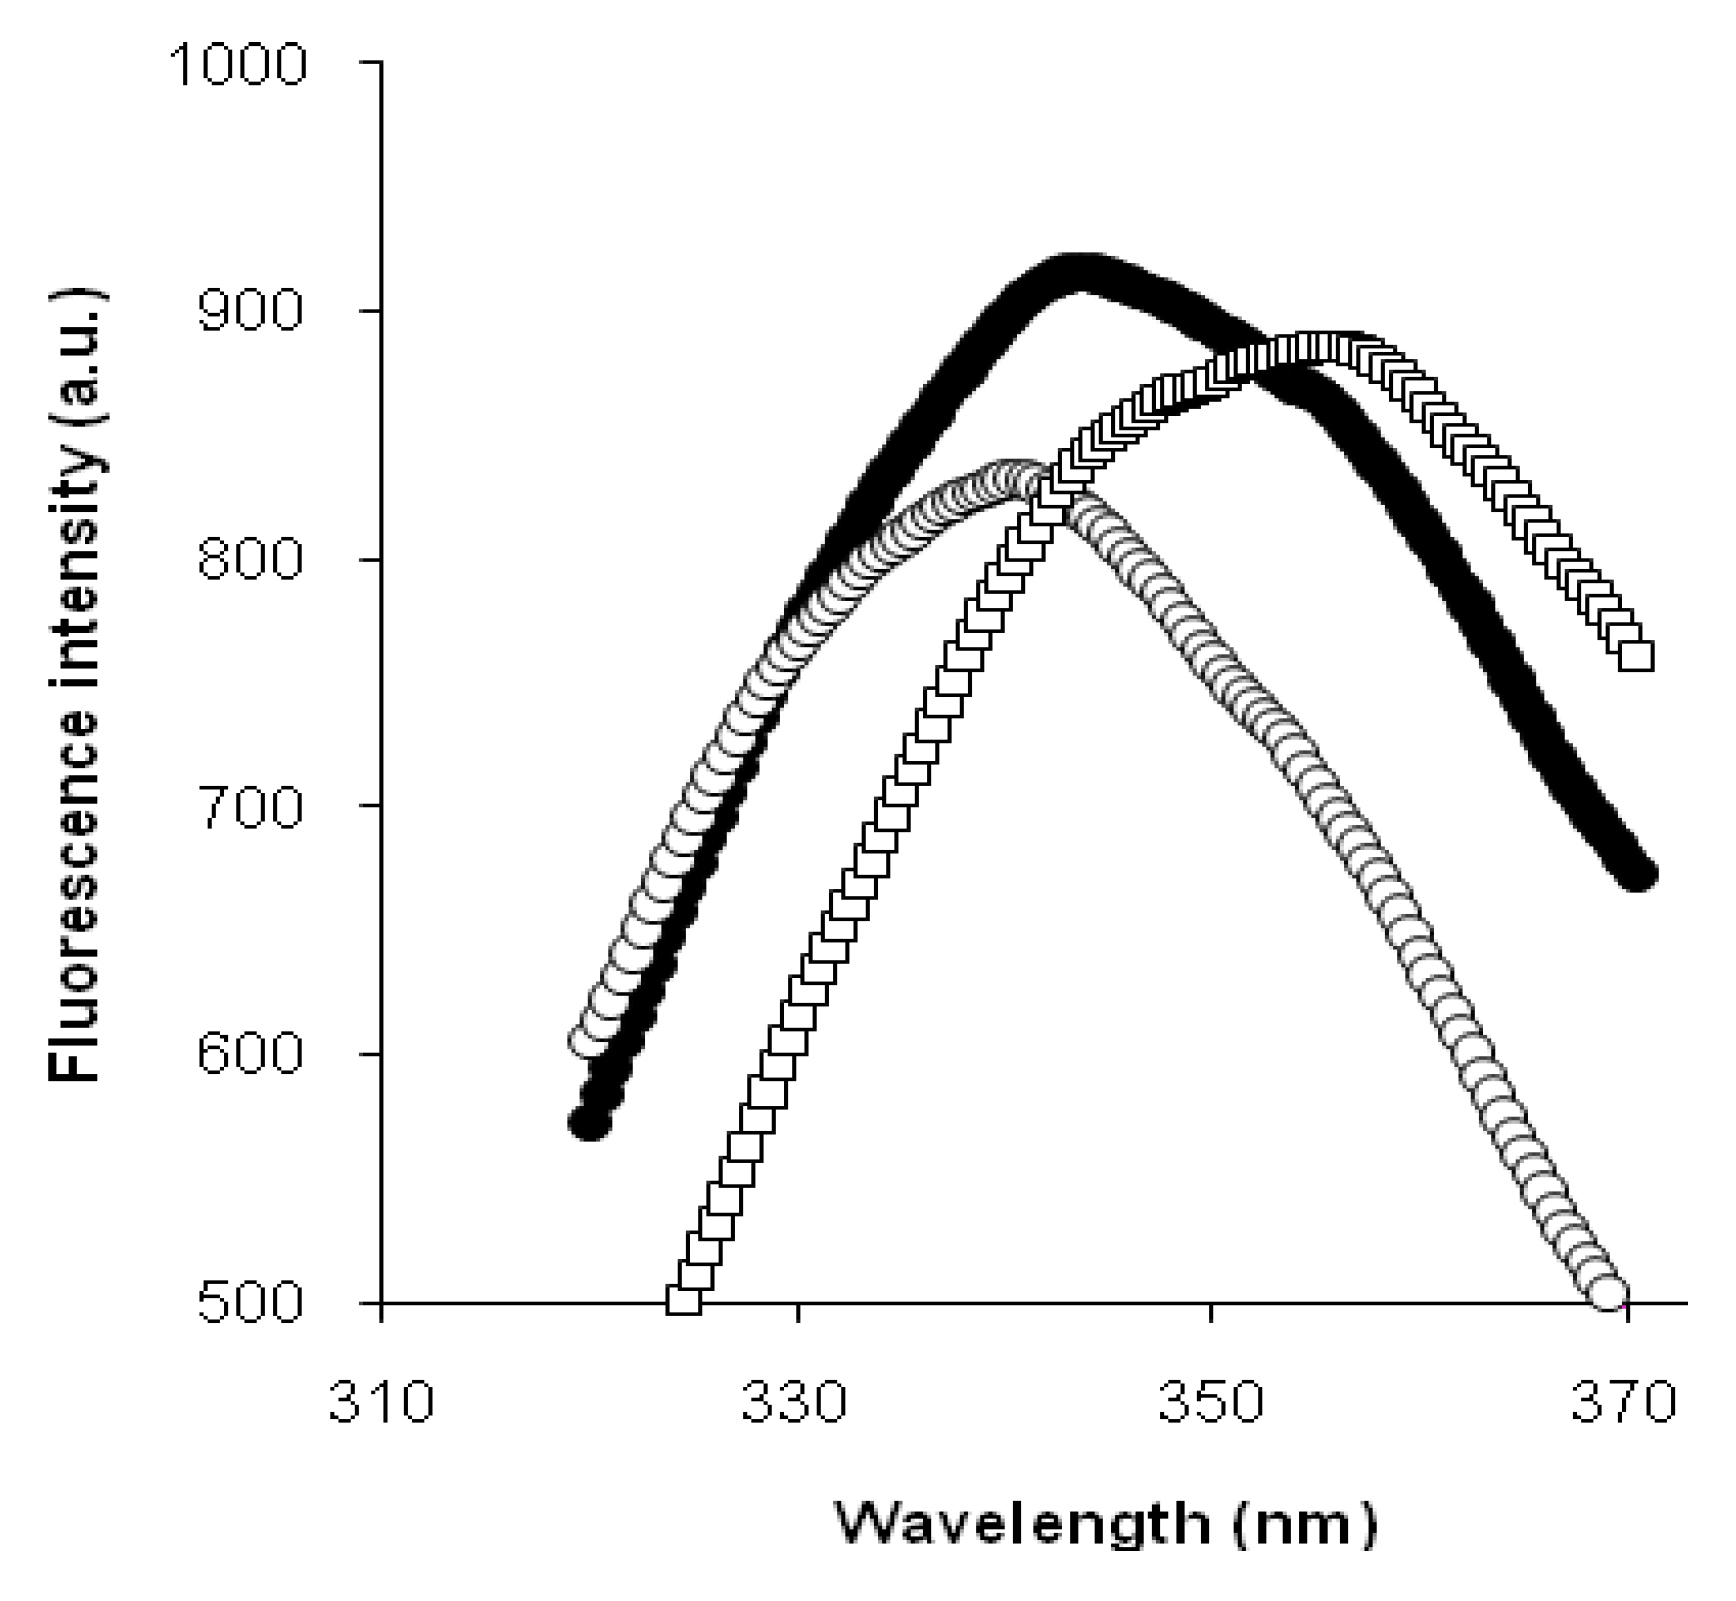
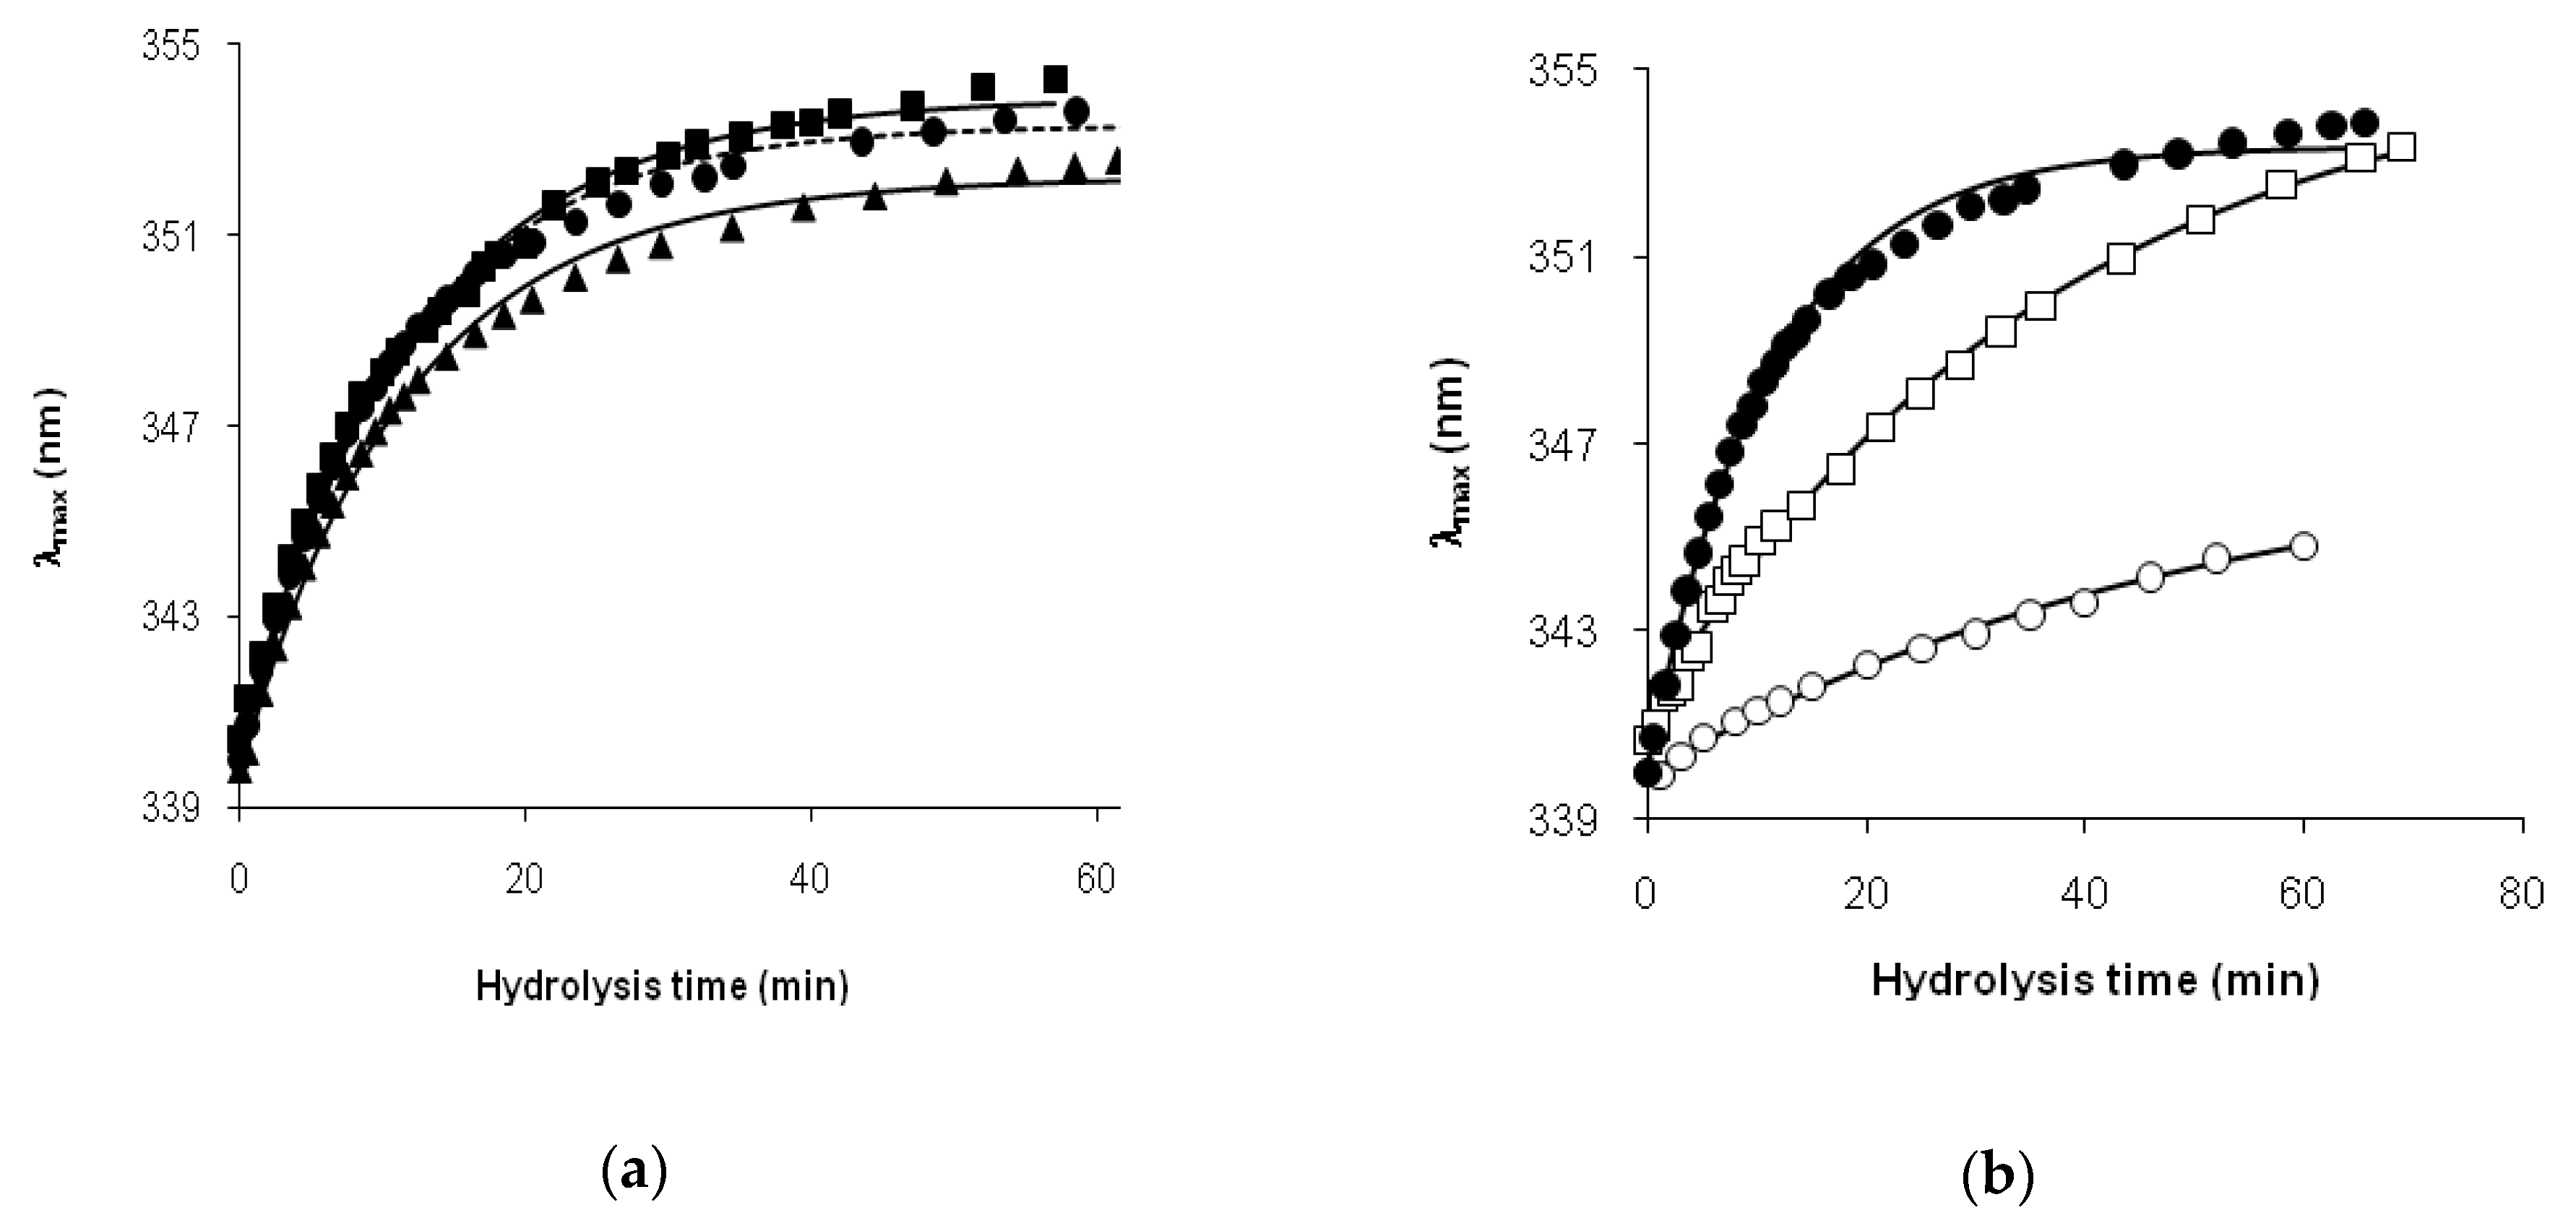
We assumed that the period of intensive demasking, caused by the structural opening of protein, could be clearly identified by the red shift in tryptophan fluorescence [12]. Additionally, aggregation of proteolysis products or refolding of polypeptide chains could cause a decrease in protein openness, consequently slowing the shift in fluorescence. This would give different sets of periods of fast and slow shifts in tryptophan fluorescence during the hydrolysis of various protein substrates.
Here, we present a kinetic analysis of fluorescence data obtained for the hydrolysis of globular β-LG by trypsin and also compare this process with the tryptic hydrolysis of β-casein (β-CN), which is an example of an amphiphilic structure-unordered protein. This illustrates a new algorithm for distinguishing differences in proteolysis of various proteins by fluorescent analysis. Fluorescence data were used to extract the important modeling parameter, the degree of masking as a function of hydrolysis time. After adding data on the degrees of hydrolysis, the analysis of β-LG proteolysis by trypsin was performed using the two-step proteolysis model. Thus, we present the benefits of using fluorescence data along with the degrees of hydrolysis for quantitative analysis of proteolysis.

2. Results

2.1. Fluorescence Spectra for β-LG Hydrolysis by Trypsin

An example of β-LG fluorescence spectra without hydrolysis and with trypsin hydrolysis is presented in Figure 1 in the range of wavelengths from 315 to 370 nm. The maximum of the emission intensity was not a monotonous function of the time of hydrolysis (t): it increased in the beginning of proteolysis and decreased at the end. The position of the fluorescence maximum monotonously shifted towards higher wavelengths from 340 nm to 355 nm (Figure 1). Initially, at t = 0, the spectrum of Trp residues, which were a part of the folded globule of native β-LG, had intensity Iin(λ). At the end of proteolysis process, the same Trp residues entered open peptide fragments, and their fluorescence intensity approached the value of Ifin(λ) due to changes in the environment around Trp residues. To determine which spectral characteristic (the maximum intensity or the spectral shift) was more reliable for analysis, we compared all obtained spectra I(λ) to the initial and final spectra [Iin(λ) and Ifin(λ)].
The evolution of the tryptophan fluorescence spectra was interpreted in the framework of the “one-by-one” proteolysis model [26], where Trp residues were only in a masked or demasked state, either inside the protein globule or in the hydrated proteolysis products. As a result of unfolding initiated by the primary hydrolysis of a certain β-LG molecule, the peptide bonds in this molecule became accessible for the enzyme action, which led to their rapid hydrolysis. In the framework of the Linderstrom-Lang theory for the “one-by-one” proteolysis mechanism [26], the protein molecules were hydrolyzed one after another (one-by-one), whereas intermediate peptides were absent in significant amounts. In this case, the fluorescence intensity I(λ) at any proteolysis time t could be represented as a linear combination of the intensities of the initial and final spectra [Iin(λ) and Ifin(λ)] with weights corresponding to the fractions of masked and demasked tryptophanes:
I ( λ ) = ( 1 c ) I in ( λ ) + c I fin ( λ ) + o
where c is the fraction of demasked tryptophanes and o is a small parameter. Both parameters c and o are independent of λ and are only functions of the hydrolysis time. These parameters were determined by fitting of experimental data [I(λ), Iin(λ), and Ifin(λ)] using Equation (1).
Fitting by Equation (1) of the fluorescence data for β-LG hydrolysis gave an increasing function c(t), as it should be for proteolysis, as an irreversible reaction (Figure 2a). The small parameter o(t) was found to be a really small part of Equation (1). Its value was in the interval of 0–76, while the typical value of I(λ) was within the range of 600–900 (a. u.).
For each of the obtained spectra, we determined the wavelength of fluorescence maximum (λmax), as described in the Materials and Methods section. For this, the parabolic function was used to approximate the fluorescence spectrum in the small region of 30 nm around peak maximum, which allowed us the determination of λmax, the position of the parabola center. For each of the obtained spectra, we also determined the fraction of demasked tryptophanes (c), the degree of conversion of the spectrum from the initial to the final one. It was found that λmax (t) and c(t) strongly correlated (Figure 2b) with a high correlation coefficient (r = 0.99988). From a metrological point of view, it does not matter, therefore, what characteristic c or λmax is better to measure. The presented comparative data (Figure 2b) confirm this thesis. The attempts to obtain a good correlation of the maximum intensity with the value of c were unsuccessful. Therefore, the spectral shift was concluded to be better than the maximum intensity for quantitative analysis of demasking. Previously, we used λmax to monitor the demasking process for the hydrolysis of β-CN by trypsin [2]. The fluorescence shift, i.e., the λmax parameter, was used in the present study as a key parameter for quantifying the demasking kinetics using the fluorescence dataset.

2.2. Demasking Kinetics for β-LG Hydrolysis by Trypsin

The maximum emission wavelength λmax was represented as a function of the hydrolysis time t for experiments on proteolysis at various concentrations of the enzyme and substrate (Figure 3). In all these experiments, the common tendency was found to be a shift of the spectra towards higher wavelengths during proteolysis, which gave an overall increase in λmax(t). It is known that the position of the fluorescence emission maximum of tryptophan residues is sensitive to their nearest environment [18,19]. Therefore, the red shift of fluorescence in the course of proteolysis was attributed to the increase in polarity of Trp residues. This effect can be explained by an increase in accessibility of Trp residues to polar medium (water buffer) as a result of the degradation of the protein structure. We used this physicochemical effect to quantify the demasking process by measuring λmax(t) under the assumption that the degree of demasking was proportional to the fluorescence shift [12,13].
In a rough approximation, the dependences λmax(t) for proteolysis experiments under various conditions were compared using the following one-term exponential function of the hydrolysis time t:
λ max ( t ) = λ 0 + Δ λ ( 1 e k d t )
where λ0 is the maximum fluorescence wavelength at the beginning of proteolysis, kd is the first-order rate constant, and Δλ is the amplitude of the fluorescence shift during proteolysis. The first-order rate constants of demasking (kd) were determined at various concentrations of the substrate and enzyme by Equation (2) (Table 1).
The proportionality of kd to the enzyme concentration was found at constant concentration of the substrate, while practically the same value of kd = 0.086 was at the substrate concentrations from 2.5 to 10 g/L at E = 15 mg/L. The independence of kd on the substrate concentration was explained by the saturation of the enzyme at the used concentrations of β-LG (Figure 3a). The proportionality of the demasking rate constant to the enzyme concentration was found, as it should be for a process that is controlled by the enzymatic step (Figure 3b).

2.3. Comparison of β-LG and β-CN Proteolysis Patterns

It is interesting to elucidate the differences in the proteolysis of globular β-LG and structure-disordered β-casein. The characteristic of enzymatic hydrolysis of various protein substrates is usually given by comparing the dependences of the degree of hydrolysis (HD) on the time of hydrolysis [27,28]. For β-LG and β-CN, the dependences of HD(t) are similar (Figure 4a), being typical for proteolysis. For 1.5 h of proteolysis by trypsin at the concentrations of enzyme 5 mg/L for β-LG and 0.25 mg/L for β-CN, the degrees of hydrolysis were close (6.5% for β-LG and 7.9% for β-CN). The dependences HD(t) could be approximated by a simple function with two empirical parameters [29], where the rate of hydrolysis was assumed to be proportional to the exponential term exp(-b·DH). The values of parameter b for β-LG and for β-CN were close (0.36 ± 0.02 for β-LG and 0.39 ± 0.02 for β-CN). Thus, there was no significant difference in the form of function HD(t), which explains the known spectroscopic differences in tryptic hydrolysis of these two substrates [2,3,4].
In contrast to DH(t), the dependences λmax(t) for β-CN and for β-LG were found to be different (Figure 4b). The monotonously increasing function λmax(t) belonged to β-LG, while for β-CN, the dependence first decreased quickly and then increased. We used the bi-exponential function to formally fit the experimental points by imposing two exponential terms, one of which could have been responsible for the fast part of the demasking process:
λ max ( t ) = λ 0 + Δ λ ( 1 e k d t ) + Δ λ f ( 1 e k d f t )
where λ0 is the maximum emission wavelength at the beginning of proteolysis, kd and k d f are the first-order rate constants, and parameters Δλλ > 0) and Δλf are the values that indicate the maximum contributions of the first and second terms to the entire function λmax(t). In the second term of Equation (3), the coefficient Δλf can be positive or negative, ensuring, respectively, an increase or decrease contribution of the second term to λmax(t). The first main term in Equation (3), which always has a positive value of the parameter Δλ, is responsible for demasking due to progress in protein opening, as described below.
The fitting of the experimental data by Equation (3) allowed us to quantify two exponential terms (Table 2). The process corresponding to the second term was faster in relation to the first one, since k d f was much higher than kd for both substrates ( k d f / k d = 8.8 for β-LG and k d f / k d = 10.6 for β-CN). The contribution of the fast second term (Δλf) was found to be negative for β-CN, while for β-LG, both terms (Δλ and Δλf) were positive. The negative second term could be explained by a decrease in the polarity of Trp residues as a result of aggregation or refolding of the fragments of the partially hydrolyzed protein substrate. This process was the opposite demasking and may have been responsible for slowing demasking and therefore slowing proteolysis as a whole. The obtained results are supported by other spectroscopic studies for tryptic hydrolysis of β-CN and β-LG [13,14,15].

2.4. Application of Two-Step Proteolysis Model

The two-step proteolysis model provides that peptide bonds are either initially masked or initially demasked at t = 0 [7,12]. The scheme of the cleavage of initially masked bonds is a two-step process with consecutive steps of demasking and hydrolysis: initially masked bonds k d demasked bonds k i C-, N-terminal groups. The scheme of the cleavage of initially demasked bonds includes only the step of hydrolysis: initially demasked bonds k i C-, N-terminal groups [7,12].
To use the two-step proteolysis model, the values of DH and λmax determined in the course of proteolysis are required. The hydrolysis degree DH is (N(t)∙100%)/ΔN, where N(t) is the current concentration of amino nitrogen (N = 0 at t = 0), ΔN is the concentration of amino nitrogen for fully hydrolyzed substrate. The degree of masking of peptide bonds (x) is:
x ( t ) = λ max ( t ) λ 0 Δ λ
where λ0 and Δλ are the constant values from Equation (2).
The experimental dependence of d = DH/100 on x for the hydrolysis of β-LG is presented in Figure 5. The best fit of the experimental points according to Equation (5) was found with the following values of the parameters: n = 0.207 ± 0.057, m = 0.558 ± 0.028, and kd/kh = 0.0496 ± 0.029 (r2 = 0.995). In general, the two-step proteolysis model determines one basic demasking process and predicts its parameters, including the ratio of the rate constants of demasking and hydrolysis (kd/kh). Obviously, this basic process corresponds to the first term in Equation (3) responsible for the slow part of the demasking. The value n = 0.207 meant that near 20% of the specific bonds were resistant to hydrolysis (Lys-Pro and some Lys-X or Arg-X bonds with poor secondary specificity). In addition to Lys47-Pro48 bond, such bonds were found in the tryptic hydrolysates of β-LG, which remained after a considerable duration of proteolysis (Lys-Lys, Lys-Ile, Lys-Phe, Lys-Trp [22]). The value m = 0.558 meant that more than 50% of the specific peptide bonds participated in the fast demasking and, in accordance with the formalism of the two-step model, these bonds were initially demasked. These bonds could be recognized by the identification of rapidly released peptides at the beginning of proteolysis {f(1–8), f(71–75), f(142–148), etc. [23]}.
Thus, the simulation of experimental data by the two-step proteolysis model gave a realistic picture of the tryptic hydrolysis of β-LG, where the predicted demasking process corresponded to the slow term in Equation (3). The fast part of the λmax(t) function was presented in the two-step model as an instantaneous process that gave a significant amount of initially demasked bonds (>50%) at d = 0.

2.5. Prediction of the Kinetics of Peptide Release

To predict the release of peptides during proteolysis, we used the approach previously tested for the proteolysis of β-CN by trypsin [30]. This approach required first estimating the probabilities of cleavage for two peptide bonds, the hydrolysis of which gave the analyzed peptide fragment. In the absence of specific peptide bonds within this fragment, the product of these probabilities was the probability of release for this peptide. In the framework of the two-step proteolysis model, the probability Pi of the cleavage of bond i could be calculated using Equation (8) (Figure 6a).
To perform the calculations, it is necessary to know the ratio kd/ki = (kd/kh)/(ki/kh). Taking into account the obtained parameter kd/kh = 0.0496, the ratio kd/ki is 0.0496/1 = 0.0496 for high-specific bonds, 0.0496/0.1 = 0.496 for intermediate-specific bonds, and 0.0496/0.02 = 2.48 for low-specific peptide bonds. These values were used to calculate the probabilities of bond cleavage as a function of the dimensionless time τ [Pi(τ), Figure 6a]. Simulation of the kinetics of peptide release was carried out by calculating the products Pi(τPj(τ) for i = 1, j = 1 (two bonds of high specificity), i = 1, j = 2 (bonds of high and intermediate specificity), i = 2, j = 2 (two bonds of intermediate specificity), i = 1, j = 3 (bonds of high and low specificity), i = 2, j = 3 (bonds of intermediate and low specificity), and i = 3, j = 3 (two bonds of low specificity) (Figure 6b).
The release of peptides in the course of proteolysis was an exponentially similar curve if both hydrolyzed bonds had high or intermediate specificities, and also if these bonds had high and intermediate specificities (Figure 6b). Along with exponentially similar dependences, it was found that the dependences for less specific bonds were of a lag-type (Figure 6b). The most pronounced lag-type effect was predicted in the case of two low-specific bonds (i = j = 3). The existence of lag-type curves is usually not emphasized when analyzing the results of proteolysis. A characteristic feature of such dependencies with a lag is that the peptide release at the beginning of the process is slow, and then the rate of peptide release increases and reaches a maximum in the middle of the proteolysis process. The lag-type kinetics is characterized by the fact that the release of the peptide at the beginning of the process is slow, and then the release rate increases and reaches a maximum in the middle of the proteolysis process.
The existence of lag-type kinetics for some peptides is a consequence of the masking and the subsequent demasking of peptide bonds. This follows from our theoretical analysis of the cleavage of individual peptide bonds according to the two-step model. The release of peptides with a lag could be seen from the experimental dataset for the tryptic proteolysis of β-LG [23]. These peptides were: f(136–138), f(125–135), f(15–20), f(79–83), f(21–40).

3. Discussion

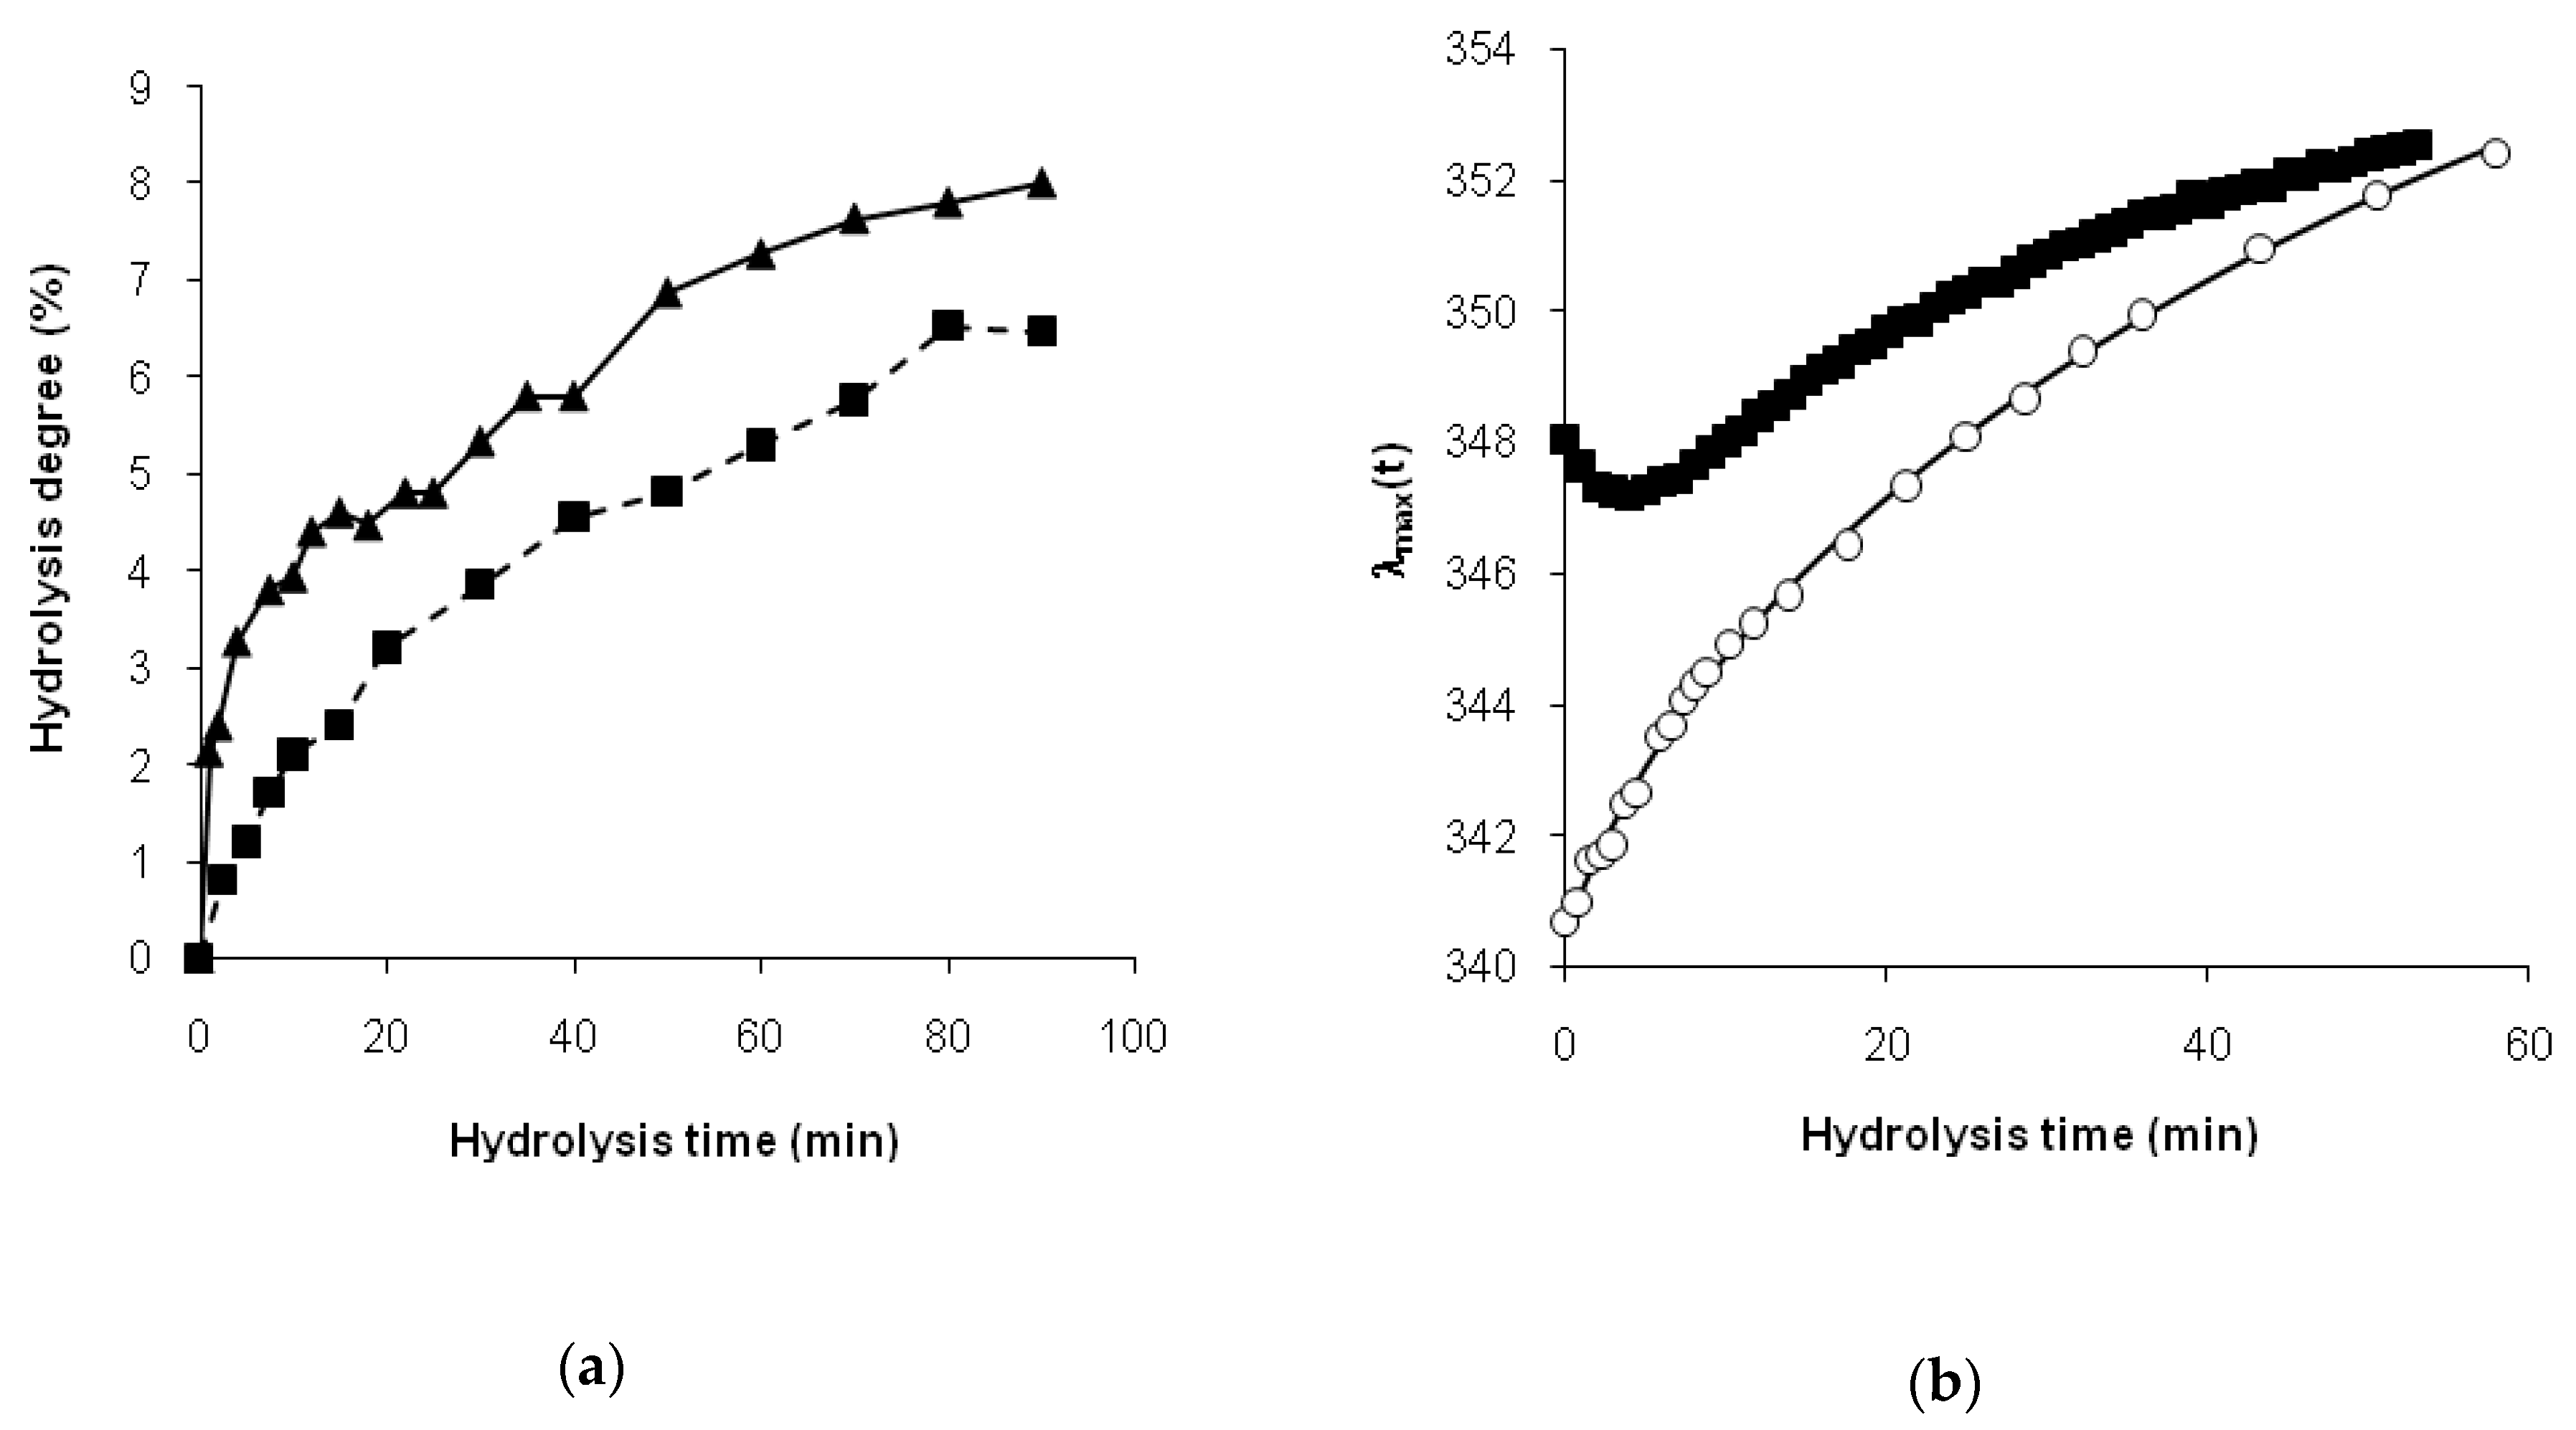
The hydrolysis of β-LG by trypsin was the case when the intact protein and relatively short peptide fragments [f(1–8), f(9–14), f(15–40), f(41–70), f(71–75), f(76–138), f(139–141), f(142–148), f(149–162)] were present in the reaction mixture, whereas longer peptides, combinations of these peptide fragments, did not accumulate [23]. The conversion of β-LG into its fragments could be satisfactorily described by a limited number of differential equations without taking into account the accumulation and consumption of long intermediate fragments [23]. This picture is quite realistic for the “one-by-one” mechanism, which we used to process the fluorescence spectra. In this mechanism of proteolysis, the degradation of the protein globule limits the demasking process. The complication of the “one-by-one” mechanism may be in considering the incomplete disruption of the globule with the conservation of a certain core [31] that is more resistant to hydrolysis. In this case, the demasking kinetics can be bimodal, consisting of two processes with different rates. A good approximation of the demasking kinetics by Equation (3) with fast and slow exponential terms supports this idea.
For the hydrolysis of β-CN, the relatively short period of the reduction in λmax(t) could be explained by the aggregation of the rests of β-casein molecules after the loss of its charged N-terminal moieties as a result of the relatively rapid hydrolysis of the Arg25-Ile26 bond [13,30]. This remarkable trypsinolysis of β-CN process of aggregation in combination with the degradation of the initial casein micelles was monitored in detail by the static light scattering [32]. It was shown that aggregates were formed when the concentration of trypsin was low enough to provide an overall low rate of hydrolysis in order to obtain time for the formation of aggregates [32]. Casein micelles and aggregates—as structural elements with limited openness—may have retarded proteolysis, limiting the accessibility of peptide bonds. In the result of degradation of aggregates, the peptide bonds became accessible for enzyme attack, passing from a masked state to a demasked one. Our previous FTIR absorption data at 1632 cm−1 demonstrated a non-monotonic change in the concentration of β-sheets during trypsinolysis of β-CN, i.e., an increase and a subsequent decrease in β-structures [15], which was consistent with the obtained fluorescence data.
Thus, we found that the read shift of tryptophan fluorescence in the course of proteolysis, estimated as the dependence of the wavelength of fluorescence maximum on the hydrolysis time, was significantly different for tryptic proteolysis of β-LG and β-CN. This difference was explained by different demasking scenarios for these substrates.
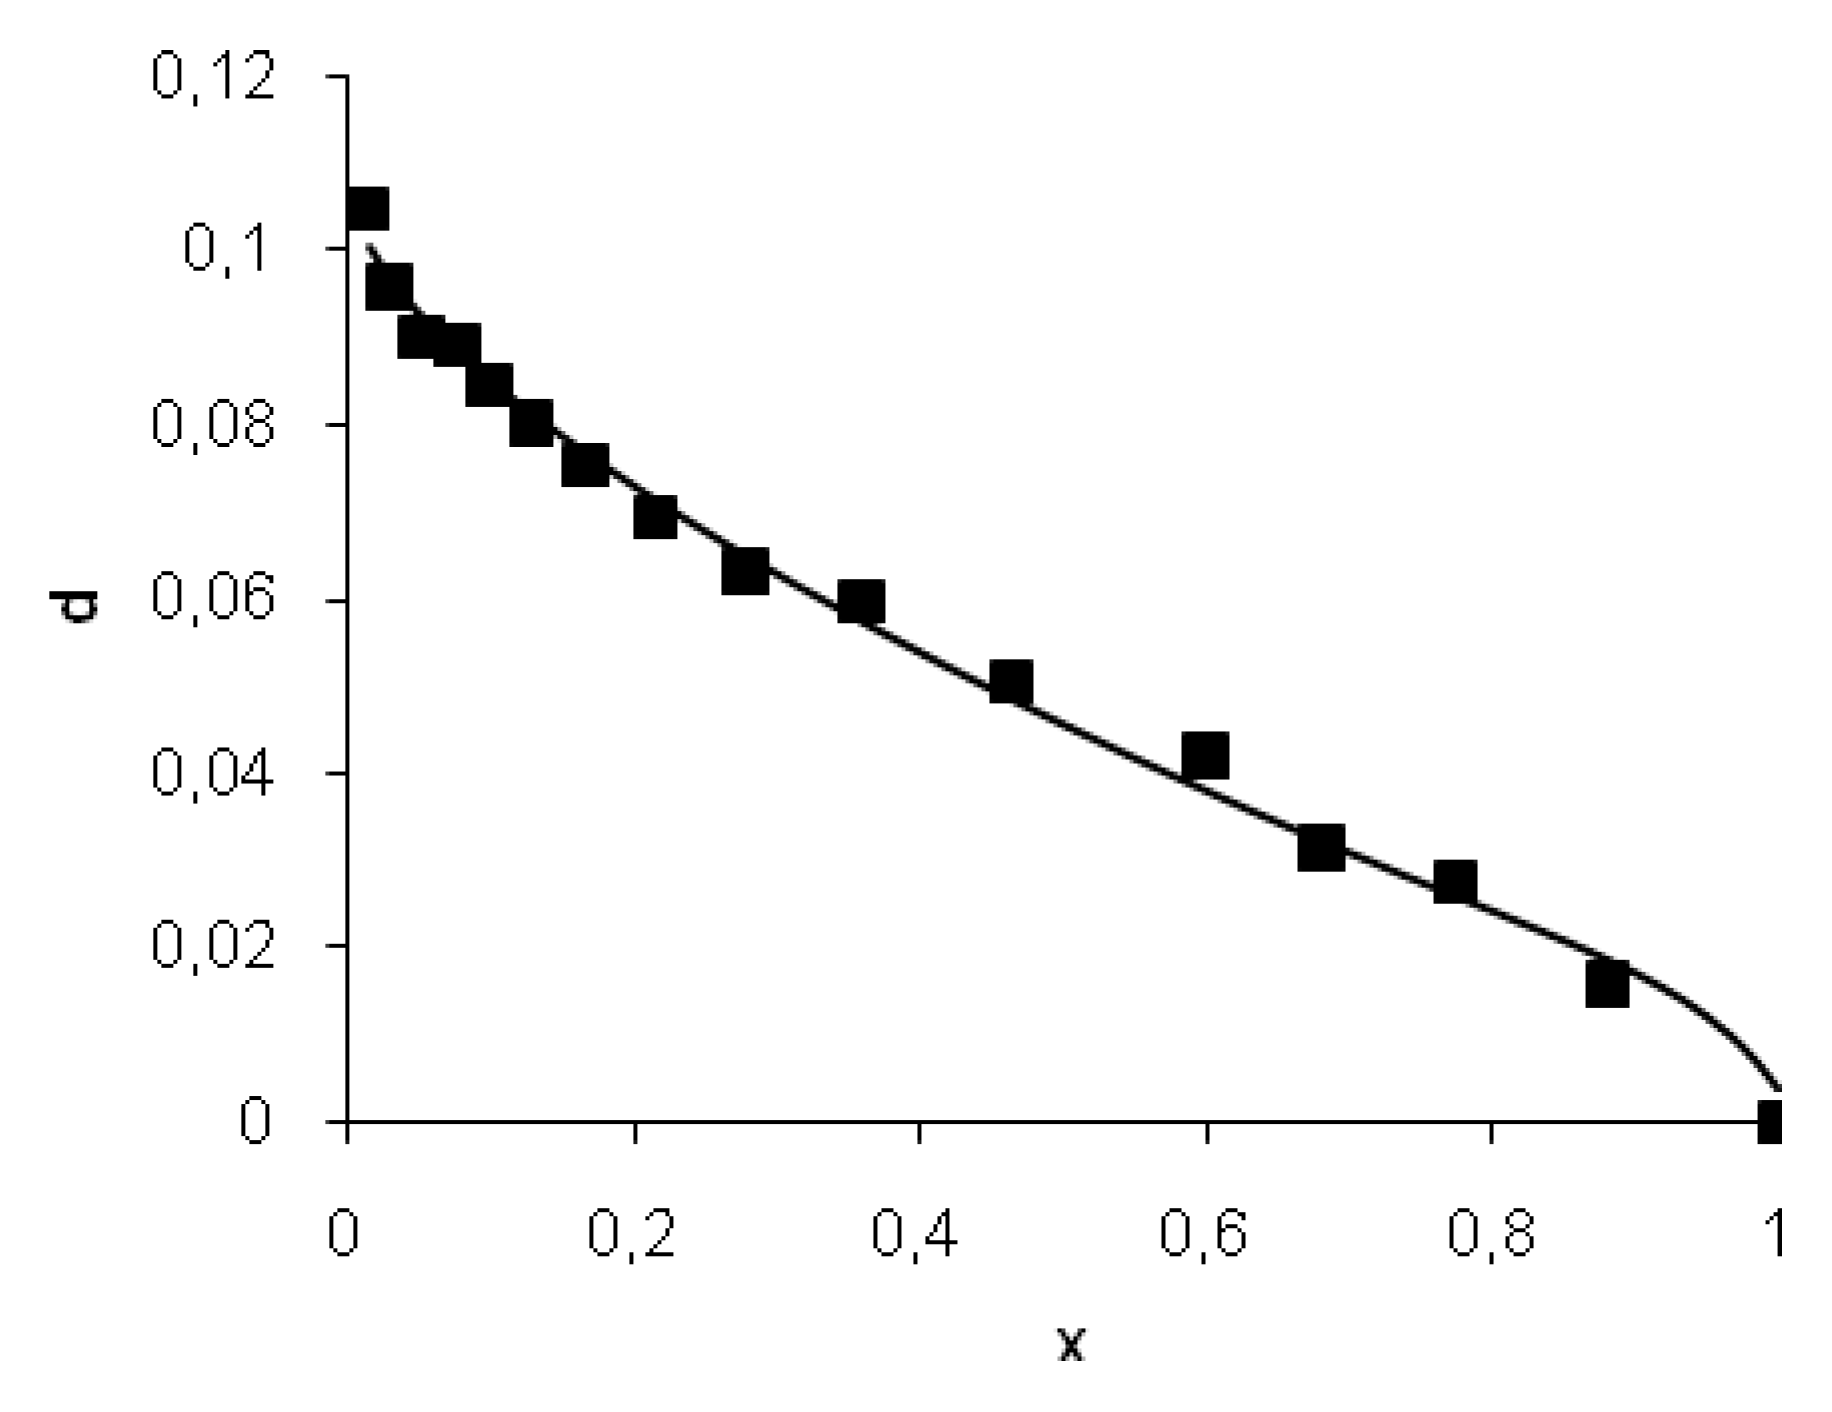
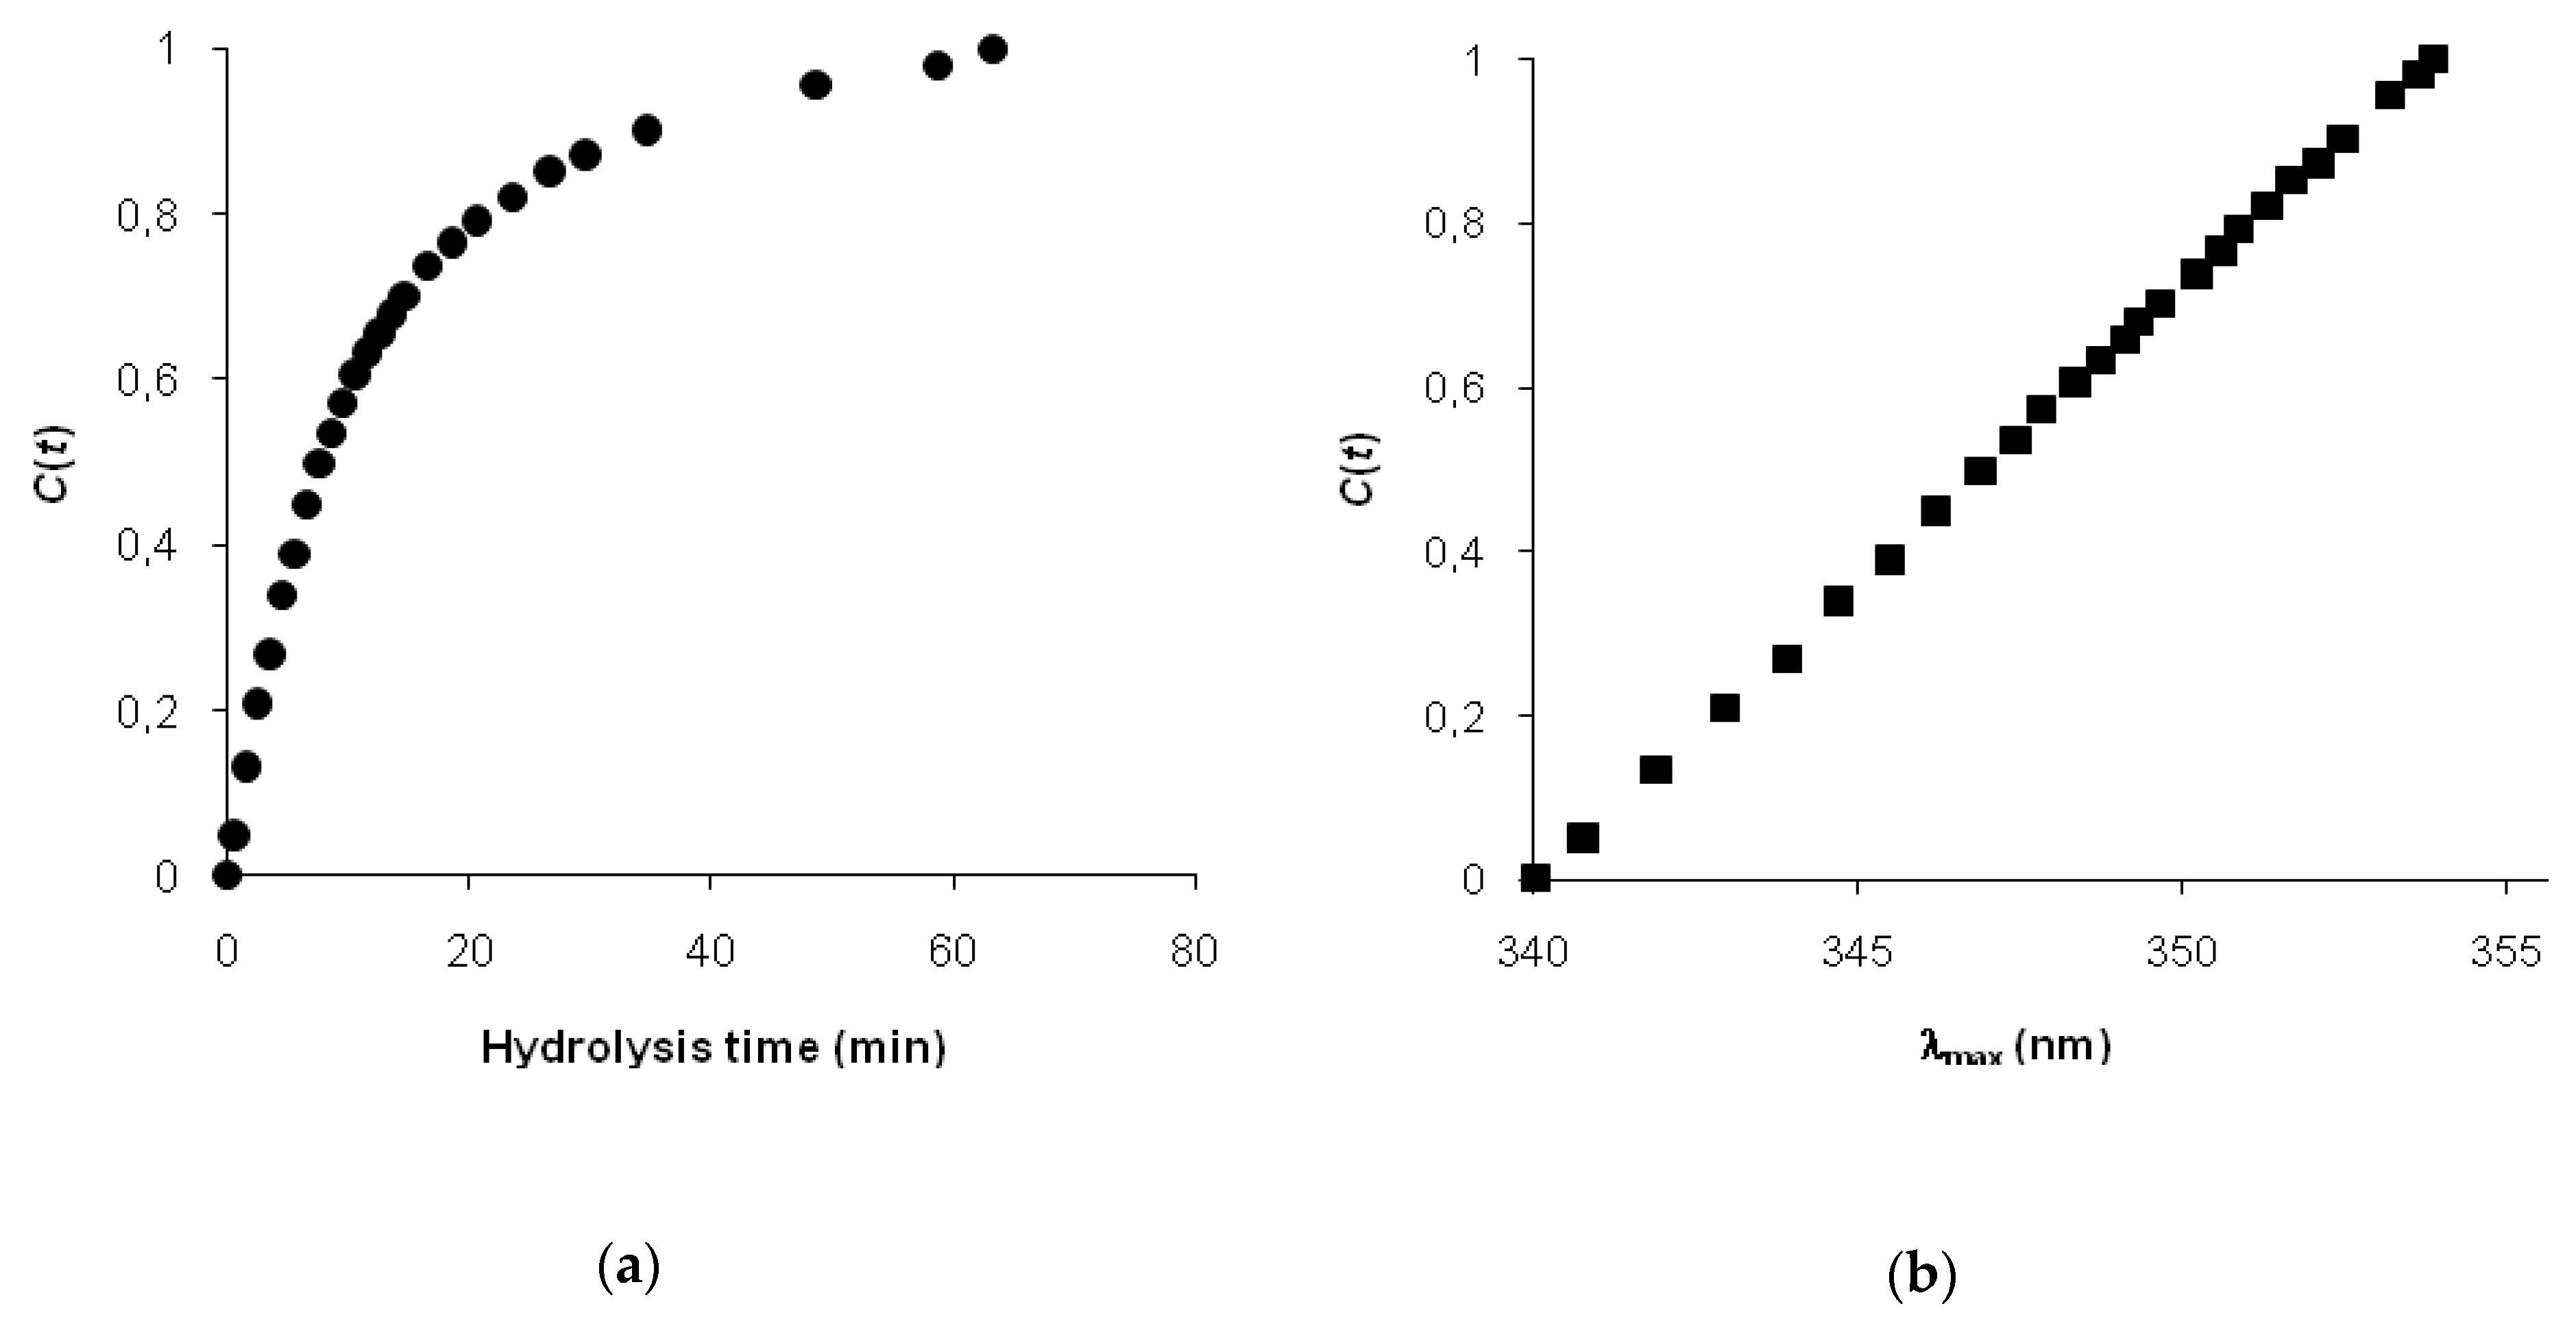
The difference in proteolysis mechanisms for different protein substrates should be especially noticeable at the initial stage of proteolysis, where spectral methods are able to monitor conformational changes. We demonstrated that fluorescence spectroscopy is quite appropriate for this purpose, both on a quantitative and a qualitative level. At a qualitative level, we can compare λmax(t) functions using empirical equations, such as Equation (3), as was demonstrated by comparing the proteolysis processes for β-LG and β-CN. At a quantitative level, the best way to use fluorescence data is to calculate the parameter x by Equation (4) and use the two-step proteolysis model.
The hydrolysis of each specific bond of the protein substrate was determined for the proteolysis of the whey protein isolate by Bacillus licheniformis protease [33]. It was determined precisely by mass-spectroscopy technique using a set of kinetic curves for all peptides arising from the cleavage of the analyzed bond. A significant difference in the selectivity parameters for different peptide bonds was reported [33]. In the present study, we took into account three categories of the hydrolysis rate constants, as in the previous publication [13], whereas the Equation (5) could be used for more types of peptide bonds. Measuring selectivity parameters can help determine the hydrolysis rate constants used in the two-step model. However, the relationship between the selectivity values and the hydrolysis rate constants is not simple in the presence of masking effect [34].
The complexity of the modeling of proteolysis lies in the large number of elementary acts that make up proteolysis. Even if it were possible to determine the full set of kinetic parameters for the main peptide bonds in the main peptide fragments, this would not be enough since we need to know at which point of proteolysis these fragments can be attacked by the enzyme. Therefore, information on the demasking of peptide bonds is absolutely necessary. An alternative to the complete kinetic description of proteolysis is the use of simple empirical models containing only a few parameters, such as the exponential model [29]. These parameters can be accurately measured, although they do not make precise sense. Representing the two-step proteolysis model, we propose a compromise between complete kinetic analysis and empirical modeling. The parameters of the two-step model have a certain chemical meaning and can be measured using fluorescence spectroscopy, as shown in this study.

4. Materials and Methods

4.1. Materials

β-LG (L3908), β-CN (C6905) from bovine milk, and trypsin from bovine pancreas (T1426) treated with N-tosyl-L-phenylalanine chloromethyl ketone (TPCK) were purchased from Sigma–Aldrich and used without further treatment. TPCK was used to inhibit the contaminating chymotrypsin activity without affecting the activity of trypsin. Phosphate buffer solution was prepared with doubly distilled water and stored at 4 °C before use. Trypsin solutions were freshly prepared by diluting trypsin in phosphate buffer. All other reagents were of analytical grade and obtained from commercial sources.

4.2. Proteolysis Reaction

The protein substrate (β-lactoglobulin or β-casein) was dissolved in 20 mM phosphate buffer (pH 7.9) at 37 °C by stirring. The enzymatic hydrolysis was carried out in a volume of 2 mL for the determination of amino nitrogen in a bath stirred reactor or in a 1 cm quartz cuvette for fluorescence measurements at various concentrations of the substrate and enzyme. For β-LG, for example, enzymatic hydrolysis with a substrate concentration of 0.25 g/L was initiated by adding 10 µL of trypsin solution (1 g/L) to provide a final enzyme concentration in the reaction mixture of 5.0 mg/L. These conditions were accepted as standard for the proteolysis modeling by the two-step model or for comparing the dependences of the degree of hydrolysis on the time of hydrolysis. To determine the kinetics of demasking at a constant concentration of trypsin, the concentration of β-LG was 1, 0.5, and 0.25 g/L at trypsin concentration of 15 mg/L. To determine the demasking kinetics at a constant concentration of β-LG, the concentration of trypsin was 0.9, 5, and 15 mg/L at β-LG concentration of 0.25 g/L.

4.3. Determination of Hydrolysis Degree by OPA Method

The o-phthalaldehyde (OPA) method for the determination of amino nitrogen is based on the reaction of o-phthalaldehyde and 2-mercaptoethanol with amino groups released during proteolysis [35]. A stock OPA solution was prepared by mixing 25 mL of 100 mM sodium tetrahydroborate, 2.5 mL of 20% sodium dodecyl sulfate (SDS) solution (w/w), 40 mg of OPA, and 100 μL of β-mercaptoethanol. The final volume of OPA solution (50 mL) was adjusted with distilled water.
For the termination of proteolysis after a required time and to monitor the reaction by the OPA-method, 20 μL samples from the proteolysis reactor were placed in the test-tubes with 1 mL of OPA solution, incubated for 5 min at room temperature, and then the absorption values at 340 nm were determined against a blank sample. The latter was prepared in the same way except for the absence of the enzyme. As a result, the dependence of amino nitrogen N(t) on time of hydrolysis was determined. For the determination of ΔN, a complete hydrolysis of proteins in 6N HCl at 110 °C under Argon during 24 h was performed.

4.4. Fluorescence Spectroscopy and Determination of Demasking Kinetics by Fluorescence Measurements

Fluorescence emission during proteolysis was measured using a Perkin-Elmer LS 55 Luminescence Spectrometer (Waltham, MA, USA) at 90° relative to the excitation beam at excitation wavelengths of 280 nm. The spectral bandwidth of the excitation and emission light was set to 10 and 5 nm. A thermostated cuvette holder was used to keep the sample at 37 °C. The emission spectra were recorded at a scanning speed of 150 nm/min.
To determine the wavelength of fluorescence maximum, we used a parabolic function I(λ) = aλ2 + bλ + const for the approximation of fluorescence spectrum, taking only a small area with a bandwidth of 30 nm around the parabola center at λmax = −b/2a [12].

4.5. Kinetic Analysis by Two-Step Proteolysis Model

We used the two-step proteolysis model, which was originally formulated for Arg-X and Lys-X peptide bonds (X is an arbitrary amino acid residue) in protein substrates [7,12]. These bonds include masked peptide bonds, demasked peptide bonds, the peptide bond that are already hydrolyzed for the current moment, and the unhydrolyzable (resistant) bonds.
In the framework of the two-step proteolysis model [7,12], the degree of peptide bond hydrolysis (d = DH/100) and the degree of peptide bond masking (x) are connected by the following equation:
m x ( j 1 + x a j b j a j X 0 j X 0 ) = 1 d n m x
where X 0 j is the initial concentration of masked peptide bonds of the jth type, X0 is the initial concentration of all masked peptide bonds, m is the initial degree of masking (portion of initially masked peptide bonds), and n is the portion of bonds specific but resistant to hydrolysis. aj and bj are the parameters of the two-step model:
a j = k j k h k d k h 1
b j = a j ( 1 n m ) m 1
where kh is the maximum hydrolysis constant, kj/kh is the relative hydrolysis rate constant for j-type bonds, and kd/kh is the relative rate constant of demasking, which is proposed to be the same for any type of peptide bonds j.
The model includes independent variables d and x, which were determined using measurements of amino nitrogen and maximum fluorescence wavelength. The model parameters kj/kh and X 0 j / X 0 are the constant values. In the result of modeling, the parameters n, m, and kd/kh were determined by the fitting of experimental data with Equation (5).
For trypsin, specific amino acid residues are Arg and Lys, for which the hydrolysis rate constants kj are not equal to 0. We assumed that the hydrolysis rate constants for Arg-X and Lys-X bonds roughly fall into the categories of high, intermediate, and low specific bonds among 161 peptide bonds of β-LG (3 Arg-X and 15 Lys-X bonds). For highly specific bonds, k1/kh = 1 (1/3 part of specific bonds, X 0 1 / X 0 = 0.0373). For intermediate specific bonds, k2/kh = 0.1 (1/3 part of specific bonds, X 0 2 / X 0 = 0.0373), and for weakly specific bonds, k3/kh = 0.02 (1/3 part of specific bonds, X 0 3 / X 0 = 0.0373). For non-specific bonds (other 143 bonds in β-LG), X 0 4 / X 0 = 0.8881 and k4/kh = 0. Estimates of the hydrolysis rate constants were taken from our previous study for proteolysis of β-CN [12].

4.6. Prediction of the Cleavage of Individual Peptide Bonds

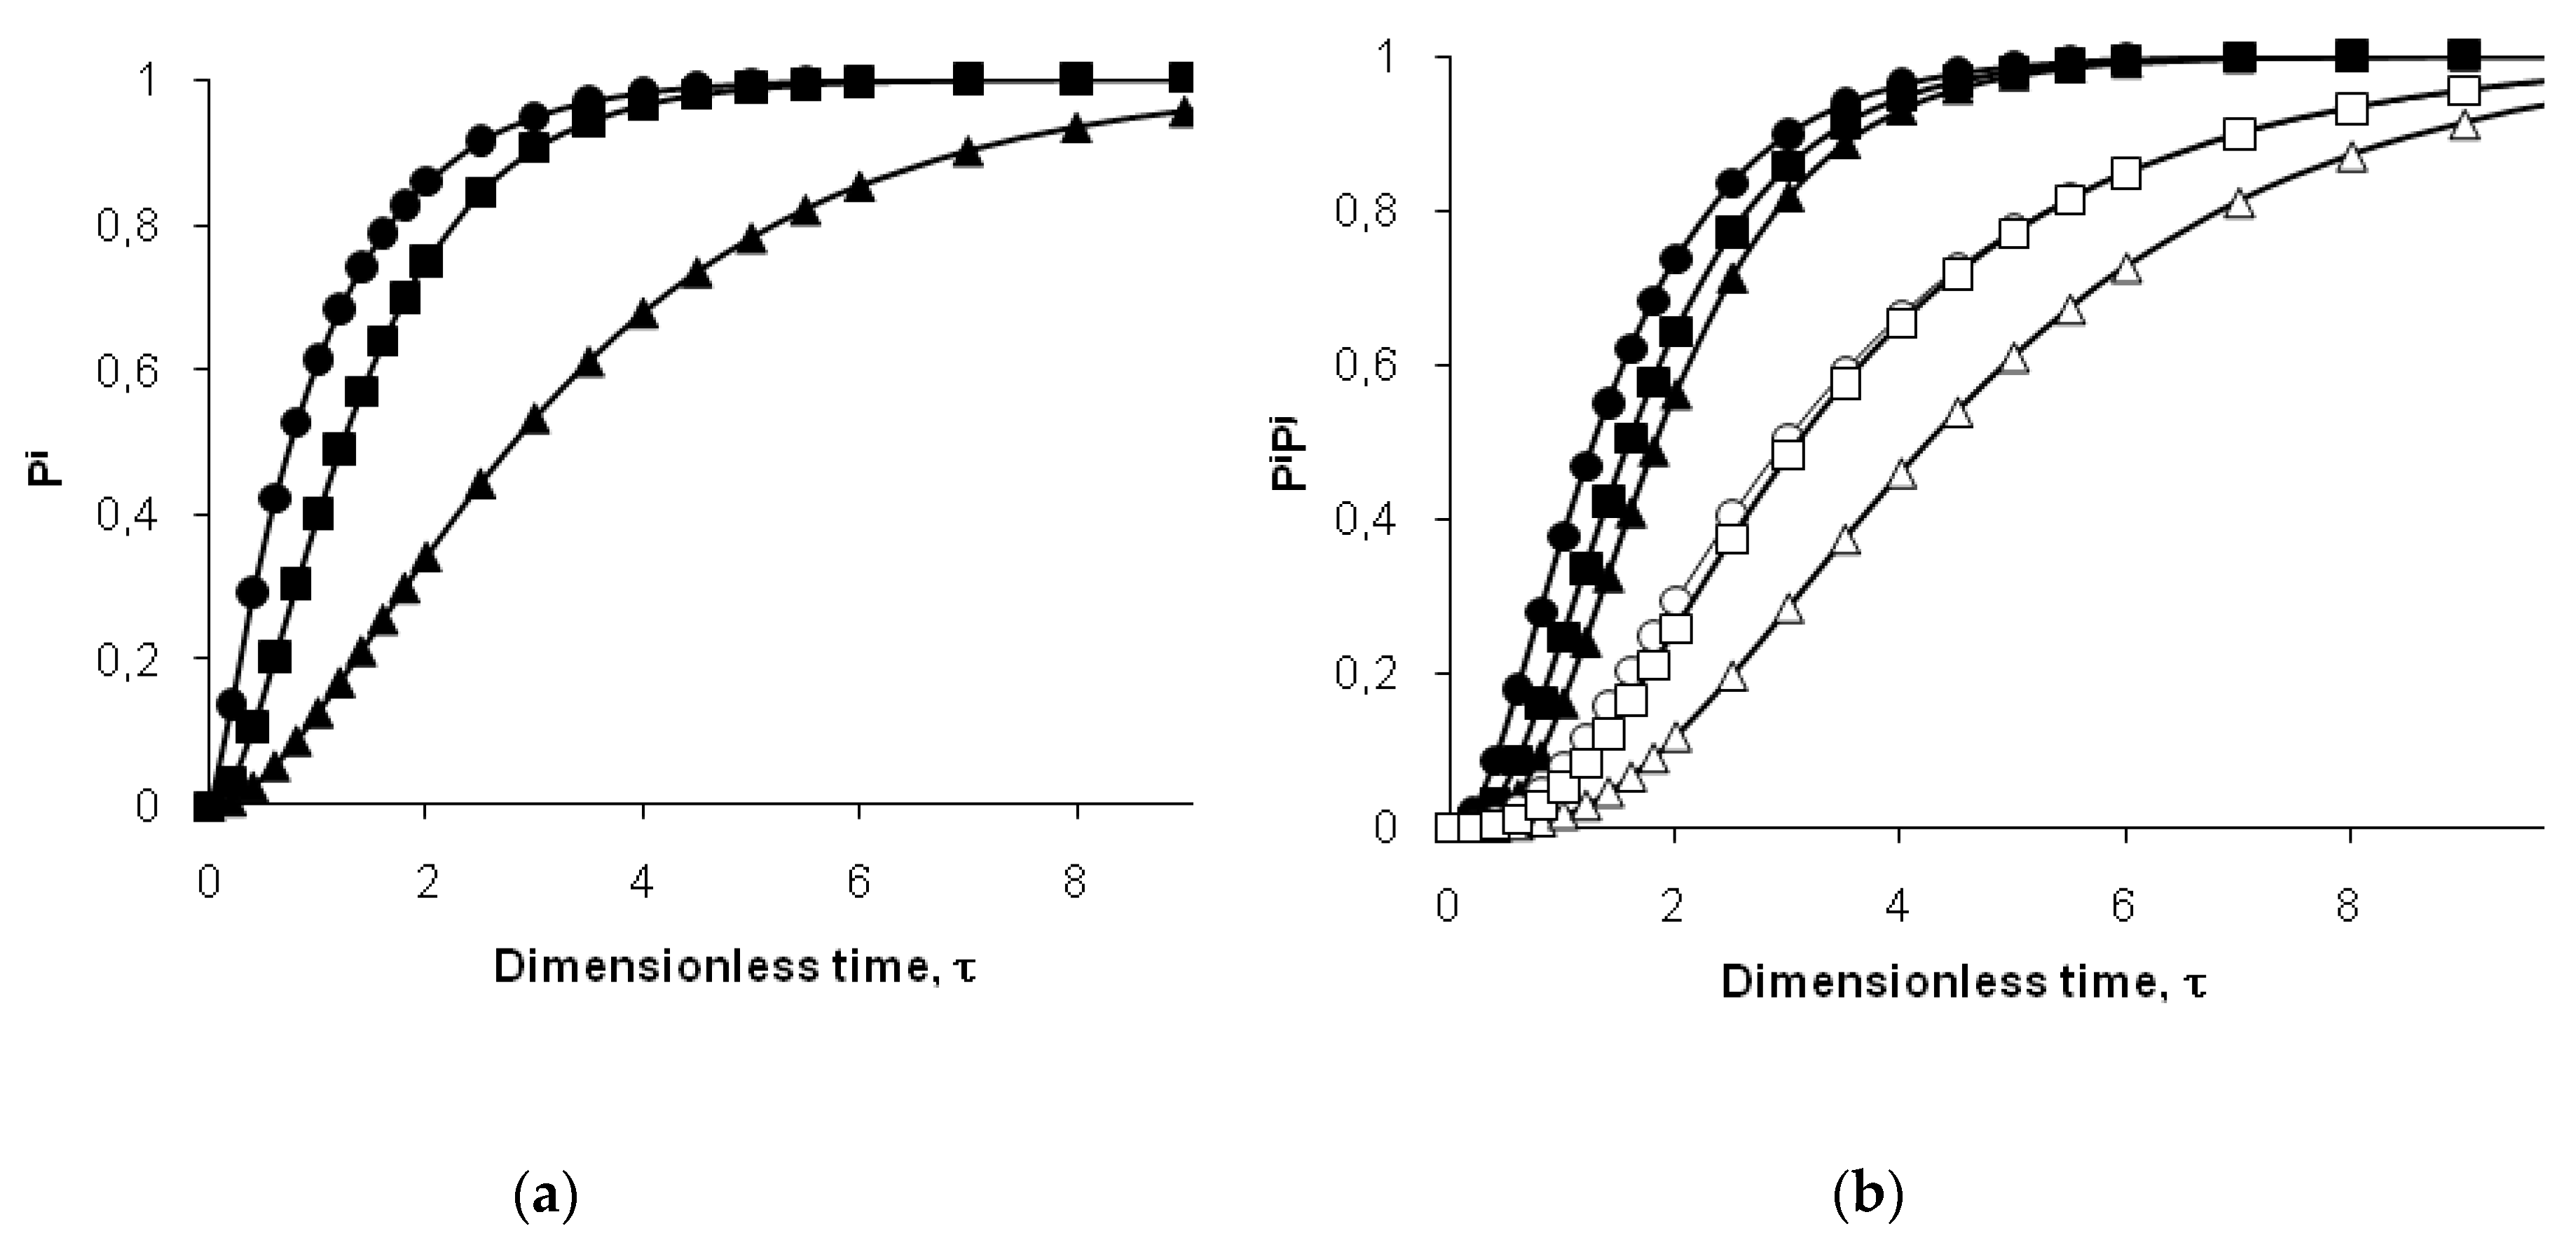
To predict the probability of cleavage (Pi) for peptide bond i, we used a version of the two-step model for individual bonds, which was previously tested for the hydrolysis of whey proteins by Bacillus licheniformis protease [34]. In this case, ki is the rate constant of hydrolysis for the peptide bond i in demasked state. The rate constant kd is the rate constant of demasking for the site that masks the hydrolysis of bond i. [34]. It is assumed that all bonds of type i are masked at the beginning of proteolysis. The evolution of the probability of cleavage with hydrolysis time t is [34]:
P i ( t ) = 1 k i k i k d e k d t + k d k i k d e k i t
Using the dimensionless time of hydrolysis (τ = tkd), Pi from Equation (8) can be represented as a function of the variable τ and the parameter kd/ki:
P i ( τ ) = 1 1 1 k d k i e τ + k d k i 1 k d k i e τ k d k i
The parameters of non-linear equations were calculated by the method of non-linear least squares fitting (Origin 5.0).

Funding

This research was funded by Russian Foundation for Basic Research (RFBR), grant number 16-03-00061.

Conflicts of Interest

The author declares no conflict of interest.

References

  1. Adler-Nissen, J. Enzymatic Hydrolysis of Food Proteins; Elsevier Applied Science Publishers: London, UK, 1986; ISBN 0853343861. [Google Scholar]
  2. Hedstrom, L. Serine protease mechanism and specificity. Chem. Rev. 2002, 102, 4501–4524. [Google Scholar] [CrossRef] [PubMed]
  3. Rawlings, N.D.; Barrett, A.J. Proteolytic Enzymes: Serine and Cysteine Peptidases; Elsevier: New York, NY, USA, 1994. [Google Scholar]
  4. Polgár, L. The catalytic triad of serine peptidases. Cell. Mol. Life Sci. 2005, 62, 2161–2172. [Google Scholar] [CrossRef] [PubMed]
  5. Olsen, J.V.; Ong, S.-E.; Mann, M. Trypsin cleaves exclusively C-terminal to arginine and lysine residues. Mol. Cell. Proteom. 2004, 3, 608–614. [Google Scholar] [CrossRef] [PubMed]
  6. Stryer, L. Biochemistry, 3rd ed.; W.H. Freeman and Company: New York, NY, USA, 1988; ISBN 0-7167-1843-x. [Google Scholar]
  7. Vorob’ev, M.M. Kinetics of peptide bond demasking in enzymatic hydrolysis of casein substrates. J. Mol. Catal. B 2009, 58, 146–152. [Google Scholar] [CrossRef]
  8. Fennema, O.R. Food Chemistry, 3rd ed.; Marcel Dekker: New York, NY, USA, 1996. [Google Scholar]
  9. Bhattacharjee, C.; Das, K.P. Thermal unfolding and refolding of β-lactoglobulin an intrinsic and extrinsic fluorescence study. Eur. J. Biochem. 2000, 267, 3957–3964. [Google Scholar] [CrossRef] [PubMed]
  10. Cheison, S.; Lai, M.; Leeb, E.; Kulozik, U. Hydrolysis of β-lactoglobulin by trypsin under acidic pH and analysis of the hydrolysates with MALDI–TOF–MS/MS. Food Chem. 2011, 125, 1241–1248. [Google Scholar] [CrossRef]
  11. Hambling, S.G.; McAlpine, A.S.; Sawyer, L. B-lactoglobulin. In Advanced Dairy Chemistry, Proteins; Fox, P.F., Ed.; Elsevier: Essex, UK, 1992; Volume 1, pp. 141–190. [Google Scholar]
  12. Vorob’ev, M.M.; Vogel, V.; Güler, G.; Mäntele, W. Monitoring of demasking of peptide bonds during proteolysis by analysis of the apparent spectral shift of intrinsic protein fluorescence. Food Biophys. 2011, 6, 519–526. [Google Scholar] [CrossRef]
  13. Vorob’ev, M.M.; Strauss, K.; Vogel, V.; Mäntele, W. Demasking of peptide bonds during tryptic hydrolysis of β-casein in the presence of ethanol. Food Biophys. 2015, 10, 309–315. [Google Scholar] [CrossRef]
  14. Güler, G.; Vorob’ev, M.M.; Vogel, V.; Mäntele, W. Proteolytically-induced changes of secondary structural protein conformation of bovine serum albumin monitored by Fourier transform infrared (FT-IR) and UV-circular dichroism spectroscopy. Spectrochim. Acta A Mol. Biomol. Spectrosc. 2016, 161, 8–18. [Google Scholar] [CrossRef] [PubMed]
  15. Güler, G.; Dzafic, E.; Vorob’ev, M.M.; Vogel, V.; Mäntele, W. Real time observation of proteolysis with Fourier transform infrared (FT-IR) and UV-circular dichroism spectroscopy: Watching a protease eat a protein. Spectrochim. Acta A Mol. Biomol. Spectrosc. 2011, 79, 104–111. [Google Scholar] [CrossRef]
  16. Wubshet, S.G.; Mage, I.; Bocker, U.; Lindberg, D.; Knutsen, S.H.; Rieder, A.; Rodriguez, D.A.; Afseth, N.K. FTIR as a rapid tool for monitoring molecular weight distribution during enzymatic protein hydrolysis of food processing by-products. Anal. Methods 2017, 9, 4247–4254. [Google Scholar] [CrossRef]
  17. Poulsen, N.A.; Eskildsen, C.E.; Akkerman, M.; Johansen, L.B.; Hansen, M.S.; Hansen, P.W.; Skov, T.; Larsen, L.B. Predicting hydrolysis of whey protein by mid-infrared spectroscopy. Int. Dairy J. 2016, 61, 44–50. [Google Scholar] [CrossRef]
  18. Lotte, K.; Plessow, R.; Brockhinke, A. Static and time-resolved fluorescence investigations of tryptophan analogues—A solvent study. Photochem. Photobiol. Sci. 2004, 3, 348–359. [Google Scholar] [CrossRef] [PubMed]
  19. Vivian, J.T.; Callis, P.R. Mechanisms of tryptophan fluorescence shifts in proteins. Biophys. J. 2001, 80, 2093–2109. [Google Scholar] [CrossRef]
  20. Caessens, P.; Daamen, W.; Gruppen, H.; Visser, S.; Voragen, A. β-Lactoglobulin hydrolysis. 2. Peptide identification, SH/SS exchange, and functional properties of hydrolysate fractions formed by the action of plasmin. J. Agric. Food Chem. 1999, 47, 2980–2990. [Google Scholar] [CrossRef]
  21. Caessens, P.; Visser, S.; Gruppen, H.; Voragen, A. β-Lactoglobulin hydrolysis. 1. Peptide composition and functional properties of hydrolysates obtained by the action of plasmin, trypsin, and Staphylococcus aureus V8 protease. J. Agric. Food Chem. 1999, 47, 2973–2979. [Google Scholar] [CrossRef] [PubMed]
  22. Cheison, S.; Schmitt, M.; Leeb, E.; Letzel, T.; Kulozik, U. Influence of temperature and degree of hydrolysis on the peptide composition of trypsin hydrolysates of β-lactoglobulin: Analysis by LC-ESI-TOF/MS. Food Chem. 2010, 121, 457–467. [Google Scholar] [CrossRef]
  23. Fernandez, A.; Riera, F. β-Lactoglobulin tryptic digestion: A model approach for peptide release. Biochem. Eng. J. 2013, 70, 88–96. [Google Scholar] [CrossRef]
  24. Rivera-Burgos, D.; Regnier, F.E. Disparities between immobilized enzyme and solution based digestion of transferrin with trypsin. J. Sep. Sci. 2013, 36, 454–460. [Google Scholar] [CrossRef]
  25. Vorob’ev, M.M. Quantification of two-step proteolysis model with consecutive demasking and hydrolysis of peptide bonds using casein hydrolysis by chymotrypsin. Biochem. Eng. J. 2013, 74, 60–68. [Google Scholar] [CrossRef]
  26. Linderstrom-Lang, K.U. Lane Medical Lectures; Stanford University Press: Stanford, CA, USA, 1952; Volume 6, pp. 53–72. [Google Scholar]
  27. Rutherfurd, S.M. Methodology for determining degree of hydrolysis of proteins in hydrolysates: A review. J. AOAC Int. 2010, 93, 1511–1522. [Google Scholar]
  28. Adler-Nissen, J. Control of the proteolytic reaction and of the level of bitterness in protein hydrolysis processes. J. Chem. Technol. Biotechnol. 1984, 34B, 215–222. [Google Scholar] [CrossRef]
  29. Marquez, M.C.; Fernandez, V. Enzymic hydrolysis of vegetable proteins: Mechanism and kinetics. Process Biochem. 1993, 28, 481–490. [Google Scholar] [CrossRef]
  30. Vorob’ev, M.M.; Dalgalarrondo, M.; Chobert, J.-M.; Haertle, T. Kinetics of β-casein hydrolysis by wild-type and engineered trypsin. Biopolymers 2000, 54, 355–364. [Google Scholar] [CrossRef]
  31. Cheison, S.C.; Leeb, E.; Letzel, T.; Kulozik, U. Influence of buffer type and concentration on the peptide composition of trypsin hydrolysates of β-lactoglobulin. Food Chem. 2011, 125, 121–127. [Google Scholar] [CrossRef]
  32. Vorob’ev, M.M.; Vogel, V.; Mäntele, W. Demasking rate constants for tryptic hydrolysis of β-casein. Int. Dairy J. 2013, 30, 33–38. [Google Scholar] [CrossRef]
  33. Butre, C.I.; Sforza, S.; Gruppen, H.; Wierenga, P.A. Introducing enzyme selectivity: A quantitative parameter to describe enzymatic protein hydrolysis. Anal. Bioanal. Chem. 2014, 406, 5827–5841. [Google Scholar] [CrossRef]
  34. Vorob’ev, M.M.; Butré, C.I.; Sforza, S.; Wierenga, P.A.; Gruppen, H. Demasking kinetics of peptide bond cleavage for whey protein isolate hydrolysed by Bacillus licheniformis protease. J. Mol. Catal. B 2016, 133, 426–431. [Google Scholar] [CrossRef]
  35. Church, F.C.; Swaisgood, H.C.; Porter, D.H.; Catignani, G.L. Spectrophotometric assay using o-phthaldialdehyde for determination of proteolysis in milk and isolated milk proteins. J. Dairy Sci. 1983, 66, 1218–1227. [Google Scholar] [CrossRef]
Figure 1. Fluorescence spectra for native (○) and hydrolysed β-LG for 15 (●) and 90 min (□) of hydrolysis.
Symmetry 11 00153 g001
Figure 2. Treatment of fluorescence spectra: (a) dependence of the fraction of demasked tryptophanes (parameter c) on hydrolysis time; (b) high correlation of c(t) and λmax(t) in the course of β-LG hydrolysis.
Symmetry 11 00153 g002
Figure 3. Dependences of maximum emission wavelength [λmax(t)] on hydrolysis time: (a) enzyme concentration was constant at substrate concentration of 0.25 (●), 0.5 (▲), and 1 (■) g/L; (b) substrate concentration was constant at enzyme concentration of 15 (●), 4.5 (□), and 0.9 (○) mg/L. Solid lines represent the dependences calculated by Equation (2).
Symmetry 11 00153 g003
Figure 4. Comparison of β-LG and β-CN proteolysis kinetics: (a) dependences of hydrolysis degree on hydrolysis time for β-LG (■) and β-CN (▲); (b) dependences of fluorescence shift on hydrolysis time for β-LG (○) and β-CN (■). Solid lines correspond to the two-term equation [Equation (3)].
Symmetry 11 00153 g004
Figure 5. Experimental dependence of the degree of hydrolysis (d = DH/100) on the degree of masking (■). Solid line corresponds to the theoretical dependence obtained in the framework of the two-step proteolysis model [Equation (5)].
Symmetry 11 00153 g005
Figure 6. Simulation of kinetic curves using two-step proteolysis model: (a) simulation of cleavage probabilities for high-specific (i = 1, ●), intermediate-specific (i = 2, ■), and low-specific peptide bonds (i = 3, ▲); (b) simulation of the release of peptides by cleavage of two bonds i and j of various specificities: i = j = 1 (●), i = 1, j = 2 (■), i = j = 2 (▲), i = 1, j = 3 (○), i = 2, j = 3 (□), and i = j = 3 (∆).
Symmetry 11 00153 g006
Table 1. Kinetic parameters of demasking evaluated by Equation (2).
Trypsin Concentration, mg/Lβ-LG Concentration, g/LΔλ, nmkd, min−1r2
15113.45 ± 0.120.0824 ± 0.00210.996
150.512.41 ± 0.110.0855 ± 0.00230.995
150.2513.31 ± 0.110.0907 ± 0.00210.995
50.2513.79 ± 0.300.0326 ± 0.00140.996
0.90.257.06 ± 0.390.0194 ± 0.00160.997
Table 2. Kinetic parameters of demasking evaluated by two-term equation [Equation (3)].
SubstrateΔλ, nm kd, min−1Δλf, nm k d f ,   min 1 r2 k d f / k d
β-LG14.79 ± 0.490.0197 ± 0.00321.67 ± 0.610.174 ± 0.0650.9998.8
β-CN8.23 ± 0.040.0340 ± 0.0021−2.48 ± 0.080.361 ± 0.0150.99910.6

