Article

Human Visual Perception-Based Multi-Exposure Fusion Image Quality Assessment

School of Electronic and Information Engineering, Taizhou University, Taizhou 318017, China
*
Author to whom correspondence should be addressed.
Symmetry 2019, 11(12), 1494; https://doi.org/10.3390/sym11121494
Submission received: 19 November 2019 / Revised: 4 December 2019 / Accepted: 6 December 2019 / Published: 9 December 2019

Abstract

:
Compared with ordinary single exposure images, multi-exposure fusion (MEF) images are prone to color imbalance, detail information loss and abnormal exposure in the process of combining multiple images with different exposure levels. In this paper, we proposed a human visual perception-based multi-exposure fusion image quality assessment method by considering the related perceptual features (i.e., color, dense scale invariant feature transform (DSIFT) and exposure) to measure the quality degradation accurately, which is closely related to the symmetry principle in human eyes. Firstly, the L1 norm of chrominance components between fused images and the designed pseudo images with the most severe color attenuation is calculated to measure the global color degradation, and the color saturation similarity is added to eliminate the influence of color over-saturation. Secondly, a set of distorted images under different exposure levels with strong edge information of fused image is constructed through the structural transfer, thus DSIFT similarity and DSIFT saturation are computed to measure the local detail loss and enhancement, respectively. Thirdly, Gauss exposure function is used to detect the over-exposure or under-exposure areas, and the above perceptual features are aggregated with random forest to predict the final quality of fused image. Experimental results on a public MEF subjective assessment database show the superiority of the proposed method with the state-of-the-art image quality assessment models.

1. Introduction

Natural scenes usually have a wide brightness range from 10−5 cd/m2 to 108 cd/m2, but it is difficult for the existing imaging devices to acquire all parts of scene information at the single exposure situation due to the limitation of its own dynamic range [1]. Multi-exposure fusion (MEF), as an effective quality enhancement technology, is able to integrate multiple low dynamic range (LDR) images under different exposure levels captured by the normal cameras into a perceptually attractive image and has been successfully applied in various multimedia fields, such as remote sensing, medical imaging, panoramic imaging and HDTV [2,3].
Generally, the performance differences between several MEF algorithms are mainly reflected in the solving process of fusion weights. The simplest local and global energy weighting algorithms obtain weights by measuring the local and global energy among source images. Mertens et al. [4] constructed the weights by considering contrast, saturation and good exposure, and fused multiple images by the multi-scale pyramid model. On this basis, Li et al. [5] made the fused image more realistic subjectively by solving the quadratic optimization problem to enhance the detail information. Gu et al. [6] extracted gradient information from the structural tensor of source images to design the initial weights and smoothed them with edge-preserving filter to prevent the artifacts. Remarkably, different kinds of filters (i.e., bilateral filter [7], recursive filter [8] and guided filter [9]) all solve the problem of spatial consistency from several aspects but produce inconsistent visual experience, respectively. In brief, the above-mentioned MEF algorithms cannot guarantee the achievement of perfect quality of fused images, which are mainly reflected in color, detail and exposure. Hence, in order to further improve the existing MEF algorithms, it is urgent to develop the corresponding MEF image quality assessment (MEF-IQA) metrics in accordance with the human visual system (HVS).
Up to now, a number of IQA methods had been developed for image coding application, which can be divided into three categories: full-reference (FR), reduced-reference (RR) and no-reference (NR) [10]. The FR methods are guided by a distortion-free reference image. The RR methods require a part of reference image information, while the NR methods do not. Evidently, due to the particularity in the process of imaging for MEF images, MEF-IQA can be regarded as the special FR-IQA method with multiple reference images. Therefore, the main challenges in developing the effective MEF-IQA models are how to accurately obtain the real reference information from source image sequences with different exposure levels. However, most existing IQA models in the field of image fusion are suitable for general image fusion, not dedicated to MEF. Hossny et al. [11] predicted the image quality by measuring the mutual information between source images and fused image on different scales. Cvejic et al. [12] utilized the Tsallis entropy to form the quality metric. Inspired by the edge information, Xydeas et al. [13] evaluated the fused image by exploring the edge preservation from source images. Wang et al. [14] and Zheng et al. [15] extracted the multi-directional gradient feature in wavelet domain and spatial domain, respectively. Considering that HVS is highly sensitive to structural degradation with salient objects, Piella et al. [16] combined the visual saliency with structural similarity (SSIM) index to predict the quality of fused image. Unfortunately, most above-mentioned general-purpose fusion IQA (GF-IQA) metrics will be invalid on the condition of more than two source images.
In recent years, with the further exploration in the field of MEF, several perceptual IQA metrics specialized for MEF images have been proposed one after another. Ma et al. [17] constructed the first MEF subjective assessment database, including 17 multi-exposure image sequences and the corresponding fused images generated by 8 classical MEF algorithms. In addition, an objective MEF-IQA method based on SSIM was presented by measuring small-scale structural consistency and large-scale luminance consistency. Xing et al. [18] proposed a multi-scale contrast-based model by integrating the structure similarity and saturation similarity into contrast feature. Taking into account the importance of color for MEF images, Deng et al. [19] combined numerous perceptual features such as color, texture and structure, and carried out the quality regression by extreme learning machine. Although these existing MEF-IQA metrics can more accurately evaluate the performance of different MEF algorithms compared with GF-IQA metrics, the robustness of models in several extreme conditions (e.g., over-saturated color, detail enhancement and under-exposure) cannot be guaranteed. It largely depends on the specific theory that the excessive hue or detail information may appear the unnecessary artifacts in some fused images, and under-exposed areas of images will not only result in information loss but generate unnatural shadows. These terrible quality degradation phenomena will make the perceptual symmetry in human eyes unbalanced.
To overcome these shortcomings, an effective human visual perception-based multi-exposure fusion image quality assessment method is proposed in this paper. Unlike the existing GF-IQA and MEF-IQA metrics, the presented perceptual model thoroughly simulates human visual physiology, including the impact of color, detail and exposure on MEF images. Its main contributions are described as follows:
(1)
The difference of chrominance components between fused images and the defined pseudo images with the most severe color attenuation is calculated to measure the global color degradation, and the color saturation similarity is added to eliminate the influence of over-saturated color.
(2)
A set of distorted source images with strong edge information of fused image is constructed by the structural transfer characteristic of guided filter; thus, structure similarity and structure saturation are computed to measure the local detail loss and enhancement, respectively.
(3)
The Gauss function is designed to accurately detect the over-exposed or under-exposed areas of images; then, the local luminance of each source images and the global luminance of fused image are used to measure the luminance consistency between them.
The remaining of this paper is organized as follows: The proposed MEF-IQA method is investigated in Section 2. The performance comparison between the proposed method and the state-of-the-art ones is described in Section 3. Finally, the conclusion and future work are drawn in Section 4.

2. Proposed Human Visual Perception-Based MEF-IQA Method

It is generally acknowledged that MEF images with ideal quality are rich in color, detail information and exposure, so single perceptual feature is inadequate for accurately evaluating MEF images. In this paper, a human visual perception-based MEF-IQA method is proposed, which mainly consists of color, detail and good exposure metrics, and Figure 1 shows its flowchart. In the first stage, local saturation similarity and global color distortion metric are designed for detecting the unbalanced chrominance of fused images. In the second stage, dense scale invariant feature transform (DSIFT) descriptor is adopted to obtain the local structure information along different directions for each pixel in the images, and DSIFT similarity and DSIFT saturation between the source images and the pseudo reference images with fused image’s strong edge information are calculated at different scales to measure the distortion such as detail loss and detail enhancement. In the third stage, local exposure similarity and global exposure metric are presented by combining the luminance of source images and fused image with Gauss function, respectively. The specific implementation details of the proposed MEF-IQA method are stated in the following four subsections.

2.1. Local and Global Color Metrics

Since HVS is more sensitive to luminance than chrominance, most existing GF-IQA and MEF-IQA models focus on grayscale information, while ignoring the importance of color. Unfortunately, there are distinct color differences between the MEF images formed by different algorithms, and Figure 2 depicts an example of MEF images of sequence “Lamp1” from MEF database. From Figure 2, it can be seen that the image in Figure 2a has a bright and vivid color, while the MEF images in Figure 2b,c are very dim, causing a terrible visual experience. Therefore, the quality assessment for the colorful MEF images will be more reliable, and we adopt the global and local ways to evaluate the color distortion of MEF images in this section.

2.1.1. Global Color Distortion Metric

To extract the chrominance components of MEF images, the RGB color space is first transformed into YCbCr color space that is more in line with human visual characteristics, which is expressed as
[   Y f C b f C r f ] = [ 0.299 0.587 0.114 0.169 0.331 0.500 0.500 0.419 0.081 ] [ R f G f B f ] + [   0 128 128 ]
where Yf is the luminance information, and Cbf and Crf are the two chrominance components.
Evidently, the inverse process from YCbCr color space to RGB space according to Equation (1) can be deduced as
R f = Y f + 1.402 ( C r f 128 ) G f = Y f 0.344 ( C b f 128 ) 0.714 ( C r f 128 ) B f = Y f + 1.772 ( C b f 128 )
where Rf, Gf and Bf are the R, G and B channels of fused image, respectively. From Equation (2), it can be found that the farther away the value of Cbf and Crf are from 128, the more colorful subjectively the fused image will be.
Hence, we utilize the L1 norm between the chrominance components and 128 to approximately measure the global color distortion of fused image, which is calculated by
[ C Cb G , C Cr G ] = 1 N [ ( C b f 128 1 ) , ( C r f 128 1 ) ]
where N is the number of pixels for each chrominance component, 1 is the L1 norm operator, and C Cb G and C Cr G are the two global color distortion metrics for Cbf and Crf, respectively. However, the presented C Cb G and C Cr G will be worthless in the case of over-saturated color, so it is necessary to eliminate this negative effect.

2.1.2. Local Saturation Similarity

According to the related visual psychology research, color saturation can accurately indicate the natural response of HVS to color information. Generally, pixels with high saturation have more vivid color, while pixels with low saturation are dim. Moreover, color saturation S can be simply measured by calculating the standard deviation in the RGB space, which is defined as
S = ( R μ ) 2 + ( G μ ) 2 + ( B μ ) 2 3
where μ is the mean value of R, G and B channels. Thus, the color saturation maps for each source image Ik and fused image If can be computed by Equation (4), which are denoted as {Sk}(k = 1, 2, …, K) and Sf, respectively.
Then, a maximum color saturation map Smax can be calculated from {Sk} as the pseudo reference image with the optimal chrominance and is expressed as
S max ( p ) = max ( S 1 ( p ) , S 2 ( p ) , , S k ( p ) ) ,   k = 1 , 2 , , K
where Sk(p) is the maximum saturation at the position of p for the k-th source image, max(.) is the “select max” operation, and K is the number of source images.
Finally, the local color distortion is evaluated by calculating the similarity between Smax and Sf, thereby eliminating the impact caused by over-saturated color, and the local saturation similarity C SIM L is defined as
C SIM L = mean ( 2 S max ( p ) S f ( p ) + c 1 S max ( p ) 2 S f ( p ) 2 + c 1 )
where mean(.) is the mean operator, and c1 is a constant to control the denominator not to be zero.

2.2. Structure Similarity and Saturation Metric

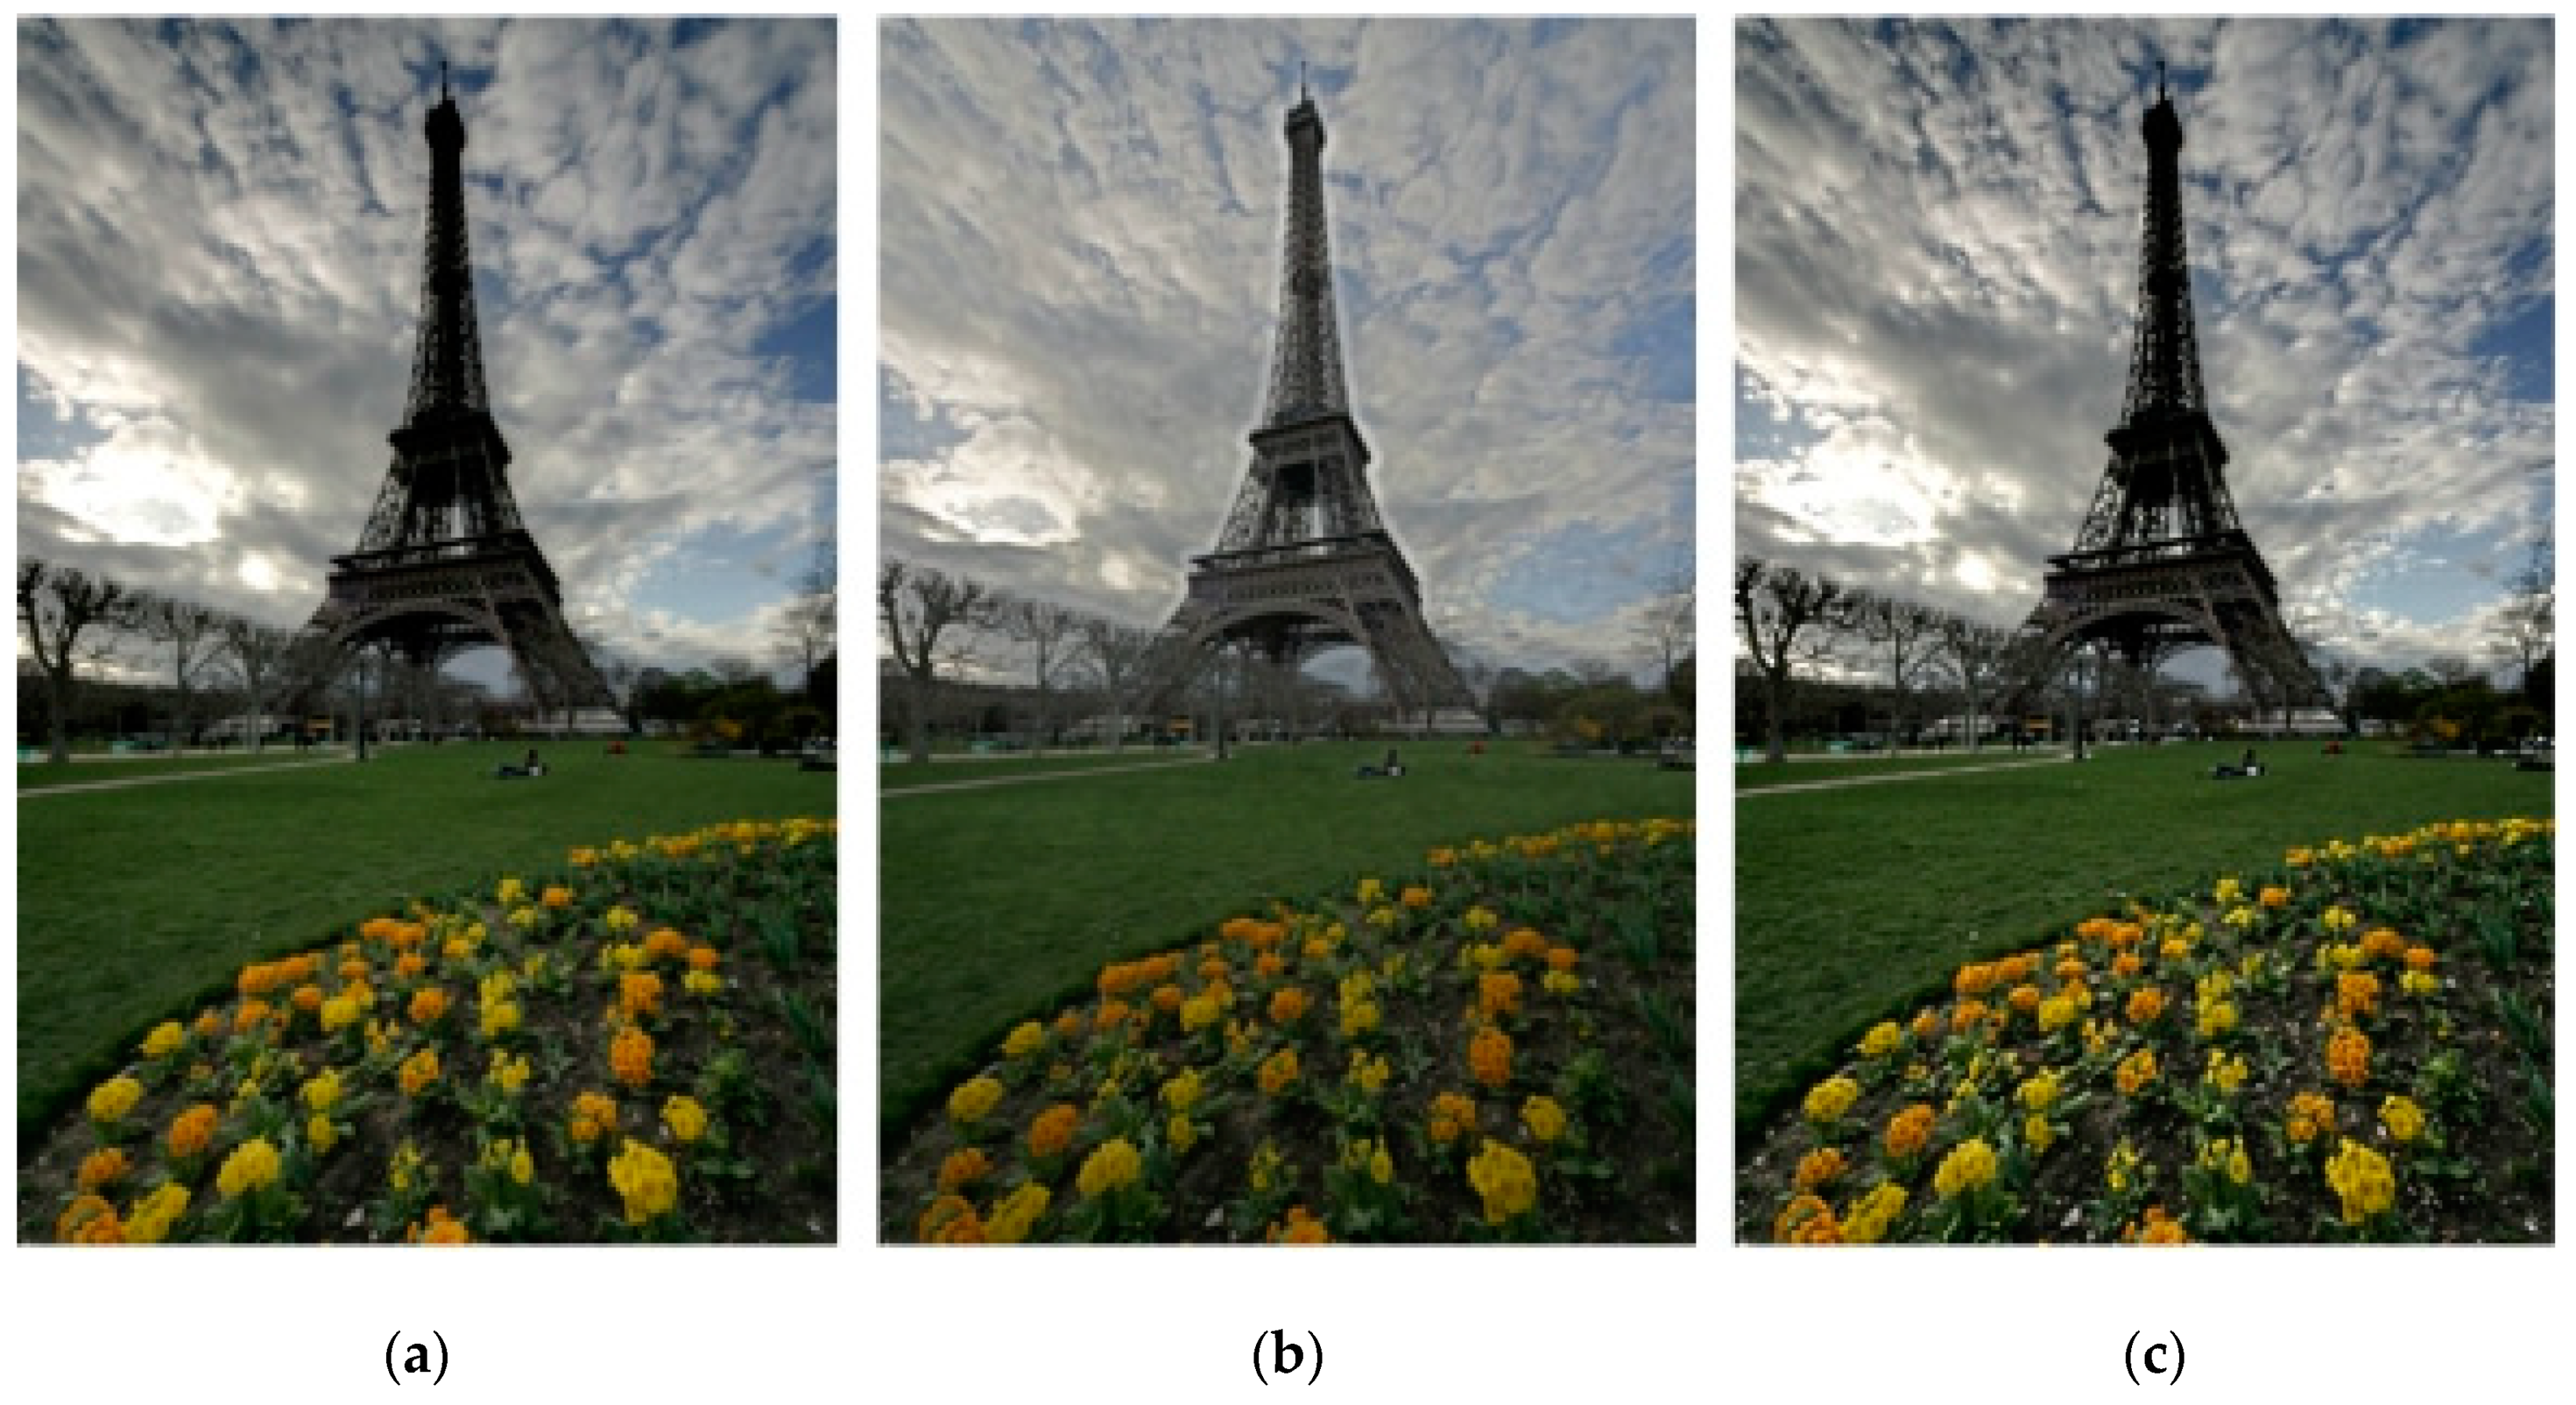
The structural information of images usually carries the essential visual contents of scenes, and HVS is highly adaptable to extract structures for visual perception. Moreover, DSIFT descriptor [20], as an effective means for obtaining local gradient information of each pixel in eight directions, has been successfully applied in the field of computer vision, such as image registration and image fusion. Compared with gradient magnitude, DSIFT is more accurate and robust to extract the structural information of images. Figure 3a–c shows three fused images of sequence “Tower” created by Mertens’ algorithm [4], local energy weighting and Li’s algorithm [5], respectively. From Figure 3, we can have the following observations: Figure 3a cannot preserve the fine details in the center of tower and the brightest cloud region; Figure 3b produces unnatural artifacts near the edges of sky or tower and also known as pseudo contour; Figure 3c can be regard as the ones after performing the edge enhancement operation on Figure 3a. Generally, the detail enhancement algorithm may create more appealing results perceptually, but it also introduces some unnatural shadow into fused image. Therefore, in this section, DSIFT similarity and DSIFT saturation are designed for precisely detecting the edge distortion in the fused image, which is mainly reflected in three aspects, i.e., detail loss, pseudo contour and detail enhancement.

2.2.1. DSIFT Similarity

As an effective edge-preserving filter, guided filter fG(.) is determined by the input image Ii and guided image Ig, and the specific filtering process is defined as
I o = f G ( I i , I g , r , ε )
where Io is the filtering output, and r and ε are the filtering radius and regularization parameter, respectively. In addition, when Ig is different from Ii, guided filter is equivalent to the structure transfer filter, that is, Io will retain the strong edge information of Ig, and the size of r and ε limits the strength of the retained edge information.
According to the characteristic, we first choose the multi-exposure source images {Ik}(k = 1, 2, ..., K) as the filtering input, and the fused image If is used as the guided image. Thus, a set of pseudo multi-exposure images with the strong edge information of fused image are constructed and denoted as { I k d , s } ( k = 1 , 2 , , K ) . At the same time, in order to eliminate the influence caused by filtering, Ik is selected as the input image and guided image once again to generate a set of filtered multi-exposure source images { I k r , s } ( k = 1 , 2 , , K ) . The above filtering process can be expressed as
I k r , s = f G ( I k , I k , r s , ε s ) I k d , s = f G ( I k , I f , r s , ε s )
where rs and εs are set as the small values to guarantee that the constructed pseudo multi-exposure images retain all edge information of fused image.
Then, DSIFT descriptor is applied to each pixel point in I k r , s and I k d , s , and the related DSIFT feature with the dimension of M is extracted, which can be defined as
D k , 1 : M r , s = f D ( I k r , s ) D k , 1 : M d , s = f D ( I k d , s )
where D k , 1 : M r , s and D k , 1 : M d , s are the obtained DSIFT feature of the k-th source image and pseudo image after filtering, respectively. fD(.) is the operator for calculating DSIFT feature, and M is the dimension of feature.
Finally, DSIFT feature similarity between I k r , s and I k d , s is calculated to measure the detail loss or pseudo contour in the fused image, which is expressed as
D SIM k , 1 : M = 2 D k , 1 : M r , s D k , 1 : M d , s + c 2 D k , 1 : M r , s 2 + D k , 1 : M d , s 2 + c 2
where D SIM k , 1 : M is the obtained k-th DSIFT similarity map, and c2 is a constant to control the denominator not to be zero.
Since D SIM k , 1 : M symbolizes the edge distortion areas of fused image in different gradient orientations, the final k-th DSIFT similarity map D SIM k can be computed by the simple average operation.
D SIM k = 1 M m = 1 M D SIM k , m
where m is the dimension index of the k-th DSIFT similarity map.
Furthermore, we define the Gauss exposure weighting function f E s ( ) to integrate all DSIFT similarity maps under different exposure levels, and it is expressed as
f E s = exp ( ( L k s 0.5 ) 2 2 σ 2 )
D SIM = k = 1 K D SIM k f E s
where L k s is a set of images after smoothing source images Ik by the mean filter with the window size of 7 × 7, and it is mainly based on the spatial consistency principle. Specially, DSIFT similarity map is calculated from I k r , s and I k d , s with smaller smoothness level, thus the corresponding weight should be also smooth in space. D SIM is the aggregated DSIFT similarity map, and the final DSIFT similarity feature is simply calculated by the mean operation for D SIM .
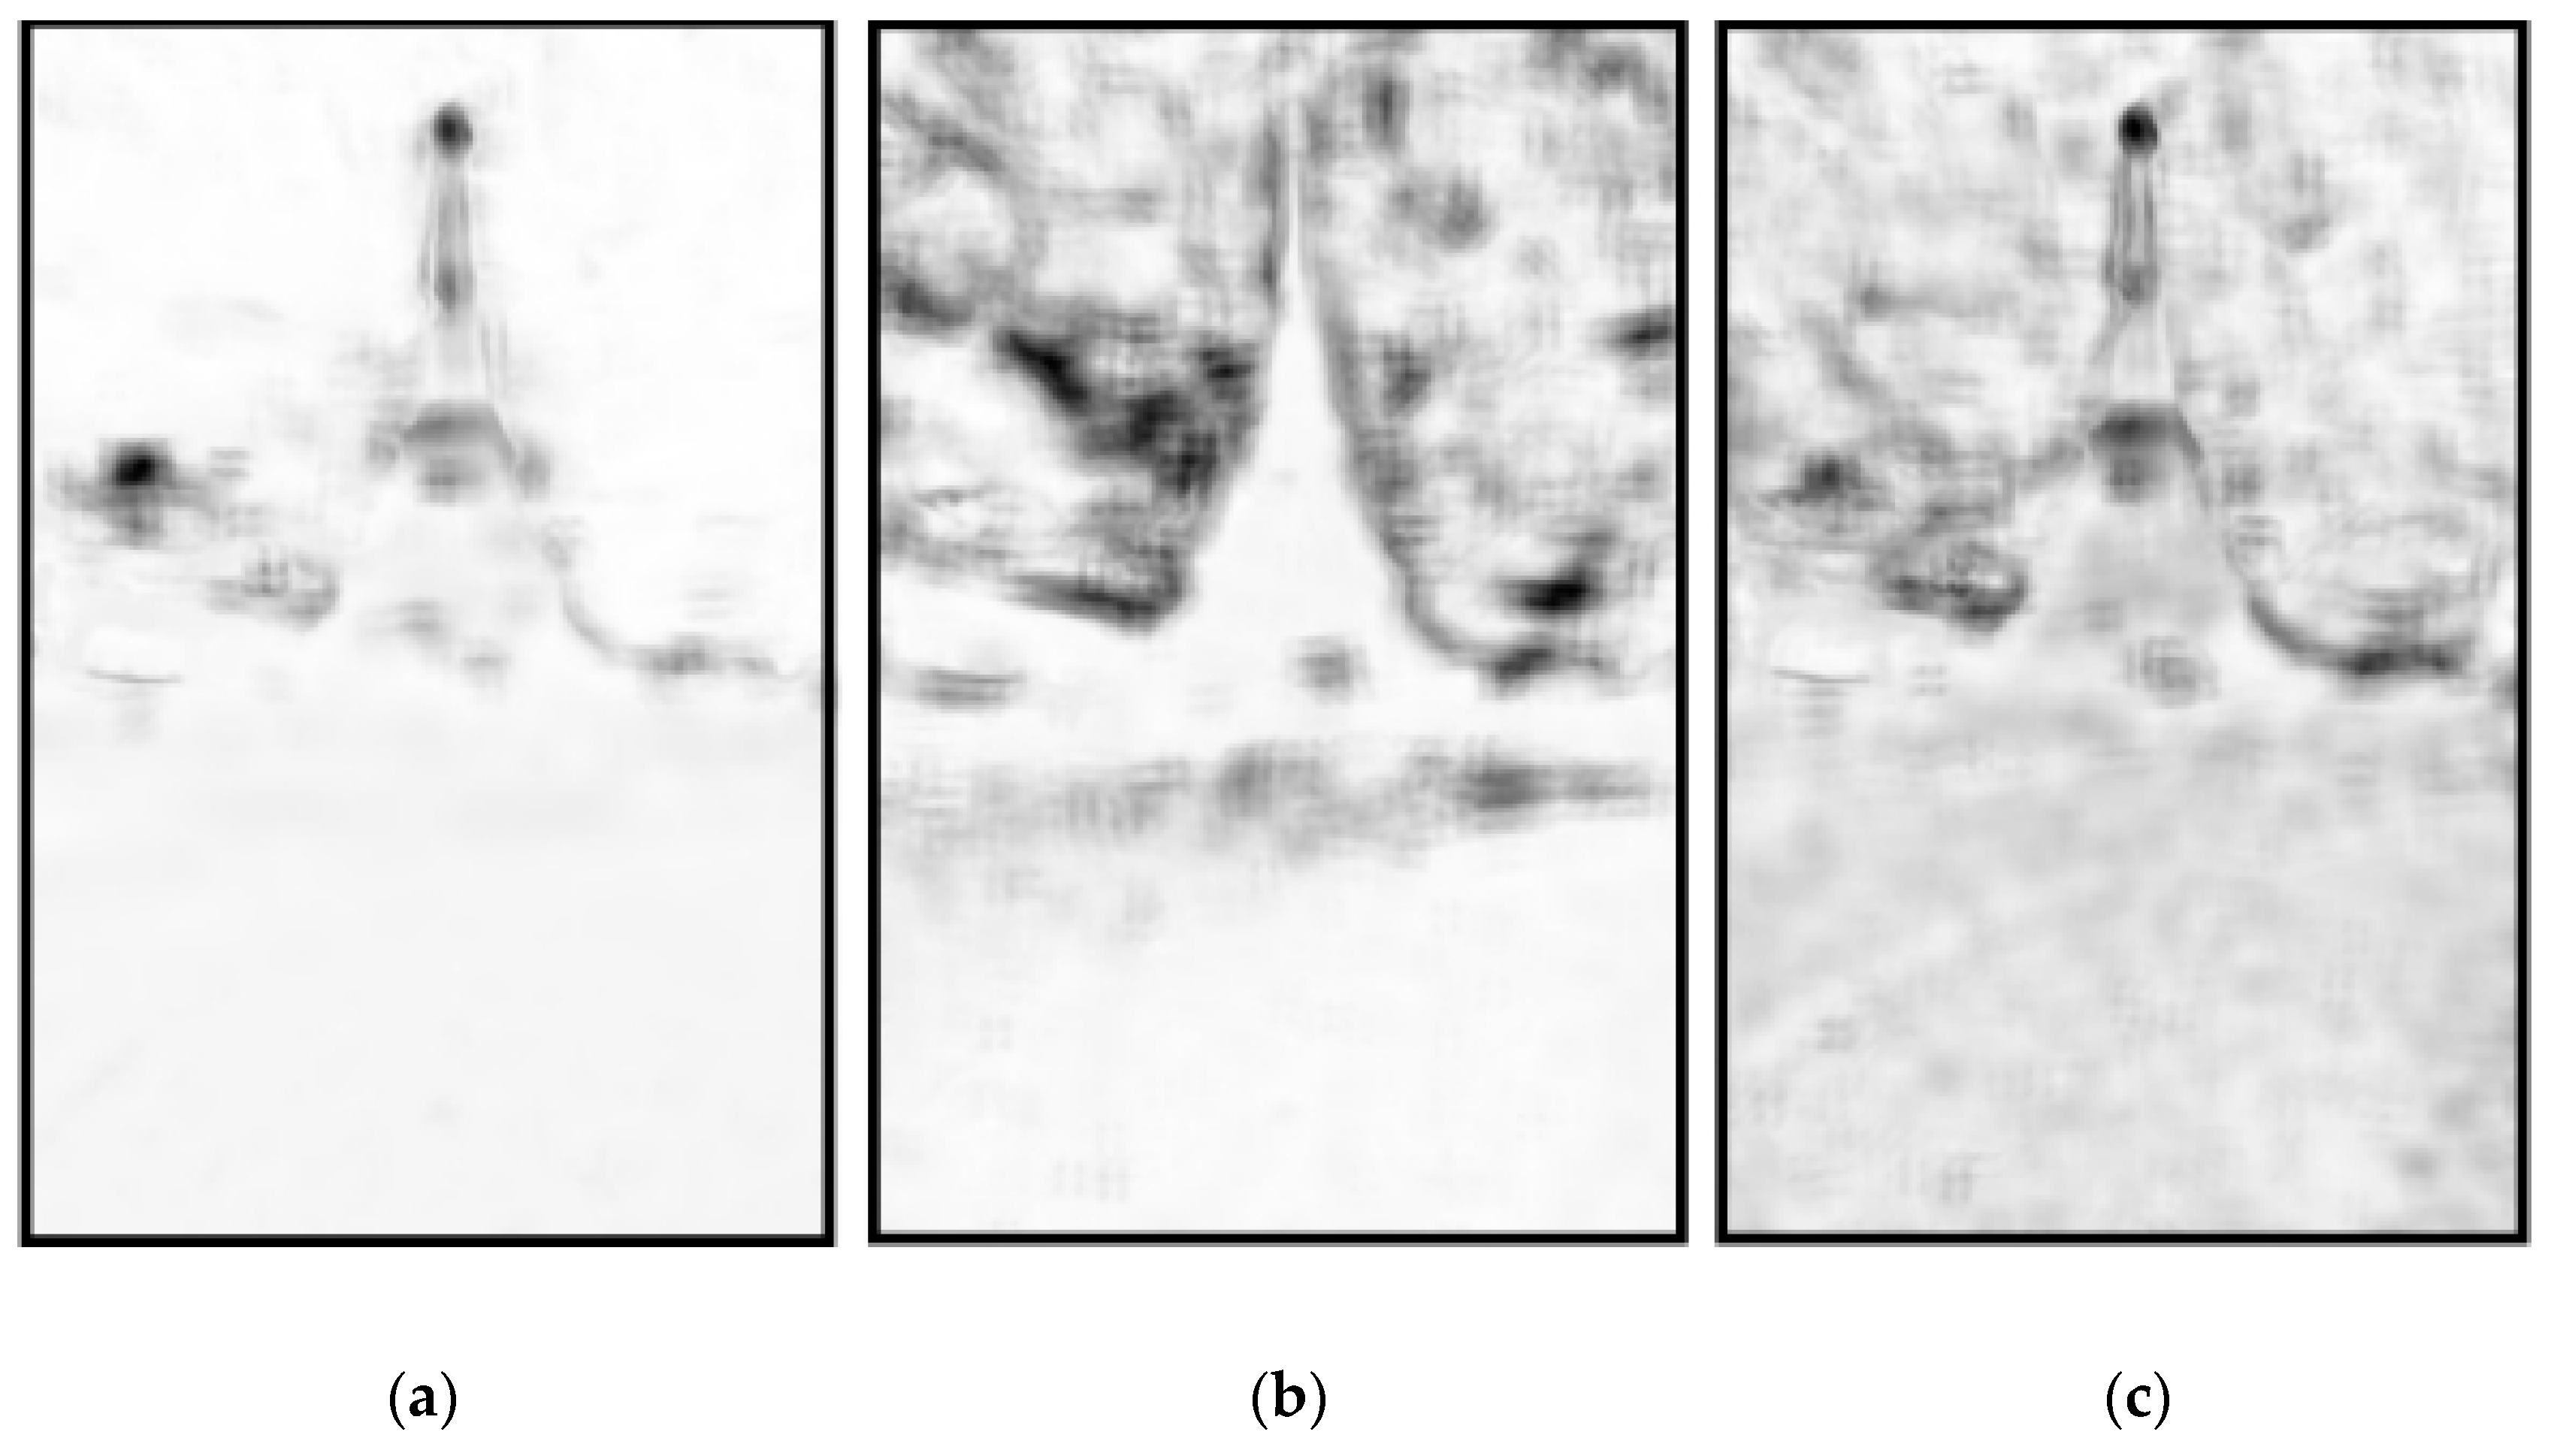
Figure 4a–c depicts the corresponding DSIFT similarity maps of Figure 3a–c, respectively. From Figure 4, it can be found that the edge distortion areas in Figure 3a,b (e.g., the center of tower, the brightest cloud and the sky) are well reflected in the calculated quality maps. However, Figure 4c shows the false results at the position of enhanced pixels in Figure 3c, because detail enhancement usually makes the edge information of images change strongly. Actually, an appropriate detail enhancement algorithm will produce more attractive results subjectively, which is just opposite of the impact caused by DSIFT similarity. Therefore, it is necessary to add the DSIFT saturation on the basic of DSIFT similarity to eliminate this effect.

2.2.2. DSIFT Saturation

Similar to the calculation of DSIFT similarity, a set of filtered pseudo images I k d , b and source images I k r , b can be generated by guided filter, and the filtering process is expressed as
I k r , b = f G ( I k , I k , r b , ε b ) I k d , b = f G ( I k , I f , r b , ε b )
where rb and εb are set as the large values to guarantee that the constructed pseudo multi-exposure images only retain some large intensity edge information, i.e., detail enhancement area.
Then, DSIFT descriptor is also applied to each pixel point in I k r , b and I k d , b , and the related DSIFT feature with the dimension of M is extracted as follows
D k , 1 : M r , b = f D ( I k r , b ) D k , 1 : M d , b = f D ( I k d , b )
where D k , 1 : M r , b and D k , 1 : M d , b are the obtained DSIFT feature of the k-th source image and pseudo image after filtering, respectively.
Finally, DSIFT saturation between I k r , b and I k d , b is calculated to measure the detail enhancement, which is expressed as
D SA k , 1 : M = 4 π atan ( D k , 1 : M d , b + c 3 D k , 1 : M r , b + c 3 )
where D SA k , 1 : M is the obtained k-th DSIFT saturation map, atan(.) is the inverse tangent function, and c3 is a constant to control the denominator not to be zero. Evidently, when D k , 1 : M d , b is greater than D k , 1 : M r , b , the saturation is greater than 1, indicating the high visual perception of HVS on detail enhancement areas. Similarly, the k-th DSIFT saturation map D SA k can be obtained by averaging the feature on each dimension, which is expressed as
D SA k = 1 M m = 1 M D SA k , m
Moreover, we also use the Gauss exposure weighting function f E b ( ) to integrate all DSIFT saturation maps under different exposure levels, and it is denoted as
f E b = exp ( ( L k b 0.5 ) 2 2 σ 2 )
D SA = k = 1 K D SA k f E b
where L k b is a set of images after smoothing source images Ik by the mean filter with the window size of 15 × 15 according to the spatial consistency principle. D SA is the aggregated DSIFT saturation map, and the final DSIFT saturation feature is simply calculated by the mean operation for D SA .
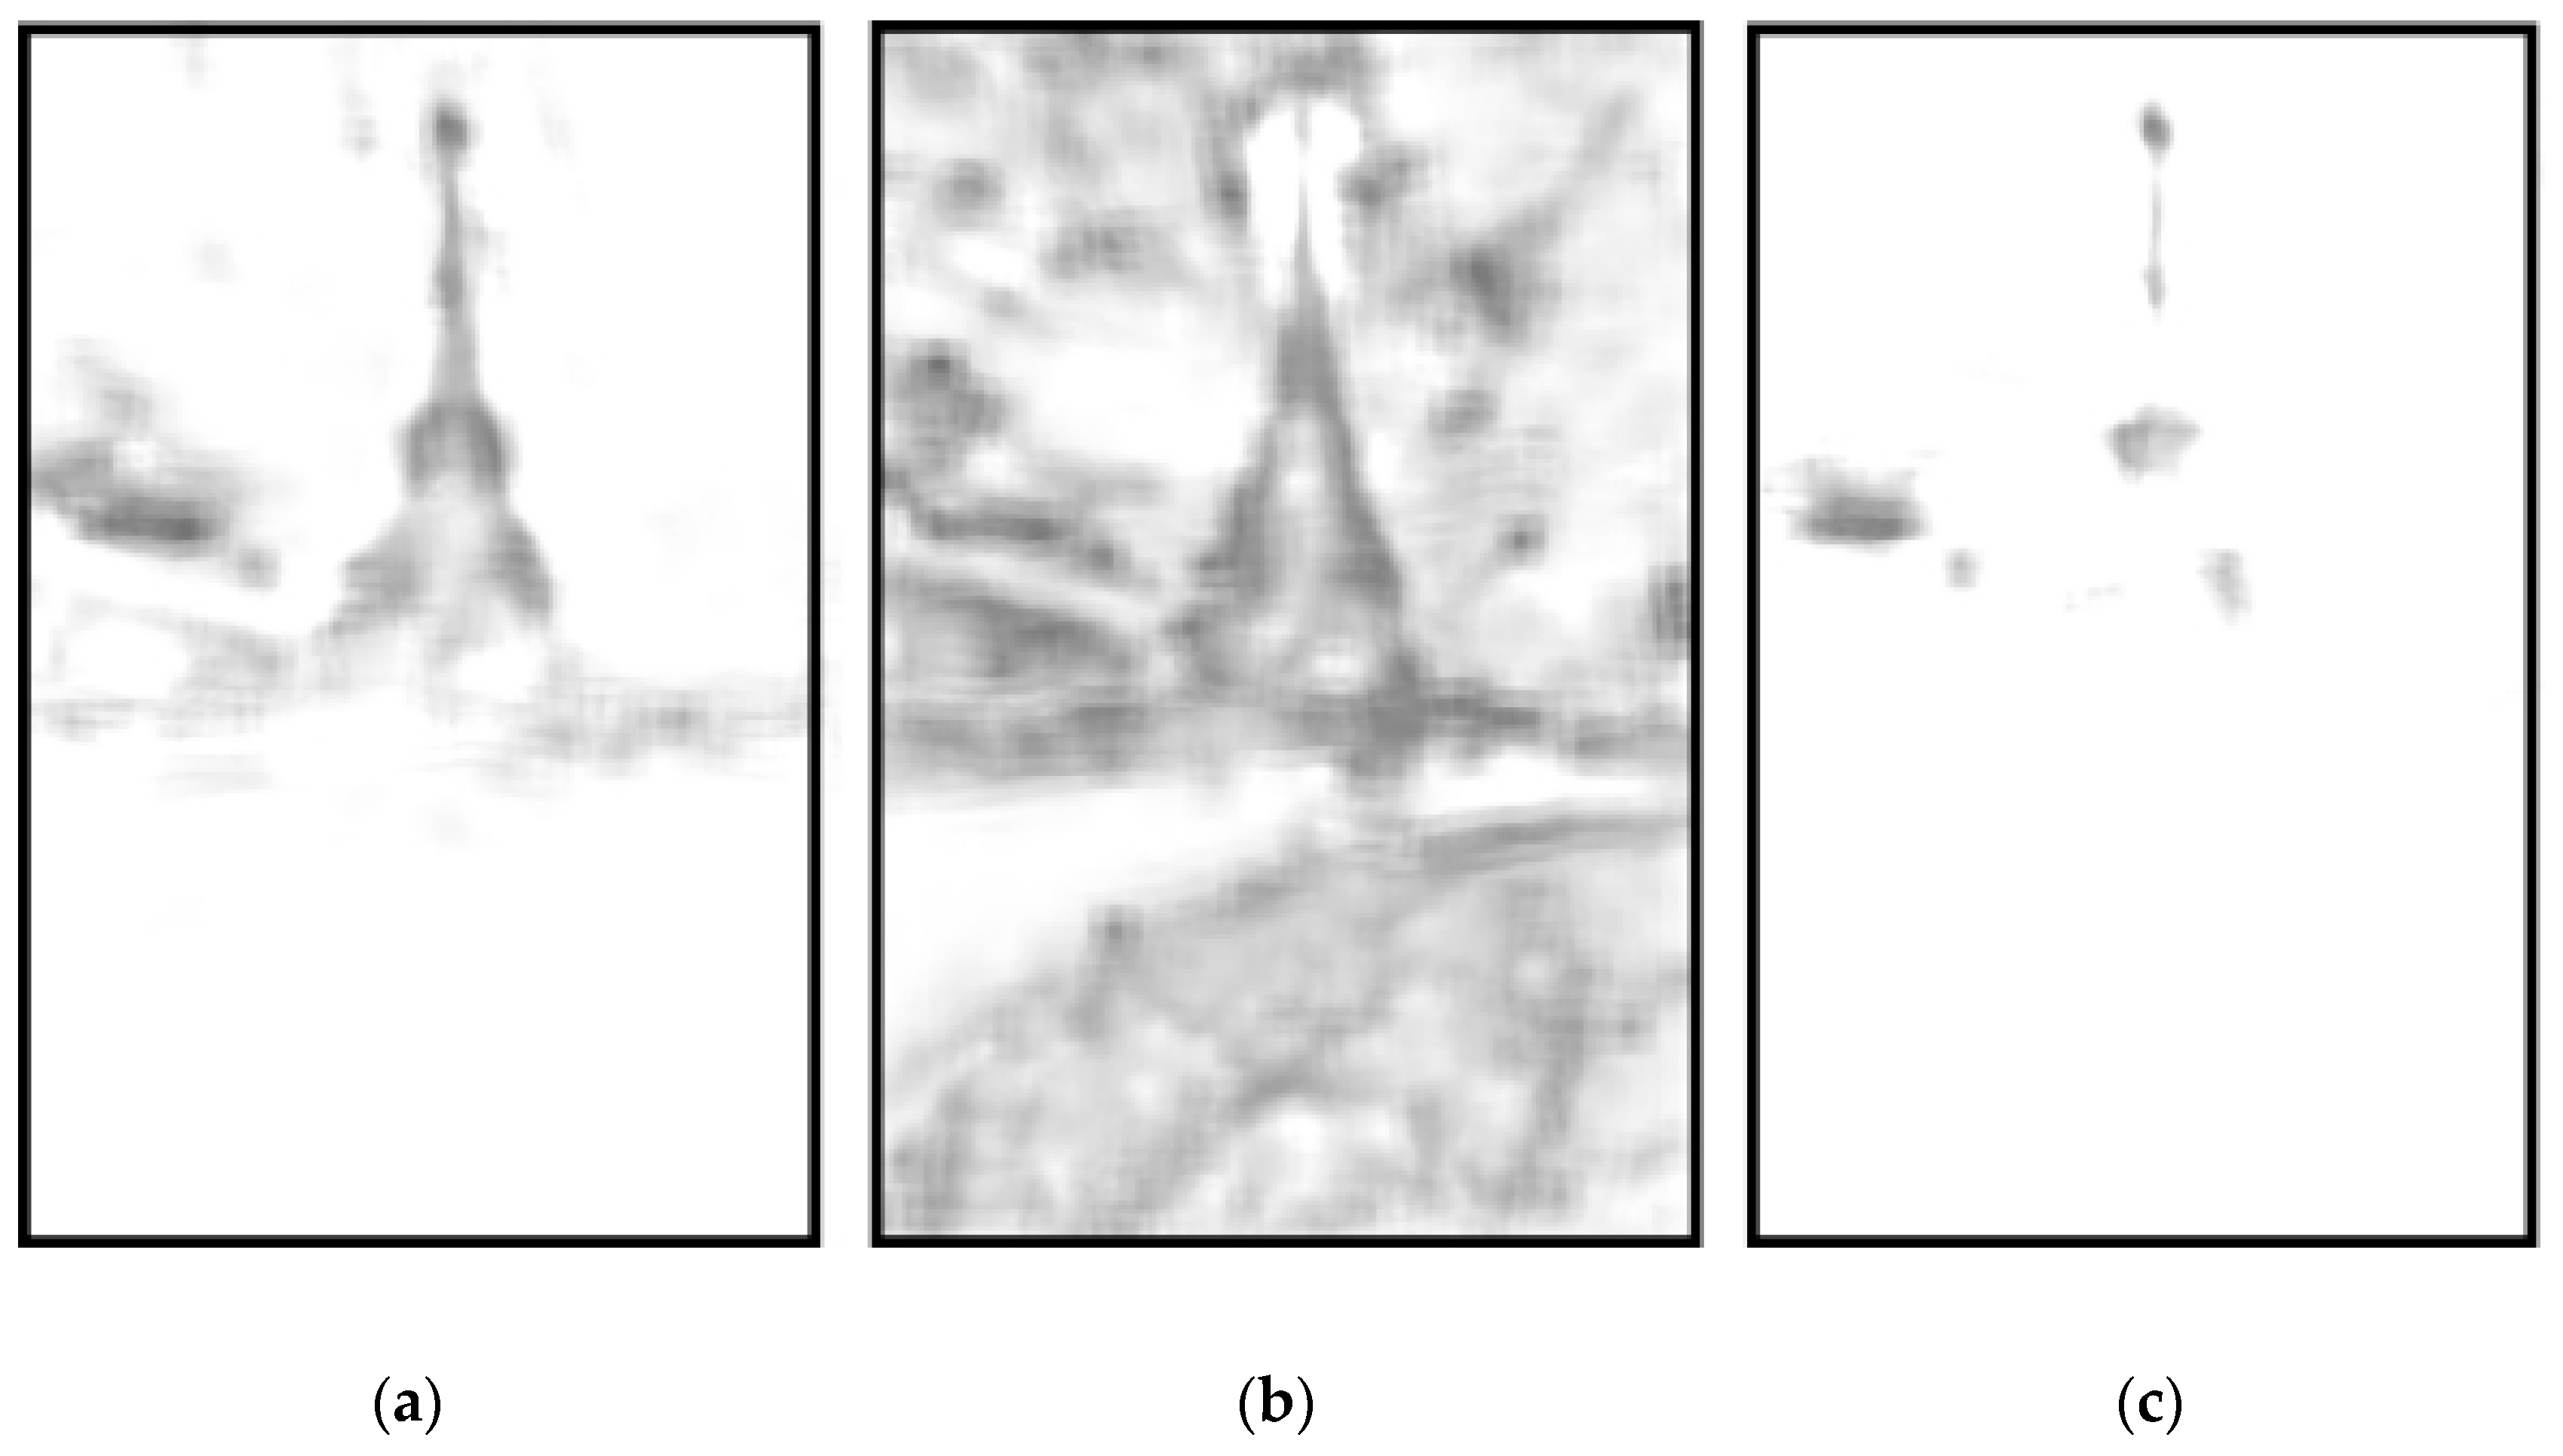
Figure 5a–c shows the corresponding DSIFT saturation maps of Figure 3a–c, respectively. From Figure 5, it can be seen that Figure 5c has higher saturation at the position of pixels with enhanced detail information in Figure 3c, which eliminates the undesired effects caused by DSIFT similarity. Fortunately, the detail loss areas in Figure 3c are also reflected on Figure 5c, demonstrating the validity of the proposed DSIFT saturation metric.

2.3. Local and Global Exposure Metrics

There are usually under-exposed or over-exposed areas in MEF images, which is mainly caused by the luminance inconsistency among adjacent pixels, thus resulting in a poor visual experience. In this section, we constructed the local and global exposure metrics to evaluate these luminance distortion phenomena.

2.3.1. Local Exposure Similarity

Similar to the definition of Gauss exposure weighting function in Equations (12) and (18), the local exposure map of an image can be defined by measuring the distance between normalized pixel intensity and 0.5, i.e., when the pixel intensity is close to 0 or 1, the pixel point is considered as under-exposed or over-exposed. Therefore, local exposure maps E k b for each source image are calculated by
E k b = exp ( ( I k 0.5 ) 2 2 σ 2 )
Then, the best exposure areas in each source image are selected to form a good exposure reference image I r b , which is defined as
I r b = I k   if   E k b = max ( E 1 b , E 2 b , . , E k b )
Finally, the local exposure distortion areas can be detected by calculating the similarity between I r b and I f .
E SIM b = 2 I r b I f + c 4 ( I r b )   2 + ( I f ) 2 + c 4
where c4 is a constant to control the denominator not to be zero, and the final local exposure similarity feature is simply calculated by the mean operation for E SIM b .
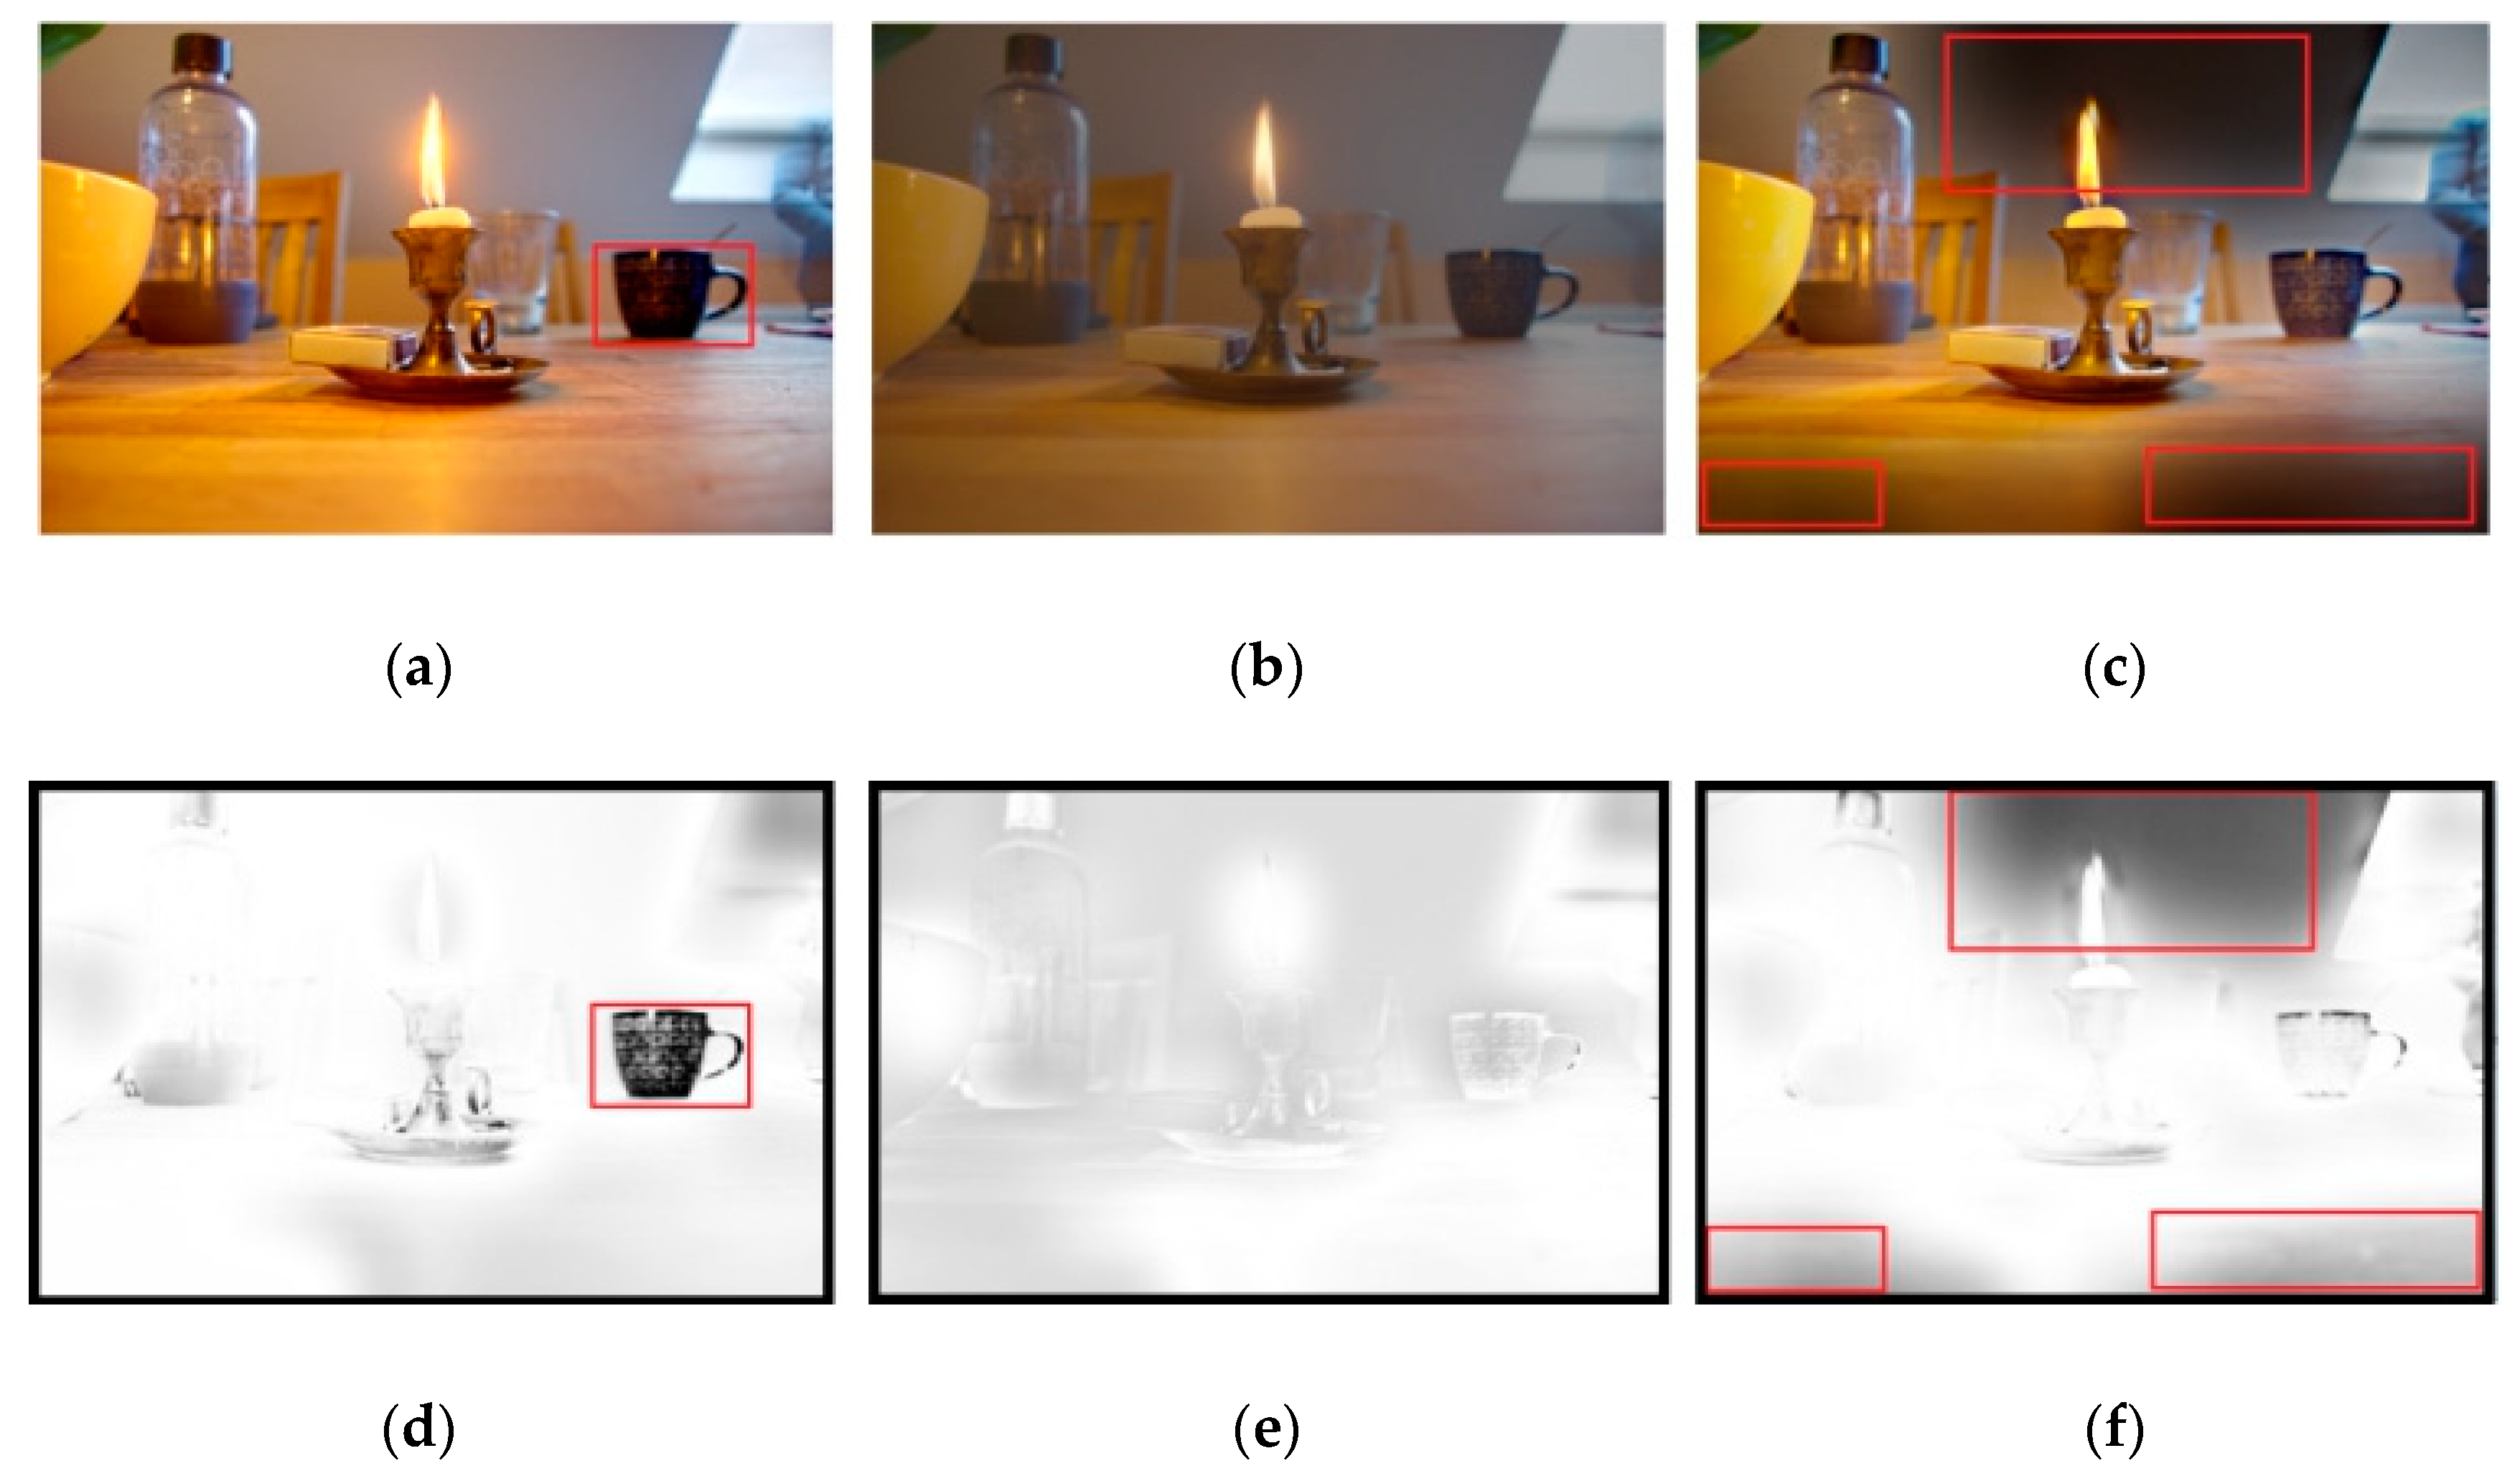
Figure 6a–c depicts three fused images of sequence “Candle” created by different algorithms, and Figure 6d–f are the local exposure similarity maps of Figure 6a–c, respectively. Obviously, there are several under-exposed areas (e.g., the teacup in Figure 6a and the shadows in Figure 6c) that are inconsistent with surrounding areas in terms of luminance. Such exposure distortion is clearly indicated in the corresponding quality maps. Moreover, Figure 6b has the uniform luminance distribution, but it is darker on the whole space than Figure 6a,c, which still results in the bad visual perception. Therefore, it is essential to consider the impact by the overall luminance.

2.3.2. Global Exposure Metric

Similar to the local exposure metric, we combine the average luminance of fused image with Gauss function to design the global exposure metric E m g , and it can be expressed as
E m g = exp ( ( I f ¯ 0.5 ) 2 2 σ 2 )
where I k ¯ is average luminance of fused image. When the luminance value is close to 0 or 1, the fused image looks entirely dark or bright.

2.4. Quality Prediction

In addition, multi-scale characteristics in spatial domain can acquire the image content from the fine level to the coarse level, which is consistent with the processing mechanism of low-level retina and cortex in primate visual system. As illustrated in Figure 7, the original scale of multi-exposure images and fused images are marked as scale 1. By iteratively applying a low-pass filter and a down-sampling operation with a factor of 2 on the original images, the filtered images at scale l can be obtained after l-1 iterations. Then, the above-mentioned feature extraction method is conducted in the multi-scale space, thus generating the final feature vector Ff = [F1, F2, F3], where F1, F2, and F3 are color, structure and exposure features, respectively. After feature extraction, the quality regression from feature space to image quality is conducted, which can be denoted as
Q = f Q ( F f )
where fQ(.) is a quality regression function achieved by random forest (RF) algorithm, and Q is the quality of fused image.

3. Experimental Results

3.1. Experimental Settings

3.1.1. Database

To compare the performance of the proposed MEF-IQA method with other state-of-the-art IQA models, the experiments were performed on the public MEF subjective assessment database [21] provided by Waterloo IVC. Specially, it consists of 17 multi-exposure source image sequences, and each image sequence contains the corresponding fused images generated by 8 MEF algorithms. Therefore, a total of 136 fused images with associated mean opinion score (MOS) are included in this database, and more details can be referred to Figure 8 and Table 1.

3.1.2. Evaluation Criteria

According to the related standard in the field of image quality assessment formulated by video quality expert group (VQEG) [22], three evaluation criteria, i.e., Pearson linear correlation coefficient (PLCC), Spearman rank-order correlation coefficient (SROCC) and root mean square error (RMSE), are selected to evaluate the performance of IQA models, and the most excellent model will be generated when the values of PLCC and SROCC are 1, RMSE is 0. Moreover, a 5-parametric logistic regression process is employed to make the predicted quality closer to subjective scores before calculating PLCC and RMSE.

3.1.3. Experimental Parameters

In terms of the proposed MEF-IQA method, there are several experimental parameters to be fixed in the process of feature extraction. Specifically, the filtering radius and regularization parameter of guided filter (i.e., rs, εs, rb and εb) are mainly applied for the structure transfer, so we set rs = 11, εs = 10−6, rb = 21 and εb = 0.3, respectively, which are in accordance with the advice in [9]. Moreover, the feature dimension M of DSIFT descriptor is the same as the ones in [20], that is, M = 32. Generally, the above parameters cannot make a significant impact on the final performance of MEF-IQA models, so we strictly follow the recommendation in the previous study rather than setting the parameters randomly. Finally, considering that feature extraction is conducted in the multi-scale space, and the scale number, l, will affect the performance evidently. Therefore, we select the optimal scale value (i.e., l = 3) to achieve a trade-off between complexity and accuracy, and the specific details about analyzing the impact of the scale number on performance will be discussed in the following sections.

3.2. Performance Comparison

To verify the performance of the proposed MEF-IQA method, we compare it on MEF database [21] with nine existing state-of-the-art IQA metrics, including six GF-IQA metrics [11,12,13,14,15,16] and three MEF-IQA metrics [17,18,19]. Remarkably, the proposed MEF-IQA method adopts the supervised learning approach to obtain the image quality, thus the MEF database is first divided into training and testing subsets. Then, 17-fold cross validation is used to evaluate the performance of model, that is, for each train-test stage, 16 distorted image sequences and the rest ones are used for training and testing, respectively. The results of performance comparison for each source image sequence are tabulated in Table 2 and Table 3, and only the values of PLCC and SROCC are presented for brevity, where the best two performances are highlighted in boldface. Furthermore, we simultaneously record the corresponding hit count of performance highlighted in boldface to discriminate the performance difference among ten IQA metrics more intuitively. From Table 2 and Table 3, we can have the following findings. First, compared with six GF-IQA metrics, three MEF-IQA metrics specially designed for multi-exposure images achieve a more outstanding performance, which indicates that MEF images have the special perceptual characteristics due to the distortion introduced in the imaging process, such as color imbalance, structure degradation and abnormal exposure. Second, the related color distortion metric is extra considered in [19], which makes the performance of MEF-IQA metric in [19] slightly improved against the other two existing MEF-IQA metrics [17,18]. It is mainly due to the fact that although HVS is more sensitive to luminance than chrominance in real situation, an image with serious color distortion also causes the bad visual experience. Therefore, color information cannot be ignored in terms of MEF-IQA. Finally, the proposed MEF-IQA method achieves 0.952 and 0.897 on PLCC and SROCC on average, respectively. Obviously, it outperforms all the competing MEF-IQA and GF-IQA metrics, because it considers three perceptual factors, namely color, structure and exposure.

3.3. Impacts of Multi-Scale Scheme and Different Feature

To analyze how much of the contributions coming from each kind of feature in the proposed MEF-IQA model, the evaluation performance resulted from three perceptual attributes (i.e., color, structure and exposure) are investigated on the MEF database [21]. The corresponding results averaged on all source image sequences in the database are reported in Table 4, where F1, F2 and F3 denote the extracted feature vector about color, structure and exposure, respectively. From Table 4, it can be found that the structure feature has a more significant influence on the final performance compared with the color and exposure features, which demonstrates that HVS is highly sensitive to the structure degradation in an image. Moreover, we also explore the impact of the scale number on the final performance in the multi-scale scheme. Specially, we assign l = {1, 2, 3, 4} and calculate the PLCC, SROCC and RMSE for each situation, respectively, and the results are shown in Table 5. Evidently, when the value of l is 3, the proposed MEF-IQA model achieves an optimal performance, so we set the scale number as 3 in the paper to guarantee the accuracy of method.

4. Conclusions

In this paper, a human visual perception-based multi-exposure fusion image quality assessment (MEF-IQA) method is proposed by considering three perceptual features about color, structure and exposure, and the superiority of our approach is mainly reflected in the following three aspects. First, the chrominance information, which is usually ignored in the existing IQA models for image fusion, is utilized to form the local color saturation similarity and global color distortion metric. Second, dense scale invariant feature transform (DSIFT) descriptor is used for obtaining the structure information of image from multiple orientations because it is more robust and accurate than gradient amplitude. Third, Gauss exposure function is designed to evaluate the luminance inconsistency among the adjacent pixels, and multi-scale scheme is adopted in the process of feature extraction to explore the perceptual difference from the fine level to the coarse level. Extensive experiments have indicated that the proposed method is more effective in predicting the quality of MEF images compared with other state-of-the-art metrics. However, the natural scene is almost moving in practice, and these moving objects in the imaging process will make the final fused images appear ghosting. In future work, we will focus on the MEF-IQA models in dynamic scene, which are more practical than those in static scene.

Author Contributions

Y.C. and A.C. provided the initial idea for this work; Y.C. and A.C. designed the algorithm. Y.C., A.C., B.Y., S.Z. and Y.W. contributed to the analyses of results. Y.C. contributed to the collection and analysis of field test data. Y.C. and A.C. wrote the paper.

Funding

This work was supported by Zhejiang Provincial National Science Foundation of China and National Science Foundation of China (NSFC) under Grant No. LZ20F020002, No. LY18F010005 and 61976149, Taizhou Science and Technology Project under Grant No. 1803gy08 and 1802gy06, and Outstanding Youth Project of Taizhou University under Grant No. 2018JQ003 and 2017PY026.

Acknowledgments

Thanks to Aihua Chen, Yang Wang and the members of image research team for discussions about the algorithm. Thanks also to anonymous reviewers for their comments.

Conflicts of Interest

The authors declare no conflict of interest.

References

  1. Yang, K.F.; Li, H.; Kuang, H.L.; Li, C.Y.; Li, Y.J. An adaptive method for image dynamic range adjustment. IEEE Trans. Circuits Syst. Video Technol. 2019, 29, 640–652. [Google Scholar] [CrossRef]
  2. Yue, G.H.; Hou, C.P.; Zhou, T.W. Blind quality assessment of tone-mapped images considering colorfulness, naturalness, and structure. IEEE Trans. Ind. Electron. 2019, 66, 3784–3793. [Google Scholar] [CrossRef]
  3. Wang, J.G.; Zhou, L.B. Traffic light recognition with high dynamic range imaging and deep learning. IEEE Trans. Intell. Transp. Syst. 2019, 20, 1341–1352. [Google Scholar] [CrossRef]
  4. Mertens, T.; Kautz, J.; Reeth, F.V. Exposure fusion: A simple and practical alternative to high dynamic range photography. Comput. Graph. Forum 2009, 28, 161–171. [Google Scholar] [CrossRef]
  5. Li, Z.G.; Zheng, J.H.; Rahardja, S. Detail-enhanced exposure fusion. IEEE Trans. Image Process. 2012, 21, 4672–4676. [Google Scholar] [PubMed]
  6. Gu, B.; Li, W.J.; Wong, J.T.; Zhu, M.Y.; Wang, M.H. Gradient field multi-exposure images fusion for high dynamic range image visualization. J. Vis. Commun. Image Represent. 2012, 23, 604–610. [Google Scholar] [CrossRef]
  7. Raman, S.; Chaudhuri, S. Bilateral filter based compositing for variable exposure photography. In Proceedings of the Eurographics (Short Papers), Munich, Germany, 1–3 April 2009. [Google Scholar]
  8. Li, S.T.; Kang, X.D. Fast multi-exposure image fusion with median filter and recursive filter. IEEE Trans. Consum. Electron. 2012, 58, 626–632. [Google Scholar] [CrossRef] [Green Version]
  9. Li, S.T.; Kang, X.D.; Hu, J.W. Image fusion with guided filtering. IEEE Trans. Image Process. 2013, 22, 2864–2875. [Google Scholar] [PubMed]
  10. Zhang, C.; Cheng, W.; Hirakawa, K. Corrupted reference image quality assessment of denoised images. IEEE Trans. Image Process. 2019, 28, 1731–1747. [Google Scholar] [CrossRef] [PubMed]
  11. Hossny, M.; Nahavandi, S.; Creighton, D. Comments on information measure for performance of image fusion. Electron. Lett. 2008, 44, 1066–1067. [Google Scholar] [CrossRef] [Green Version]
  12. Cvejic, N.; Canagarajah, C.N.; Bull, D.R. Image fusion metric based on mutual information and Tsallis entropy. Electron. Lett. 2006, 42, 626–627. [Google Scholar] [CrossRef]
  13. Xydeas, C.S.; Petrovic, V.S. Objective pixel-level image fusion performance measure. In Sensor Fusion: Architectures, Algorithms, and Applications IV; International Society for Optics and Photonics: Orlando, FL, USA, 2000. [Google Scholar]
  14. Wang, P.W.; Liu, B. A novel image fusion metric based on multi-scale analysis. In Proceedings of the 2008 9th International Conference on Signal Processing, Beijing, China, 26–29 October 2008. [Google Scholar]
  15. Zheng, Y.; Essock, E.A.; Hansen, B.C.; Haun, A.M. A new metric based on extended spatial frequency and its application to DWT based fusion algorithms. Inf. Fusion 2007, 8, 177–192. [Google Scholar] [CrossRef]
  16. Piella, G.; Heijmans, H. A new quality metric for image fusion. In Proceedings of the 2003 International Conference on Image Processing, Barcelona, Spain, 14–17 September 2003. [Google Scholar]
  17. Ma, K.D.; Zeng, K.; Wang, Z. Perceptual quality assessment for multi-exposure image fusion. IEEE Trans. Image Process. 2015, 24, 3345–3356. [Google Scholar] [CrossRef]
  18. Xing, L.; Cai, L.; Zeng, H.G.; Chen, J.; Zhu, J.Q.; Hou, J.H. A multi-scale contrast-based image quality assessment model for multi-exposure image fusion. Signal Process. 2018, 145, 233–240. [Google Scholar] [CrossRef]
  19. Deng, C.W.; Li, Z.; Wang, S.G.; Liu, X.; Dai, J.H. Saturation-based quality assessment for colorful multi-exposure image fusion. Int. J. Adv. Robot. Syst. 2017, 14, 1–15. [Google Scholar] [CrossRef]
  20. Lowe, D.G. Distinctive image features from scale-invariant keypoints. Int. J. Comput. Vis. 2004, 60, 91–100. [Google Scholar] [CrossRef]
  21. Multi-exposure Fusion Image Database. Available online: http://ivc.uwaterloo.ca/database/MEF/MEF-Database.php (accessed on 11 July 2015).
  22. Antkowiak, J.; Baina, T.J. Final Report from the Video Quality Experts Group on the Validation of Objective Models of Video Quality Assessment; ITU-T Standards Contributions COM: Geneva, Switzerland, March 2000. [Google Scholar]
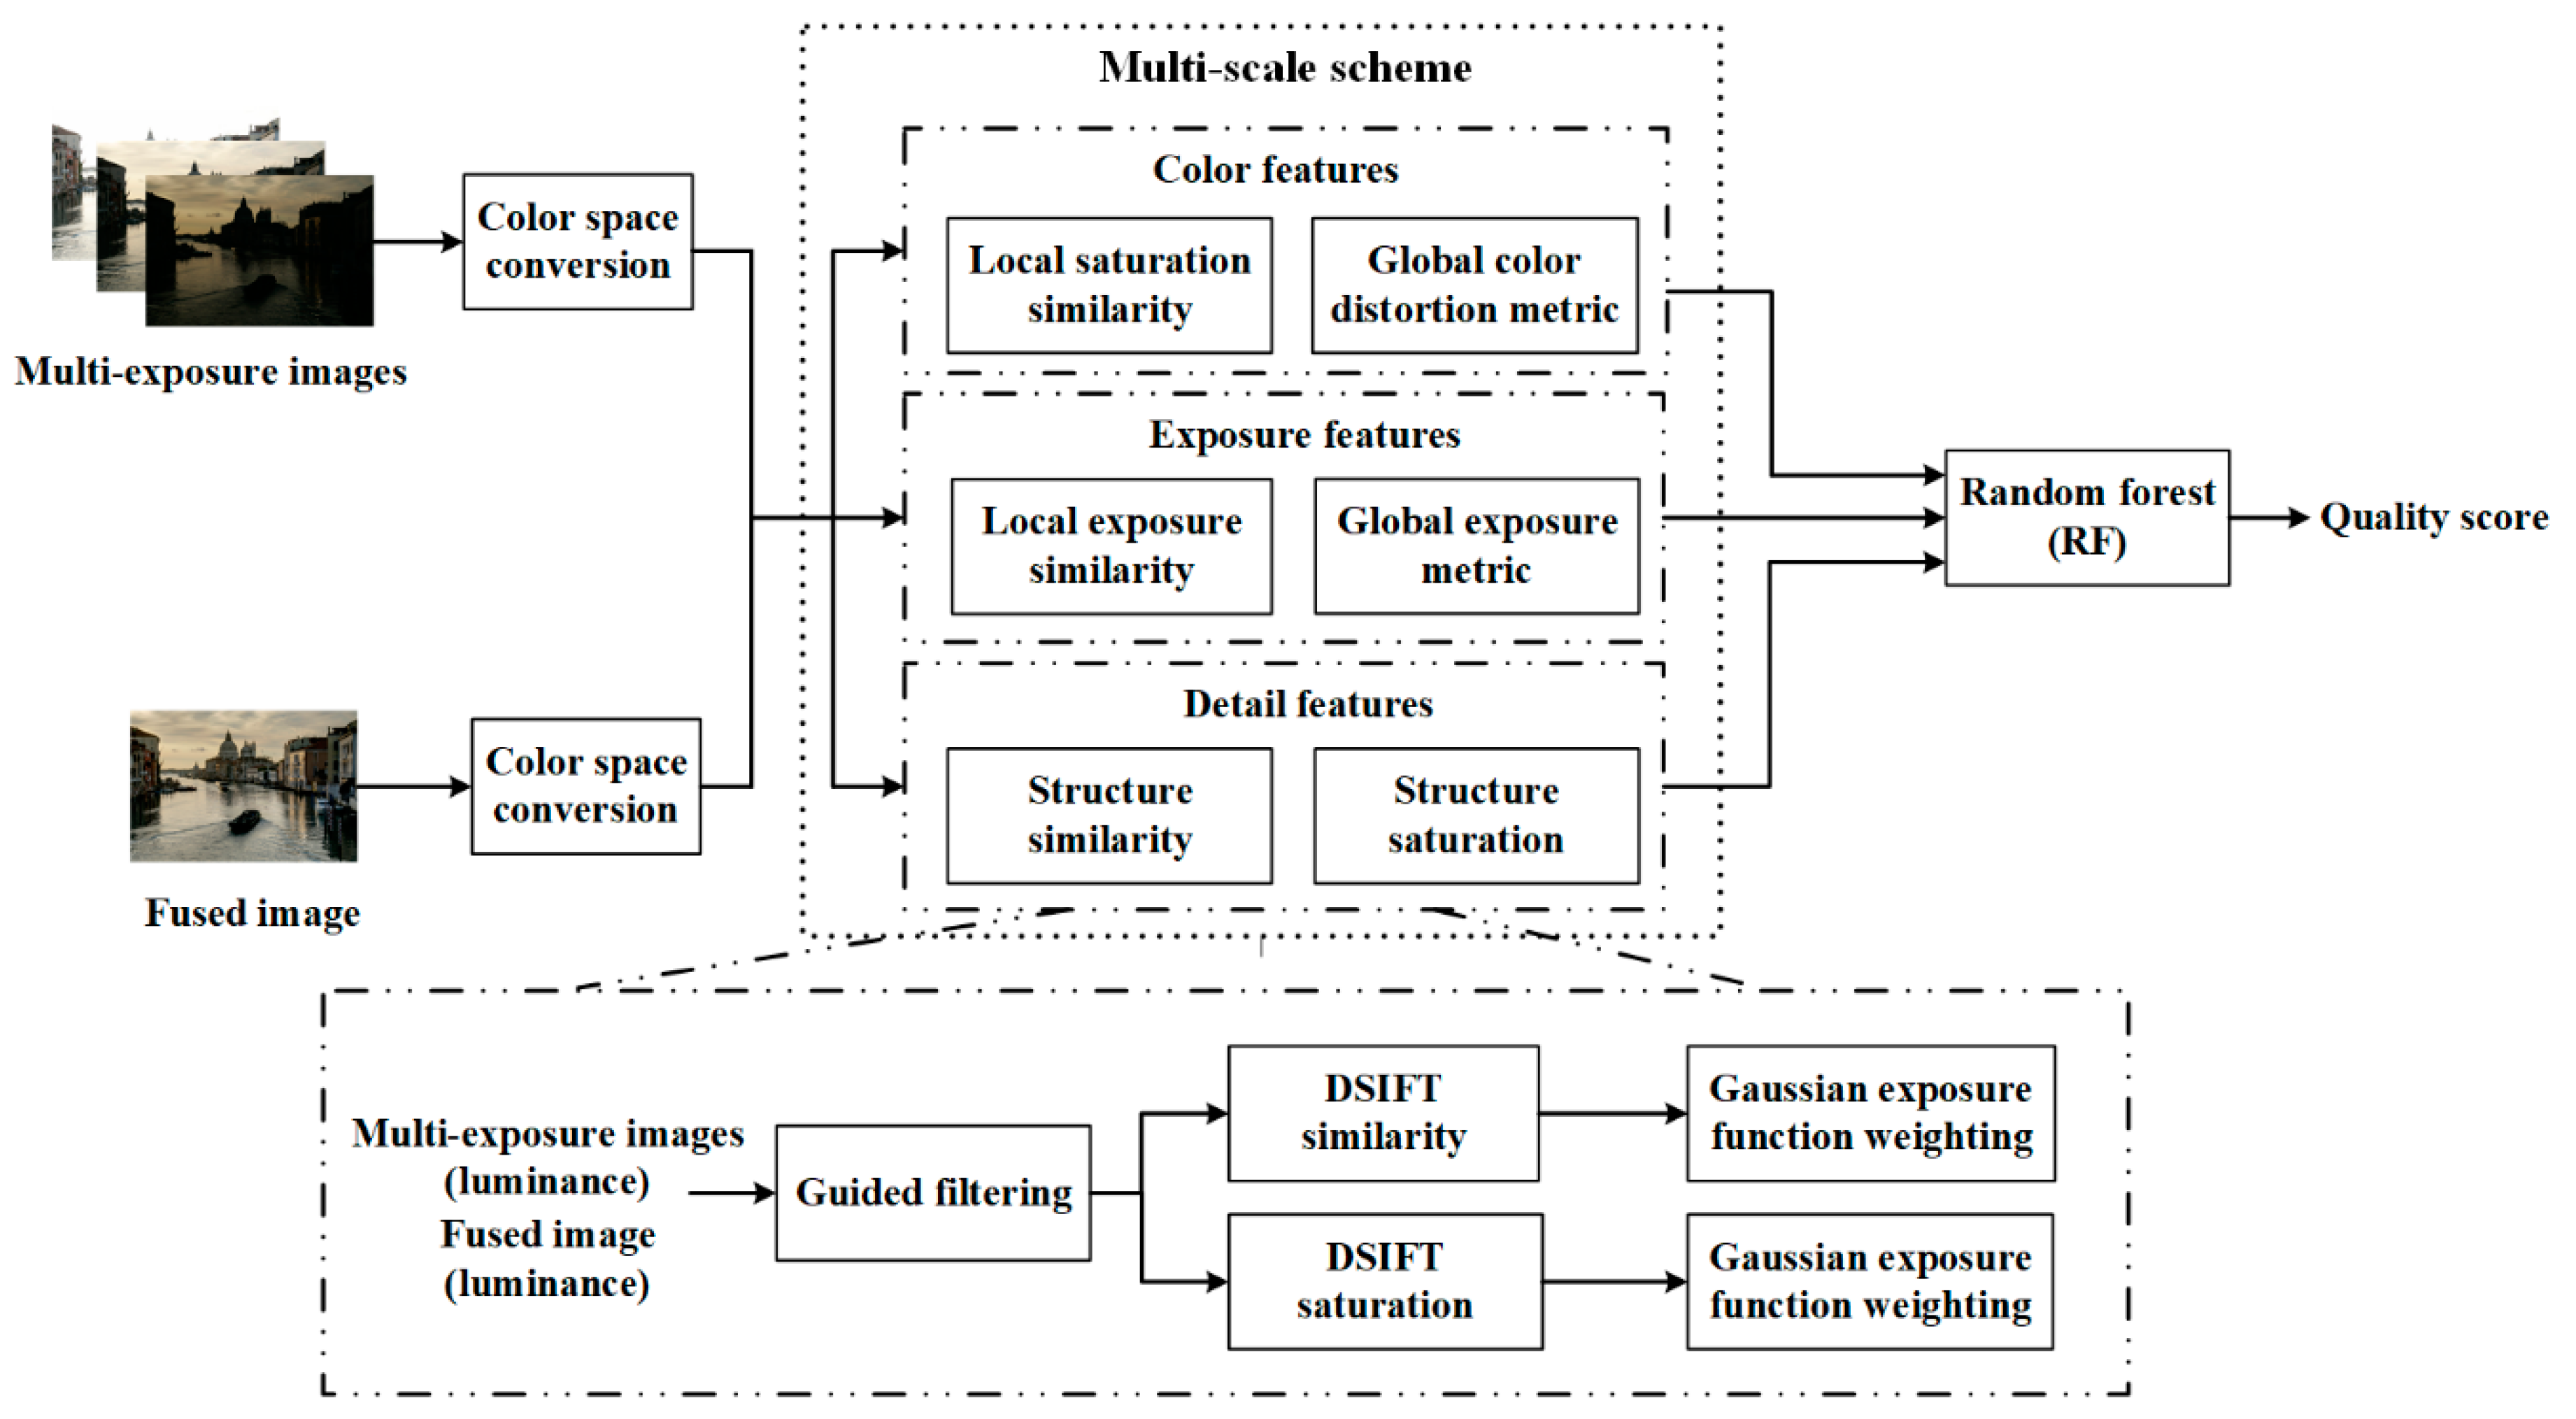
Figure 1. The proposed human visual perception-based multi-exposure fusion–image quality assessment (MEF-IQA) method.
Symmetry 11 01494 g001
Figure 2. An example of multi-exposure fusion images of sequence “Lamp1” generated by three MEF algorithms. (a) Fused image created by Li’s algorithm [5]; (b) fused image created by Gu’s algorithm [6]; (c) fused image created by Raman’s algorithm [7].
Symmetry 11 01494 g002
Figure 3. An example of multi-exposure fusion images of sequence “Tower” generated by three MEF algorithms. (a) Fused image created by Mertens’ algorithm [4]; (b) fused image created by local energy weighting; (c) fused image created by Li’s algorithm [5].
Symmetry 11 01494 g003
Figure 4. Examples of DSIFT similarity maps. (a) The DSIFT similarity map of Figure 3a; (b) the DSIFT similarity map of Figure 3b; (c) the DSIFT similarity map of Figure 3c.
Symmetry 11 01494 g004
Figure 5. Examples of DSIFT saturation maps. (a) The DSIFT saturation map of Figure 3a; (b) the DSIFT saturation map of Figure 3b; (c) the DSIFT saturation map of Figure 3c.
Symmetry 11 01494 g005
Figure 6. Examples of local exposure similarity maps. (a) Fused image created by Li’s algorithm [5]. (b) fused image created by Raman’s algorithm [7]. (c) fused image created by Li’s algorithm [9]. (df) Corresponding local exposure similarity maps of images in the first row.
Symmetry 11 01494 g006
Figure 7. The multi-scale scheme used in the proposed method, where the LPF denotes a low-pass filter and 2↓ means the down-sampling operation with a factor of 2.
Symmetry 11 01494 g007
Figure 8. Source image sequences contained in the MEF database [21]. Each image sequence is represented by one image, which is a fused image with the best quality in the subjective test.
Symmetry 11 01494 g008
Table 1. Information about source image sequence in the MEF database [21].
No.Source SequencesSizeImage Source
1Balloons339 × 512 × 9Erik Reinhard
2Belgium house512 × 384 × 9Dani Lischinski
3Lamp1512 × 384 × 15Martin Cadik
4Candle512 × 364 × 10HDR Projects
5Cave512 × 384 × 4Bartlomiej Okonek
6Chinese garden512 × 340 × 3Bartlomiej Okonek
7Farmhouse512 × 341 × 3HDR Projects
8House512 × 340 × 4Tom Mertens
9Kluki512 × 341 × 3Bartlomiej Okonek
10Lamp2512 × 342 × 6HDR Projects
11Landscape512 × 341 × 3HDRsoft
12Lighthouse512 × 340 × 3HDRsoft
13Madison capitol512 × 384 × 30Chaman Singh Verma
14Memorial341 × 512 × 16Paul Debevec
15Office512 × 340 × 6Matlab
16Tower341 × 512 × 3Jacques Joffre
17Venice512 × 341 × 3HDRsoft
Table 2. Pearson linear correlation coefficient (PLCC) performance evaluation of ten IQA models.
No.GF-IQAMEF-IQA
[11][12][13][14][15][16][17][18][19]Proposed
1−0.5420.7610.7050.4390.6650.5040.9300.9360.9240.954
2−0.3850.1740.8020.6260.5610.5020.9310.9650.9900.989
3−0.121−0.4790.7290.7280.4020.4320.8910.9840.9700.976
40.265−0.7290.9390.8920.1060.1790.9510.9460.9540.977
5−0.2140.0530.6950.8140.6210.6300.7720.6430.8740.912
6−0.224−0.2940.7680.8360.4810.4090.9560.8420.9600.910
7−0.6410.5040.6410.6000.6930.2160.8630.9190.8750.951
8−0.289−0.5240.6210.5960.4760.4810.8410.9560.9610.990
9−0.0910.0210.3910.359−0.112−0.0490.8240.9100.8630.933
10−0.3870.6210.8450.7520.6490.6000.8290.9060.8730.887
11−0.2110.5390.3200.4480.0810.0310.7460.6120.8790.954
12−0.296−0.2610.8380.6550.246−0.0230.9420.8860.8570.970
13−0.4060.0310.6280.4230.5410.6180.9140.9150.9710.907
14−0.4180.4450.8280.6780.5880.7330.8980.9810.9690.980
15−0.2030.3020.4980.4730.3160.3240.9630.9560.9810.992
16−0.478−0.1160.7720.8350.5720.5940.9560.9470.9570.913
17−0.358−0.0220.7950.6540.4790.2800.9700.9710.9500.989
Average−0.2940.0600.6950.6360.4330.4000.8930.8990.9300.952
Hit count000000381015
Table 3. Spearman rank-order correlation coefficient (SROCC) performance evaluation of ten IQA models.
No.GF-IQAMEF-IQA
[11][12][13][14][15][16][17][18][19]Proposed
1−0.4290.7140.6670.5000.5950.4520.8330.9520.9350.929
2−0.2990.0000.7790.7550.5390.4670.9700.9580.9340.934
3−0.071−0.3810.7860.6190.4760.4050.9761.0000.9540.976
40.357−0.6670.9760.7860.1670.5480.9270.9520.9270.905
5−0.1190.0240.7140.8100.6430.5710.8330.6190.8510.762
6−0.214−0.2860.6910.7860.5480.5240.9290.7620.9460.881
7−0.4520.5000.7380.8100.5000.2860.9290.8100.8830.952
8−0.048−0.6910.5950.4520.5240.4050.8570.9050.9090.976
9−0.2380.1670.2620.2860.0480.1190.7860.9050.8670.929
10−0.4290.8330.7620.6190.6910.5480.7140.9050.8440.714
11−0.7380.5480.0240.4050.1430.1430.5240.8810.7600.810
12−0.833−0.4290.5000.4290.3810.0710.8810.6910.8150.881
13−0.2140.3100.5240.3570.5240.4760.8810.8810.9550.881
140.0000.8100.7620.5480.5240.6670.8570.8570.9070.857
15−0.1930.0840.2770.3980.3860.4580.7830.9880.9070.988
16−0.476−0.2140.5710.5240.5950.5710.9520.9290.9410.857
17−0.3350.2990.9100.7310.5630.3110.9340.9340.8930.934
Average−0.2780.0590.6200.5770.4610.4130.8570.8780.8960.897
Hit count00100078911
Table 4. Performance resulted from each perceptual attribute of the proposed. MEF-IQA method averaged on the MEF database [21].
Feature CategoryPLCCSROCCRMSE
F10.7110.5911.029
F20.8900.7930.608
F30.6630.5661.096
Table 5. Performance comparison results for different numbers of scale.
Scale (l)PLCCSROCCRMSE
10.9330.8680.495
20.9450.8800.465
30.9520.8970.442
40.9470.8890.453