Article

Evolutionary Algorithms for Community Detection in Continental-Scale High-Voltage Transmission Grids

1
Dept. of Informatics, University of Almeria, E-04120 Almeria, Spain
2
Dept. of Engineering, University of Almeria, E-04120 Almeria, Spain
*
Author to whom correspondence should be addressed.
Symmetry 2019, 11(12), 1472; https://doi.org/10.3390/sym11121472
Submission received: 22 October 2019 / Revised: 27 November 2019 / Accepted: 28 November 2019 / Published: 3 December 2019
(This article belongs to the Special Issue Symmetry in Renewable Energy and Power Systems)

Abstract

:
Symmetry is a key concept in the study of power systems, not only because the admittance and Jacobian matrices used in power flow analysis are symmetrical, but because some previous studies have shown that in some real-world power grids there are complex symmetries. In order to investigate the topological characteristics of power grids, this paper proposes the use of evolutionary algorithms for community detection using modularity density measures on networks representing supergrids in order to discover densely connected structures. Two evolutionary approaches (generational genetic algorithm, GGA+, and modularity and improved genetic algorithm, MIGA) were applied. The results obtained in two large networks representing supergrids (European grid and North American grid) provide insights on both the structure of the supergrid and the topological differences between different regions. Numerical and graphical results show how these evolutionary approaches clearly outperform to the well-known Louvain modularity method. In particular, the average value of modularity obtained by GGA+ in the European grid was 0.815, while an average of 0.827 was reached in the North American grid. These results outperform those obtained by MIGA and Louvain methods (0.801 and 0.766 in the European grid and 0.813 and 0.798 in the North American grid, respectively).

Graphical Abstract

1. Introduction

The optimal design and management of these supergrids is a difficult task, since it is necessary to manage large systems that include heterogeneous power grids from different countries. Most investigations in power systems often analyse optimisation problems such as optimal power flow, unit commitment, and economic dispatch, among others [1,2]. The solutions to these problems are often determined by the symmetry of the admittance and Jacobian matrices [3,4], and the topology of high-voltage transmission lines that connect the power produced at generating stations to substations, at which point the power flow is derived to other transmission lines or stepped down in voltage, and then submitted across power distribution lines into the end users. Many publications have addressed the factors that constrain the development of electricity infrastructure [5,6]. In particular, experts have highlighted that existing electric grids are inadequate to cope with increasing volumes of renewable electricity [7]. For example, the transmission systems in European countries are old, and a many miles of lines need to be replaced, upgraded, and even expanded to secure market integration, ensure supply security, and cope with the expansion in renewable energy planned for the next few years [8]. A similar challenge is faced in the United States, where renewable energy generation also accounts for an increasingly high percentage of annual demand [9].
Taking into account the fact that worldwide demand for electricity has been increasing and will continue to, it is necessary to ensure the reliable and secure operation of electricity transmission networks to efficiently transport energy from generation sources to electricity consumers. To achieve this goal, decisions need to be supported by expert systems able to process a large number of variables. Graph-based network analysis is a powerful tool for describing many real systems in a variety of fields [10]. Topological analysis provides the infrastructural information of power systems that is essential to assess network robustness or to generate synthetic power grids [11]. For example, some studies have detected complex symmetric subgraphs in large-scale power grids [12], and have provided a list of symmetric subgraphs with respect to reference nodes observed in the US grid.
Most real networks (graphs) representing real systems have clusters, such that many edges connect nodes within the same cluster, and comparatively few edges connect nodes in different clusters. This is why community detection [13,14,15] has gained popularity in recent years, especially among researchers working with complex networks [16,17,18]. In particular, community detection has been applied in field of electrical engineering, including the management of power grids [19,20,21,22]. However, keeping the complexity of the problem in mind, more work is needed to develop efficient algorithms to enable rapid community detection. With that aim, this paper evaluates the performance of evolutionary approaches for community detection in supergrids. These algorithms, which are guided by the modularity index [23] and consider different degrees of abstraction (i.e., detect any number of communities), enable a flexible and adaptive analysis of the power grid.
The remainder of the paper is organized as follows: Section 2 briefly describes the problem of community detection using graphs, and revises some previous studies that have been applied to electrical grids. Section 3 presents the main characteristics of two evolutionary algorithms used to solve the community detection problem using graphs [24]. Section 4 presents an empirical study that compares these methods for community detection in two supergrids. The conclusions of this work are provided in Section 5.

2. Community Detection

This section introduces the use of community detection in different research areas and discusses how community detection methods contribute to the analysis of power grids.

2.1. Community Detection: General Overview

Communities, also named clusters, are dense subgraphs which are well separated from each other. The community structure of complex networks reveals both their organisation and hidden relationships, among other elements [25]. In practice, a simple idea that has attained great popularity is that a community is a subgraph such that many edges connect nodes within the same group, and comparatively few edges connect nodes in different groups [14].
Many studies in different disciplines have shown that the community structure of complex networks reveals both their organisation and hidden relationships among their elements [25]. In particular, identifying communities can be useful for classifying the nodes in different groups [13]. So, nodes located at a central position in their community may have an important function of control and stability within the cluster, while those nodes located at the proximity of other communities can play a role of mediation or information exchange with these neighbouring communities.
An important consideration to be determined here is the number of communities to be detected. Some algorithms allow one to include a pre-established number of communities to be detected, while other approaches aim to infer the adequate number of communities depending of the characteristics of the networks [14]. A recently published survey paper [26] has reviewed a large number of community detection algorithms in multidisciplinary applications considering both disjoint and overlapping community detection problems. These applications include the study of social networks [25,27], communication networks [28,29], engineering systems and networks [18,30], biology and ecology [31,32], health sciences [33], scientometrics [34,35], economics [36], etc.

2.2. Community Detection in Power Grids

In recent years, the interest in the development of supergrids has grown remarkably. The supergrid concept was born as a solution to allow large-scale electrical power exchanges over continent-wide areas. This concept has been considered both a potential solution to transmission bottlenecks and an opportunity to trade higher volumes of electricity across longer distances [37]. In particular, we show the complexity of several high-voltage transmission topologies intended to connect two or more subsystems here, and note that supergrids have a meshed form to provide redundancy. In addition to the use of complex control methods [38], the variability of renewable sources [39] at continental scales can be mitigated by using the transmission grid and balancing locally with storage [40]. Some of the future major transmission projects around the world are described in [37]. For example, different projects aim to promote an efficient and reliable transmission grid in North America, including the Tres Amigas superstation. This superstation is the first version of this supergrid vision, since it is projected as a high-voltage direct current (HVDC) super-node asynchronously connecting the existing alternating current (AC) networks intended to link the three North American grids: the Eastern Interconnection, the Western Interconnection, and Texas Interconnection. This project involves a three-way alternating current/direct current (AC/DC) transmission superstation with several miles of underground superconducting DC cable, which will eliminate the market separation between the three asynchronous interconnections in the continental U.S. [41]. In the case of Europe, these authors indicate that an important number of major HVDC interconnections are being promoted to establish intercontinental interconnections with neighbouring regions with the aim of integrating regional energy markets into a single European market to achieve the European Union’s (EU) renewable energy goals. Some authors have introduced the concept of global grid as the future stage of the electricity network, in which most of the large power plants in the world will be connected [42].
Some recent studies have proposed the analysis of the power grid infrastructure using graph-based network analysis techniques [19]. Usually, the nodes of the network represent the power plants and distribution and transmission substations, while the edges correspond to transmission lines. The application of graph-based analysis techniques has allowed for an analysis of the topological structure of networks representing power grids [43]. As commented above, a typical characteristic of all complex networks is the existence of community structures [13,15], such that detecting those communities can reveal the characteristics or functional relationships in a given network. In the case of power grids, communities represent substations densely connected by high-voltage transmission lines.
The importance of community detection in power grids comes from the fact that it is necessary to maintain grid reliability and enable more efficient restoration from severe disturbances. In particular, it is necessary to prepare a distribution grid for natural disasters (e.g., a storm), by developing switching plans to safely islands or disconnecting portions of the grid, preventing further degradation during incidents and enabling faster restoration after the disturbance. For example, reference [20] applied community detection to island power systems as an emergency response method to isolate failures that could propagate and lead to major disturbances. These authors developed two approaches based on modularity, with the DC power flow model incorporated into them, for islanding in medium and large networks and tested them in networks having 14, 30, 57, 118, and 247 nodes [20]. Other approaches use node similarity indexes to assign each node to the community sharing maximum similarity [22], and have demonstrated the good performance of this method in two IEEE standard power grids (39-bus standard power grid and 118-bus standard power grid). The IEEE 118-bus was also studied in [44]. Other researchers have presented a hierarchical spectral clustering method to reveal the internal connectivity of power transmission, establishing the possibility of islanding systems using a network with nodes and links representing buses and electrical transmission lines, respectively [21]. That approach was evaluated in several test systems of small, medium, and large sizes, including a model of Great Britain’s transmission network [21]. Community detection has also been applied to analyse the vulnerability of the power systems under terrorist attacks [45], among other applications. However, none of these previous approaches have analysed supergrids.

3. Methodology

Two genetic algorithms designed to detect communities in graphs were applied in large networks modelling supergrids. These evolutionary approaches are guided by modularity [23], which is an applied objective function extensively used in community detection due to its simplicity and ease of calculation. Modularity provides a numerical value that represents the quality of the solution, with greater values corresponding to a more accurate community structure. Therefore, the aim was to find communities that maximise the value of modularity (Q), defined as:
Q = 1 2 M ( a i j K i K j 2 M ) δ ( i , j ) ,
where M represents the total number of edges in the network; the sub-indices i and j indicate two nodes (vertices) of the network, K i and K j being the degrees of the i-th and j-th nodes, respectively; the parameter a i j is the element of the i-th row and the j-th column of the adjacency matrix; and δ ( i , j ) represents the relationship between the i-th node and the j-th node (i.e., δ ( i , j ) = 1 if node i and node j are in the same community; otherwise, δ ( i , j ) = 0 ).
Finding these communities by maximising the modularity [23] or another objective function is an NP-hard problem [46]. Brandes et al. [47] proved that modularity maximisation is an NP-hard problem, even for the restricted version with a bond of two clusters, and suggested further investigation of approximation algorithms and heuristics for solving this problem. More recently, other authors have demonstrated the high complexity of calculating modularity on sparse graphs and dense graphs separately [48]. Due to the high complexity of the community detection problem, researchers have applied heuristic and meta-heuristic methods to obtain high quality solutions, in a reasonable computational time.
The field of evolutionary computation [49] is closely related to computational intelligence, with a focus on designing algorithms to solve complex global optimisation problems. Evolutionary algorithms are problem-solving procedures that include evolutionary processes as the key design elements, such that a population of individuals is continually and selectively evolved until a termination criteria is fulfilled. Genetic algorithms (GAs) [50] are probably the most widely used evolutionary techniques. A genetic algorithm mimics natural selection by evolving, over time, a population of individual solutions to the problem at hand until a termination condition is fulfilled and the best individual is taken as an acceptable solution. Two important characteristics of GAs are the representation used (e.g., binary or real) and the genetic operators employed (e.g., mutation and crossover). GAs have been successfully applied to solve electrical problems [51,52,53].
In this study, two genetic algorithms were adapted to solve community detection problems in power grids. These algorithms (MIGA and GGA+) were recently proposed and shown to be more effective than other approaches to community detection, as assessed by benchmarks typically used to compare algorithms. Figure 1 shows the flowchart of MIGA and GGA+. The main characteristics of both methods are briefly described below.
  • The modularity and improved genetic algorithm (MIGA) [54] takes the modularity (Q) as the objective function, and uses the number of community structures as prior information to improve stability and accuracy of community detection. MIGA also uses simulated annealing [55] as local search strategy. Note that many authors have previously considered the use of local search strategies [56] for solving hard optimisation problems.
  • The generational genetic algorithm (GGA+): GGA+ [57] includes efficient and safe initialisation methods in which a maximum node size is assigned to each community. Several operators are applied to migrate or exchange nodes between communities while using the modularity function as the objective function. An important feature of GGA+ is that it is able to rapidly obtain community partitions with different degrees of abstraction.

4. Empirical Study

This section analyses the performance of the MIGA and GGA+ algorithms in detecting communities in two networks representing supergrids. Neglecting complex electrical properties, the nodes of the network represent the power plants and distribution and transmission substations, while the edges correspond to transmission lines. In this way, the power grid is simplified as an undirected and unweighted network.

4.1. Test Cases

To analyse the performance of the genetic algorithms, graphical models of two supergrids were considered: the European grid, including part of Russia, North Africa, and part of the Near East; and the North American grid.
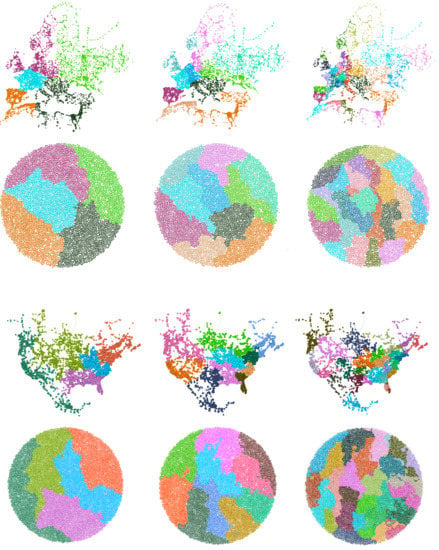
  • The European electric network was obtained from the European Network of Transmission System Operators (ENTSO-E) [58]. The ENTSO-E group consists of 43 electricity transmission system operators from 36 countries across Europe who are responsible for the bulk transmission of electric power on the main high-voltage electric networks. This power network, which also includes data from North African and Near Eastern countries, is formed by transmission lines designed for 220 kV voltage and higher and generation stations with a net generation capacity of more than 100 MW.
  • The North American electric network was obtained using the GridKit 1.0 toolkit, which was developed in the context of the SciGRID project at the NEXT ENERGY-EWE Research Centre for Energy Technology [59]. GridKit is a power grid extraction tool that converts geographical objects representing elements of power systems in OpenStreetMap to model the electric network. This network covers the United States, Canada, and Mexico and includes transmission lines that operate at relatively high-voltages varying from 69 kV up to 765 kV. The power grid of the United States is probably the best system studied in the literature, due to the particular characteristics of the network. The regions covered receive their bulk electricity from three separate electric grids: the huge Eastern Interconnection, the Western Interconnection, and the relatively small Texas grid [60], which is almost entirely managed by the Electric Reliability Council of Texas (ERCOT).
Table 1 describes some graphical characteristics of these networks. The number of nodes and edges is very large, which denotes the high complexity of community detection in these networks. Note that the dimensions of these networks are significantly larger than other power grids considered in recent studies (see, e.g., [22]). In fact, to our knowledge, no previous paper has applied graph-based analytical methods to power networks of these dimensions.

4.2. Parameter Configuration

To perform a fair comparison between the two evolutionary algorithms, the parameters were set to the values established in the original publications. The influence of GGA+ parameters was adjusted by means of a sensitivity analysis method based on executing the algorithms with different number of individuals and probabilities of using evolutionary search operators [44]. Statistical results obtained from these independent runs were considered to select the following parameters: the population size was set to 200 individuals; the number of iterations (generations) of the algorithm was set to 200; and the probability of applying the search operators was set between 20% and 80%. As commented above, MIGA also uses simulated annealing [55] as a local search strategy, with the following parameters: initial temperature 800,000, cooling rate 0.99, and minimum temperature 0.01. The experiments were performed on a personal computer with an Intel Core i7 3630Q processor (2.4 GHz, 8 GB DDR3 RAM), which executed the application we developed in the C# .Net Framework 4.

4.3. Results and Discussion

The accuracies of MIGA and GGA+ were evaluated according to the Q values. Table 2 shows the maxima, means, minima, and standard deviations (SD) of the modularities obtained by MIGA and GGA+ in the European (EA) and the North American (NA) grids considering c = {2, 3, 4, 5, 10, 20, 30, 40, 50} communities. A number of communities within the range of 2 to 50 were used to show how evolutionary algorithms are able to work under different levels of abstraction. However, these algorithms could be applied to obtain a greater number of communities, although their size would decrease considerably. The median runtimes (in minutes) of these 30 independent runs are also provided. Furthermore, the communities detected by Louvain modularity method implemented in Gephi are also shown in this table. To conduct the performance analysis and to statistically compare the quality of the solutions obtained by the two algorithms, a total of 30 independent runs were performed with each algorithm on each network.
These results show that GGA+ achieved the best mean and maximum values in both grids, regardless of the number of communities to be detected. These results also indicate that the greater the number of communities, the greater the advantage of GGA+ over MIGA. In addition, the standard deviation obtained from the results of these 30 independent runs was often smaller for GGA+ than for MIGA. The modularity values obtained by both algorithms increased with the number of communities without degradation of the standard deviation, indicating the robustness of these evolutionary approaches.
Table 2 shows that the runtime required by both evolutionary algorithms is of the same order of magnitude in the North American and European networks, while the differences come from the fact that the former has approximately double the number of nodes and edges as the latter (see Table 1). On the other hand, in both cases the runtime tends to decrease when the number of communities is greater. This is due to the crossover and mutation operators moving a given percentage of the nodes between a community and a neighbouring one. Therefore, the bigger the communities are, the higher that number of nodes that are moved between neighbouring communities, and therefore, the runtime increases. It can be concluded that GGA+ is scalable both in terms of network size and in terms of number of communities. Both algorithms require a few hours to complete the search process with these parameter settings, which is not a critical issue since the goal is to find solutions with greater modularity regardless of the execution time. Of course, the execution time could be reduced considerably by modifying the parameter settings or applying parallel processing techniques.
When two algorithms are compared, it is common to determine whether there are significant differences between the solutions they obtain. With this aim, a one-way ANOVA was applied, with the results indicating that the p-value was <0.05 in all cases; i.e., the null hypothesis was always rejected, which means that there was a significant difference between at least some of the means of the different groups. Thus, the results obtained by GGA+ were significantly different from those obtained by MIGA, validating the mean values in Table 2.
The analysis of Figure 2 reveals that there are some differences between the results obtained by the two methods when detecting three and twenty communities, especially when the number of communities increases. Each community in these networks is represented with a random colour. Even in the case of detecting only three communities, MIGA has some difficulties in assigning communities in some parts of the graph, while GGA+ obtains clearly differentiated communities. Considering these graphical results and the results provided in Table 2, it can be concluded that GGA+ not only outperforms to MIGA, but also exhibits good performance in these large networks.
The results obtained by GGA+ are analysed in more detail here. Figure 3a–c display the communities detected by GGA+ in the European power grid with 5, 10, and 30 communities. These results reveal that this algorithm is able to obtain good quality solutions even when the number of communities increases. Moreover, Figure 3d–f provide a different layout based on the ForceAtlas2 [61] plugin in Gephi for these three networks. While the results presented in Figure 3a–c correspond to the coordinates of each node, the results displayed in Figure 3d–f cannot be read as a Cartesian projection. Instead, ForceAtlas2 was in a drawing mode that has the specificity of placing each node depending on the other nodes. This visualisation method builds a force directed layout by simulating a physical system in order to accommodate nodes and links in a spatial network. Nodes repel each other like charged particles, while edges attract their nodes like springs. Note that the same colour is used to represent the physical layout and the distribution obtained by ForceAtlas2. Moreover, the number of nodes in each community is often balanced (e.g., the five communities obtained in the European grid have a percentage of nodes between 19.16% and 20.47% of the total of nodes), although there are some significant imbalances between clusters when the number of communities increases (e.g., 30 communities). The analysis of Figure 3 demonstrates the good behaviour of GGA+ independent of the degree of abstraction. Figure 4 shows how geographical structures change with the number of communities.
The analysis of the North American network supports similar conclusions. Thus, Figure 5a–c display the results obtained by GGA+ in that network when 5, 10, and 30 communities are detected. These data reveal that this algorithm is able to obtain good quality solutions not only with a few communities, but when the number of communities increases. The results obtained by the layout provided by ForceAtlas2 for these configurations (Figure 5d–f) demonstrate the good behaviour of GGA+ independent of the degree of abstraction. Finally, Figure 5 shows that the algorithm is able to obtain differentiated clusters, even when the number of communities increases significantly. The results obtained here are of particular interest, bearing in mind that the North American electrical grid is made up of three interconnections: the Western Interconnection, the Eastern Interconnection, and the ERCOT (Texas) Interconnection, which are not synchronised, and alternating current (AC) power must be converted to direct current (DC) power for transfer across any of the interconnections. To overcome these limitations, the Tres Amigas superstation has been planned in New Mexico (U.S.), a 1.6 billion dollar project that aims to connect these three primary interconnections to facilitate the smooth, reliable, and efficient transfer of green power from region to region while integrating substantial renewable energy sources [62]. Figure 6 shows how geographical structures in the North American grid change with the number of communities.

5. Conclusions

The optimal design of high-voltage transmission networks is a critical issue to supply electrical energy to residential areas and industries. In fact, the growing integration of power grids across regions requires investment in more transmission power supply systems to ensure system stability and guarantee power supplies. To reach that aim, it is important to investigate the topological characteristics of these supergrids. This paper opens a new avenue of research by analysing the community structures in supergrids in a fast and effective way. In particular, it is shown that solving the community detection problem with evolutionary algorithms allows one to obtain some key ideas about the structure of these networks. In particular, two evolutionary methods that include powerful initialisation methods and evolutionary search operators under the guidance of modularity were used to detect communities in large-scale networks. The evolutionary algorithms adopted a flexible and adaptive analysis of the characteristics of the power grids with different levels of detail (number of communities). The empirical study considered two large networks representing supergrids: (i) Europe, including Russia, North Africa, and part of the Near East (7893 nodes and 10,346 branches); and (ii) North America (16,063 nodes and 20,169 edges). In particular, these methods were able to partition the networks into some loosely coupled sub-networks (communities) of similar scale, such that nodes within a community were densely linked, while connections between different communities were sparser. Numerical and graphical analysis using graph visualisation tools showed that GGA+ slightly outperformed MIGA, especially when the number of communities increased. Both evolutionary approaches outperformed the modularity values of the communities detected by the Louvain method implemented in Gephi. The results obtained show that evolutionary approaches are efficient methods for detecting communities in supergrids having thousand of nodes, and provide interesting topological information about the physical distribution and concentration of these elements of the grids. Future work will apply parallel and multi-objective optimisation methods and include the electrical properties of the power networks.

Author Contributions

Conceptualisation, M.G. and R.B.; methodology, C.G. and R.B.; software, M.G. and R.B.; validation, M.G., R.B., and A.A.; formal analysis, F.G.M. and C.G.; investigation, M.G., R.B., and C.G.; resources, F.G.M.; data curation, R.B. and A.A.; writing—original draft preparation, R.B., F.G.M., and A.A.; writing—review and editing, R.B., F.G.M., and C.G.; visualisation, A.A. and F.G.M.; supervision, C.G. and R.B.; project administration, C.G. and F.G.M.

Funding

This research received funding by Spanish Ministry of Science, Innovation, and Universities (project PGC2018-098813-B-C33).

Acknowledgments

This research was supported by the Spanish Ministry of Science, Innovation and Universities (project PGC2018-098813-B-C33), and by the Regional Government of Andalusia (ceiA3 project).

Conflicts of Interest

The authors declare no conflict of interest.

References

  1. Alqurashi, A.; Etemadi, A.H.; Khodaei, A. Treatment of uncertainty for next generation power systems: State-of-the-art in stochastic optimization. Electr. Power Syst. Res. 2016, 141, 233–245. [Google Scholar] [CrossRef]
  2. Wang, Y.; Wang, S.; Wu, L. Distributed optimization approaches for emerging power systems operation: A review. Electr. Power Syst. Res. 2017, 144, 127–135. [Google Scholar] [CrossRef]
  3. Lin, W.M.; Teng, J.H. Three-phase distribution network fast-decoupled power flow solutions. Int. J. Electr. Power Energy Syst. 2000, 22, 375–380. [Google Scholar] [CrossRef]
  4. Kamel, S.; Jurado, F. Power flow analysis with easy modelling of interline power flow controller. Electr. Power Syst. Res. 2014, 108, 234–244. [Google Scholar] [CrossRef]
  5. Battaglini, A.; Komendantova, N.; Brtnik, P.; Patt, A. Perception of barriers for expansion of electricity grids in the European Union. Energy Policy 2012, 47, 254–259. [Google Scholar] [CrossRef]
  6. Codetta-Raiteri, D.; Bobbio, A.; Montani, S.; Portinale, L. A dynamic Bayesian network based framework to evaluate cascading effects in a power grid. Eng. Appl. Artif. Intell. 2012, 25, 683–697. [Google Scholar] [CrossRef]
  7. IEA; OECD. Security of Supply in Electricity Markets. Evidence and Policy Issues. 2002. Available online: https://www.oecd-ilibrary.org/energy/security-of-supply-in-electricity-markets_9789264174504-en (accessed on 11 November 2019).
  8. ENTSO-E. Ten-Year Network Development Plan 2010–2020. 2010. Available online: https://www.entsoe.eu/fileadmin/user_upload/_library/SDC/TYNDP/TYNDP-final_document.pdf (accessed on 11 November 2019).
  9. Cochran, J.; Denholm, P.; Speer, B.; Miller, M. Grid Integration and the Carrying Capacity of the U.S. Grid to Incorporate Variable Renewable Energy; Technical Report NREL/TP-6A20-62607; National Renewable Energy Laboratory: Golden, CO, USA, 2015. [Google Scholar]
  10. Bornholdt, S.; Schuster, H.G. Handbook of Graphs and Networks: From the Genome to the Internet; John Wiley & Sons, Inc.: New York, NY, USA, 2003. [Google Scholar]
  11. Espejo, R.; Lumbreras, S.; Ramos, A. Analysis of transmission-power-grid topology and scalability, the European case study. Phys. A Stat. Mech. Appl. 2018, 509, 383–395. [Google Scholar] [CrossRef]
  12. MacArthur, B.D.; Sánchez-García, R.J.; Anderson, J.W. Symmetry in complex networks. Discret. Appl. Math. 2008, 156, 3525–3531. [Google Scholar] [CrossRef] [Green Version]
  13. Fortunato, S. Community detection in graphs. Phys. Rep. 2010, 486, 75–174. [Google Scholar] [CrossRef] [Green Version]
  14. Fortunato, S.; Hric, D. Community detection in networks: A user guide. Phys. Rep. 2016, 659, 1–44. [Google Scholar] [CrossRef] [Green Version]
  15. Newman, M.E. Communities, modules and large-scale structure in networks. Nat. Phys. 2012, 8, 25–31. [Google Scholar] [CrossRef]
  16. Xiao, J.; Li, X.; Chen, S.; Wang, Y.; Han, J.; Zhou, Z. Complex network measurement and optimization of Chinese domestic movies with internet of things technology. Comput. Electr. Eng. 2017. [Google Scholar] [CrossRef]
  17. Xiao, Z.; Cao, B.; Zhou, G.; Sun, J. The monitoring and research of unstable locations in eco-industrial networks. Comput. Ind. Eng. 2017, 105, 234–246. [Google Scholar] [CrossRef]
  18. He, X.; Dong, Y.; Wu, Y.; Wei, G.; Xing, L.; Yan, J. Structure analysis and core community detection of embodied resources networks among regional industries. Phys. A Stat. Mech. Appl. 2017, 479, 137–150. [Google Scholar] [CrossRef]
  19. Pagani, G.A.; Aiello, M. The Power Grid as a complex network: A survey. Phys. A Stat. Mech. Appl. 2013, 392, 2688–2700. [Google Scholar] [CrossRef] [Green Version]
  20. Pahwa, S.; Youssef, M.; Schumm, P.; Scoglio, C.; Schulz, N. Optimal intentional islanding to enhance the robustness of power grid networks. Phys. A Stat. Mech. Appl. 2013, 392, 3741–3754. [Google Scholar] [CrossRef] [Green Version]
  21. Sánchez-García, R.J.; Fennelly, M.; Norris, S.; Wright, N.; Niblo, G.; Brodzki, J.; Bialek, J.W. Hierarchical Spectral Clustering of Power Grids. IEEE Trans. Power Syst. 2014, 29, 2229–2237. [Google Scholar] [CrossRef] [Green Version]
  22. Chen, Z.; Xie, Z.; Zhang, Q. Community detection based on local topological information and its application in power grid. Neurocomputing 2015, 170, 384–392. [Google Scholar] [CrossRef]
  23. Newman, M.E.; Girvan, M. Finding and evaluating community structure in networks. Phys. Rev. E 2004, 69, 026113. [Google Scholar] [CrossRef] [Green Version]
  24. IEA. Large-Scale Electricity Interconnection. Technology and Prospects for Cross-Regional Networks. 2016. Available online: https://www.iea.org/publications/freepublications/publication/Interconnection.pdf (accessed on 11 November 2019).
  25. Reihanian, A.; Feizi-Derakhshi, M.R.; Aghdasi, H.S. Community detection in social networks with node attributes based on multi-objective biogeography based optimization. Eng. Appl. Artif. Intell. 2017, 62, 51–67. [Google Scholar] [CrossRef]
  26. Javed, M.A.; Younis, M.S.; Latif, S.; Qadir, J.; Baig, A. Community detection in networks: A multidisciplinary review. J. Netw. Comput. Appl. 2018, 108, 87–111. [Google Scholar] [CrossRef]
  27. Kanavos, A.; Perikos, I.; Hatzilygeroudis, I.; Tsakalidis, A. Emotional community detection in social networks. Comput. Electr. Eng. 2018, 65, 449–460. [Google Scholar] [CrossRef]
  28. Nguyen, N.P.; Dinh, T.N.; Shen, Y.; Thai, M.T. Dynamic social community detection and its applications. PLoS ONE 2014, 9, e91431. [Google Scholar] [CrossRef] [PubMed]
  29. Soliman, S.S.; El-Sayed, M.F.; Hassan, Y.F. Semantic clustering of search engine results. Sci. World J. 2015, 2015, 931258. [Google Scholar] [CrossRef] [PubMed] [Green Version]
  30. Kicsi, A.; Csuvik, V.; Vidács, L.; Horváth, F.; Beszédes, Á.; Gyimóthy, T.; Kocsis, F. Feature analysis using information retrieval, community detection and structural analysis methods in product line adoption. J. Syst. Softw. 2019, 155, 70–90. [Google Scholar] [CrossRef]
  31. Atay, Y.; Koc, I.; Babaoglu, I.; Kodaz, H. Community detection from biological and social networks: A comparative analysis of metaheuristic algorithms. Appl. Soft Comput. 2017, 50, 194–211. [Google Scholar] [CrossRef]
  32. Rozylowicz, L.; Nita, A.; Manolache, S.; Popescu, V.D.; Hartel, T. Navigating protected areas networks for improving diffusion of conservation practices. J. Environ. Manag. 2019, 230, 413–421. [Google Scholar] [CrossRef]
  33. Soofi, S.; Ahmed, S.; Fox, M.P.; MacLeod, W.B.; Thea, D.M.; Qazi, S.A.; Bhutta, Z.A. Effectiveness of community case management of severe pneumonia with oral amoxicillin in children aged 2–59 months in Matiari district, rural Pakistan: A cluster-randomised controlled trial. Lancet 2012, 379, 729–737. [Google Scholar] [CrossRef]
  34. Gómez-Núñez, A.J.; Batagelj, V.; Vargas-Quesada, B.; Moya-Anegón, F.; Chinchilla-Rodríguez, Z. Optimizing SCImago Journal & Country Rank classification by community detection. J. Informetr. 2014, 8, 369–383. [Google Scholar]
  35. Carusi, C.; Bianchi, G. Scientific community detection via bipartite scholar/journal graph co-clustering. J. Informetr. 2019, 13, 354–386. [Google Scholar] [CrossRef]
  36. Jackson, M.O. An overview of social networks and economic applications. In Handbook of Social Economics; North-Holland (Elsevier): Amsterdam, The Netherlands, 2011; Volume 1, pp. 511–585. [Google Scholar]
  37. Arcia-Garibaldi, G.; Cruz-Romero, P.; Gómez-Expósito, A. Future power transmission: Visions, technologies and challenges. Renew. Sustain. Energy Rev. 2018, 94, 285–301. [Google Scholar] [CrossRef]
  38. DeMarco, C.L.; Baone, C.A. Control of Power Systems with High Penetration Variable Generation. In Renewable Energy Integration: Practical Management of Variability, Uncertainty, and Flexibility in Power Grids, 2nd ed.; Academic Press (Elsevier): San Diego, CA, USA, 2017; pp. 385–394. [Google Scholar]
  39. Wu, H.; Krad, I.; Florita, A.; Hodge, B.M.; Ibanez, E.; Zhang, J.; Ela, E. Stochastic multi-timescale power system operations with variable wind generation. IEEE Trans. Power Syst. 2016, 32, 3325–3337. [Google Scholar] [CrossRef]
  40. Schlachtberger, D.; Brown, T.; Schramm, S.; Greiner, M. The benefits of cooperation in a highly renewable European electricity network. Energy 2017, 134, 469–481. [Google Scholar] [CrossRef] [Green Version]
  41. Teichler, S.L.; Levitine, I. HVDC transmission: A path to the future? Electr. J. 2010, 23, 27–41. [Google Scholar] [CrossRef]
  42. Chatzivasileiadis, S.; Ernst, D.; Andersson, G. The global grid. Renew. Energy 2013, 57, 372–383. [Google Scholar] [CrossRef]
  43. Barthelemy, M. Spatial Networks. Phys. Rep. 2011, 499, 1–101. [Google Scholar] [CrossRef] [Green Version]
  44. Guerrero, M.; Montoya, F.G.; Baños, R.; Alcayde, A.; Gil, C. Community detection in national-scale high voltage transmission networks using genetic algorithms. Adv. Eng. Inform. 2018, 38, 232–241. [Google Scholar] [CrossRef]
  45. Wang, S.; Zhang, J.; Zhao, M.; Min, X. Vulnerability analysis and critical areas identification of the power systems under terrorist attacks. Phys. A Stat. Mech. Appl. 2017, 473, 156–165. [Google Scholar] [CrossRef]
  46. Nascimento, M.C.; Pitsoulis, L. Community detection by modularity maximization using GRASP with path relinking. Comput. Oper. Res. 2013, 40, 3121–3131. [Google Scholar] [CrossRef] [Green Version]
  47. Brandes, U.; Delling, D.; Gaertler, M.; Gorke, R.; Hoefer, M.; Nikoloski, Z.; Wagner, D. On modularity clustering. IEEE Trans. Knowl. Data Eng. 2008, 20, 172–188. [Google Scholar] [CrossRef] [Green Version]
  48. DasGupta, B.; Desai, D. On the complexity of Newman’s community finding approach for biological and social networks. J. Comput. Syst. Sci. 2013, 79, 50–67. [Google Scholar] [CrossRef] [Green Version]
  49. Fogel, D.B. Evolutionary Computation: Toward a New Philosophy of Machine Intelligence, 3rd ed.; John Wiley & Sons, Inc.: Hoboken, NJ, USA, 2006; 384p. [Google Scholar]
  50. Holland, J.H. Adaptation in Natural and Artificial Systems: An Introductory Analysis with Applications to Biology, Control, and Artificial Intelligence; University of Michigan Press: Ann Arbor, MI, USA, 1975; 183p. [Google Scholar]
  51. Sánchez, P.; Montoya, F.G.; Manzano-Agugliaro, F.; Gil, C. Genetic algorithm for S-transform optimisation in the analysis and classification of electrical signal perturbations. Expert Syst. Appl. 2013, 40, 6766–6777. [Google Scholar] [CrossRef]
  52. Wu, Y.; Tang, Y.; Han, B.; Ni, M. A topology analysis and genetic algorithm combined approach for power network intentional islanding. Int. J. Electr. Power Energy Syst. 2015, 71, 174–183. [Google Scholar] [CrossRef]
  53. Thakur, M.; Kumar, A. Optimal coordination of directional over current relays using a modified real coded genetic algorithm: A comparative study. Int. J. Electr. Power Energy Syst. 2016, 82, 484–495. [Google Scholar] [CrossRef]
  54. Shang, R.; Bai, J.; Jiao, L.; Jinm, C. Community detection based on modularity and an improved genetic algorithm. Phys. A Stat. Mech. Appl. 2013, 392, 1215–1231. [Google Scholar] [CrossRef]
  55. Kirkpatrick, S.; Vecchi, M.P.; Gelatt, C.D. Optimization by simulated annealing. Science 1983, 220, 671–680. [Google Scholar] [CrossRef]
  56. Kizys, R.; Juan, A.A.; Sawik, B.; Calvet, L. A biased-randomized iterated local search algorithm for rich portfolio optimization. Appl. Sci. 2019, 9, 3509. [Google Scholar] [CrossRef] [Green Version]
  57. Guerrero, M.; Montoya, F.G.; Baños, R.; Alcayde, A.; Gil, C. Adaptive community detection in complex networks using genetic algorithms. Neurocomputing 2017, 266, 101–113. [Google Scholar] [CrossRef]
  58. ENTSO-E. ENTSO-E Transmission System Map. 2019. Available online: https://www.entsoe.eu/map/Pages/default.aspx (accessed on 11 November 2019).
  59. Wiegmans, B. GridKit 1.0 ’for Scientists’ (Version v1.0). Zenodo. 2016. Available online: https://zenodo.org/record/47263#.XeT6e2ZumiM (accessed on 11 November 2019).
  60. Mazur, A.; Metcalfe, T. America’s three electric grids: Are efficiency and reliability functions of grid size? Electr. Power Syst. Res. 2012, 89, 191–195. [Google Scholar] [CrossRef]
  61. Jacomy, M.; Venturini, T.; Heymann, S.; Bastian, M. ForceAtlas2, a continuous graph layout algorithm for handy network visualization designed for the Gephi software. PLoS ONE 2014, 9, e98679. [Google Scholar] [CrossRef]
  62. TresAmigas. Tres Amigas Superstation Project. 2019. Available online: http://www.tresamigasllc.com/ (accessed on 11 November 2019).
Figure 1. Flowchart of (a) MIGA and (b) GGA+.
Symmetry 11 01472 g001
Figure 2. Results obtained by Louvain modularity method, MIGA, and GGA+ for the European grid (three and 20 communities).
Symmetry 11 01472 g002
Figure 3. Results obtained by GGA+ for the European power grid: physical layout with (a) five communities, (b) 10 communities, and (c) 30 communities. Distribution obtained by ForceAtlas2 with (d) five communities, (e) 10 communities, and (f) 30 communities.
Symmetry 11 01472 g003aSymmetry 11 01472 g003b
Figure 4. Physical layout of the communities detected by GGA+ in the European network using different degrees of abstraction (the number of communities is indicated in parentheses).
Symmetry 11 01472 g004
Figure 5. Results obtained by GGA+ for the North American power grid: physical layout with (a) five communities, (b) 10 communities, and (c) 30 communities. Distribution obtained by ForceAtlas2 with (d) five communities, (e) 10 communities, and (f) 30 communities.
Symmetry 11 01472 g005
Figure 6. Physical layout of the communities detected by GGA+ in the North American network using different degrees of abstraction (the number of communities is indicated in parentheses).
Symmetry 11 01472 g006
Table 1. Graph description of the European (EU) and North American (NA) power grids.
FeatureEU GridNA Grid
Nodes789316,063
Edges10,34620,169
Average degree2.622.51
Network diameter108158
Avg. path length41.2748.99
Avg. clustering coefficient0.070.01
Eigenvector centrality1.701.87
Table 2. Results obtained by MIGA and GGA+ after 30 independent runs and comparison with Louvain method implemented in Gephi (runtime in minutes).
GridMethodMetricc = 2c = 3c = 4c = 5c = 10c = 20c = 30c = 40c = 50AVG
EU Max(Q)0.4960.6600.7400.7850.8770.9110.9210.9240.9220.804
Mean(Q)0.4950.6540.7360.7810.8720.9090.9180.9220.9210.801
MIGAMin(Q)0.4910.6120.7300.7770.8660.9070.9160.9200.9190.793
SD(Q)0.0010.0090.0020.0020.0020.0010.0010.0010.0010.002
Mean time515632404409289296205237246359
Max(Q)0.4980.6650.7460.7930.8890.9290.9410.9430.9480.817
Mean(Q)0.4980.6630.7440.7930.8870.9270.9380.9420.9470.815
GGA+Min(Q)0.4960.6610.7420.7910.8850.9250.9370.9400.9460.814
SD(Q)0.0000.0010.0010.0010.0010.0010.0010.0010.0000.001
Mean time661614556417443462314228244438
Louvain(Q)0.2910.5990.6770.6990.8740.9290.9390.9440.9450.766
NA Max(Q)0.4980.6630.7430.7880.8820.9240.9390.9450.9480.814
Mean(Q)0.4980.6590.7400.7890.8780.9220.9370.9440.9470.813
MIGAMin(Q)0.4970.6560.7360.7850.8720.9210.9360.9430.9460.810
SD(Q)0.0000.0020.0020.0020.0030.0010.0010.0000.0000.001
Mean time1228770708747425317423559244602
Max(Q)0.4990.6700.7530.8040.9000.9430.9560.9630.9670.828
Mean(Q)0.4990.6690.7530.8020.8980.9400.9550.9620.9660.827
GGA+Min(Q)0.4980.6670.7510.8010.8930.9360.9540.9610.9650.825
SD(Q)0.0000.0010.0010.0010.0010.0020.0010.0000.0000.001
Mean time190913351221568521764593552298862
Louvain(Q)0.4780.6080.6520.7540.8810.9350.9520.9590.9630.798

