Abstract
Deep learning has been successfully applied to classification tasks in many fields due to its good performance in learning discriminative features. However, the application of deep learning to printing defect classification is very rare, and there is almost no research on the classification method for printing defects with imbalanced samples. In this paper, we present a deep convolutional neural network model to extract deep features directly from printed image defects. Furthermore, considering the asymmetry in the number of different types of defect samples—that is, the number of different kinds of defect samples is unbalanced—seven types of over-sampling methods were investigated to determine the best method. To verify the practical applications of the proposed deep model and the effectiveness of the extracted features, a large dataset of printing detect samples was built. All samples were collected from practical printing products in the factory. The dataset includes a coarse-grained dataset with four types of printing samples and a fine-grained dataset with eleven types of printing samples. The experimental results show that the proposed deep model achieves a 96.86% classification accuracy rate on the coarse-grained dataset without adopting over-sampling, which is the highest accuracy compared to the well-known deep models based on transfer learning. Moreover, by adopting the proposed deep model combined with the SVM-SMOTE over-sampling method, the accuracy rate is improved by more than 20% in the fine-grained dataset compared to the method without over-sampling.
1. Introduction
Surface defect detection and classification are important tasks in many fields, such as the manufacturing industry [1,2], textile industry [3], and printing industry [4,5]. For the printing industry, with the increasing speed of modern printing machines and the increasing requirements of printing enterprises in terms of product quality, traditional detection and classification methods based on human visual inspection are impossible. Therefore, more attention has been given to developing automated defect detection and classification system in the printing production process. To date, most of the detection systems based on machine vision can detect defects well, but they cannot accurately classify the types of printing defects. For some defects detected by the system, detection systems only need to make a mark since these defects are temporary. However, other defects may be caused by abnormal equipment and are called serious defects; these types of defects will always exist in the process of production and will result in a massive waste of printing materials. Therefore, enterprises urgently require accurate automatic classification of printing defects, to be able to automatically distinguish different types of defects to analyze the causes of defects and to facilitate production management.
In the present situation, many image classification methods have been proposed for different objects [6]. However, little research has been conducted on the classification of printing defects [7,8,9]. The reason for this paucity of research is that collecting a large number of defect samples occurring in actual production is difficult work; indeed, most of the defect samples used in the previous study were scanned in the laboratory [9]. Moreover, some defects rarely happen during the printing production process but may still be serious defects, which waste a great deal of printing materials and affect printing quality. Due to the asymmetry in the number of samples of different kinds of defects, some types of defects have more samples, while others have fewer samples. As a result, classification performance will be influenced by this problem. In addition, finding more discriminant features is a crucial problem for improving classification performance. However, the existing feature extraction methods for printing defects are all based on the manual design of the feature extraction algorithm, which cannot extract the representative features directly from raw printing images automatically.
In this paper, we propose a deep learning method for printing defect classification using imbalanced samples. The key contributions of the paper can be highlighted as follows: (1) To boost the study of printing defect classification, a large printing defect dataset is built; (2) to learn more representative features from printing defect samples directly, a deep model based on a deep convolutional neural network is proposed; (3) to solve the problem of the imbalance of samples, we present expanding the samples at the feature level instead of expanding the number of images.
The rest part of this paper is organized as follows. In Section 2, we review some related work for printing defect classification. In Section 3, we detail our proposed method. The experiment is demonstrated in Section 4 by comparing it with other methods. Finally, the conclusions are addressed in Section 5.
2. Related Work
Most of the existing methods for classifying printing defects are traditional methods, which include feature extraction and classifier design. In [7], a three stage identification approach was proposed, which includes a global thresholding procedure, a feature extraction procedure using PCA, and a classification procedure. This approach only achieved an 80.5% classification accuracy rate. The study in [8] focused on shape-defects and color-defects, as well as their areas, aspect ratios, average of red luminance, average of green luminance, and average of blue luminance; these features were selected as feature variables, and the correct recognition ratios for the shape-defect and color-defect were 93% and 90.5%, respectively. In [9], four features (area, perimeter, circularity, and linearity) were employed as the input of support vector machine (SVM) for classifying printing defects, where defects were divided into three categories. All the above-mentioned feature extraction approaches focus on hand-crafted features, which cannot extract discriminative features directly from the raw image. Currently, deep learning methods have shown a strong ability to detect and classify objects; these methods include VGGNet [10], GoogLeNet [11], and ResNet [12]. However, they are rarely applied in the field of printing defect classification due to two reasons. First, collecting printing defect samples at a large scale is costly because of the low probability of defects in the practical production process. Second, the distribution of different types of printing defects may be uneven. In this paper, a deep learning model based on the deep convolutional neural network (DCNN) is proposed to extract more discriminative features for classifying types of printing defects. To verify the effectiveness of the proposed method, a large printing defect image dataset is built, in which all defect samples are cropped from the original printing images, and each sample consists of two images: a template image and a defect image aligned with the template image. The dataset includes four coarse-grained categories, with 15,307 printing defect samples, and 11 fine-grained categories, with 17,604 printing defect samples. Then, the proposed model is compared with different popular neural network models. The experimental results demonstrate the effectiveness of the proposed model.
In addition, the distribution of different types of printing defects might be unbalanced—that is, the sample number of the different types of printing defects is asymmetrical. However, the classifier is sensitive to an imbalance of samples, which will result in a high classification accuracy rate for the majority class but low accuracy for the minority class [13]. To this end, many researchers have addressed the classification problem with imbalanced samples. Generally, the methods for dealing with the imbalanced data can be classified into four classes: the feature selection method, the ensemble method, the algorithm-based method, and the sampling-based method [14]. In this paper, we focus on the sampling-based method, which can be further divided into three classes: over-sampling, under-sampling, and hybrid methods that combine both over-sampling and under-sampling. Among these three types of sampling methods, over-sampling is the most popular method to solve the problem of classifying imbalanced data. Although many over-sampling methods have been proposed, they have not been used in the field of classifying printing defects with imbalanced data. In this paper, seven over-sampling methods (random over-sampling (ROS) [15], the synthetic minority over-sampling technique (SMOTE) [16], the adaptive synthetic sampling approach (ADASYN) [17], Borderline-SMOTE [18], SMOTE-Nominal Continuous (SMOTE-NC) [19], SMOTE-Edited Nearest Neighbours (SMOTE-ENN) [20], and SVM-SMOTE [21]) have been selected to investigate the improved classification performance for printing defects.
3. Methodology
3.1. Overview of the Proposed Method
The framework of the proposed classification method for printing defects is depicted in Figure 1; it consists of three stages: deep model training, over-sampling for determining the best classifier, and the testing stage. In the stage of deep model training, two types of deep models are employed to extract the deep features of printing defects. The first is our designed deep learning model based on a deep convolutional neural network (DCNN), and the second includes some deep models based on transferring learning, which are used to compare against our proposed deep model. In the training procedure, the softmax classifier is used to evaluate the effectiveness of the deep features extracted by different deep models. In the second stage, seven over-sampling methods are investigated for training the SVM classifier, where the deep features are obtained by the deep model trained in the first stage. By the over-sampling methods, the features of the minority class are expanded to improve the performance of the classifier. Once the deep model and the classifier have been trained, the classification results of the testing samples can be achieved in the third stage.
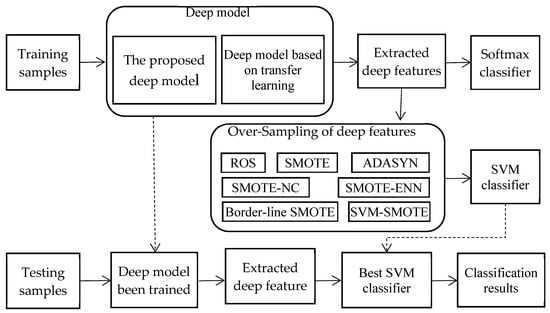
Figure 1.
The framework of our proposed classification method for printing defects.
3.2. The Proposed Deep Model for Feature Extraction
Feature extraction is a vital step for classification problems. Owing to the powerful ability of feature extraction, methods based on deep learning have become popular in many fields. However, to the best of our knowledge, these are no investigations on the application of deep learning in classifying printing defects. Thus, an elaborated deep model based on DCNN is proposed in this paper. The structure of the proposed deep model is shown in Figure 2.
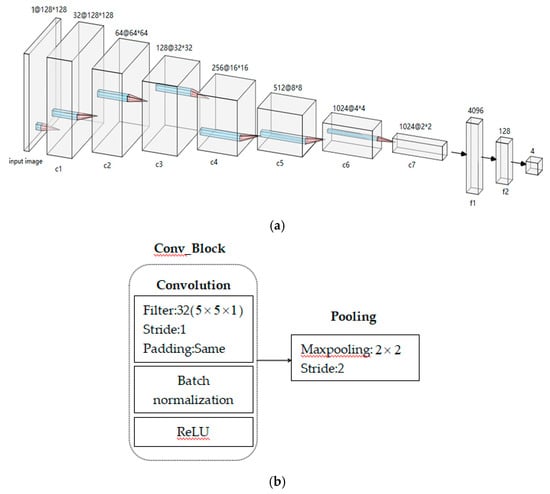
Figure 2.
The proposed deep model. (a) Model structure; (b) convolution block and pooling. ReLU, rectified linear unit.
As shown in Figure 2a, the proposed deep model consists of seven convolutional layers, two fully connected layers, and one classification layer. Each convolutional layer includes a convolutional block and a pooling unit, as shown in Figure 2b. The convolutional block is constructed by three types of basic units: convolution, batch normalization (BN), and rectified linear unit (ReLU) activation. In Figure 2a, The filter sizes from the input layer to the c6 layer are all , while those from the c6 layer to the c7 layer are since the size of the feature map in the c6 layer is too small. With a decrease in the size of the feature maps from the c1 layer to the c7 layer, the number of feature maps gradually grows—32, 64, 128, 256, 512, 1024, and 1024 from the c1 layer to the c7 layer, respectively. During the process of convolution, the size of stride is one and the padding mode is the ‘same mode’.
The BN is used to speed up network training and prevent overfitting of the network by reducing internal covariate shift. If the output values of over a mini-batch are , the BN is first employed to normalize each channel and then shifts and scales the channel, as shown in Equations (1) and (2) [22].
where and are the mean and variance of a mini-batch, respectively, and are the scale and shift parameters, respectively, which can be optimized during network training, and is a small constant added to the mini-batch variance for numerical stability.
Compared with traditional nonlinear activation functions, such as tanh and sigmoid, the ReLU has a faster network convergence speed since it retains only the positive part of the activation. Therefore, the ReLU is used as the activation function of the deep model in this paper. The expression of the ReLU is given as follows.
Following each convolution block, max-pooling is used to maintain feature invariance with respect to translation, rotation, and scale and reduce the spatial size of the feature map. The kernel size in the pooling layer is , and the stride is 2. All parameters are selected based on experience and the experimental test.
3.3. The Deep Model Based on Deep Transfer Learning
Transfer learning is an important machine learning method, which can transfer the knowledge from a source domain to the target domain to solve the problem of insufficient training data. Due to the powerful abilities of deep learning in many fields, deep transfer learning has become a research focus in the field of machine learning. Based on [23], deep transfer learning can be divided into various classes: instance-based deep transfer learning, mapping-based deep transfer learning, network-based deep transfer learning, and adversarial-based deep transfer learning. Motivated by the successful applications of many deep neural network models in object classification, network-based deep transfer learning is investigated in this paper.
Over the past decades, many famous deep neural network models have been proposed for object classification, such as Xception, Inception, AlexNet, VGGNet, GoogLeNet, and ResNet. According to [24], the networks of Xception, Inception, VGGNet, and ResNet are suitable for transfer. Thus, these networks are transferred to the field of printing defect classification in this paper. Table 1 gives the structure of these deep models based on transfer learning. In Table 1, the structure and connection parameters of these networks in the front-layers are reused—that is, they are frozen during training in the updated networks.

Table 1.
Deep models based on deep transfer learning.
For each network that we used in Table 1, full connection layers, selected by our experiments and connected to the final convolutional layer, are designed. Two of the best full connection layers for each network are shown in the third column of Table 1. The second column in Table 1 is the output shape of each corresponding network. The model VGG16-2 means that this model is transferred from the VGG16 model, and the corresponding structure of the full connection layer is “512→256→>4”—that is, we add two full connection layers and one classification layer in the final convolutional layer of the VGG16 model, and the corresponding node numbers of these three layers are 512, 256, and 4, respectively. Similarly, other models in the first column of Table 1 have the same meanings as those in the model of VGG16-2.
3.4. Solutions to Imbalanced Classification Problems
Due to the large difference in the number of samples of different categories of printed image defects, the classification performance will be affected by these imbalanced datasets. The classification performance is especially poor for the minority class. To reduce the influence of an imbalanced dataset, some over-sampling methods are explored in this paper to improve the classification performance of printing defects.
Although many algorithms have been proposed for the classification of an imbalanced dataset, most of them are complex and easily generate unnecessary noise. In actual applications, a sampling-based method is preferable method due to its applicability to any classification task without changing its learning strategy. Among sampling-based methods, the synthetic minority over-sampling technique (SMOTE) is the most popular [25]. Thus, SMOTE and its modified versions are investigated, including (ROS) [15], SMOTE [16], the Adaptive synthetic sampling approach (ADASYN) [17], Borderline-SMOTE [18], SMOTE-NC [19], SMOTE-ENN [20], and SVM-SMOTE [21].
The ROS method randomly copies minority class samples and adds them to the original samples until the desired class distribution is reached. Due to the simplicity of ROS, it is likely to be the most frequently used method in practice. To overcome the problem of overfitting faced by the ROS method, the SMOTE method generates artificial samples by linearly interpolating a randomly selected minority sample and one of its neighboring samples. The steps of the SMOTE method are as follows. First, a random minority sample is chosen. Then, another sample is selected randomly among its nearest minority class neighbor
where is a random number between 0 and 1.
The remaining five methods are all modified versions of SMOTE. The ADASYN method calculates the number of the majority class in the neighbors of the minority class before generating the data and then uses the SMOTE algorithm to generate the same ranges as the majority class. Unlike the random selection of the samples in SMOTE, the Borderline-SMOTE method selects samples close to the class border. In SMOTE-NC, the newly generated sample categories are determined by selecting the categories that occur most frequently in the nearest neighbor during generation. For SMOTE-ENN, before data expansion, the k-nearest neighbor of the sample is first calculated. If most classes in the nearest neighbor are of the same kind as the samples being extended, they will be retained; otherwise, they will be discarded. Afterward, the SMOTE is used to generate new samples. The SVM-SMOTE method first uses SVM to classify the data set and then use SMOTE to extend the samples near the hyper-plane. Details for the above-mentioned five methods can be found in the studies listed in the reference.
4. Experimental Results and Analysis
4.1. Dataset and Evaluation Index
Due to the low probability of printing defects occurring in actual production, collecting defect samples is difficult work. To this end, we cooperated for a significant amount of time with a company whose printing defect detection system has been installed in many enterprises. By using the detection system, a coarse-grained dataset with 15,307 defect sampling was built first. According to the brightness, color, shape, and other characteristics of the printing image defect, the samples are roughly divided into four categories: light defect (LD), dark defect (DD), knife wire defect (KD), and color deviation (CD). Figure 3 illustrates some defect examples for the different classes, while Table 2 shows the number of different classes. As seen in Table 2, there exists a class imbalance problem, in which the number of CD defects is very low compared to that if other classes. To further analyze the reasons that such defects are generated, a fine-grained dataset with eleven types of printing defects was also built, which will be discussed in Section 3.4.
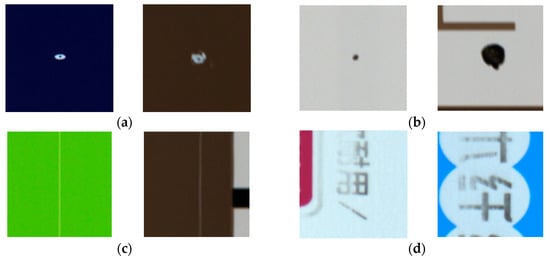
Figure 3.
Print defect: (a) light defect; (b) dark defect; (c) knife wire defect; (d) color deviation.

Table 2.
Number of different defect classes in the coarse-grained dataset.
For each defect sample, two images can be obtained by the defect system: the template image and the defect image aligned with the template image. To focus on the defect region, all images in the dataset are cropped from the original images. Figure 4 illustrates a group of these images. In order to further remove the influence of the background, the defect image is preprocessed by subtracting the corresponding template image. Figure 4c shows a preprocessed image of the defect image in Figure 4b, where the background is removed, and the defect is exposed. In the next experiment, preprocessed defect images are employed as the inputs for the deep model.

Figure 4.
Defect image preprocessing: (a) template image; (b) defect image; (c) pre-processed defect image.
To compare the proposed method with other methods, three indices—Accuracy, True Positive Rate (TPR) and False Positive Rate (FPR)—are employed to evaluate the classification performance and are defined as follows.
where , , , and are the number of true positives, true negatives, false positives, and false negatives, respectively.
4.2. Comparison with Well-Known Deep Models Based on Transfer Learning
In this subsection, our proposed deep model is compared with famous deep models based on transfer learning. As shown in Table 1, the weight parameters of the well-known deep models are retained in the convolutional layers, and the weight parameters of the full connection layer and the softmax classifier are trained by using training samples. This experiment was conducted on the coarse-grained dataset, where two thirds of the samples in each class were used for training the deep models, and the others were used to test the classification performance.
Table 3 gives a performance comparison of our proposed deep model with other well-known deep models based on transfer learning. From Table 3, we can see that the proposed deep model achieves the highest accuracy, which means that the proposed model can extract better features than other deep models. Thus, the proposed model is used as the feature extractor in the following experiment. However, the classification accuracy of the CD class, compared to other classes, is relatively low. The reason for this accuracy is that the sample number of the CD class is small. To solve this imbalanced dataset problem, the over-sampling method will be explored in the next subsection.

Table 3.
Performance comparison of different deep models (%).
4.3. Analysis of Over-Sampling Methods
In Section 3.3, seven over-sampling methods were briefly introduced. To evaluate the performance of these methods, they are first investigated on the coarse-grained dataset. The classification results are given in Table 4. As shown in Table 4, compared to the methods without over-sampling, the classification accuracy when using over-sampling methods has been significantly improved, which means that using over-sampling methods on features extracted by our deep model is a good solution for classifying printing defects. In addition, SMOTE-ENN achieves the best results of all seven over-sampling methods.

Table 4.
The accuracy of different over-sampling methods on the coarse-grained dataset (%).
To better understand the effectiveness of the feature descriptor and the over-sampling method intuitively, t-distributed stochastic neighbor embedding (t-SNE) [26] is used as a subjective evaluation method. The t-SNE method has been proven to be effective for evaluating various types of features. Here, we show the feature distributions extracted by our deep models and the feature distribution diagrams after using the SMOTE and SMOTE-ENN over-sampling methods, which are shown in Figure 5. From Figure 5a, we can see that the features extracted by our deep models have good distinctiveness. Further, the distances between the features of different classes have optimal class separability, which will contribute to a better classification result. However, the distributions of the different classes are uneven, which will affect the classification performance for the minority class. As shown in Figure 5b,c, the feature distributions after using the over-sampling methods are improved, and the classification performance, as shown in Table 4, experiences greater improvement.
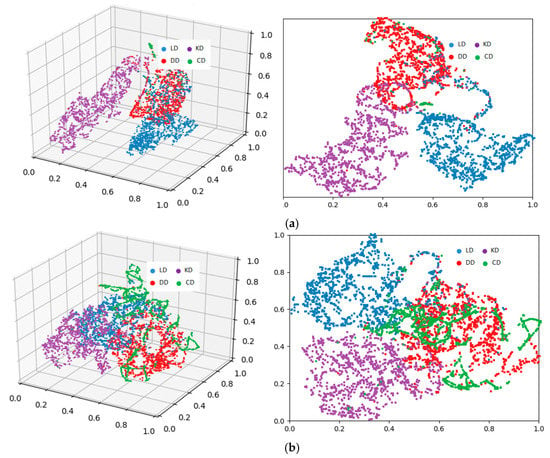
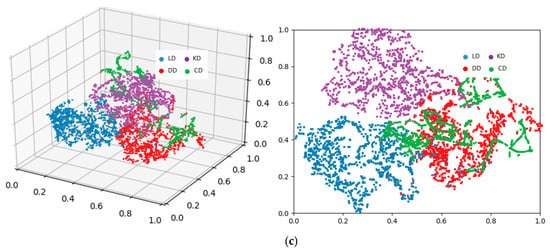
Figure 5.
The t-distributed stochastic neighbor embedding (t-SNE) distribution of the original features and expanded features using over-sampling methods. (a) Original features; (b) expanded features using the SMOTE method; (c) expanded features using SMOTE-ENN.
In order to further verify the discriminating ability of the over-sampling methods using the features extracted by our deep model, the receiver operating characteristic (ROC) curve and the value of the AUC (Area Under Curve) are given in Figure 6, where the x-coordinate is , and the y-coordinate is . According to the criteria shown in Equation (8), all over-sampling methods offer very good judgment for our extracted features.
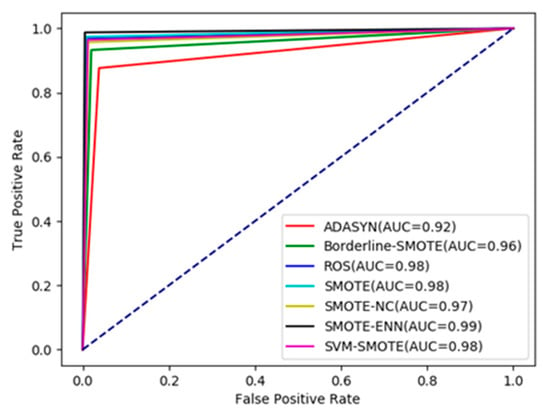
Figure 6.
The receiver operating characteristic (ROC) curves and Area Under Curve (AUC) values using over-sampling methods on a coarse-grained dataset.
4.4. Classification Results on the Fine-Grained Dataset
During the process of printing production, defects may be caused in many ways, such as part faults of the printing equipment, printing materials, or printing technology. To better analyse the reasons that cause printing defects, we used a fine-grained dataset with eleven types of printing defects. Apart from defects of the LD, KD, and DD classes, six new types of printing defects have been added—crystal (CT), point (PT), no printing (NP), smears (SS), overprint (OP), and trailing (TL). Furthermore, the original dark defects (DD class) are divided into two categories: paper powder (PP) and ink (IK). The defects of the PP class are caused by paper wool in the cutting process, while the defects of the IK class are also called the ink skin, which is generated by low ink viscosity. Figure 7 shows some examples of these six types of printing defects. Table 5 gives the number of samples of the different classes in the fine-grained dataset. As shown in Table 5, the class distribution of the fine-grained dataset is more imbalanced than the samples in the coarse-grained dataset, which is likely to be more challenging to study.
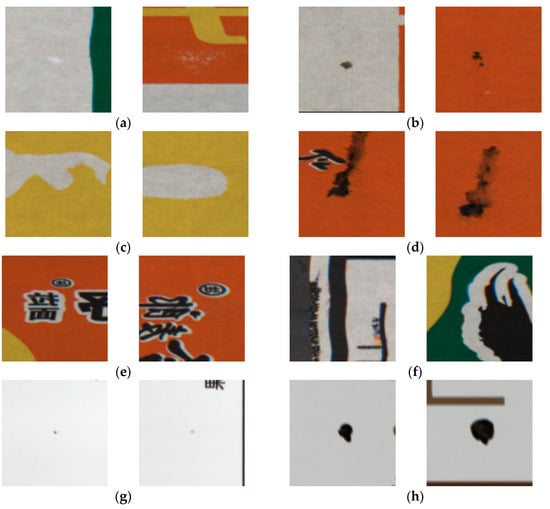
Figure 7.
Examples of newly-added printing defects. (a) crystal (CT); (b) point (PT); (c) no printing (NP); (d) smears (SS); (e) overprint (OP); (f) trailing (TL); (g) paper powder (PP); (h) ink (IK).

Table 5.
Number of defect samples of different classes in the fine-grained dataset.
Table 6 illustrates the results of classification accuracy on the fine-grained dataset. For the classification method without over-sampling, the accuracy of the SS, NP, and TL classes is very low, and the average accuracy rate is only 72.60%. However, the accuracy rate is over 90% when using any over-sampling method except Border-SMOTE, which means that the over-sampling method is a good solution for imbalanced printing defect datasets. The ROC curves in Figure 8 also demonstrate the effectiveness of the features extracted by our deep model combined with the over-sampling method.

Table 6.
Results of classification accuracy on the fine-grained dataset (%).
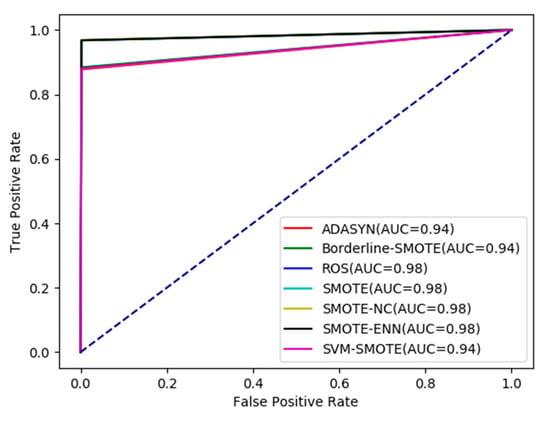
Figure 8.
The ROC curves and AUC values using over-sampling methods on the fine-grained dataset.
Based on the above experimental results, the proposed method achieves good performance compared to some well-known deep models. The reason for this performance is that the proposed deep model can extract more discriminative features for defection classification. Moreover, instead of traditional methods, which expand the number of defect images, we augment the samples of the minority class after feature extraction via over-sampling methods, which can improve the diversity of the distribution of the minority class.
5. Conclusions
In this paper, a printing defect classification method based on deep learning has been presented. To our knowledge, no deep learning-based method has been applied to the field of printing defect classification at present. The essence of this approach is that the prosed deep model is combined with the over-sampling method, where the proposed deep model can extract the discriminative features of printing defects, and the over-sampling method is used to solve the problem of an imbalanced printing defect dataset. Moreover, a large dataset of printing detect samples is built, which includes a coarse-grained dataset with four types of printing defects and a fine-grained dataset with eleven types of printing defects. Based on the method of deep transfer learning, well-known deep models are also employed for printing defect classification. The experimental results demonstrate that the proposed deep model is superior to the well-known deep models based on transfer learning. In addition, seven over-sampling methods are used to solve the classification problem of unbalanced printing defect samples. By using over-sampling methods on the features extracted by our deep model, classification performance was improved greatly. In our future work, we will develop more advanced, robust, and generalized methods based on deep learning to further improve classification performance. Furthermore, the execution time of the proposed method needs to be considered so that it can adapt to the speed of the printing press.
Author Contributions
E.Z. conceived this study and wrote the manuscript. B.L. designed the deep models and wrote the program code. P.L. designed the research and the experiment. Y.C. acquired the test images and performed the experiments.
Funding
This work is supported by the Key Program of Natural Science Foundation of Shaanxi Province of China under Grant No. 2017JZ020, the Project of Science and Technology of Shaanxi Province of China under Grant No. 2019GY-080, and the Project of Xi’an University of Technology of China under Grant No. 108-45148006.
Conflicts of Interest
The authors declare no conflicts of interest.
References
- Annaby, M.H.; Fouda, Y.M.; Rushdi, M.A. Improved Normalized Cross-Correlation for Defect Detection in Printed-Circuit Boards. IEEE Trans. Semicond. Manuf. 2019, 32, 199–211. [Google Scholar] [CrossRef]
- Zapata, J.; Vilar, R.; Ruiz, R. Performance evaluation of an automatic inspection system of weld defects in radiographic images based on neuro-classifiers. Expert Syst. Appl. 2011, 38, 8812–8824. [Google Scholar] [CrossRef]
- Kang, X.; Zhang, E. A universal defect detection approach for various types of fabrics based on the Elo-rating algorithm of the integral image. Text. Res. J. 2019, 89, 4766–4793. [Google Scholar] [CrossRef]
- Zhang, E.; Chen, Y.; Gao, M.; Duan, J.; Jing, C. Automatic Defect Detection for Web Offset Printing Based on Machine Vision. Appl. Sci. 2019, 9, 3598. [Google Scholar] [CrossRef]
- Zhang, E.; Zhang, Y.; Duan, J. Color Inverse Halftoning Method with the Correlation of Multi-Color Components Based on Extreme Learning Machine. Appl. Sci. 2019, 9, 841. [Google Scholar] [CrossRef]
- Zhang, Y.; Zhang, E.; Chen, W. Deep neural network for halftone image classification based on sparse auto-encoder. Eng. Appl. Artif. Intell. 2016, 50, 245–255. [Google Scholar] [CrossRef]
- Ugbeme, O.; Saber, E.; Wu, W. An automated defect classification algorithm for printed documents. In Proceedings of the Final Program and Proceedings, ICIS’06 International Congress of Imaging Science, Rochester, NY, USA, 7–11 May 2006; pp. 317–320. [Google Scholar]
- Ishimaru, I.; Hata, S.; Hirokari, M. Color-defect classification for printed-matter visual inspection system. In Proceedings of the 4th World Congress on Intelligent Control and Automation (Cat No 02EX527) WCICA-02, Shanghai, China, 10–14 June 2002; Volume 4, pp. 3261–3265. [Google Scholar]
- Shu, W.; Liu, Q. Classification method of printing defects based on support vector machine. Packag. Eng. 2014, 35, 138–142. [Google Scholar]
- Simonyan, K.; Zisserman, A. Very Deep Convolutional Networks for Large-Scale Image Recognition. In Proceedings of the 2015 International Conference on Learning Representations (ICLR 2015), SanDiego, CA, USA, 7–9 May 2015. [Google Scholar]
- Szegedy, C.; Liu, W.; Jia, Y.; Sermanet, P.; Reed, S.; Anguelov, D.; Erhan, D.; Vanhoucke, V.; Rabinovich, A. Going deeper with convolutions. In Proceedings of the IEEE Conference on Computer Vision and Pattern Recognition, Boston, MA, USA, 7–12 June 2015. [Google Scholar]
- He, K.; Zhang, X.; Ren, S.; Sun, J. Deep Residual Learning for Image Recognition. In Proceedings of the 2016 IEEE Conference on Computer Vision and Pattern Recognition (CVPR), Las Vegas, NV, USA, 26 June–1 July 2016; pp. 770–778. [Google Scholar]
- Hou, W.; Wei, Y.; Jin, Y.; Zhu, C. Deep features based on a DCNN model for classifying imbalanced weld flaw types. Measurement 2019, 131, 482–489. [Google Scholar] [CrossRef]
- Jian, C.; Gao, J.; Ao, Y. A new sampling method for classifying imbalanced data based on support vector machine ensemble. Neurocomputing 2016, 193, 115–122. [Google Scholar] [CrossRef]
- He, H.; Garcia, E. Learning from imbalanced data. IEEE Trans. Knowl. Data Eng. 2009, 21, 1263–1284. [Google Scholar]
- Chawla, N.V.; Bowyer, K.W.; Hall, L.O.; Kegelmeyer, W.P. SMOTE: Synthetic Minority Over-sampling Technique. J. Artif. Intell. Res. 2002, 16, 321–357. [Google Scholar] [CrossRef]
- He, H.; Bai, Y.; Garcia, E.A.; Li, S. ADASYN: Adaptive synthetic sampling approach for imbalanced learning. In Proceedings of the 2008 IEEE International Joint Conference on Neural Networks (IEEE World Congress on Computational Intelligence), Hong Kong, China, 1–8 June 2008; pp. 1322–1328. [Google Scholar]
- Han, H.; Wang, W.Y.; Mao, B.H. Borderline-SMOTE: A New Over-Sampling Method in Imbalanced Data Sets Learning. In Proceedings of the International Conference on Intelligent Computing, Hefei, China, 23–26 August 2005; pp. 878–887. [Google Scholar]
- Li, D.C.; Chen, H.Y.; Shi, Q.S. Learning from small datasets containing nominal attributes. Neurocomputing 2018, 291, 226–236. [Google Scholar] [CrossRef]
- Cao, Q.; Wang, S. Applying Over-sampling Technique Based on Data Density and Cost-sensitive SVM to Imbalanced Learning. In Proceedings of the 2011 International Conference on Information Management, Innovation Management and Industrial Engineering, Shenzhen, China, 26–27 November 2011; Volume 2, pp. 543–548. [Google Scholar]
- Akbani, R.; Kwek, S.; Japkowicz, N. Applying Support Vector Machines to Imbalanced Datasets. In Proceedings of the 15th European Conference on Machine Learning, ECML 2004, Pisa, Italy, 20–24 September 2004; Volume 3201, pp. 39–50. [Google Scholar]
- Ioffe, S.; Szegedy, C. Batch Normalization: Accelerating Deep Network Training by Reducing Internal Covariate Shift. In Proceedings of the 32th International Conference on Machine Learning, ICML, Lile, France, 6–11 July 2015; pp. 448–456. [Google Scholar]
- Tan, C.; Sun, F.; Kong, T.; Zhang, W.; Yang, C.; Liu, C. A survey on deep transfer learning. In Proceedings of the 27th International Conference on Artificial Neural Networks, Rhodes, Greece, 4–7 October 2018; pp. 270–279. [Google Scholar]
- Yosinski, J.; Clune, J.; Bengio, Y.; Lipson, H. How transferable are features in deep neural networks? In Proceedings of the 28th Annual Conference on Neural Information Processing Systems 2014 (NIPS 2014), Montreal, QC, Canada, 8–13 December 2014; pp. 3320–3328. [Google Scholar]
- Douzas, G.; Bacao, F.; Last, F. Improving imbalanced learning through a heuristic oversampling method based on k-means and SMOTE. Inf. Sci. 2018, 465, 1–20. [Google Scholar] [CrossRef]
- Van der Maaten, D.; Hinton, G. Visualizing data using t-SNE. J. Mach. Learn. Res. 2008, 9, 2579–2605. [Google Scholar]
© 2019 by the authors. Licensee MDPI, Basel, Switzerland. This article is an open access article distributed under the terms and conditions of the Creative Commons Attribution (CC BY) license (http://creativecommons.org/licenses/by/4.0/).