Article

Risk Assessment of Shunting Derailment Based on Coupling

1
School of Traffic and Transportation, Beijing Jiaotong University, Beijing 100044, China
2
Hexi Transportation Section, ShenShuo Railway Company, Yulin 719316, China
*
Author to whom correspondence should be addressed.
Symmetry 2019, 11(11), 1359; https://doi.org/10.3390/sym11111359
Submission received: 7 October 2019 / Revised: 26 October 2019 / Accepted: 29 October 2019 / Published: 2 November 2019

Abstract

:
Shunting operation is risky and complex because of the nonlinear coupling effect of personnel, equipment, environment and management, which reflects symmetry, can easily cause shunting derailment accidents. Traditional railway safety risk assessment techniques seldom consider the nonlinear coupling relationships of hazard factors in the shunting process,. The Decision Making Trial and Evaluation Laboratory (DEMATEL) and Analytic Network Process (ANP), which are applicable to the coupling analysis of complex systems, have been used in many areas to overcome this shortcoming. Thus, this paper built a hybrid model, developed by integrating DEMATEL and ANP methodologies, to determine the multifarious interdependencies’ relative strengths among the hazard factors and to assess the relative importance of the hazard factors with Super Decision (SD) software. By constructing the “frequency-consequence-vulnerability” three-dimensional risk parameter model, the risk magnitude of shunting derailment could be obtained through risk aggregation process. Finally, the model was applied to the risk assessment of shunting derailment in Huangyangcheng station, the results revealed that this model was effective and efficient, which could yield more reliable and realistic solutions to the shunting safety.

1. Introduction

Railway shunting operation is a complex dynamic system and full of symmetry, which has the characteristics of all-weather operation, high labor intensity, wide scope of operation, diverse operation objects and complex operation organization; in addition, the public security environment and climate environment often change, all these factors can trigger shunting derailment accidents and cause casualties or property losses. Shunting derailment accident refers to the event that during shunting operation, the wheels of locomotive, vehicle, bullet train and heavy railcar fall off the track surface, charge into the stop buffer or track by themselves after derailment. The causal chain theory of accidents proposed by Heinrich clarified the relationship between various factors leading to the casualty accidents, as well as the relationship between these factors and casualties. The theory held that every accident was not caused by a single factor, but by a large number of unsafe behaviors and unsafe conditions [1,2]. Haddon’s theory of accident control argued that an accident was an abnormal, or unwanted, transfer of energy, that various forms of energy constituted the direct cause of the accident, and that each energy change had an energy source, a path, and a receiver [3,4]. The above theories further indicate that there are complex relationships among personnel, equipment, environment and management factors in shunting operation process, and this kind of relationship has important effect on shunting derailment accidents. Therefore, it is of great significance to assess the shunting derailment risk to ensure shunting safety. Furthermore, recognizing, analyzing and highlighting the important hazard factors can assist in proper planning, successful implementation of risk management and appropriate responses to eliminate, transfer or control the corresponding shunting risks.
The concept of “coupling” derives from physics and refers to the phenomenon that two or more systems or motion forms interact with each other through various interactions so as to interact jointly [5,6]. Coupling has different meanings in different fields. In the field of risk management, risk coupling refers to the degree of interdependence and interaction among different risk factors in the process of complex system activities [7]. At present, many experts and scholars have studied risk coupling, involving engineering, finance, coal mining and other related fields. Kameshwar and Padgett [8] used a parameterized fragility method to assess the portfolio risk of highway bridges. Jiang and Fan [9] studied the coupling relationship between credit risk contagion and sentiment contagion with the help of propagation dynamics theory. He et al. [10] used electromagnetic emission and micro-seismic coupling method to evaluate the risk of rock burst in coal mines, and the research results provided a basis for the control and effect detection of rock burst.
However, the traditional railway safety risk assessment methods seldom consider the mutual coupling relationships among hazard factors. For example, the analytic hierarchy process (AHP) technology just considers the dominant effect of the upper level elements on the lower level when calculating the risk weight, and assumes that the elements in the same level are independent of each other, which is difficult to accurately reflect the feedback effect of the lower level elements on the upper level of the system and the mutual influence of the elements in the same level. ANP, as an extension of AHP, is a useful tool for settling complex decision making problems, which can assess the dependencies and feedbacks among factors in different clusters to select the relative weights of the risk factors [11,12], and it has been applied in many fields. Yang et al. [13] proposed a multicriteria optimization and compromise solution model using ANP and DEMATEL methods, which could handle information security and risk-control problems. Chang et al. [14] used ANP, fuzzy Delphi and TOPSIS to select the best location of service apartments in Taiwan. Farias et al. [15] used an integrated approach based on ANP to assess the effect of green and lean practical activities on organizational performance and prioritize improvements in the system. Yeh et al. [16] studied the key elements considered in affecting the location of wind farms, ANP and DEMATEL approaches were applied to explore the correlation among the dimensions and the weights of criteria. DEMATEL method can also handle complex relationships among system factors, and it is often used to draw the relationships concerning interdependencies and the intensity of interdependence among complex elements in an evaluation index system, so as to screen evaluation indicators [17,18,19]. Hwang et al. [17] applied DEMATEL approach in the risk assessment process of project life cycle to systematically determine and evaluate the potential relationship between hazard factors. Vinodh and Vikas [18] used a fuzzy multi-criteria decision-making approach to choose the best Lean Six Sigma (LSS) project for an automotive component company, Fuzzy-DEMATEL was used to calculate the interdependencies between LSS criteria.
However, DEMATEL and ANP methods also have some shortcomings. Firstly, DEMATEL technology is not suitable for calculating the relative weight of risk criteria. Secondly, ANP cannot be used to analyze the complex influence relationship of system factors in risk identification stage. Thirdly, both of them have no clear definition on relative importance, causing the idea of judgment matrix construction contradictory. Actually, the DEMATEL-ANP approach can address the above problems, especially in dealing with complex systems and limited information. The influence degrees of each factor can be obtained by DEMATEL method, and then the ANP method can be applied to get risk factor’s relative weights. Thus, integrating DEMATEL with ANP can effectively identify the critical attributes of shunting derailment and evaluate weights of hazard factors. And we can define the connotation of “influence” for DEMATEL and ANP methods, where the influence degree in DEMATEL method represents “influence on interaction”, while in ANP approach it represents “influence on importance”. Many fields are showing increasing interest in utilizing the DEMATEL-ANP method. For example, Buyukozkan and Guleryuz [19] applied DEMATEL and ANP approaches to select the most appropriate renewable energy resources in Turkey. Hu et al. [20] developed a framework for air cargo terminal service quality using DEMATEL technology combined with ANP method. Shao et al. [21] applied a hybrid model based on DEMATEL and ANP methods to improve the green building assessment system in China. Dehdasht et al. [22] used DEMATEL-ANP model to conduct risk assessment in oil and gas construction projects to help making policies for ensuring reliable energy supply schedules.
Risk refers to the effect of uncertainty on objectives [23]. Risk is often expressed by a combination of the consequence of an event and the probability of occurrence [24]. At present, the two-dimensional risk matrix model of frequency - consequence is commonly used. Hsu et al. [25] used the improved frequency-consequence matrix to evaluate the transportation safety of dangerous goods by air. Jacek [26] used fuzzy risk matrix to assess aviation risks. Zhang and Sun [27] used two-dimensional risk parameters to assess the safety risk of railway special line shunting. However, two-dimensional risk parameter model does not consider other attributes of risk, and its oversimplification has drawn criticism from many experts [28,29]. In view of the complexity of hazard factors, many experts tried to conduct three-dimensional risk assessment model. Aven et al. [30] considered manageability as an important factor. Cagno et al. [31] believed that controllability should be taken as an evaluation parameter of the expected impact before and after the adoption of risk measures. Zhang [32] took vulnerability as the third parameter of project risk assessment. Han et al. [33] took materiality as the evaluation parameter of international project risk management. Vulnerability is an important concept of natural science and social science, which is widely used in climate change, biophysics, risk management and disaster management. Due to different research objects, we can get different definitions, and there is no consensus on the concept. International Organization for Standardization defined vulnerability as ”Intrinsic properties of something resulting in susceptibility to a risk source that can lead to an event with a consequence”. In view of the complexity of shunting derailment risk affected by coupling factors, the concept of vulnerability is given, which refers to the situation or state that shunting derailment is easy to occur in shunting operation due to the coupling effect of internal and external elements. In this paper, vulnerability is taken as the third parameter of shunting derailment risk assessment to ensure a better evaluation effect.
In this study, we proposed an integrated and innovative railway shunting derailment risk assessment model based on DEMATEL and ANP methods. This model could not only be used to explore the network relationship of hazard factors for coupling analysis but also could obtain the influential weights of the hazard factors in shunting operation system. In the risk identification stage, DEMATEL method was used to choose the risk factors and quantitatively express the degree of interaction among risk factors. While in the risk analysis stage, the risk magnitude of hazard factors was calculated by building a three-dimensional risk parameter model, and ANP method was used to quantitatively analyze the influence of the relative importance weight of disaster factors with SD software, so as to obtain the shunting derailment risk. In the risk evaluation stage, radar chart was used to evaluate the frequency, consequence, vulnerability and weight after normalization, so as to establish the sequence of risk response. Finally, the approach was applied to the risk assessment of shunting derailment in Huangyangcheng station.
The remaining structure of this paper was as follows: The second chapter introduced the risk assessment method of this paper, including the application of DEMATEL and ANP methods in different stages of risk assessment, and the construction of “frequency-consequence-vulnerability” three-dimensional risk parameter model. The third chapter introduced the practicability of the method by taking the risk assessment of shunting derailment in Huangyangcheng station as an example. Chapter four summarized some views of policymakers on the use of the DEMATEL-ANP model. Chapter five summarized the innovation of this research and pointed out the advantages and disadvantages of this method.

2. Risk Assessment Model for Railway Shunting Derailment

Risk assessment is the whole process of risk identification, risk analysis and risk evaluation [34]. In this section, we introduced the integrated model that combines DEMATEL with ANP to set up the interdependent structure and gain the weights of the shunting derailment hazard factors in a coupled environment. Figure 1 presented an overview of the shunting derailment risk assessment process, which was also a hybrid proposed model using both DEMATEL and ANP. As shown in Figure 1, the model consisted of three main stages, which included risk identification, risk analysis and risk evaluation of shunting derailment based on both ANP and DEMATEL methodologies.

2.1. Identification of Shunting Derailment Hazard Factors

In this stage, the collected risk information was analyzed by experts to preliminarily form a list of hazard factors, and then DEMATEL method was used to further analyze the cause-and-effect coupling relationship among the factors to obtain the interaction intensity sequence of hazard factors. The specific steps were as follows:
Step1: Selecting a group of experts to evaluate the interaction effect of hazard factors, and giving suggestions on safety information analysis in the evaluation process.
Step2: Analyzing the shunting derailment information. The collected shunting derailment risk data was used to analyze the safety situation of shunting with the help of experts’ experience to form a list of hazard factors about shunting derailment.
Step3: Establishing the direct influence matrix. Assuming exist the following express instructions: (0, no influence), ( 1, small influence), (2, moderate influence), (3, high influence), (4, great influence), the selected experts were requested to give the degree of direct influence that each factor i exerted on each factor j , which was denoted by a i j ,and the direct influence matrix A could be expressed by Equation (1):
A = ( a i j ) n × n = [ a 11 a 1 j a 1 n . . . . . . a i 1 a i j a i n . . . . . . a n 1 a n j a n n . ] ( 1 i n , 1 j n )
Step4: Normalizing the direct influence matrix. Equation (2) and (3) were used to get the normalized direct relation matrix D .
k = j = 1 m a i j 1 i n max
D = 1 k A
Step5: Calculating the total-relation matrix [13]. The total-relation matrix T could be calculated by Equation (4), where I was the identity matrix.
T = D + D 2 + D 3 + + D n = D ( I D ) 1 = ( t ij ) n × n ( i , j = 1 , 2 , n ) .  
What’s more, we could get row sum and column sum from matrix T , which could be expressed by Equation (5) and (6).
R = ( r i ) n × 1 = j = 1 n t i j n × 1
F = ( f j ) n × 1 = ( f j ) 1 × n = i = 1 n t i j 1 × n
where r i represented the row sum of the i th row in matrix T , and it expressed the sum of total effect of element i on the other elements. Similarly, f j represented the column sum of the j th column in matrix T , and it represented the sum of total effect that element j had received from the other elements. In addition, ( r i + f j ) denoted the degree of the central role, representing the strength of influence that element i gave and received. If (rifj) was positive, then element i was an affecting element, and if (rifj) was negative, then element i was an affected element.
Step6: Drawing cause and effect diagraph. The graph was drawn using (ri + fj) as the horizontal axis and (rifj) as the vertical axis, and the less influential hazard factors were eliminated.

2.2. Analysis of Shunting Derailment Risk

In this stage, the definition of vulnerability was given and a “frequency-consequence-vulnerability” three-dimensional risk parameter model was constructed. The risk level of hazard factors was calculated by semi-quantitative analysis. ANP was used to measure the relative weights of hazard factors, so the magnitude of shunting derailment risk could be obtained.

2.2.1. Risk Calculation of Shunting Derailment Hazard Factors

By defining “vulnerability”, the “frequency-consequence” two-dimensional risk parameter model was extended to “frequency-consequence-vulnerability” three-dimensional risk parameter model to calculate the risk size of hazard factors.
Step1: Calculating the vulnerability of shunting derailment risk. According to the concept of “vulnerability” in this paper, it was closely related to the coupling of shunting derailment hazard factors. “Vulnerability” was calculated by Equation (7), and then it was classified in step2, so as to unify the expression forms with other parameters to conduct semi-quantitative analysis.
v i = ( 1 + r i i r i ) ( 1 + f i i f i ) ( 1 i n ) .  
Where, v i was vulnerability, r i was the row sum of the i th row in matrix T , f j was the column sum of the j th column in matrix T .
Step2: Classification of risk parameters. According to the semi-quantitative risk classification method of frequency and consequence in the British Standard for railway application [35], the occurrence frequency and consequence of shunting derailment risk could be classified into five levels, as shown in Table 1 and Table 2. At present, there were no appropriate grading criteria for vulnerability, the risk vulnerability of shunting derailment was divided into five levels considering the expert’s experience in Table 3. According to “As Low As Reasonably Practicable” criterion, the shunting derailment risk level could be divided into four rankings in Table 4 [36,37].
Step3: Calculation of shunting derailment hazard factors risk. The three-dimensional risk parameter model could be expressed by Equation (8), and we could get the risk size of hazard factors by Equation (9).
R L h a z a r d = F ( L , S , V )
Where, R L h a z a r d was the risk size of the shunting derailment hazard factor, L was frequency, S was consequence, and V was vulnerability.
R L h a z a r d = L + S + V
Where, R L h a z a r d , L , S , V were all discrete integers.
There were two explanations about the risk magnitude calculation of shunting derailment hazard factors:
(1) A semi-quantitative analysis method could be used in three-dimensional risk assessment. Semi-quantitative analysis was an analytical method that made qualitative analysis datamation and mathematical operation possible. Semi-quantitative analysis was expressed by data (such as 1, 2, 3, etc.), but without accurate values (such as 3.8, 8.43, etc.), so it was not as accurate as quantitative analysis. When “frequency-consequence” two-dimensional matrix was used for semi-quantitative risk assessment, the risk magnitude corresponded to a discrete point in the plane graph, while the “frequency-consequential-vulnerability” three-dimensional risk parameter model was used for semi-quantitative risk assessment, each risk parameter scale could be expressed in the form of numerical value, while the risk magnitude of hazard factor events corresponded to a discrete point in three-dimensional space.
(2) “Addition” algorithm was suitable for three-dimensional risk assessment. In a two-dimensional risk matrix, the magnitude or magnitude of the risk was expressed as the “combination” of the result and its possibility, not only specifically referring to the “multiplication” relationship, but also could be “addition” relationship, or other functional relations. Literature [35] point out that the adoption of “multiplication” algorithm for frequency and results might lead to inaccuracy and inconsistency of the final risk magnitude, and it suggested using “addition” algorithm. When the semi-quantitative method was used to get the risk magnitude of hazard factor events, if the “multiplication” algorithm was adopted for three dimensional parameters calculation, the results might be less accurate than two-dimensional parameter model, so the “addition” algorithm was adopted in this paper.

2.2.2. The Weights Calculation of Shunting Derailment Hazard Factors

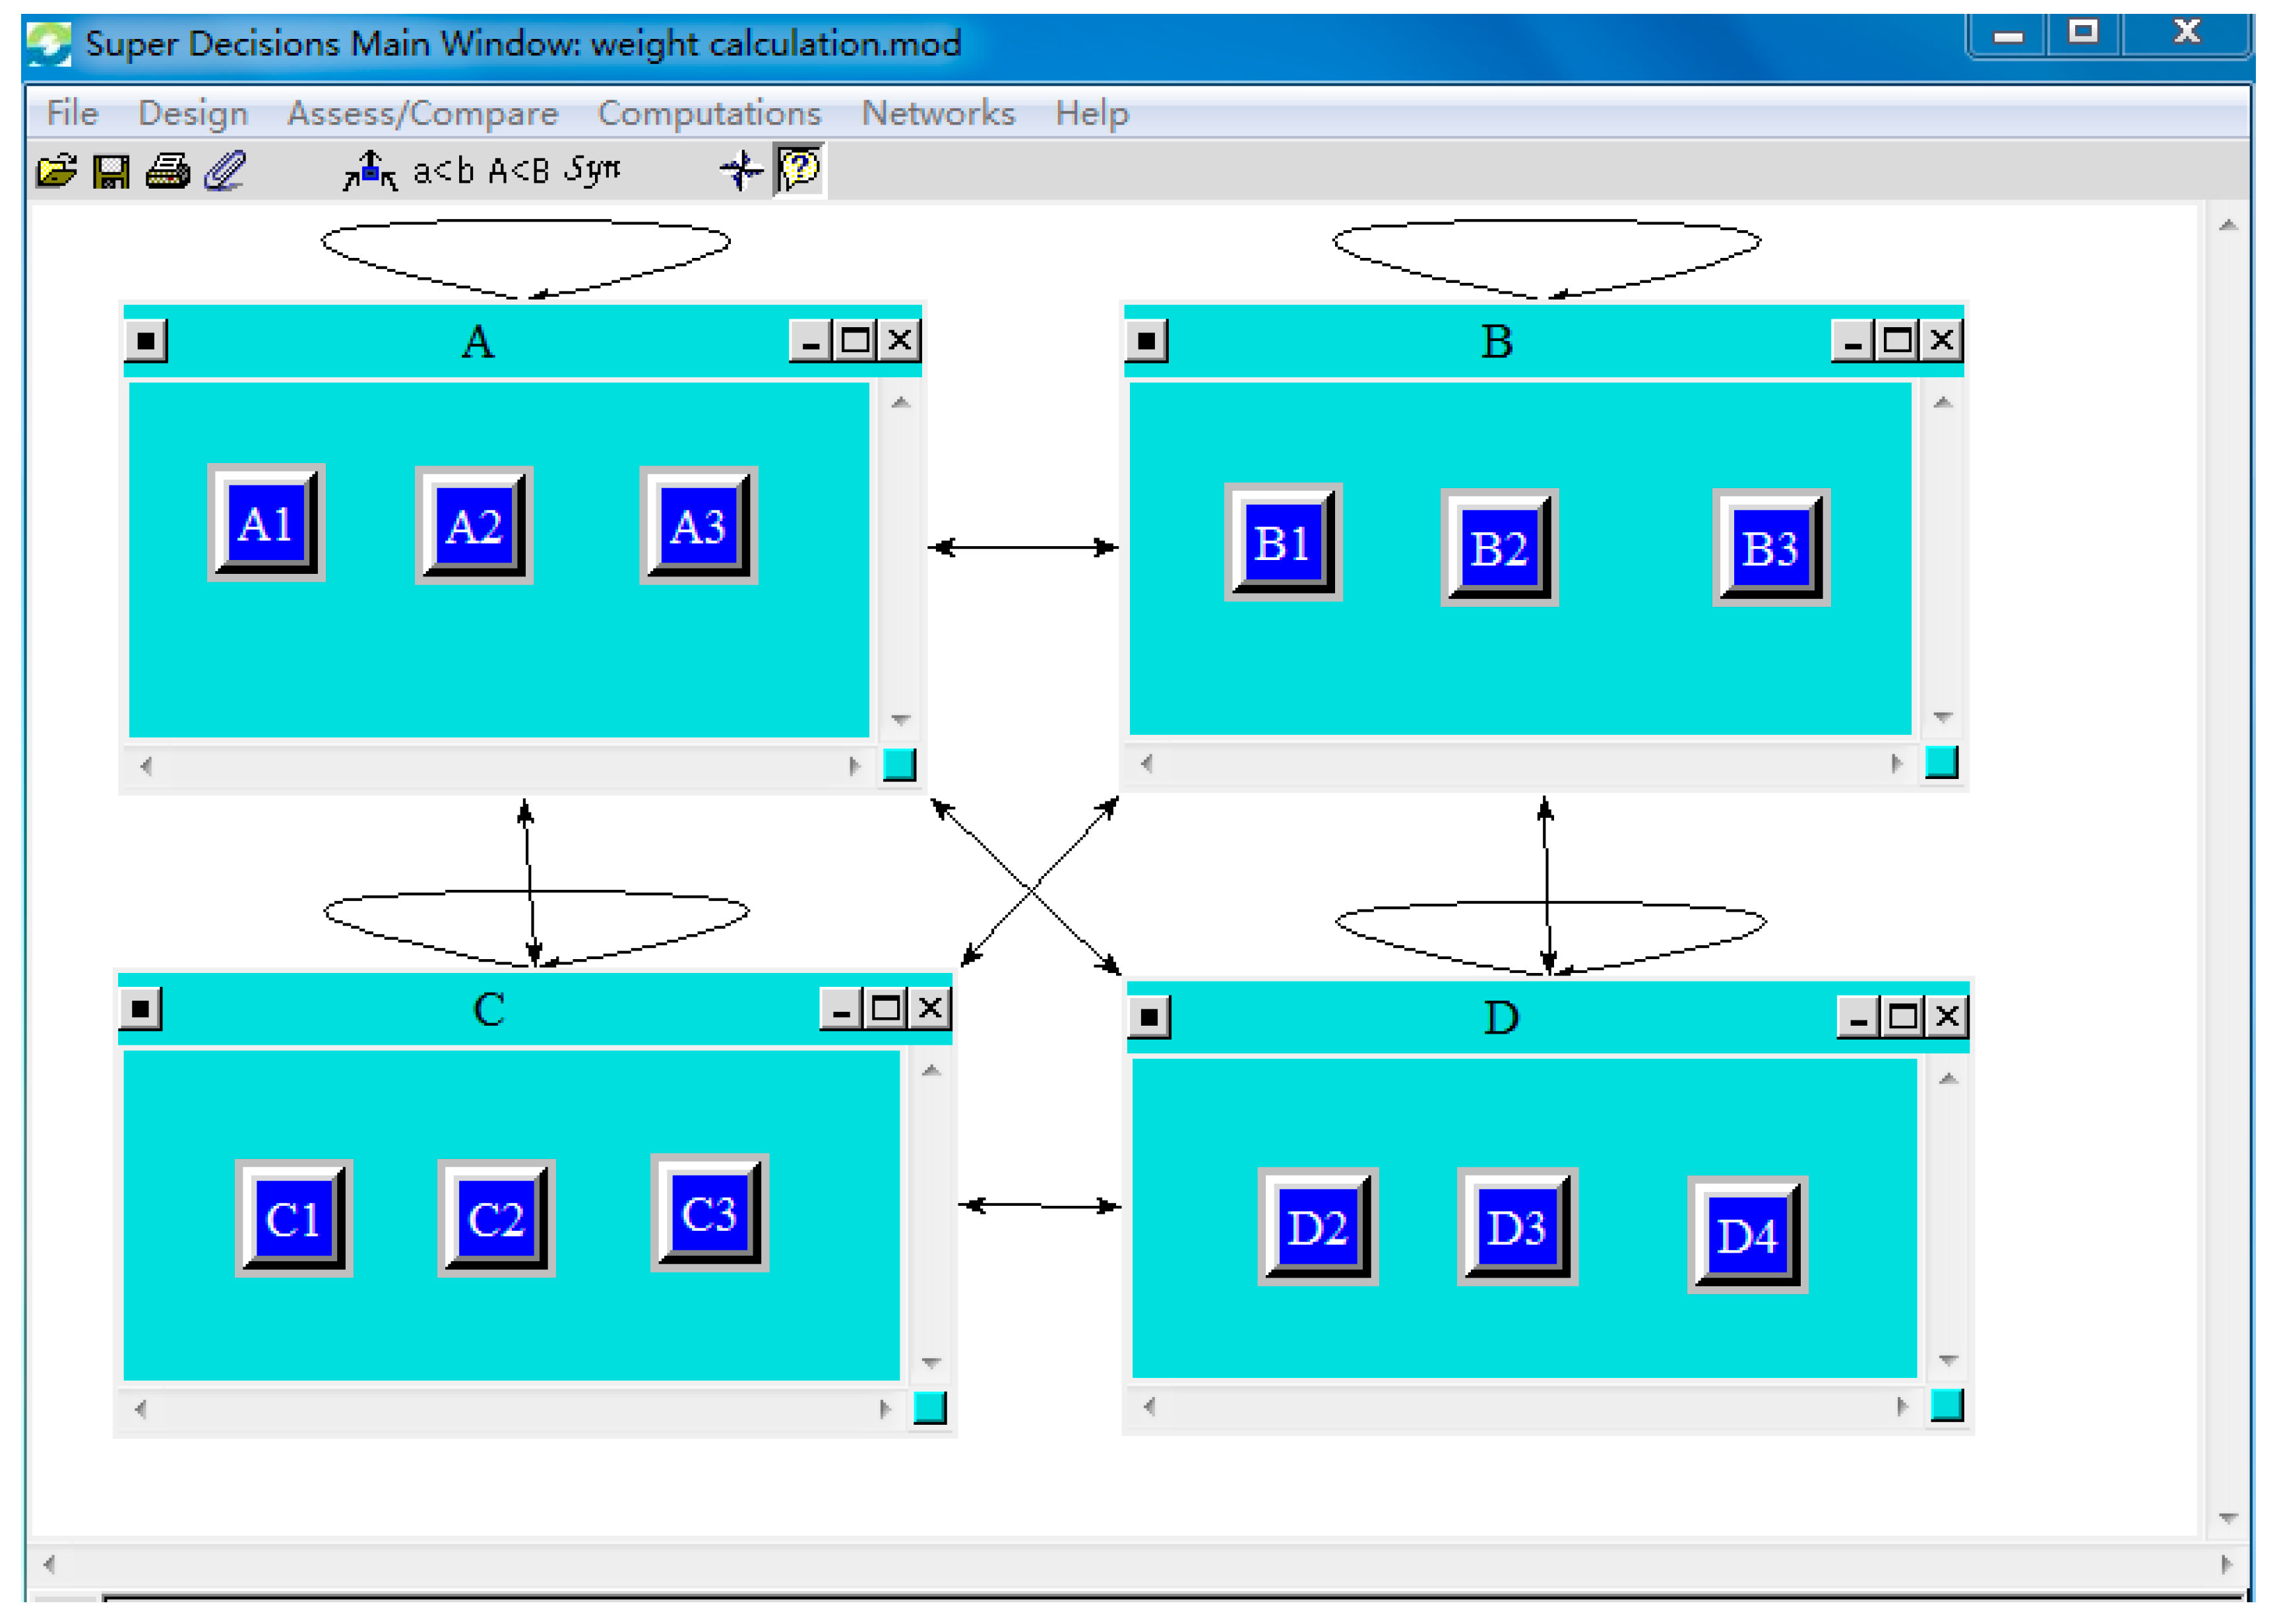
ANP was a useful tool for settling complex decision making problems, it could be used to obtain the weights of hazard factors with SD software. SD software was a typical ANP computing software, which could construct a decision model with dependency and feedback, and obtain the results by using the supermatrix calculation of network analysis. It was a simple and easy to use software package. This paper used this software to calculate the risk weights of shunting derailment hazard factors. The calculation process could be described in the following steps:
Step 1: Constructing ANP network structure. This paper only considered a single risk control criterion, named railway shunting derailment risk, which could also be called risk assessment objective. Therefore, the ANP hierarchy had only a network layer, which was composed of hazard factors governed by a single risk criterion and could be divided into multiple hazard subsets, where internal network structure was interactive.
Step 2: Calculating the unweighted supermatrix. Suppose the network had element sets C 1 , C 2 , …, C n , and e i 1 , e i 2 , …, e i n was the element of set C i . Under a single risk criterion, we could take e j l ( l = 1 , 2 , 3 , , n j ) as the secondary criterion, where e j l belonged to set C j , and compare the elements in set C i in terms of their effect on e j l , so we could get the matrix W i j , as represented by Equation (10).
W i j = [ w i 1 j 1 , w i 1 j 2 , , w i 1 j n j w i 2 j 1 , w i 2 j 2 , , w i 2 j n j w i n i j 1 , w i n i j 2 , , w i n i j n j ]
If factors in set C j were not influenced by factors in set C i , then W i j = 0 . For i = 1 , 2 , 3 , , N ; j = 1 , 2 , 3 , , N , repeating the above steps to obtain the supermatrix under a single criterion, as shown in Formula (11).
W = ( W i j ) , i = 1 , 2 , , N ; j = 1 , 2 , , N
Step 3: Establishing the weighted supermatrix. Each sub-block of the unweighted supermatrix only considered the ranking of the sub-criteria by the hazard factors in the hazard subsets, and did not take into account the influence of other hazard subsets on the criterion. Therefore, each column of the supermatrix was not normalized. In order to accurately reflect the sequence, we must consider the effect among hazard subsets. Taking the whole hazard subset as an element, pairwise comparison was made under a single risk criterion for the relative importance of a certain hazard subset, and this subset was obtained as normalized weight vector ( a 1 j , a 2 j , , a N j ) T of other hazard subsets under the sub-criterion. Where, a i j represented the influence weight of the i th subset on the j th subset, and “0” meant no effect, i = 1 N a i j = 1 , the weighted supermatrix was shown by Formula (12):
W ¯ = ( W i j ¯ ) = a i j W i j
Step 4: Computing the limiting supermatrix. The weighted supermatrix W ¯ was multiplied with itself multiple times to obtain the limiting supermatrix. If the limit was convergent and unique, the value of the corresponding row of the original matrix was the weight of each index, the limiting supermatrix W was shown in Formula (13):
W = lim k ( 1 / N ) k = 1 N W k ¯

2.2.3. Calculating the Shunting Derailment Risk

The risk of shunting derailment was obtained by combining the hazard factors’ risk with weights. Because risk magnitude was measured by discrete integers, we needed to convert the value to integer form by Formula (14).
R L d e s t i n a t i o n = i = 1 n R L h i w h i + 0.5 , i = 1 , 2 , , n
Where R L d e s t i n a t i o n was rounded as an integer, and the risk level was determined by Table 4.

2.3. Evaluation of Shunting Derailment Risk

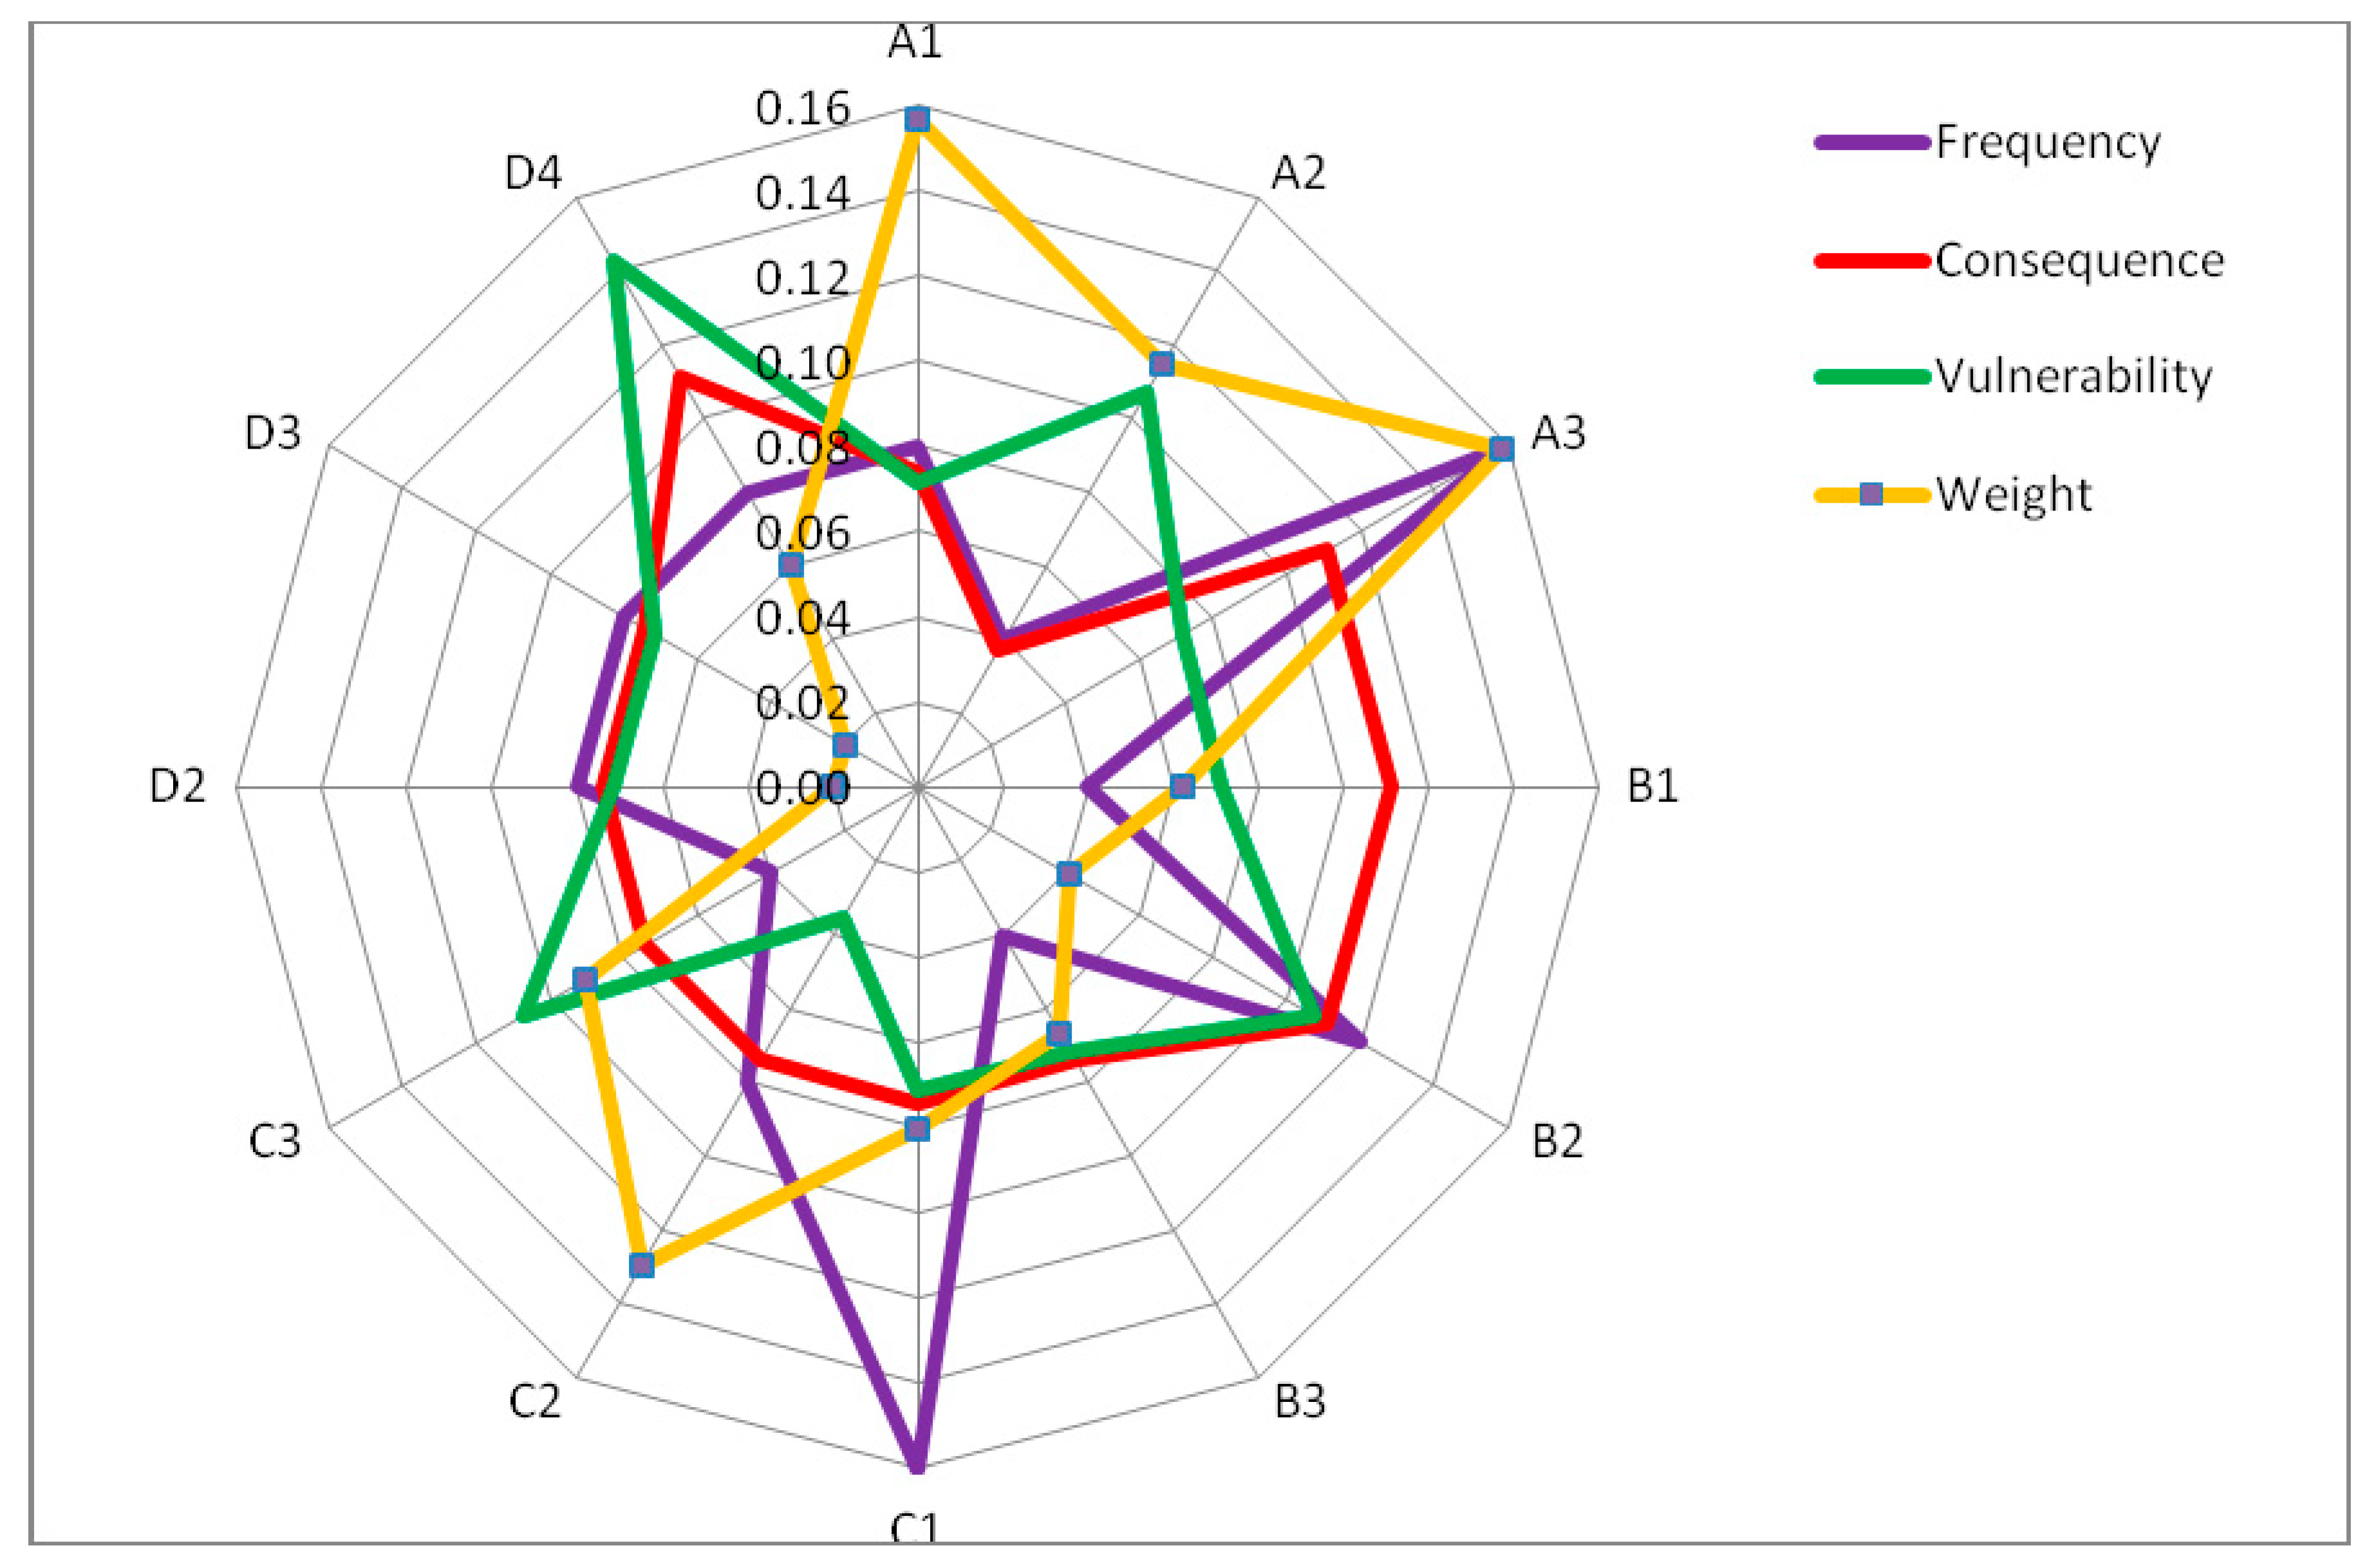
This section mainly included two aspects, one was the normalization of risk parameters, which was more convenient and fast to map the data to the range of (0,1) for processing; the other is the risk sequencing analysis. Radar map was adopted to comprehensively rank the probability, consequence, vulnerability and weights of the shunting derailment hazard factors, so as to determine the order of risk response.

3. Case Study

Huangyangcheng station is located in Shenmu city, Shaanxi province as shown in Figure 2. It is a second-class freight station of ShenShuo Railway. The station owns ten tracks, and the operation mainly includes dealing with the arrival, departure and passage of trains, decomposition of freight trains; as well as vehicle alignment, delivery and loading of Yujialiang coal mine special line. On account of the complex topography and harsh climate, and shunting derailment risk involves multiple jobs and operation links, such as vehicle, engine, electricity and signal, safety risk control is relatively difficult, which is easy to cause equipment damage, casualties. This paper took the risk assessment of shunting derailment in Huangyangcheng station as an example to verify the above model.

3.1. Risk Identification of Shunting Derailment in Huangyangcheng Station

Step1: Building a team of experts. Five experts, selected to form a group of experts, were invited to evaluate the influence relationship between hazard factors based on their work experience. Relevant background information was shown in Table 5.
Step2: Risk factors analysis of shunting derailment. On the basis of “Classification and code for the hazardous and harmful factors in process” (GB/T 13861-2009), hazard factors of shunting derailment in Huangyangcheng station were classified into four categories by experts. According to the last three years of safety inspection data related to shunting derailment in Huangyangcheng station, combined with experts’ advice, a list of hazard factors about the derailment risk was preliminary formed, as shown in Table 6.
Step3: Establishing direct influence matrix. The five experts discussed with each other and gained a consensus about the intensity of “influence on interaction” among the hazard factors, as shown in Table 7. The responses ranged from 0 to 4, namely, 0 (no influence), 1 (small influence), 2 (moderate influence), 3 (high influence), and 4 (great influence), and the higher the degree was, the more important of the hazard factor was in the system.
Step3: Normalizing the direct influence matrix. After the direct influence matrix expressed by the expected value was obtained, we could get k=14 by Equation (2), and the normalized direct impact matrix was obtained by Equation (3), as shown in Table 8.
Step4: Calculating the total-relation matrix. According to Equation (4), the total-relation matrix was obtained. Taking the threshold of the influence factor in the total-relation matrix as 0.10 (a value less than 0.10 was negligible), as shown in Table 9.
Step5: Calculating center degree and cause degree. The results were shown in Table 10:
Step6: Drawing cause and effect diagraph. The graph was constructed using ( r i + f j ) as the horizontal axis and ( r i f j ) as the vertical axis, and R10 and R11were eliminated for their low influence, as shown in Figure 3:

3.2. Risk Analysis of Shunting Derailment in Huangyangcheng Station

3.2.1. Calculating Vulnerability of Shunting Derailment in Huangyangcheng Station

According to Equation (7), the vulnerability of shunting derailment risk could be obtained, which was classified in Table 3 to facilitate semi-quantitative analysis with frequency and consequence, as shown in Table 11:

3.2.2. Calculating Hazard Factors Risk of Shunting Derailment in Huangyangcheng Station

According to the shunting safety statistics about Huangyangcheng station and experts’ opinions, the occurrence frequency, consequence and vulnerability of each hazard factor were comprehensively obtained, which were taken as the input value. The risk magnitude of each hazard factor event was obtained by Equation (9) and Table 4, as shown in Table 12:

3.2.3. Weights Calculation of Hazard Factors in Huangyangcheng Station

Step 1: Constructing ANP network structure with SD software, as shown in Figure 4:
Step 2: Establishing unweighted supermatrix. The unweighted supermatrix data could be exported by SD software, the results were shown in Table 13.
Step 3: Establishing the weighted matrix. The weighted supermatrix data could be exported by SD software, and the results were shown in Table 14.
Step 4: Establishing the limiting matrix with SD software, as shown in Table 15. The priorities of hazard factors could be exported by SD software, as shown in Table 16.

3.2.4. Calculating Shunting Derailment Risk in Huangyangcheng Station

According to Equation (9), the risk size of hazard factor was obtained, and then Equation (14) was used to calculate the shunting derailment risk, and the risk size was 7, belonging to a “Tolerable” risk.

3.3. Risk Evalutaion of Shunting Derailment in Huangyangcheng Station

The shunting derailment risk in Huangyangcheng station belonged to a “Tolerable” risk. Further analysis should be made, and control measures should be taken to ensure that the hazard factor events were controllable. In this stage, the frequency, consequence, vulnerability and weight data of the network hazard factors were normalized, and the radar diagram method was used for sequencing analysis, as shown in Figure 5.The following conclusions could be drawn:
(1) Hazard factors such as “Poor professional skill A3” had the characteristics of high occurrence frequency of risk events, serious risk consequence, large risk vulnerability and large weight value. The risk grade was undoubtedly in the high-risk area. Therefore, when dealing with such risks, control measures should be taken before, during and after the risk events to reduce the probability of occurrence and risk loss and ensure that the risk level was reduced to “ALARP” area.
(2) Hazard factors such as “Poor natural environment C1” occur frequently, and the loss was relatively large. In response to such risks, we should strengthen risk pre-control, strengthen equipment quality control and safety investment and minimize possible equipment failures and property losses, so as to achieve the purpose of risk control.
(3) Hazard factors such as “Physiological defect A2” should be well monitored to ensure that the risk was under control, although the risk level was relatively low.

4. Discussion

The case study applies an integrated DEMATEL-ANP model based on coupling to assess the shunting derailment risk in Huangyangcheng station. The objective of this study is to find out the key risk factors and propose a risk assessment process to assess the overall risk of shunting derailment. After selecting appropriate experts and roughly identifying the risk factors based on the available safety data, DEMATEL method is used to determine the interdependencies among hazard factors, and the results are depicted in Table 4. Based on these results, a causal diagram is constructed to find out the crucial hazard factors, which are presented in Figure 3. The diagram indicats that “Physiological defect”, “Shunting equipment malfunction” and “Insufficient safety investment” are the most important hazard factors because they have the highest rate of r i + f j . Therefore, safety managers should attach great importance to the interaction among these factors. According to the ANP result, which is presented in Table 5, we can see the weights of the twelve important hazard factors (A1, A2, A3, B1,B2,B3,C1,C2,C3,D2,D3 and D4) are 0.16, 0.11, 0.16, 0.06, 0.04,0.07,0.02, 0.02, 0.06, 0.08, 0.13, 0.09 respectively. These results imply that “Poor ideology” and “Poor professional skill” are the most important hazard factors and “Poor public security environment” and ” Poor operating environment” are the least important. After getting the weights of hazard factors, three-dimensional risk parameter model is used to obtain the risk level, as shown in Table 5. Based on the viewpoints of experts, the system risk belongs to a “Tolerable” risk, and policymakers need to take appropriate risk measures, such as strengthening risk monitor, increasing education and training for employees, and intensifing emergency rescue.

5. Conclusions

Based on the complexity, systematization and dynamics of shunting operation, it is necessary to evaluate the risk of shunting derailment. This paper proposes a railway shunting derailment risk assessment model for coupling analysis based on DEMATEL and ANP methods, and “frequency-consequence-vulnerability” three-dimensional parameter model is used to optimize shunting derailment risk assessment in the model. In order to overcome the deficiencies of existing studies, this paper defines the connotation of “influence” between DEMATEL and ANP methods, where the influence degree in DEMATEL method represents “influence on interaction”, while in ANP approach it represents “influence on importance”. DEMATEL method is used to screen hazard factors, and quantified the degree of interaction between hazard factors. Based on the cause-effect relationship among the risk elements, and according to the experts’ judgment, we could conclude that shunting equipments and safety investment are critical for a successful implementation of risk management in shunting operation due to their effect on other factors. ANP methodology is used to quantitatively express the influence of relative importance among hazard factors, so as to obtain the weights. The results show that experts are more concerned about safe awareness and professional skill, as the weights of these hazard factors are significantly higher than other risk factors. By defining the concept of vulnerability and taking it as the third evaluation parameter, a three-dimensional risk evaluation parameter model is constructed to further optimize the calculation algorithm of shunting derailment risk magnitude, which better reflects the complexity, dynamics and uncertainty characteristics of shunting operation risk. In the risk evaluation stage, radar map is used to sort and analyze the occurrence frequency, consequence, vulnerability and weight after normalization processing, so as to establish the order of risk response. Finally, the method is applied to the risk assessment of shunting derailment in Huangyangcheng station, and the results reveal that it provides a better risk assessment tool for railway safety managers, engineers, and decision-makers.
Although DEMATEL-ANP has been used popularized and applied in many industries as a technology to deliver a new and proper model to facilitate the risk assessment process, it also has some disadvantages, especially in terms of how to make sure the accuracy of the coupling relationships among dimensions under uncertainty conditions. Furthermore, the interaction between internal factors and external environment of the system is dynamic. How to consider the interaction among system factors under dynamic conditions can also be a research direction on DEMATEL-ANP model in the future.

Author Contributions

Methodology, H.Z.; software, H.Z.; writing—original draft preparation, H.Z.; writing—review and editing, Q.S.

Funding

This research received no external funding.

Acknowledgments

The authors are greatly thankful to the reviewers and editor for their precious advice to improve the quality of the thesis.

Conflicts of Interest

The authors declare no conflict of interest.

References

  1. Sultana, S.; Andersen, B.S.; Haugen, S. Identifying safety indicators for safety performance measurement using a system engineering approach. Process. Saf. Environ. Prot. 2019, 128, 107–120. [Google Scholar] [CrossRef]
  2. Marshall, P.; Hirmas, A.; Singer, M. Heinrich’s pyramid and occupational safety: A statistical validation methodology. Saf. Sci. 2018, 101, 180–189. [Google Scholar] [CrossRef]
  3. Haddon, W.; Suchman, E.A.; Klein, D. Accident research: methods and approaches. Occup. Environ. Med. 1964, 249, 490. [Google Scholar] [CrossRef]
  4. Haddon, W. A note concerning accident theory and research with special reference to motor vehicle accidents. Ann. N. Y. Acad. Sci. 1963, 107, 635–646. [Google Scholar] [CrossRef] [PubMed]
  5. Yantao, W.; Jianxun, T.; Yifei, Z. Coupling analysis of risk factors in flight operation. China. Saf. Sci. J. 2017, 27, 77–81. [Google Scholar]
  6. Li, G. A study on the engineering geological coupling theory. J. Eng. Geol. 2001, 435–442. [Google Scholar]
  7. Xue, Y.; Liu, Y.; Zhang, T. Research on formation mechanism of coupled disaster risk. J. Nat. Dis. 2013, 22, 44–50. [Google Scholar]
  8. Sabarethinam, K.; Padgett, J.E. Multi-hazard risk assessment of highway bridges subjected to earthquake and hurricane hazards. Eng. Struct. 2014, 78, 154–166. [Google Scholar]
  9. Jiang, S.; Fan, H. Credit risk contagion coupling with sentiment contagion. Phys. A 2018, 512, 186–202. [Google Scholar] [CrossRef]
  10. He, H.; Dou, L.; Gong, S. Microseismic and electromagnetic coupling method for coal bump risk assessment based on dynamic static energy principles. Saf. Sci. 2019, 114, 30–39. [Google Scholar] [CrossRef]
  11. Saaty, T.L.; Vargas, L.G. Decision making with the analytic network process. In Economic, political, social and technological applications with benefits, opportunities, costs and risks; Springer: New York, NY, USA, 2006; Volume 282, pp. 40–196. [Google Scholar]
  12. Buyukozkan, G.; Çifçi, G. A novel hybrid MCDM approach based on fuzzy DEMATEL, fuzzy ANP and fuzzy TOPSIS to evaluate green suppliers. Expert. Syst. Appl. 2012, 39, 3000–3011. [Google Scholar] [CrossRef]
  13. Yang, Y.P.O.; Shieh, H.M.; Tzeng, G.H. A VIKOR technique based on DEMATEL and ANP for information security risk control assessment. Inf. Sci. 2013, 232, 482–500. [Google Scholar] [CrossRef]
  14. Chang, K.L.; Liao, S.K.; Tseng, T.W.; Liao, C.Y. An ANP based TOPSIS approach for Taiwanese service apartment location selection. Asia. Paci. Manage. Rev. 2015, 20, 49–55. [Google Scholar] [CrossRef]
  15. Farias, L.M.S.; Santos, L.C.; Gohr, C.F. An ANP-based approach for lean and green performance assessment. Resour. Conserv. Recycl. 2019, 143, 77–89. [Google Scholar] [CrossRef]
  16. Yeh, T.M.; Huang, Y.L. Factors in determining wind farm location: Integrating GQM, fuzzy DEMATEL, and ANP. Renewable. Energy 2014, 66, 159–169. [Google Scholar] [CrossRef]
  17. Hwang, W.; Hsiao, B.; Chen, H.G.; Chern, C.C. Multiphase assessment of project risk interdependencies: evidence from a University ISD project in Taiwan. Pro. Manage. J. 2016, 47, 59–75. [Google Scholar] [CrossRef]
  18. Vinodh, S.; Swarnakar, V. Lean Six Sigma project selection using hybrid approach based on fuzzy DEMATEL–ANP–TOPSIS. Int. J. LSS. 2015, 6, 313–338. [Google Scholar] [CrossRef]
  19. Buyukozkan, G.; Guleryuz, S. An integrated DEMATEL-ANP approach for renewable energy resources selection in Turkey. Int. J. Prod. Econ. 2016, 182, 435–448. [Google Scholar] [CrossRef]
  20. Hu, Y.C.; Lee, P.C. Improving the sustainable competitiveness of service quality within air cargo terminals. Sustainability 2018, 10, 2319. [Google Scholar] [CrossRef]
  21. Shao, Q.G.; Liou, J. Improving the green building evaluation system in China based on the DANP method. Sustainability 2018, 10, 1173. [Google Scholar] [CrossRef]
  22. Dehdasht, G.; Mohamad, Z.R. DEMATEL-ANP risk assessment in oil and gas construction projects. Sustainability 2017, 9, 1420. [Google Scholar] [CrossRef]
  23. ISO. Risk Management Vocabulary: ISO Guide 73-2009; ISO: Geneva, Switzerland, 2009. [Google Scholar]
  24. Li, S. ISO Risk Management Standard Explanation; Posts & Telecom Press: Beijing, China, 2012; pp. 44–352. [Google Scholar]
  25. Hsu, W.K.; Huang, S.S.; Tseng, W.J. Evaluating the risk of operational safety for dangerous goods in airfreights–A revised risk matrix based on fuzzy AHP. Trans. Res. Par. Trans. Envir. 2016, 48, 235–247. [Google Scholar] [CrossRef]
  26. Skorupski, J. The simulation-fuzzy method of assessing the risk of air traffic accidents using the fuzzy risk matrix. Saf. Sci. 2016, 88, 76–87. [Google Scholar] [CrossRef]
  27. Zhang, H.; Sun, Q. An Integrated Approach to Risk Assessment for Special Line Shunting Via Fuzzy Theory. Symmetry 2018, 10, 599. [Google Scholar] [CrossRef]
  28. Ward, S.C. Assessing and managing important risks. Int. J. Pro. Manage. 1999, 17, 331–336. [Google Scholar] [CrossRef]
  29. Williams, T. The two-dimensionality of project risk. Int. J. Pro. Manage. 1996, 14, 185–186. [Google Scholar] [CrossRef]
  30. Aven, T.; Vinnem, J.E.; Wiencke, H.S. A decision framework for risk management, with application to the offshore oil and gas industry. Reliab. Eng. Syst. Saf. 2007, 92, 433–448. [Google Scholar] [CrossRef]
  31. Cagno, E.; Caron, F.; Mancini, M. A Multi-Dimensional Analysis of Major Risks in Complex Projects. Ris. Manage. 2007, 9, 1–18. [Google Scholar] [CrossRef]
  32. Zhang, H. A redefinition of the project risk process: Using vulnerability to open up the event-consequence link. Int. J. Pro. Manage. 2007, 25, 694–701. [Google Scholar] [CrossRef]
  33. Han, S.H.; Kim, D.; Kim, H.; Jang, W.; Han, S. A web-based integrated system for international project risk management. Automat. Constr. 2008, 17, 342–356. [Google Scholar] [CrossRef]
  34. ISO. Risk Management–Risk Assessment Techniques: IEC 31010-2009; ISO: Geneva, Switzerland, 2009. [Google Scholar]
  35. BSI. Railway Applications-The Specification and Demonstration of Reliability, Availability, Maintainability and Safety (RAMS)-Part 2: Guide to the Application of EN 50126-1 for Safety: BS EN 50126-2: 2007; BSI: London, UK, 2007. [Google Scholar]
  36. Dong, X.M. Safety Risk Management of Rail Transit; China Railway Publishing House: Beijing, China, 2014; pp. 231–277. [Google Scholar]
  37. BSI. Railway Applications-The Specification and Demonstration Reliability, Availability, Maintainability and Safety (RAMS)–Part 1: Basic Requirements and Generic Process: BS EN 50126-1:1999; BSI: London, UK, 1999. [Google Scholar]
Figure 1. Shunting derailment risk assessment model.
Symmetry 11 01359 g001
Figure 2. The location of Huangyangcheng station.
Symmetry 11 01359 g002
Figure 3. Sequence diagram of shunting derailment hazard factors.
Symmetry 11 01359 g003
Figure 4. Hazard groups of shunting derailment risk in Huangyangcheng station.
Symmetry 11 01359 g004
Figure 5. Radar map comparison of shunting derailment hazard factors.
Symmetry 11 01359 g005
Table 1. Frequency ranking scheme.
Linguistic TermFrequency RangeApproximate Numerical Value (Events/year) Scale Value
Improbable1 in 35 years to 1 in 175 years0.011
Remote1 in 7 years to 1 in 35 years0.052
Occasional1 in 1.25 years to 1 in 7 years0.253
Probable1 in 3 months to 1 in 1.25 years1.254
Frequent1 in 20 days to 1 in 3 months6.255
Table 2. Consequence ranking scheme.
Linguistic TermDescriptionApproximate Numerical Value (Events/year) Scale Value
MinorMinor injury0.0051
MarginalMultiple minor injuries0.0252
ModerateSingle serious injury0.1253
SevereMultiple serious injuries or single fatal injury0.6254
Catastrophic2-5 fatal injuries3.1255
Table 3. Vulnerability ranking scheme.
Linguistic TermDescriptionValue of NumberScale Value
TeenyWeakly feedback to the coupling effect[1.00, 1.10) 1
SmallSlight feedback to the coupling effect[1.11, 1.20) 2
Medium A little reaction to the coupling effect[1.21, 1.30) 3
BigObvious response to the coupling effect[1.31, 1.50) 4
LargeStrong reaction to the coupling effect[1.51, 2.00) 5
Table 4. Risk level ranking scheme.
Qualitative DescriptionResponse StrategyScale Value
NegligibleRisk is acceptable with/without the agreement of the railway authority[3, 6]
TolerableAcceptable with adequate control and with the agreement of the railway authority[7, 9]
UndesirableOnly be accepted when risk reduction is impracticable and with the agreement of the railway authority[10, 12]
IntolerableRisk must be reduced in exceptional circumstances[13, 16]
Table 5. Basic information of selected experts.
ExpertsAgeEducation BackgroundProfessional TitleYears of Working
Expert 145Bachelor degreeEngineer title22 years
Expert 250Bachelor degreeSenior engineer28 years
Expert 330Graduate degreeEngineer title5 years
Expert 442Trade school diplomaEngineer title21years
Expert 535Trade school diplomaAssistant Engineer title14 years
Table 6. A list of shunting derailment hazard factors in Huangyangcheng station.
Hazard GroupsHazardDescription
Unsafe behavior of personnel (A) Poor ideology (A1) The psychological state could not adapt to the requirements of on-site work, will quality, cognitive ability, personality and other aspects of personal psychological quality characteristics and the post was not coordinated. For example, lack of safety awareness, improper operation, etc.
Physiological defect ( A2) Physical health, perceptual skills and motor skills could not meet the requirements of the corresponding position. For example, heavy workload, age, physical strength, gender and health conditions were all the cause of occupational diseases.
Poor professional skill (A3) Workers could not master the skills of production safety, production safety laws and regulations and other knowledge. For example, low level of education and skills didn’t meet the job requirements.
Unsafe condition of equipments (B) Defective protective equipment (B1) The product quality index and technical condition of labor protection article could not meet the national or industrial requirements. For example, the shunting belts were not strong enough.
Shunting equipment malfunction ( B2) The shunting equipment broke down in the process of use and maintenance, including vehicle equipment failure, link closing equipment failure, line equipment and shunting spare parts failure, etc.
Unreliable safety facilities (B3) Protective facilities could not play the role of protection.
Environmental insecurity (C) Poor natural environment (C1) Including bird damage, freezing damage, abnormal atmospheric temperature, strong wind, rainstorm, lightning, geology and other adverse factors.
Poor public security environment ( C2) External adverse factors affecting shunting operation safety, including coal stealing, rail damage and track breakage
Poor operating environment (C3) The working environment of employees, including large slopes, many crossings, poor lookout conditions.
Negative influence of public opinion (C4) Extreme, wrong public opinion guidance, easy to disturb the thinking of employees, digestion of work enthusiasm.
Defects in management (D) Imperfect rules and regulations ( D1) The rules and regulations were unscientific and unreasonable, and there are loopholes in safety management.
More joint safety hazards (D2) In shunting operation, two or more majors, units or departments were involved, such as operations, complex organization, personnel.
Lack of workplace supervision (D3) Lack of daily management responsibility, remote workplace, less inspection, etc.
Insufficient safety investment (D4) Investment in personnel, technology and facilities, safety education and training, labor protection and health care costs, accident rescue and prevention, and treatment costs of accident casualties were all regarded as safety input.
Table 7. Direct influence matrix.
IndexA1A2A3B1B2B3C1C2C3C4D1D2D3D4
A101111000101020
A200000000002000
A321021100103110
B101000000000002
B202000000100002
B302010000100001
C102002200110102
C201001100110101
C313011100000012
C410000001000001
D110100000000100
D201001111100010
D311211100010100
D401024211110100
Table 8. Normalized direct influence matrix.
IndexA1A2A3B1B2B3C1C2C3C4D1D2D3D4
A10.00 0.07 0.07 0.07 0.07 0.00 0.00 0.00 0.07 0.00 0.07 0.00 0.14 0.00
A20.00 0.00 0.00 0.00 0.00 0.00 0.00 0.00 0.00 0.00 0.14 0.07 0.00 0.00
A30.14 0.07 0.00 0.07 0.14 0.07 0.00 0.00 0.07 0.00 0.21 0.07 0.07 0.00
B10.00 0.07 0.00 0.00 0.00 0.00 0.00 0.00 0.00 0.00 0.00 0.00 0.00 0.14
B20.00 0.14 0.00 0.00 0.00 0.00 0.00 0.00 0.07 0.00 0.00 0.00 0.00 0.14
B30.00 0.14 0.00 0.07 0.00 0.00 0.00 0.00 0.07 0.00 0.00 0.00 0.00 0.07
C10.00 0.14 0.00 0.00 0.14 0.14 0.00 0.00 0.07 0.07 0.00 0.07 0.00 0.14
C20.00 0.07 0.00 0.00 0.07 0.07 0.00 0.00 0.07 0.07 0.00 0.07 0.00 0.07
C30.07 0.21 0.00 0.07 0.07 0.07 0.00 0.00 0.00 0.00 0.00 0.00 0.07 0.14
C40.07 0.00 0.00 0.00 0.00 0.00 0.00 0.07 0.00 0.00 0.00 0.00 0.00 0.07
D10.07 0.00 0.07 0.00 0.00 0.00 0.00 0.00 0.00 0.00 0.00 0.07 0.00 0.00
D20.00 0.07 0.00 0.00 0.07 0.07 0.07 0.07 0.07 0.00 0.00 0.00 0.07 0.00
D30.07 0.07 0.21 0.07 0.07 0.07 0.00 0.00 0.00 0.07 0.00 0.07 0.00 0.00
D40.00 0.07 0.00 0.14 0.29 0.14 0.07 0.07 0.07 0.07 0.00 0.07 0.00 0.00
Table 9. Simplified composite impact matrix.
IndexA1A2A3B1B2B3C1C2C3C4D1D2D3D4
A10.00 0.16 0.12 0.11 0.13 0.00 0.00 0.00 0.10 0.00 0.12 0.00 0.17 0.00
A20.00 0.00 0.00 0.00 0.00 0.00 0.00 0.00 0.00 0.00 0.15 0.00 0.00 0.00
A30.19 0.20 0.13 0.22 0.12 0.00 0.00 0.13 0.00 0.27 0.13 0.12 0.19
B10.00 0.11 0.00 0.00 0.00 0.00 0.00 0.00 0.00 0.00 0.00 0.00 0.00 0.00
B20.00 0.20 0.00 0.00 0.00 0.00 0.00 0.00 0.10 0.00 0.00 0.00 0.00 0.00
B30.00 0.19 0.00 0.10 0.00 0.00 0.00 0.00 0.00 0.00 0.00 0.00 0.00 0.00
C10.00 0.27 0.00 0.00 0.24 0.20 0.00 0.00 0.13 0.00 0.00 0.12 0.00 0.00
C20.00 0.16 0.00 0.00 0.13 0.11 0.00 0.00 0.11 0.00 0.00 0.10 0.00 0.00
C30.00 0.31 0.00 0.13 0.16 0.12 0.00 0.00 0.00 0.00 0.00 0.00 0.00 0.00
C40.00 0.00 0.00 0.00 0.00 0.00 0.00 0.00 0.00 0.00 0.00 0.00 0.00 0.00
D10.00 0.00 0.00 0.00 0.00 0.00 0.00 0.00 0.00 0.00 0.00 0.00 0.00 0.00
D20.00 0.17 0.00 0.00 0.13 0.12 0.00 0.00 0.11 0.00 0.00 0.00 0.00 0.00
D30.13 0.18 0.24 0.12 0.15 0.12 0.00 0.00 0.00 0.00 0.00 0.12 0.00 0.13
D40.00 0.24 0.00 0.19 0.37 0.20 0.00 0.10 0.15 0.10 0.00 0.12 0.00 0.00
Table 10. Center degree and cause degree of hazard factors.
IndexA1A2A3B1B2B3C1C2C3C4D1D2D3D4
( r i + f j ) 1.24 2.34 1.94 1.05 2.01 1.39 1.19 0.83 1.76 0.10 0.54 1.10 1.34 2.85
( r i f j ) 0.61 -2.04 1.22 -0.51 -1.05 -0.59 1.19 0.64 0.09 -0.10 -0.54 -0.05 0.76 0.37
Table 11. Vulnerability of shunting derailment risk.
Hazard FactorsA1A2A3B1B2B3C1C2C3D2D3D4
Value Number1.131.271.261.131.281.181.121.081.211.141.171.49
Scale Value232232213224
Table 12. Risk parameters of hazard factors in Huangyangcheng station.
Target LayerHazard FactorsProbabilityConsequenceVulnerabilityRiskClassify
Shunting derailment risk in Huangyangcheng station A12226Negligible
A21135Negligible
A34329Tolerable
B11326Negligible
B23339Tolerable
B31225Negligible
C14228Tolerable
C22215Negligible
C31236Negligible
D22226Negligible
D32226Negligible
D42349Tolerable
Table 13. Unweighted supermatrix.
A1A2A3B1B2B3C1C2C3D2D3D4
A10.000.330.750.000.500.750.290.300.300.500.500.55
A20.250.000.251.000.500.250.140.160.160.250.250.21
A30.750.670.000.000.000.000.570.540.540.250.250.24
B10.550.540.400.000.000.000.200.30.330.160.160.17
B20.260.160.200.000.000.000.400.160.330.300.300.39
B30.190.300.400.001.000.000.400.540.330.540.540.44
C10.120.160.120.250.670.670.000.330.670.300.200.16
C20.560.300.560.750.330.330.670.000.330.160.400.30
C30.320.540.320.000.000.000.330.670.000.540.400.54
D20.000.000.000.000.000.000.330.300.300.000.500.67
D30.330.250.330.000.000.000.260.160.160.670.000.33
D40.670.750.670.001.001.000.410.540.540.330.500.00
Table 14. Weighted supermatrix.
A1A2A3B1B2B3C1C2C3D2D3D4
A10.000.140.310.000.210.380.120.120.120.210.210.23
A20.100.000.100.590.210.130.060.070.070.110.110.09
A30.310.270.000.000.000.000.240.220.220.100.100.10
B10.110.110.080.000.000.000.040.050.060.030.030.03
B20.050.030.040.000.000.000.070.030.060.050.050.07
B30.040.060.080.000.180.000.070.100.060.100.100.08
C10.040.050.040.100.200.240.000.100.200.090.060.05
C20.160.090.160.310.100.120.200.000.100.050.120.09
C30.090.160.090.000.000.000.100.200.000.160.120.16
D20.000.000.000.000.000.000.040.030.030.000.050.07
D30.030.020.030.000.000.000.030.020.020.070.000.04
D40.060.070.060.000.110.130.040.060.060.040.050.00
Table 15. Limiting matrix.
A1A2A3B1B2B3C1C2C3D2D3D4
A10.160.160.160.160.160.160.160.160.160.160.160.16
A20.110.110.110.110.110.110.110.110.110.110.110.11
A30.160.160.160.160.160.160.160.160.160.160.160.16
B10.060.060.060.060.060.060.060.060.060.060.060.06
B20.040.040.040.040.040.040.040.040.040.040.040.04
B30.070.070.070.070.070.070.070.070.070.070.070.07
C10.080.080.080.080.080.080.080.080.080.080.080.08
C20.130.130.130.130.130.130.130.130.130.130.130.13
C30.090.090.090.090.090.090.090.090.090.090.090.09
D20.020.020.020.020.020.020.020.020.020.020.020.02
D30.020.020.020.020.020.020.020.020.020.020.020.02
D40.060.060.060.060.060.060.060.060.060.060.060.06
Table 16. Weights of shunting derailment hazard factors.
Hazard FactorsNormalized By ClusterLimiting
A10.360.16
A20.270.11
A30.370.16
B10.370.06
B20.240.04
B30.390.07
C10.27 0.08
C20.42 0.13
C30.31 0.09
D20.16 0.02
D30.23 0.02
D40.61 0.06

