Article

Scaling Relationships between Leaf Shape and Area of 12 Rosaceae Species

1
Bamboo Research Institute, College of Biology and the Environment, Nanjing Forestry University, Nanjing 210037, China
2
Centre for Invasion Biology, Department of Mathematical Sciences, Stellenbosch University, Matieland 7602, South Africa
3
Everglades Research and Education Center, University of Florida, 3200 E. Palm Beach Road, Belle Glade, FL 33430, USA
4
Tropical Silviculture and Forest Ecology, University of Göttingen, Büsgenweg 1, 37077 Göttingen, Germany
*
Author to whom correspondence should be addressed.
Symmetry 2019, 11(10), 1255; https://doi.org/10.3390/sym11101255
Submission received: 1 August 2019 / Revised: 5 October 2019 / Accepted: 8 October 2019 / Published: 9 October 2019

Abstract

:
Leaf surface area (A) and leaf shape have been demonstrated to be closely correlated with photosynthetic rates. The scaling relationship between leaf biomass (both dry weight and fresh weight) and A has been widely studied. However, few studies have focused on the scaling relationship between leaf shape and A. Here, using more than 3600 leaves from 12 Rosaceae species, we examined the relationships of the leaf-shape indices including the left to right side leaf surface area ratio (AR), the ratio of leaf perimeter to leaf surface area (RPA), and the ratio of leaf width to length (RWL) versus A. We also tested whether there is a scaling relationship between leaf dry weight and A, and between PRA and A. There was no significant correlation between AR and A for each of the 12 species. Leaf area was also found to be independent of RWL because leaf width remained proportional to leaf length across the 12 species. However, there was a negative correlation between RPA and A. The scaling relationship between RPA and A held for each species, and the estimated scaling exponent of RPA versus A approached −1/2; the scaling relationship between leaf dry weight and A also held for each species, and 11 out of the 12 estimated scaling exponents of leaf dry weight versus A were greater than unity. Our results indicated that leaf surface area has a strong scaling relationship with leaf perimeter and also with leaf dry weight but has no relationship with leaf symmetry or RWL. Additionally, our results showed that leaf dry weight per unit area, which is usually associated with the photosynthetic capacity of plants, increases with an increasing A because the scaling exponent of leaf dry weight versus A is greater than unity. This suggests that a large leaf surface area requires more dry mass input to support the physical structure of the leaf.

1. Introduction

The goal of this paper is to examine the relationship between leaf area and leaf shape, particularly the extent to which leaf laminae manifest bilateral asymmetry. The rationale for this study rests on the fact that leaf shape is closely associated with the expansion of the leaf lamina [1], the development of leaf venation patterns [2,3,4], and, to a limited extent, maximum photosynthetic rates [5,6,7], which are hard to measure on a large scale by direct physiological methods in the field. Therefore, indirect indices are needed to represent the growth and development features of leaves. Total leaf photosynthesis can vary with the change of leaf structural parameters such as leaf size and leaf dry mass per unit area (LMA) [8,9]. LMA, associated with leaf thickness, shape, and area, reflects the capacity to intercept light and, to a limited degree, to cope with strong light [8,10,11]. Not only is LMA an important indicator of photosynthetic capacity, it also correlates with survival and competitive strategies in communities and the ability of plants to acquire resources and adapt to different habitats [12,13,14,15]. Mean LMA can be used to correct the deviation of leaf functional characteristics and the conversion of leaf biomass to leaf area in forest models [16]. Therefore, it is useful to explore the scaling relationship of leaf weight versus area and the relationship between leaf area and leaf-shape indices, such as the ratio of leaf width to length, the ratio of lamina perimeter to area, and the extent of leaf bilateral symmetry.
Leaf dry weight (W) and leaf surface area (A) are two important functional traits [5], and the relationship between these two variables can be expressed mathematically as W = aAb, where a is the normalization constant and b is the scaling exponent [17]. When b > 1, larger leaves have higher LMAs, whereas b < 1 indicates the opposite. If b = 1, changes in leaf size have no effect on LMA. A higher LMA indicates a higher energy investment in supporting leaf structure and function, and it also reflects leaf longevity [18,19,20]. Pan et al. [21] analyzed the scaling relationship between leaf dry weight and area of 121 species along an altitudinal gradient in a subtropical forest. They found that there was a significant power-law relationship between leaf weight and area, and reported that the scaling exponent b increased from 0.859 to 1.299 with an increase in altitude. Thus, leaves manifest different scaling relationships across environmental gradients. Huang et al. [22] tested whether there were scaling relationships between leaf fresh weight and leaf surface area using 12 species within two genera in Bambusoideae, and they found that the scaling relationships of leaf fresh weight versus area also held and the scaling relationship of leaf fresh weight versus area was stronger than that of leaf dry weight versus area for each species investigated.
As noted, leaf shape is also an important parameter. Although many different indices exist to evaluate leaf shape, the bilateral symmetry of leaves is an important index of shape. Bilateral symmetry can be divided into two types: object symmetry and matching symmetry [23]. Matching symmetry is generally referred to as two independent structures that can mirror each other, such as the left and right arms of the human body, while object symmetry is referred to as the left and right parts of the same body that are not separated, such as the left and right sides of the human body or the leaf lamina along the main vein [23,24]. In addition, the ratio of leaf perimeter to area provides useful information of leaf shape, although previous studies rarely provide this parameter [25].

2. Materials and Methods

2.1. Plants, Sampling, and Image Processing

For the purpose of this study, we selected 12 Rosaceae species (Table 1) because of the range of leaf size and morphology exhibited within this large family (Figure 1), which has more than 3300 species in 124 genera, mainly distributed in the northern temperate zones. In China, there are 51 genera (>1000 species). Rosaceae species include trees, herbs, and shrubs. Most herbs in Rosaceae are perennial plants, and only a small proportion of Rosaceae species are annuals [26]. In addition, we need to emphasize that a simple leaf or a leaflet of a compound leaf usually includes a petiole and blade. In this study, we did not distinguish a leaflet of a compound leaf from a simple leaf, because we were mainly concerned of the scaling between blade shape and blade area. For simplicity, we referred to a blade as a leaf in the following text. This means that our “leaf” does not include a petiole, and it can be a simple leaf or a leaflet of a compound leaf (e.g., the leaves of Potentilla indica (Andrews) T. Wolf, Rosa multiflora Thunb., and Rubus hirsutus Thunb. are all compound leaves).
Leaves from long and short shoots can differ significantly even if sampled from the same plants [27]. Ambient light during leaf maturation and lamina expansion influences LMA, as can temperature [28]. To eliminate the influence of these and other factors, leaves were all collected from the Nanjing Forestry University campus (32°03′09″ N, 118°48′52″ E) from late April to early May of 2018, except those of Pyrus calleryana Decne, which were collected in early July 2018 because of their late maturity. For each species, we selected more than 300 mature intact leaves from adult plants from the middle perimeter of the canopy at 8 AM each day. The leaves of woody species were sampled from five to 20 plants, except Rubus hirsutus Thunb., of which leaves were sampled from 45 plants, and the leaves of P. indica, a herbaceous plant, which were sampled from 108 plants. Leaves were quickly placed in wet paper and packed in a plastic self-sealing bag (28 cm × 20 cm). After wiping off any water from surfaces, the fresh weight of each fresh leaf was measured using an electronic balance (Type: ML 204; Mettler Toledo Company, Greifensee, ZH, Switzerland; measurement accuracy is 0.0001 g). A scanner (Type: Aficio MP 7502; Ricoh Company, Tokyo, Japan) was used to scan the leaf lamina at a 600 dpi resolution (Figure 1). The planar coordinates of the lamina perimeter were then determined using Matlab (version 2019a, MathWorks, Natick, MA, United States) programs developed by Shi et al. [29,30].

2.2. Leaf Data Acquisition

After scanning and logging images, leaves were placed in Kraft paper envelopes (16.5 cm × 22.5 cm) and subsequently dried in an oven (Type: XMTD−8222; Jinghong Experimental Equipment Co., Ltd., Shanghai, China) at 105 °C for 2 hours and then continuously at 80 °C until achieving a constant weight. Leaf area, leaf width, leaf length, areal ratio of the left side to the right side, and leaf perimeter were obtained using the R script [31] developed by Shi et al. [30] and Su et al. [32].

2.3. Models and Data Analysis

2.3.1. The Relationship between Leaf Dry Weight and Leaf Surface Area

The relationship between leaf dry weight (W, g) and leaf area (A, cm2) conformed with a power function [17,33]:
W = aAb
which, when log-transformed, can be rewritten as:
ln(W) = ln(a) + bln(A)
where a and b are the normalization constant and the scaling exponent, respectively. Noting that:
LMA = W/A
Equations (1) and (2) become:
LMA = aAb−1
or, when log-transformed:
ln(LMA) = ln(a) + (b−1)ln(A) ⇔ y = α + (b−1)x
where x = ln(A), y = ln(LMA), α = ln(a).

2.3.2. The Relationships among Lamina Area, Length, and Width

The relationship between lamina area (A), length (l), and width (w) generally conforms with the formula:
A = k (w × l)
where k is the constant to be fitted [34,35]. Let us assume that the ratio of leaf width and length is a constant (λ):
λ = w/l
It follows that:
A = kλl2 = kw2

2.3.3. Leaf-Shape Indices and the Scaling Relationships with Leaf Area

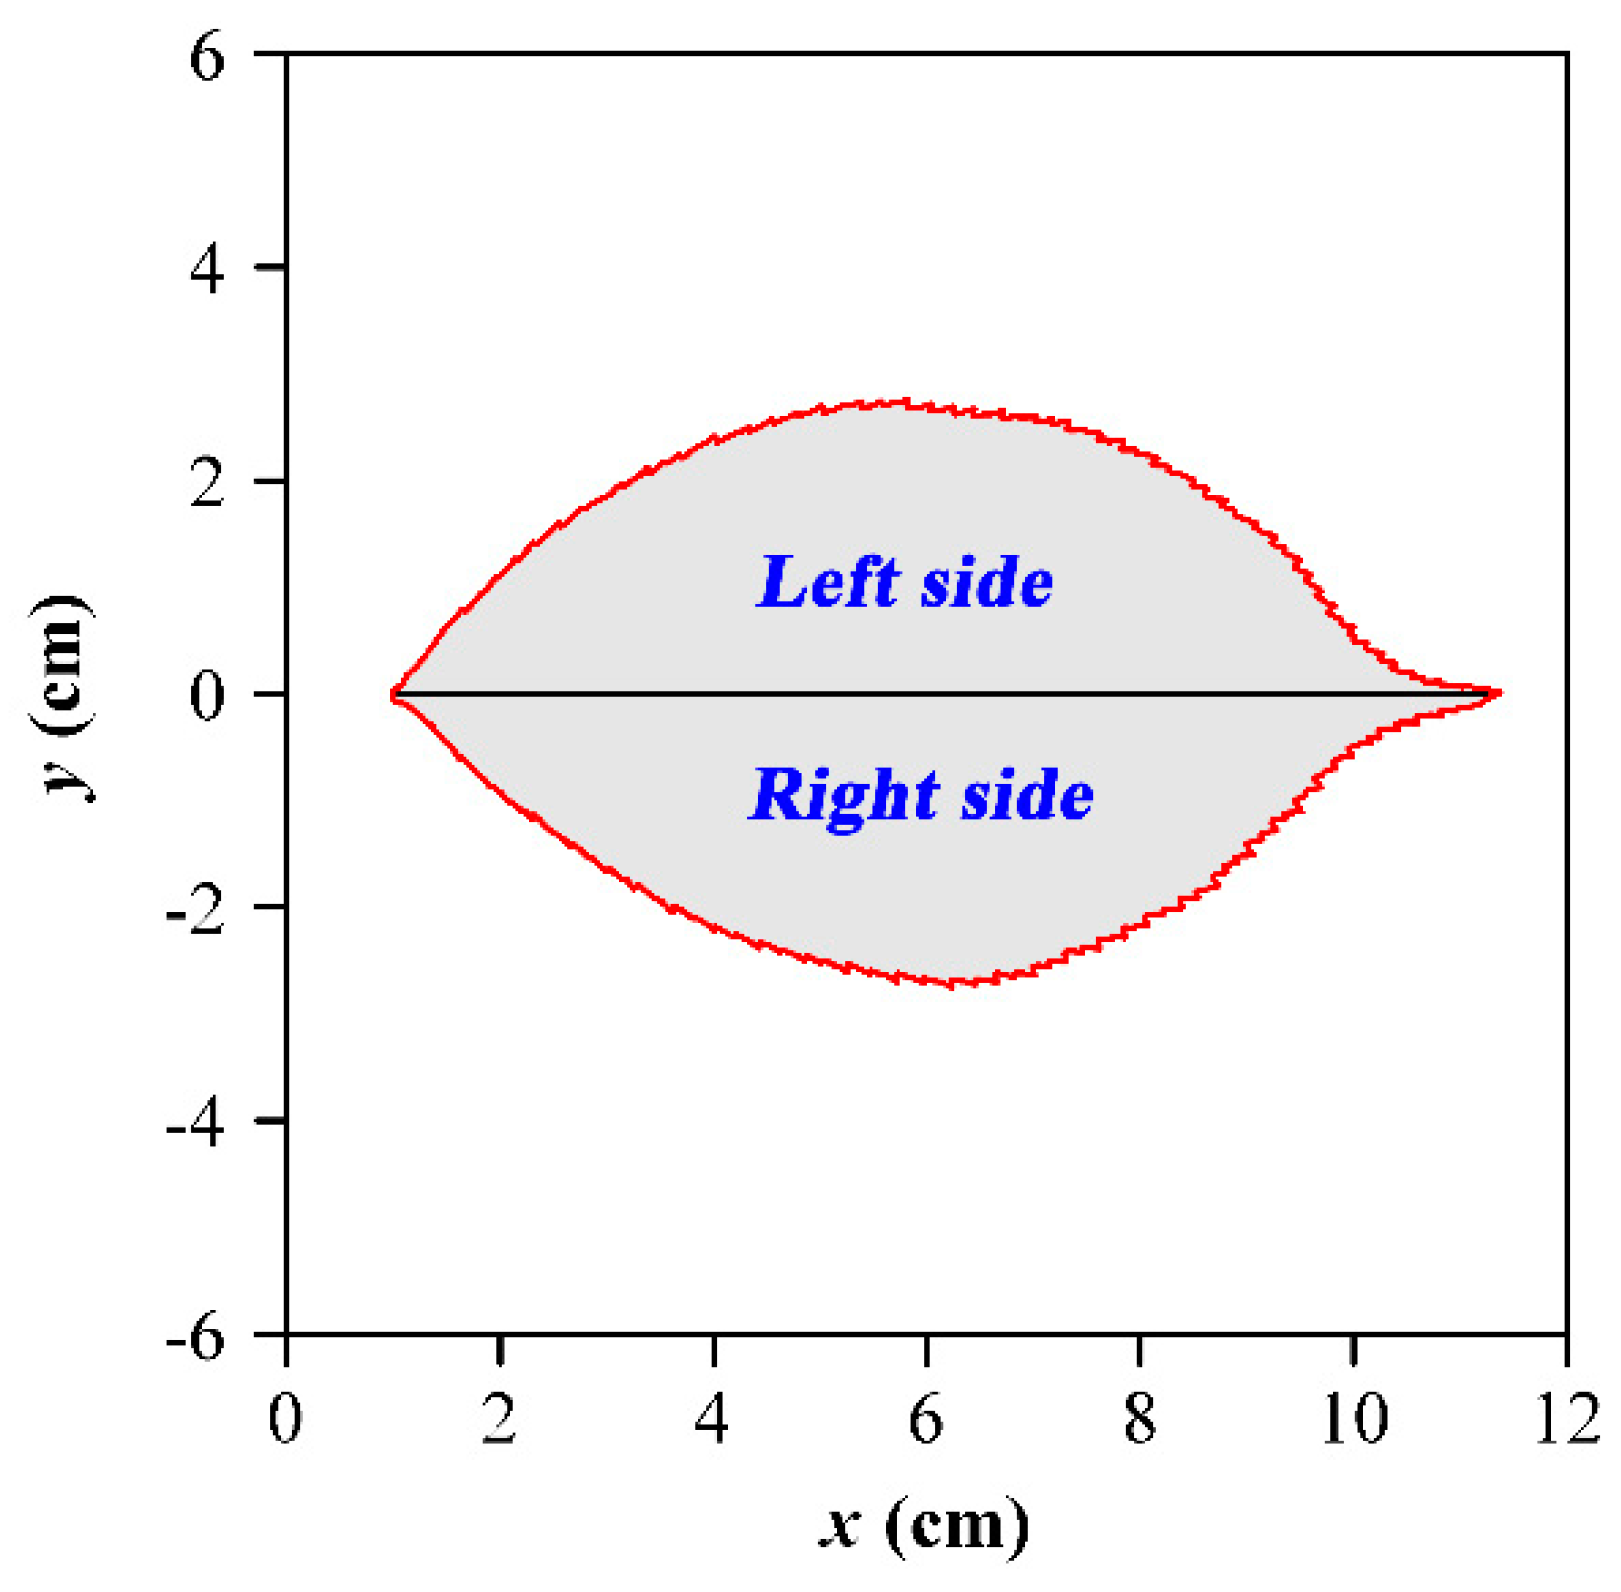
We used three indices to quantify leaf shape, including the ratio of leaf width to length as mentioned above (RWL), the left to right side leaf area ratio (AR), and ratio of lamina perimeter to area (RPA). AR is established by the leaf mid-vein which defines the left and right sides of a leaf (Figure 2). AR is the areal ratio of the left side (L) to the right side (R) of a lamina, i.e.:
AR = L/R
RPA as the ratio of lamina perimeter (P) to area (A), i.e.:
RPA = P/A
The scaling relationship between leaf lamina perimeter and area was described by the formula:
P = βAθ
where β and θ are both constants to be fitted. Combining this formula with Equation (10) yields:
RPA = βAθ−1
which, when log-transformed, gives:
ln(RPA) = ln(β) + (θ−1)ln(A) ⇔ y = c + (θ−1)x
where x = ln(A), y = ln(RPA), c = ln(β).

2.3.4. Statistical Analysis

Reduced major axis (RMA) protocols [36] were used to fit the linear relationship of the log-transformed data of any of the biological variables of interest. The Tukey’s Honestly Significant Difference (HSD) test [37] was used to determine the significance of differences in leaf-shape indices among the 12 Rosaceae species.

3. Results

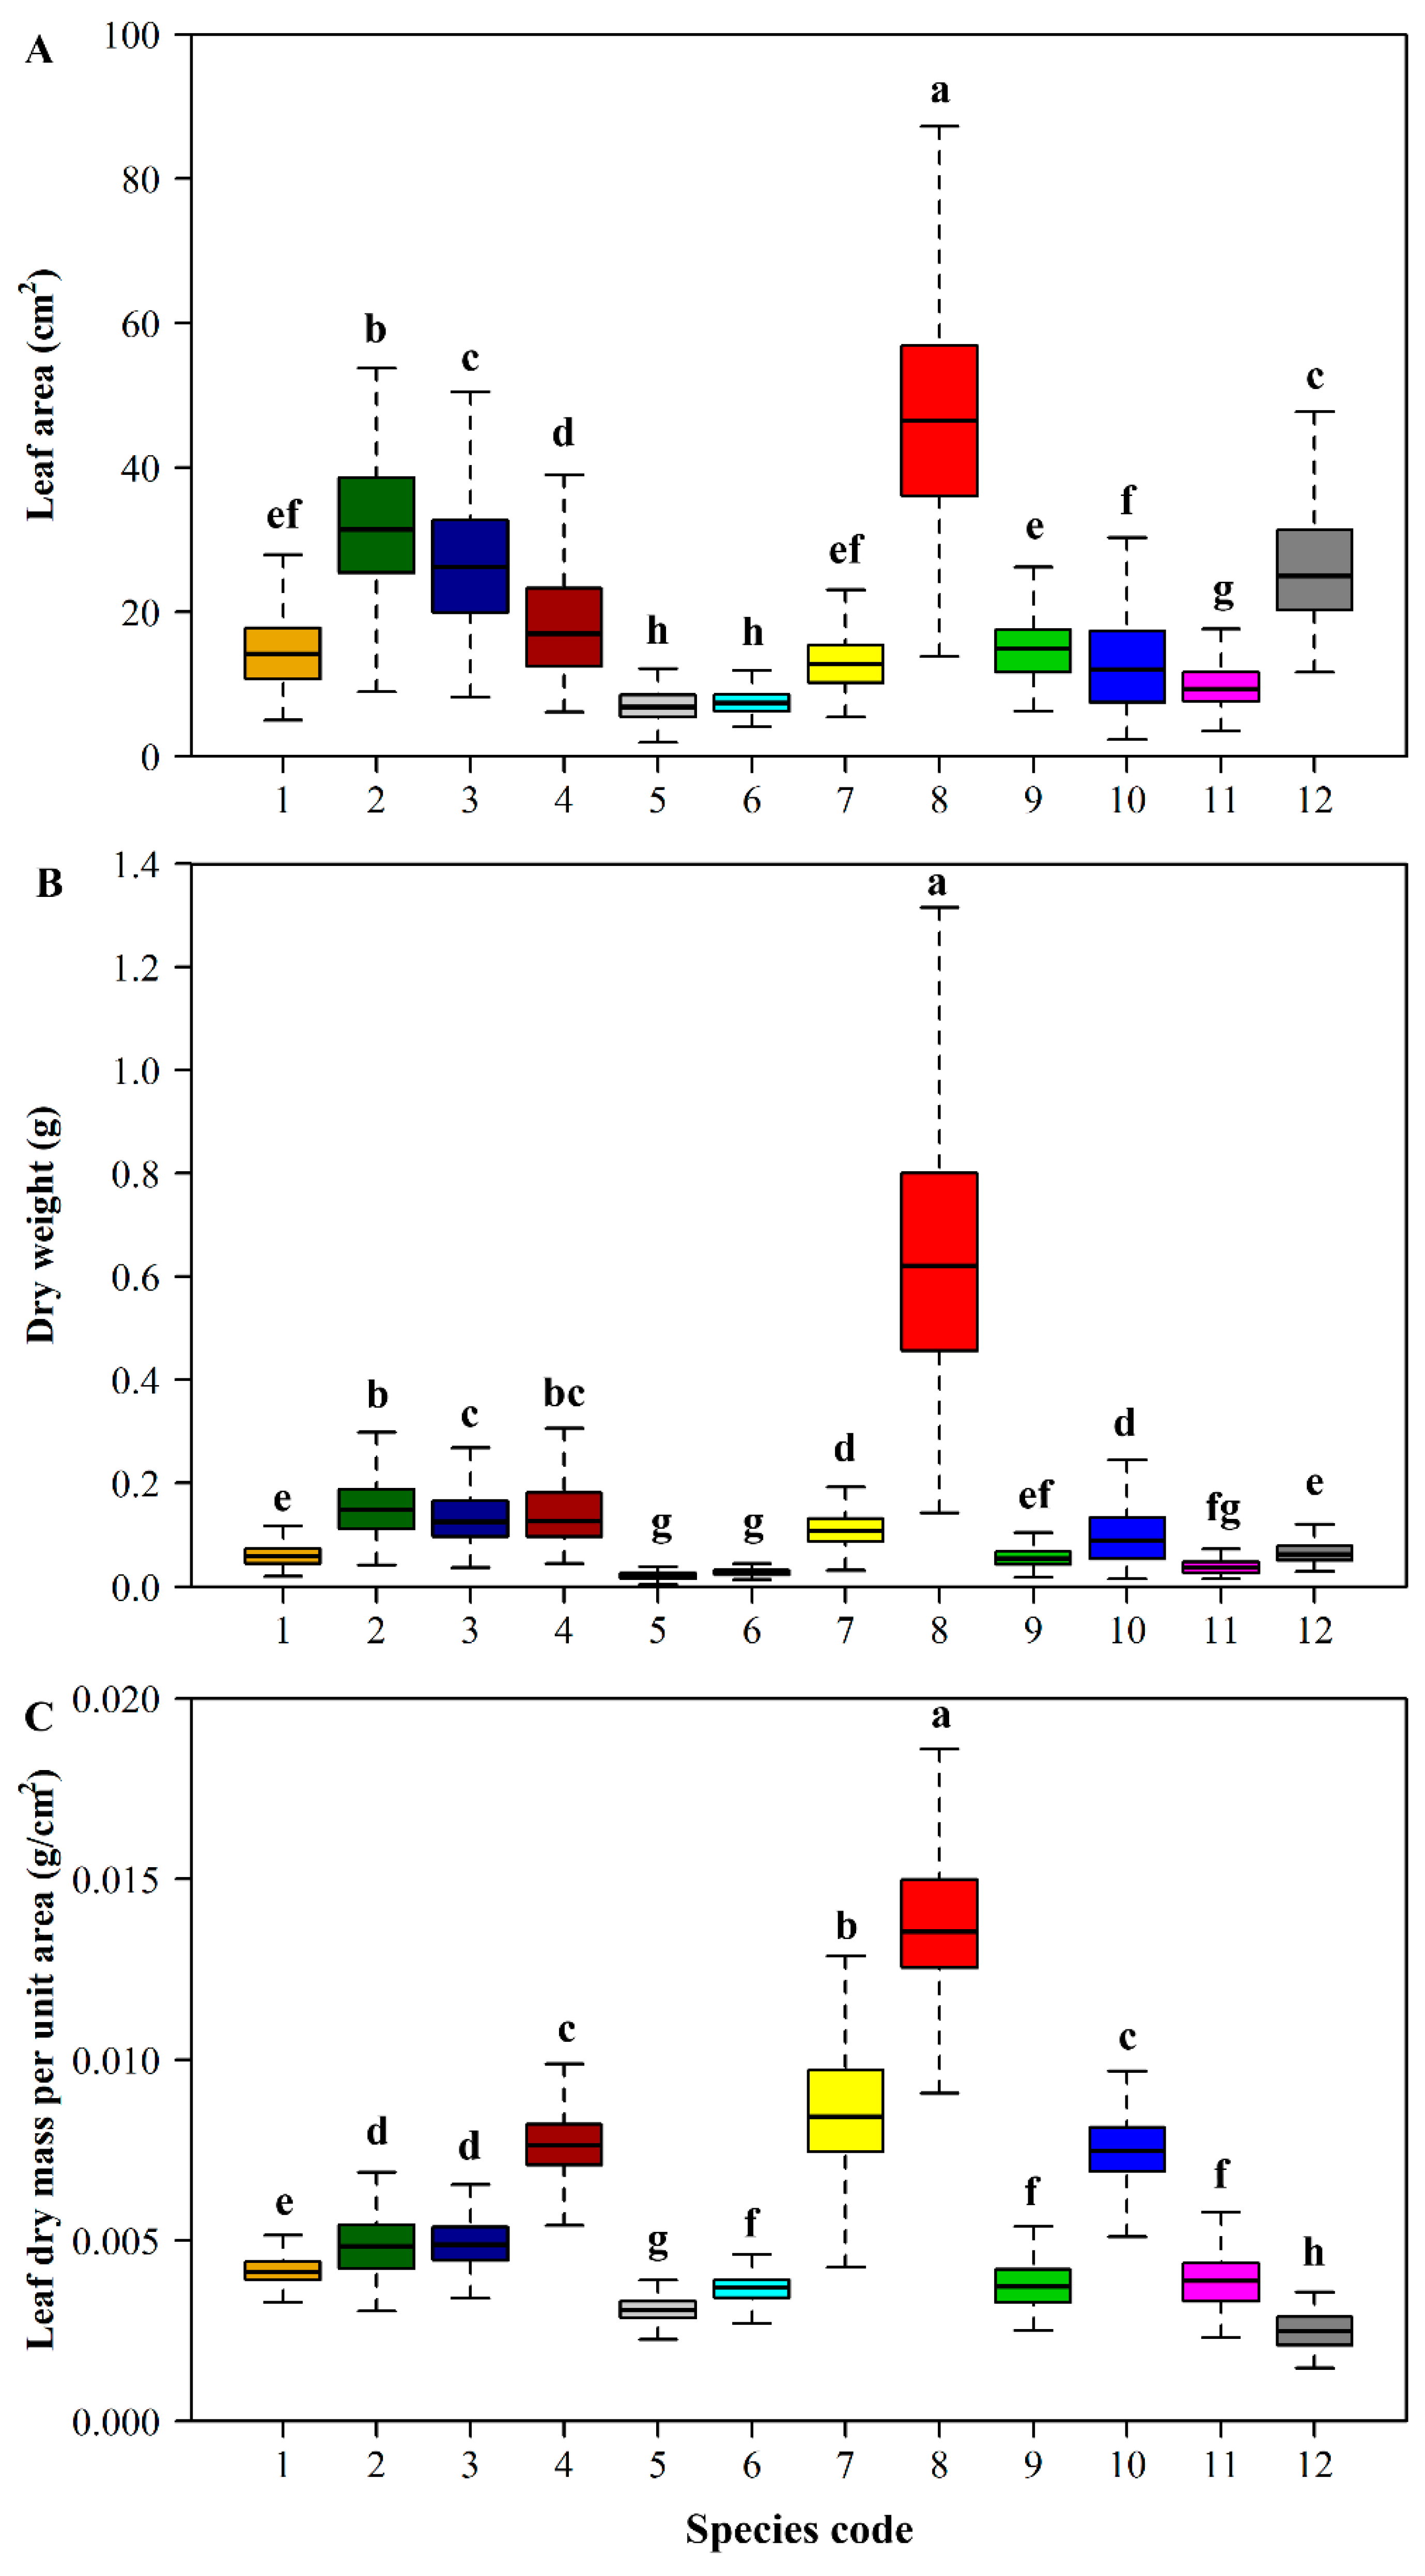
Among the 12 species, leaf area ranged from 1.96 cm2 (P. indica) to 93.15 cm2 (P. serratifolia), blade dry weight ranged from 0.0059 g (P. indica) to 1.4330 g (P. serratifolia), and LMA ranged from 0.0015 g/cm2 (R. hirsutus) to 0.0189 g/cm2 (P. serratifolia) (Figure 3).
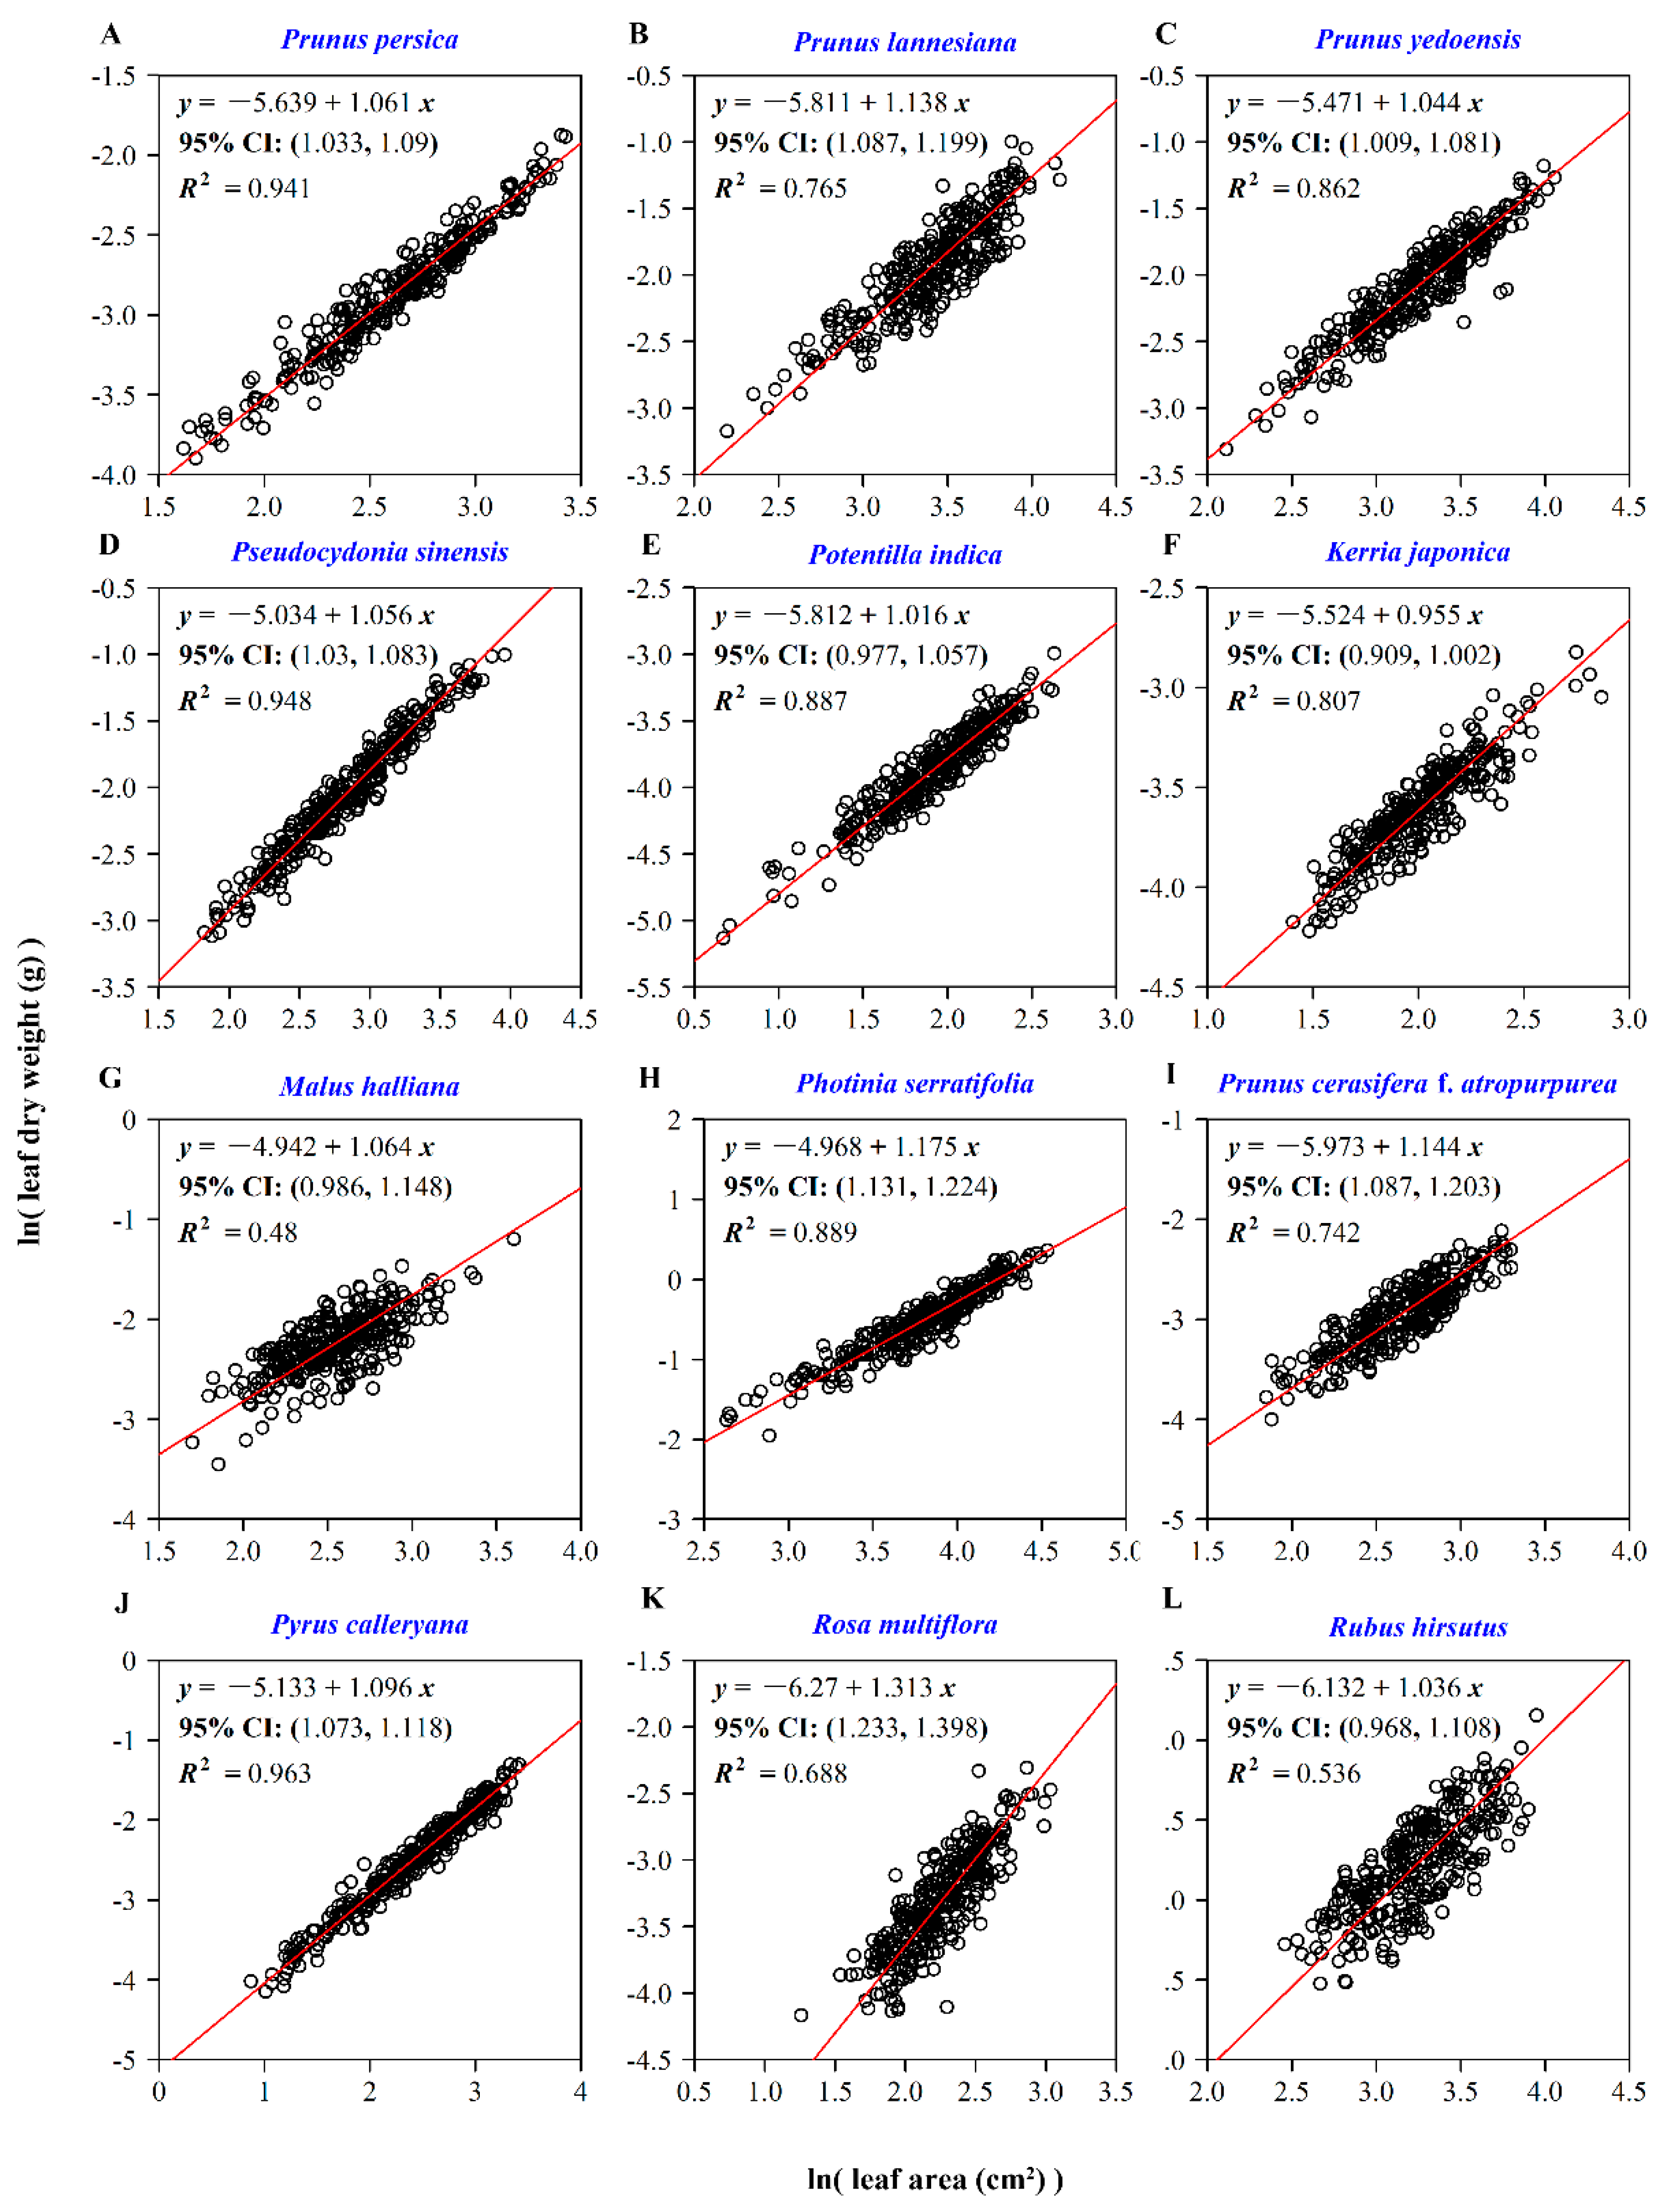
Among the 12 species, the slope for the log-transformed data of leaf dry weight versus area ranged from 0.955 (K. japonica) to 1.313 (R. multiflora). For the remaining 10 other species, the slope ranged between 1.0 and 1.2. The coefficients of determination (i.e., R2) of individual species equaled or exceeded 0.6, with the exception of M. halliana and R. hirsutus. The coefficients of determination of seven species even exceeded 0.8 (Figure 4).
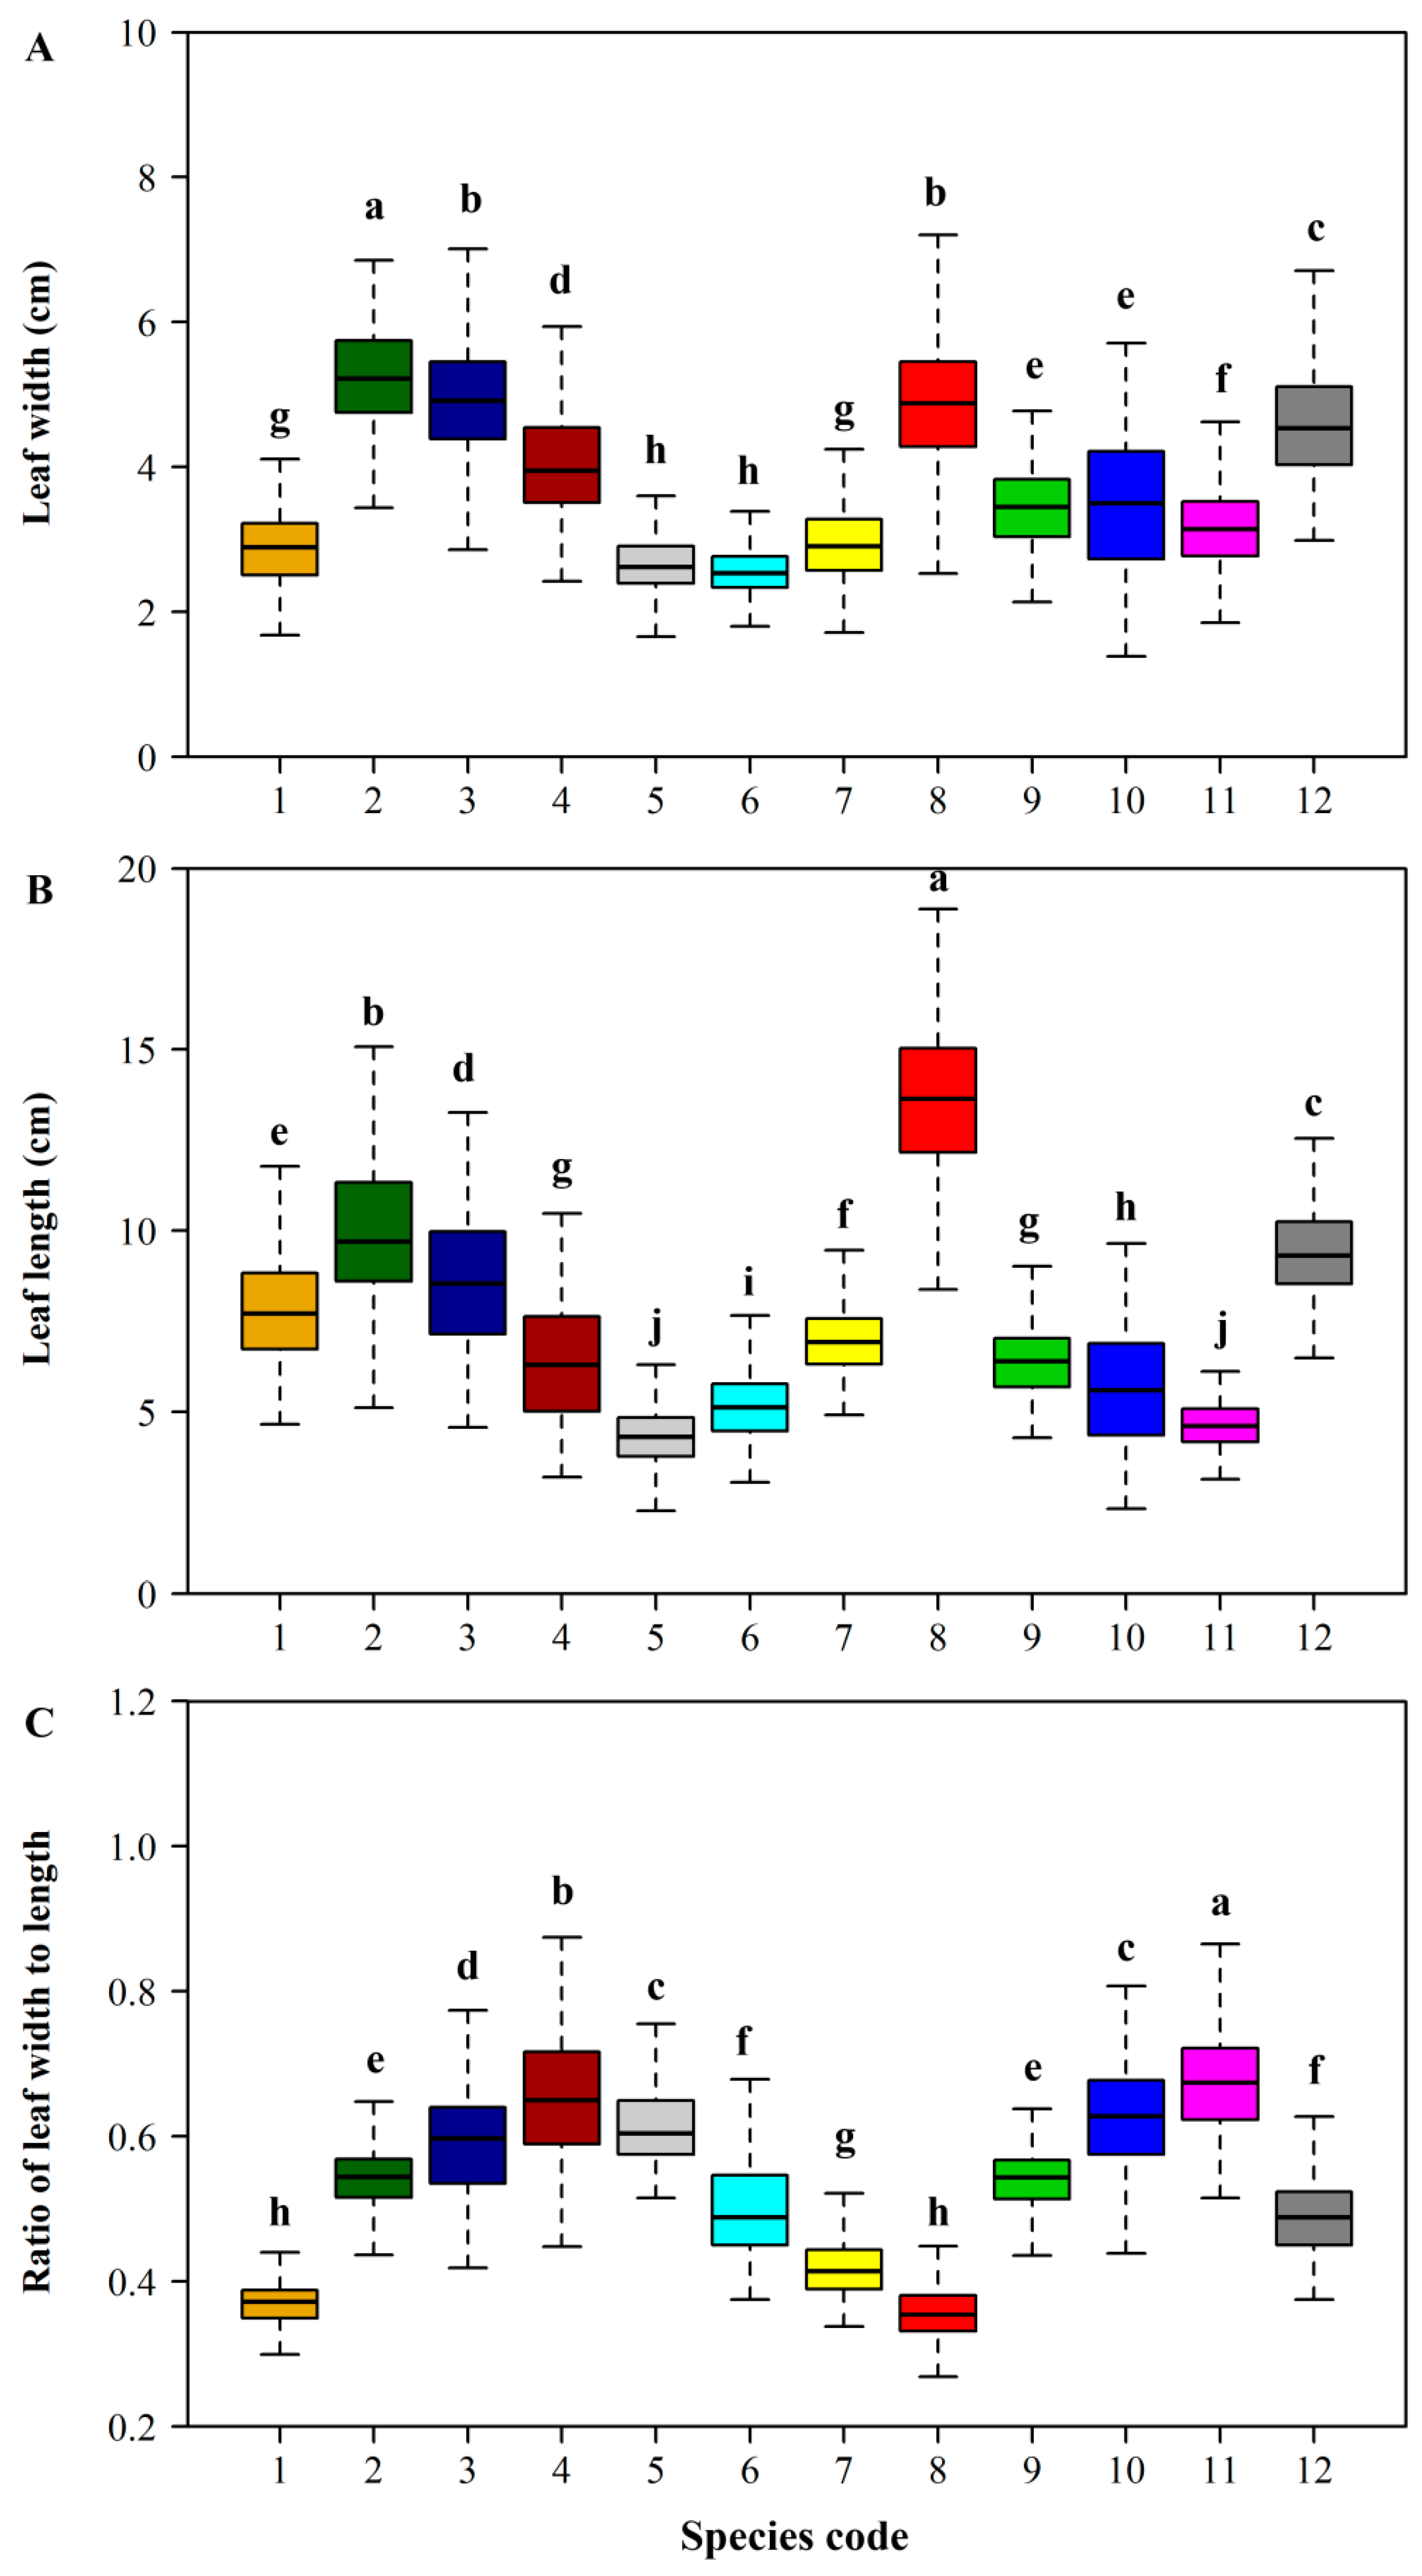
A clear proportional relationship exists between leaf width and length (Figure 5; Table 2). However, different species have different ratios of leaf width and length, ranging from 0.40 (P. persica) to 0.69 (R. multiflora). The coefficients of determination ranged from 0.98 (K. japonica) to 0.99 (P. indica). Therefore, according to Equation (8), leaf area is proportional to either leaf length squared or leaf width squared, regardless of the ratio of the width to length [38,39].
There were no significant differences in AR among the 12 species (Figure 6). The correlation coefficients between AR and leaf area of 11 species ranged from −0.065 to 0.1, with only that of one species (P. lannesiana) exceeding 0.1, though not exceeding 0.2. Most corresponding P values exceeded 0.05. Thus, the correlation between AR and leaf area was fairly weak. The correlation coefficients of four species (P. persica, P. lannesiana, M. halliana, and P. cerasifera f. atropurpurea) were even negative, while the others were positive (Table 3). Therefore, there might be a pseudo-correlation between AR and leaf area.
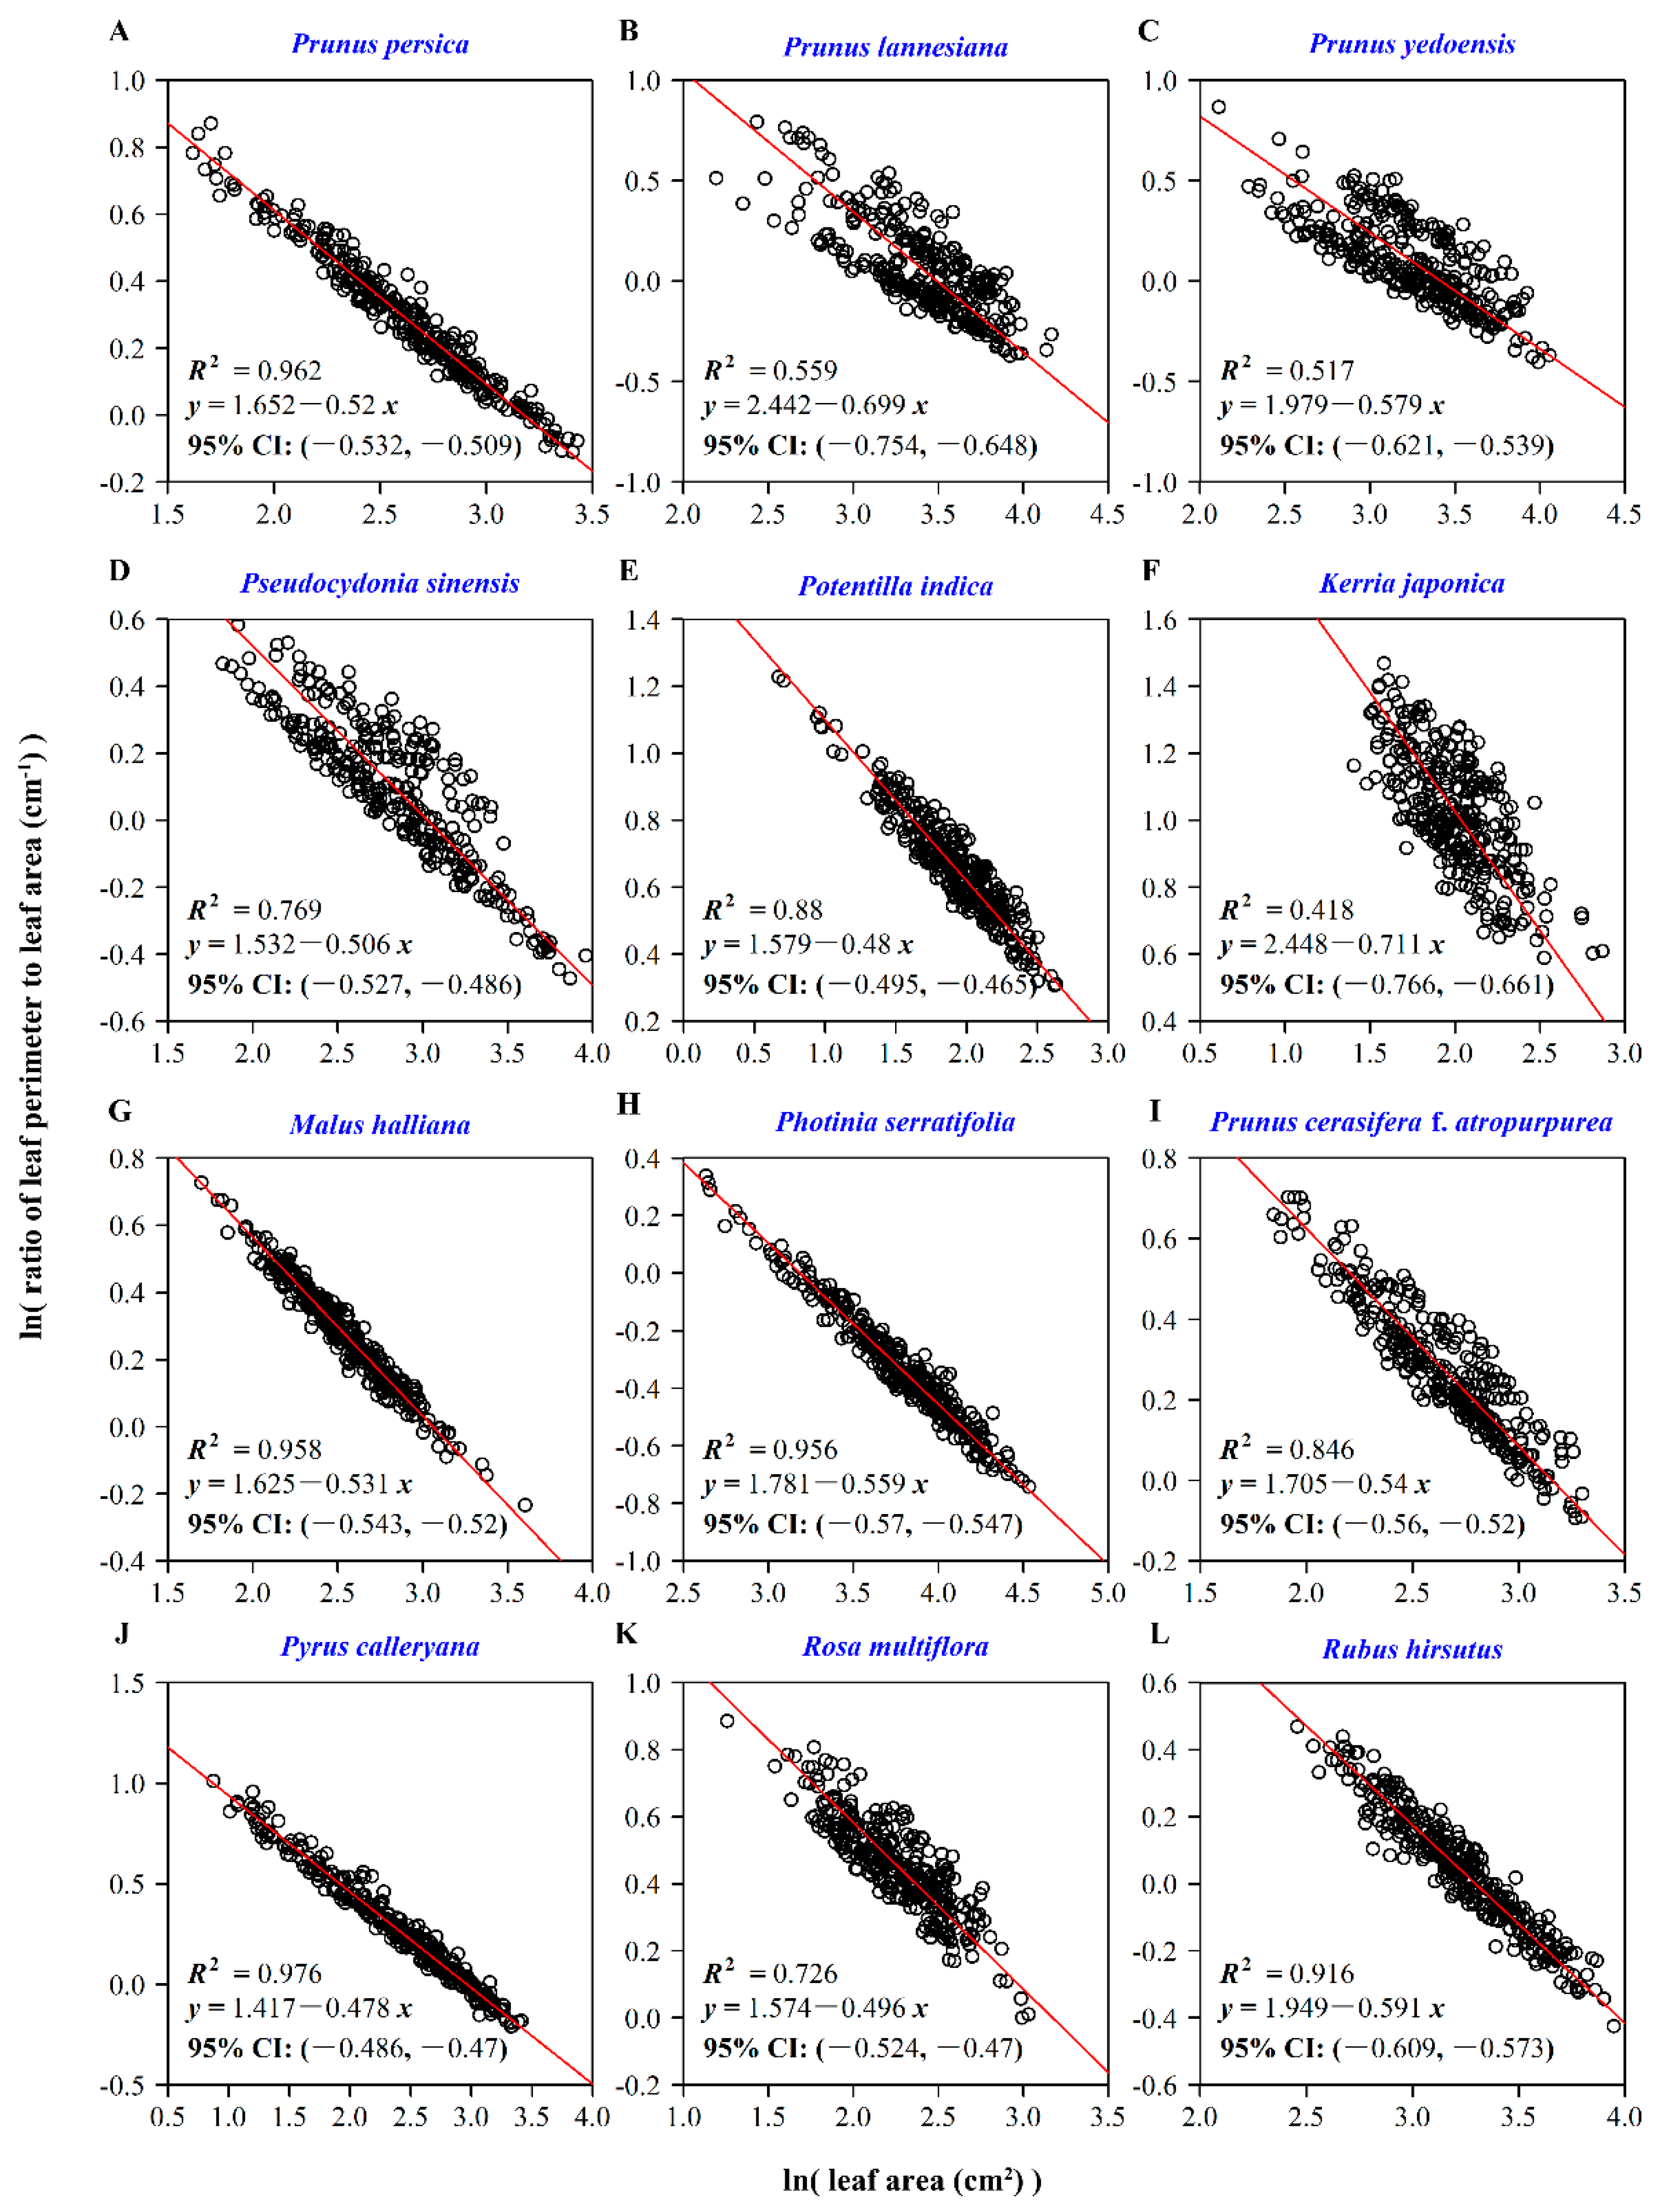
There was a negative correlation between RPA and leaf area for all of the 12 species (Figure 7). The slope of RPA versus area ranged from −0.711 (K. japonica) to −0.478 (P. calleryana), among which those of 10 species were between −0.591 and −0.478, and those of two other species were −0.699 (P. lannesiana) and −0.711 (K. japonica), respectively, which deviated slightly from −0.5. The coefficients of determination of nine species ranged from 0.726 (R. multiflora) to 0.976 (P. calleryana); however, those of three species had relatively poor goodness of fit, i.e., the corresponding coefficients of determination were only 0.559 (P. lannesiana), 0.517 (P. yedoensis), and 0.418 (K. japonica), respectively.

4. Discussion

In the present study, we found that there was a scaling relationship between leaf dry weight and leaf surface area for each species investigated, and the estimated scaling exponents were all greater than 1. This means that the increase of leaf dry weight did not keep pace with that of leaf surface area. Niklas et al. [17] found that the increases of four foliar traits, including leaf area, leaf water mass, nitrogen mass per leaf lamina, and phosphorus mass per leaf lamina, did not keep up the pace with the increase of leaf dry mass. This signals the existence of some general scaling relationships between indirect measures of photosynthetic capacity (e.g., the above four functional traits) and leaf dry mass. However, the estimates of the scaling exponents for the allometry between functional traits and leaf dry mass among different species or different geographical populations (or cultivars) of the same species are different [40,41]. The difference in scaling exponents among species appears to be minute. For example, Lin et al. [38] checked the scaling relationship between leaf fresh weight and leaf surface area of 11 bamboo species and found that the goodness of fit for the pooled data of those species was strong. This shows that although bamboo species are different, they have rather uniform leaf morphology, which enables the use of leaf area as a representative of leaf mass. For the 12 Rosaceae species, the estimated scaling exponents of leaf dry weight versus area vary largely from 0.955 to 1.313 (Figure 4), which might be caused by the differences in leaf shape. However, the present study is in accordance with the reports of the above references, which all demonstrate a scaling relationship between leaf biomass and area with an exponent >1.
Jurik [16] studied the major deciduous broad-leaved tree species in northern Michigan and found that LMA could be used as a good index of leaf physiological characteristics. LMA increases as relative light availability and light demand increase, and declines in shadow conditions [42]. Although LMA was found to remain relatively constant during growing season, it gradually declines in autumn with the reduction of sugar and nutrients [43]. The spatial position of leaves in trees also affects LMA. For instance, the leaves of bigtooth aspen (Populus grandidentata Michx.), red oak (Quercus rubra L.), and red maple (Acer rubrum L.) have greater LMA values in the upper layers of trees [16]. However, the intraspecific difference in LMA, including these caused by sampling position, is smaller than interspecific difference [8]. Nevertheless, we collected the leaves in the same sampling location at the same time but for different individuals of the same species; this could effectively avoid intra-species differences in leaf measures.
The scaling relationships of leaf dry weight versus area for 12 Rosaceae species held, and the estimated slopes fell into a range of 1.0 and 1.33, except K. japonica. Thus, for each of the 11 tree species, LMA increased with leaf area. This means that a larger leaf requires more investment of dry mass per unit area than a smaller leaf, consistent with the literature [17,33,38]. The mean and range of leaf area and leaf weight of K. japonica were small (Figure 3; Table 3), although the 95% confidence interval of scaling exponent still included 1.
The estimates of the coefficient of proportionality between leaf length and width range from k = 0.38 to 0.69 (Table 2), with high goodness of fit (R2 > 0.98), indicated that the proportionality k can be regarded as species-specific constant and independent from leaf area. Since leaf area was proportional to the product of leaf length and width [34,39], we have A = kλl2 or A = kw2/λ. That is, the relationship between leaf area and leaf length (or leaf width) should theoretically hold, and leaf area can be conveniently estimated from length measures in the field.
Leaf bilateral asymmetry is significantly affected by the aboveground architectural structure and physiological attributes of plants [24,44]. The mutual occlusion between plant branches, the light source competition of adjacent trees [45,46] and the morphological changes of plants in response to competition can affect leaf shape and symmetry [44]. Canopies blocked from each other can result in different distributions of nutrients and internal materials that form leaf structure, reflected in leaf shape measures, with plants in regular spatial distributions having more symmetric leaves [24]. The investigated 12 Rosaceae species have different aboveground architectural structures. The structure can influence the survival and competition among different trees in forest ecosystems, especially among neighboring tree species [47,48] as trees can spread their photosynthetic organs (namely the leaves on branches) to contend for more space [45]. Therefore, crown spread patterns can influence the productivity of an individual tree and the outcome of competition with neighboring trees [49,50]. At the same time, due to the difference in the aboveground architectural structure, the heterogeneity of light falling on branches and leaves is an important factor resulting in leaf bilateral asymmetry [24]. A denser crown results in stronger light competition and less leaf bilateral symmetry. However, our results show that leaf bilateral symmetry does not affect leaf area. The AR values of the 12 Rosaceae species were not significantly different from each other (Figure 6). The correlation coefficients between AR and leaf area for different species are rather low and mostly insignificant (Table 3), suggesting that the extent of leaf bilateral symmetry is independent of leaf size.
The ratio of perimeter to area (or the square root of area) is often used for depicting patch irregularity [51]. In leaf morphology, it reflects the extent of deviation from a standard circle or ellipse. The estimates of the scaling exponent in equation (13) for most species are close to −0.5, indicating that leaf area is proportional to RPA squared. Taking aside P. lannesiana and K. japonica, the estimates of scaling exponents for the other 10 species ranged between −0.6 and −0.4 (Figure 7). Difference in the scaling exponent between RPA and leaf area could reflect different leaf shapes between species. Because LMA is positively correlated with leaf area, we can expect a negative correlation between RPA and LMA. As RPA increases, LMA gradually decreases. Leaf perimeter represents the degree of the serrationalization on leaf edge. Because leaf serration can affect the utilization of light captured in the leaf inside [9], PRA is closely associated with photosynthetic capacity. Thus, it deserves due attention in future investigation.

5. Conclusions

We studied the scaling relationships between leaf dry weight and area, and between RPA and area for 12 Rosaceae species. For each species investigated here, there was a significant scaling relationship between leaf dry weight and area, with a scaling exponent > 1 for all species except K. japonica. Moreover, RPA was found to negatively scale with leaf area with a scaling exponent approximate to −1/2. We found that there was a positive correlation between leaf area and LMA (which is usually associated with the photosynthetic capacity of plants), which shows that LMA increased with leaf area increasing. In addition, we found no correlation between AR and leaf area, nor between RWL and leaf area, suggesting that leaf bilateral symmetry is unrelated to leaf size for the 12 Rosaceae species.

Author Contributions

P.S. designed this experiment and analyzed the data; X.Y. and Z.L. carried out the experiment; X.Y., C.H., H.S.S. and P.S. wrote this manuscript; P.S. revised the earlier version with the assistance of X.Y.; all the authors read and commented on this manuscript.

Funding

This research was funded by the Research and Demonstration Project of Agro-Forestry Complex Management Technology of Salt-tolerant Coastal Tree Species (grant number: CX (16) 1005), Priority Academic Program Development of Jiangsu Higher Education Institutions (grant number: no number), and the Development, Planning and Discipline Construction Department of Nanjing Forestry University (grant number: 163100020).

Acknowledgments

The authors thank Karl J. Niklas, Julian Schrader, and Ping Wang for their valuable help during the preparation of this manuscript, and also our thanks to the three anonymous reviewers for their invaluable comments.

Conflicts of Interest

The authors declare no conflicts of interest.

References

  1. Musarella, C.M.; Cano-Ortiz, A.; Pinar Fuentes, J.C.; Navas-Urena, J.; Pinto Gomes, C.J.; Quinto-Canas, R.; Cano, E.; Spampinato, G. Similarity analysis between species of the genus Quercus L. (Fagaceae) in southern Italy based on the fractal dimension. PhytoKeys 2018, 113, 79–95. [Google Scholar] [CrossRef] [PubMed]
  2. De Araujo Mariath, J.E.; Pires Dos Santos, R.; Pires Dos Santos, R. Fractal dimension of the leaf vascular system of three Relbunium species (Rubiaceae). Braz. J. Biol. Sci. 2010, 8, 30–33. [Google Scholar]
  3. Dengler, N.G.; Kang, J. Vascular patterning and leaf shape. Curr. Opin. Plant Biol. 2001, 4, 50–56. [Google Scholar] [CrossRef]
  4. Runions, A.; Fuhrer, M.; Lane, B.; Federl, P.; Rolland-Lagan, A.-G.; Prusinkiewicz, P. Modeling and visualization of leaf venation patterns. ACM Trans. Graphics 2005, 24, 702–711. [Google Scholar] [CrossRef] [Green Version]
  5. Roderick, M.L.; Berry, S.L.; Noble, I.R.; Farquhar, G.D. A theoretical approach to linking the composition and morphology with the function of leaves. Funct. Ecol. 1999, 13, 683–695. [Google Scholar] [CrossRef]
  6. Brodribb, T.J.; Field, T.S.; Jordan, G.J. Leaf maximum photosynthetic rate and venation are linked by hydraulics. Plant Physiol. 2007, 144, 1890–1898. [Google Scholar] [CrossRef]
  7. Nicotra, A.B.; Leigh, A.; Boyce, C.K.; Jones, C.S.; Niklas, K.J.; Royer, D.L.; Tsukaya, H. The evolution and functional significance of leaf shape in the angiosperms. Funct. Plant Biol. 2011, 38, 535–552. [Google Scholar] [CrossRef] [Green Version]
  8. Niinemets, Ü.; Kull, K. Leaf weight per area and leaf size of 85 Estonian woody species in relation to shade tolerance and light availability. For. Ecol. Manag. 1994, 70, 1–10. [Google Scholar] [CrossRef]
  9. Smith, W.K.; Vogelmann, T.C.; DeLucia, E.H.; Bell, D.T.; Shepherd, K.A. Leaf form and photosynthesis: Do leaf structure and orientation interact to regulate internal light and carbon dioxide? BioScience 1997, 47, 785–793. [Google Scholar] [CrossRef]
  10. Niinemets, Ü. Research review: Components of leaf dry mass per area-thickness and density-alter leaf photosynthetic capacity in reverse directions in woody plants. New Phytol. 1999, 144, 35–47. [Google Scholar] [CrossRef]
  11. Niinemets, Ü. Global-scale climatic controls of leaf dry mass per area, density, and thinness in trees and shrubs. Ecology 2001, 82, 453–469. [Google Scholar] [CrossRef]
  12. Funk, J.L.; Cornwell, W.K. Leaf traits within communities: Context may affect the mapping of traits to function. Ecology 2013, 94, 1893–1897. [Google Scholar] [CrossRef] [PubMed]
  13. Onoda, Y.; Saluñga, J.B.; Akutsu, K.; Aiba, S.; Yahara, T.; Anten, N.P.R. Trade-off between light interception efficiency and light use efficiency: Implications for species coexistence in one-sided light competition. J. Ecol. 2014, 102, 167–175. [Google Scholar] [CrossRef]
  14. Puglielli, G.; Crescente, M.F.; Frattaroli, A.R.; Gratani, L. Leaf mass per area (LMA) as a possible predictor of adaptive strategies in two species of Sesleria (Poaceae): Analysis of morphological, anatomical and physiological leaf traits. Ann. Bot. Fenn. 2015, 52, 135–143. [Google Scholar] [CrossRef]
  15. Yu, X.J.; Shi, P.J.; Hui, C.; Miao, L.F.; Liu, C.L.; Zhang, Q.Y.; Feng, C.N. Effects of salt stress on the seaf shape and scaling of Pyrus betulifolia Bunge. Symmetry 2019, 11, 991. [Google Scholar] [CrossRef]
  16. Jurik, T.W. Temporal and spatial patterns of specific leaf weight in successional northern hardwood tree species. Am. J. Bot. 1986, 73, 1083–1092. [Google Scholar] [CrossRef]
  17. Niklas, K.J.; Cobb, E.D.; Niinemets, Ü.; Reich, P.B.; Sellin, A.; Shipley, B.; Wright, I.J. “Diminishing returns” in the scaling of functional leaf traits across and within species groups. Proc. Natl. Acad. Sci. USA 2007, 104, 8891–8896. [Google Scholar] [CrossRef] [PubMed]
  18. Howland, H.C. Structural, Hydraulic, and ‘Economic’ Aspects of Leaf Venation and Shape. In Biological Prototypes and Synthetic Systems; Bernard, E.E., Kare, M.R., Eds.; Plenum Press: New York, NY, USA, 1962. [Google Scholar]
  19. Grubb, P.J. A reassessment of the strategies of plants which cope with shortages of resources. Perspect. Plant Ecol. 1998, 1, 3–31. [Google Scholar] [CrossRef]
  20. Wright, I.J.; Reich, P.B.; Westoby, M.; Ackerly, D.D.; Baruch, Z.; Bongers, F.; Cavender-Bares, J.; Chapin, T.; Cornelissen, J.H.C.; Diemer, M.; et al. The worldwide leaf economics spectrum. Nature 2004, 428, 821–827. [Google Scholar] [CrossRef]
  21. Pan, S.; Liu, C.; Zhang, W.P.; Xu, S.S.; Wang, N.; Lin, Y.; Gao, J.; Wang, Y. The scaling relationships between leaf mass and leaf area of vascular plant species change with altitude. PLoS ONE 2013, 8, e76872. [Google Scholar] [CrossRef]
  22. Huang, W.W.; Su, X.F.; Ratkowsky, D.A.; Niklas, K.J.; Gielis, J.; Shi, P.J. The scaling relationships of leaf biomass vs. leaf surface area of 12 bamboo species. Glob. Ecol. Conserv. 2019, 20, e00793. [Google Scholar] [CrossRef]
  23. Klingenberg, C.P.; Barluenga, M.; Meyer, A. Shape analysis of symmetric structures: Quantifying variation among individuals and asymmetry. Evolution 2002, 56, 1909–1920. [Google Scholar] [CrossRef] [PubMed]
  24. Wang, P.; Ratkowsky, D.A.; Xiao, X.; Yu, X.J.; Su, J.L.; Zhang, L.F.; Shi, P.J. Taylor’s power law for leaf bilateral symmetry. Forests 2018, 9, 500. [Google Scholar] [CrossRef]
  25. Leigh, A.; Zwieniecki, M.A.; Rockwell, F.E.; Boyce, C.K.; Nicotra, A.B.; Holbrook, N.M. Structural and hydraulic correlates of heterophylly in Ginkgo biloba. New Phytol. 2011, 189, 459–470. [Google Scholar] [CrossRef] [PubMed]
  26. Editorial Board of Flora of China, Chinese Academy of Sciences. Flora of China; Science Press: Beijing, China, 1993. [Google Scholar]
  27. Niklas, K.J.; Christianson, M.L. Differences in the scaling of area and mass of Ginkgo biloba (Ginkgoaceae) leaves and their relevance to the study of specific leaf area. Am. J. Bot. 2011, 98, 1381–1386. [Google Scholar] [CrossRef]
  28. Poorter, H.; Niinemets, Ü.; Poorter, L.; Wright, I.J.; Villar, R. Causes and consequences of variation in leaf mass per area (LMA): A meta-analysis. New Phytol. 2009, 182, 565–588. [Google Scholar] [CrossRef] [PubMed]
  29. Shi, P.J.; Huang, J.G.; Hui, C.; Grissino-Mayer, H.D.; Tardif, J.C.; Zhai, L.H.; Wang, F.S.; Li, B.L. Capturing spiral radial growth of conifers using the superellipse to model tree-ring geometric shape. Front. Plant Sci. 2015, 6, 856. [Google Scholar] [CrossRef] [Green Version]
  30. Shi, P.J.; Ratkowsky, D.A.; Li, Y.; Zhang, L.F.; Lin, S.Y.; Gielis, J. A general leaf area geometric formula exists for plants-evidence from the simplified Gielis equation. Forests 2018, 9, 714. [Google Scholar] [CrossRef]
  31. R Core Team. R: A Language and Environment for Statistical Computing; R Foundation for Statistical Computing: Vienna, Austria, 2015; Available online: http://www.R-project.org (accessed on 17 April 2018).
  32. Su, J.L.; Niklas, K.J.; Huang, W.W.; Yu, X.J.; Yang, Y.Y.; Shi, P.J. Lamina shape does not correlate with lamina surface area: An analysis based on the simplified Gielis equation. Glob. Ecol. Conserv. 2019, 19, e00666. [Google Scholar] [CrossRef]
  33. Milla, R.; Reich, P.B. The scaling of leaf area and mass: The cost of light interception increases with leaf size. Proc. R. Soc. B Biol. Sci. 2007, 274, 2109–2114. [Google Scholar] [CrossRef]
  34. Montgomery, E.G. Correlation Studies in Corn; Annual Report No. 24.; Agricultural Experimental Station: Lincoln, NB, USA, 1911. [Google Scholar]
  35. Shi, P.J.; Liu, M.D.; Yu, X.J.; Gielis, J.; Ratkowsky, D.A. Proportional relationship between leaf area and the product of leaf length and width of four types of special leaf shapes. Forests 2019, 10, 178. [Google Scholar] [CrossRef]
  36. Smith, R.J. Used and misuse of the reduced major axis for line-fitting. Am. J. Phys. Anthropol. 2009, 140, 476–786. [Google Scholar] [CrossRef] [PubMed]
  37. Hsu, J.C. Multiple Comparisons: Theory and Methods; Chapman and Hall/CRC: New York, NY, USA, 1996. [Google Scholar]
  38. Lin, S.Y.; Shao, L.J.; Hui, C.; Song, Y.; Reddy, G.V.P.; Gielis, J.; Li, F.; Ding, Y.L.; Wei, Q.; Shi, P.J. Why does not the leaf weight-area allometry of bamboos follow the 3/2-power law? Front. Plant Sci. 2018, 9, 583. [Google Scholar] [CrossRef] [PubMed]
  39. Shi, P.J.; Liu, M.D.; Ratkowsky, D.A.; Gielis, J.; Su, J.L.; Yu, X.J.; Wang, P.; Zhang, L.F.; Lin, Z.Y.; Schrader, J. Leaf area-length allometry and its implications in leaf-shape evolution. Trees 2019, 33, 1073–1085. [Google Scholar] [CrossRef]
  40. Hughes, A.P.; Cockshull, K.E.; Heath, O.V.S. Leaf area and absolute water content. Ann. Bot. 1970, 34, 259–266. [Google Scholar] [CrossRef]
  41. Witkowski, E.T.F.; Lamont, B.B. Leaf specific mass confounds leaf density and thickness. Oecologia 1991, 88, 486–493. [Google Scholar] [CrossRef] [PubMed]
  42. Boardman, N.K. Comparative photosynthesis of sun and shade plants. Annu. Rev. Plant Physiol. 1977, 28, 355–377. [Google Scholar] [CrossRef]
  43. Ostman, N.L.; Weaver, G.T. Autumnal nutrient transfers by retranslocation, leaching, and litter fall in a chestnut oak forest in southern Illinois. Can. J. For. Res. 1982, 12, 40–51. [Google Scholar] [CrossRef]
  44. Küppers, M. Ecological significance of above-ground architectural patterns in woody plants: A question of cost-benefit relationships. Trends Ecol. Evol. 1989, 4, 375–379. [Google Scholar] [CrossRef]
  45. Sumida, A.; Komiyama, A. Crown spread patterns for five deciduous broad-leaved woody species ecological significance of the retention patterns of larger branches. Ann. Bot. 1997, 80, 759–766. [Google Scholar] [CrossRef]
  46. Sumida, A.; Terazawa, I.; Togashi, A.; Komiyama, A. Spatial arrangement of branches in relation to slope and neighbourhood competition. Ann. Bot. 2002, 89, 301–310. [Google Scholar] [CrossRef] [PubMed]
  47. Wierman, C.A.; Oliver, C.D. Crown stratification by species in even-aged mixed stands of Douglas-fir-western hemlock. Can. J. For. Res. 1979, 9, 1–9. [Google Scholar] [CrossRef]
  48. Kuuluvainen, T. Tree architectures adapted to efficient light utilization: Is there a basis for latitudinal gradients? Oikos 1992, 65, 275–284. [Google Scholar] [CrossRef]
  49. Clatterbuck, W.K.; Hodges, J.D. Development of cherrybark oak and sweet gum in mixed, even-aged bottomland stands in central Mississippi, U.S.A. Can. J. For. Res. 1988, 18, 12–18. [Google Scholar] [CrossRef]
  50. Itô, H.; Sumida, A.; Isagi, Y.; Kamo, K. The crown shape of an evergreen oak, Quercus glauca, in a hardwood community. J. For. Res. 1997, 2, 85–88. [Google Scholar] [CrossRef]
  51. Wu, J. Landscape Ecology: Pattern, Process, Scale and Hierarchy, 2nd ed.; Higher Education Press: Beijing, China, 2007. [Google Scholar]
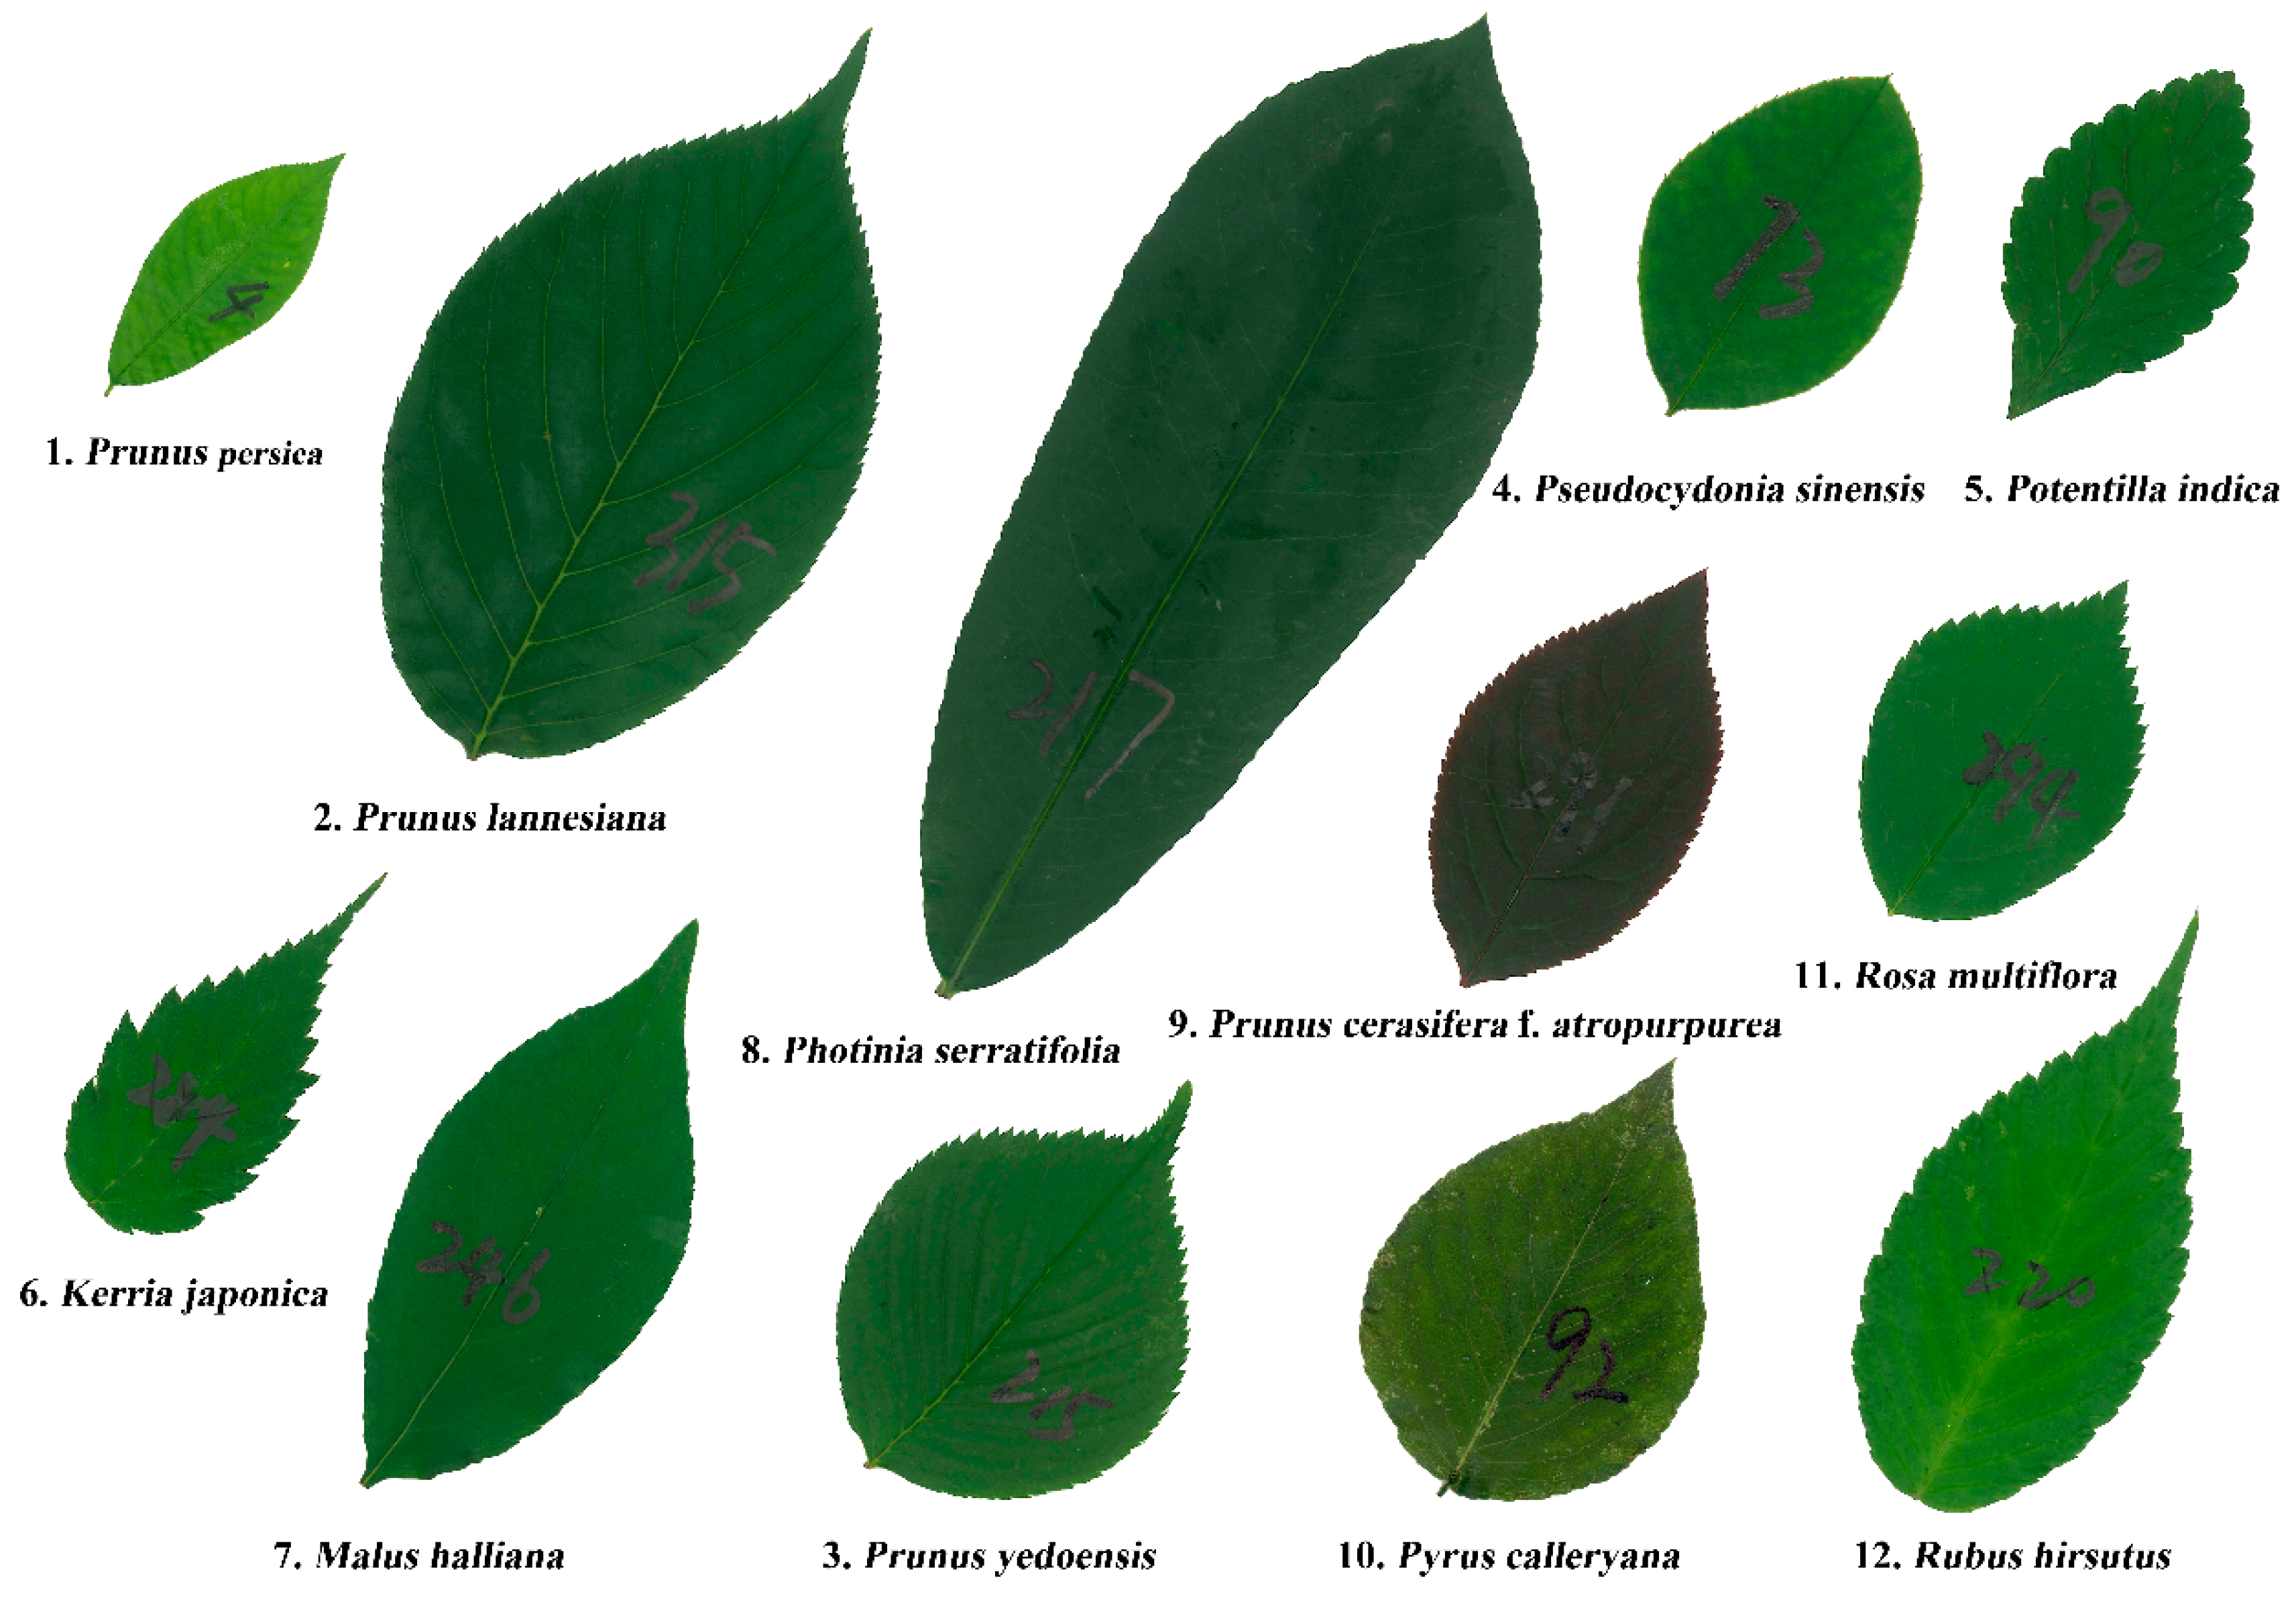
Figure 1. Leaf examples of 12 Rosaceae species. The examples of Potentilla indica (Andrews) T. Wolf, Rosa multiflora Thunb., and Rubus hirsutus Thunb. are actually leaflets of the compound leaves.
Symmetry 11 01255 g001
Figure 2. Illustration of the measure of bilateral symmetry for a blade of P. lannesiana. The leaf base is on the left, and the leaf apex is on the right. The upper part above the symmetry axis is defined as the left side of the blade, and the lower part is defined as the right side of the blade.
Symmetry 11 01255 g002
Figure 3. Comparisons of leaf functional traits among the 12 Rosaceae species including (A) leaf area, (B) leaf dry weight, and (C) leaf dry mass per unit area (LMA). In each panel, the same letters represent non-significant difference, whereas different letters represents significant difference.
Symmetry 11 01255 g003
Figure 4. Fitted allometric relationship between leaf dry weight and area for the 12 Rosaceae species. Panels A to L represent the studied 12 Rosaceae species. For each panel, y represents ln(leaf dry weight), x represents ln(leaf area), 95% CI represents the 95% confidence interval of the slope, R2 is the coefficient of determination that is used to measure the goodness of fit of a linear fit. The open circles represent the observations, and the red straight line is the regression line.
Symmetry 11 01255 g004
Figure 5. Comparisons of three leaf measures among the 12 Rosaceae species including (A) leaf width, (B) leaf length, and (C) ratio of leaf width to length. In each panel, the same letters represent non-significant difference, whereas different letters represents significant difference.
Symmetry 11 01255 g005
Figure 6. Comparison of areal ratio of the left to the right side for the 12 Rosaceae species. In the panel, the same letters represent non-significant difference.
Symmetry 11 01255 g006
Figure 7. Fitted scaling relationship between the ratios of leaf perimeter to area (RPA) and leaf area for the 12 Rosaceae species. Panels A to L represent the studied 12 Rosaceae species. For each panel, y represents ln(ratio of leaf perimeter to leaf area), x represents ln(leaf area), 95% CI represents the 95% confidence interval of the slope, R2 is the coefficient of determination that is used to measure the goodness of fit of a linear fit. The open circles represent the observations, and the red straight line is the regression line.
Symmetry 11 01255 g007
Table 1. Leaf collection information (including the Latin names, sampling times, sampling locations, and numbers of leaves sampled of 12 Rosaceae species). All leaves were collected on the Nanjing Forestry University campus.
Species CodeLatin NameSampling TimeSampling LocationSample Size
1Prunus persica Stokes22 April, 2018(32°04′44″N, 118°48′25″ E)308
2Prunus lannesiana E.H. Wilson30 April, 2018(32°04′50″ N, 118°48′39″ E)326
3Prunus yedoensis Matsum.26 April, 2018(32°04′49″ N, 118°48′29″ E)320
4Pseudocydonia sinensis C.K. Schneid.11 May, 2018(32°04′46″ N, 118°48′25″ E)316
5Potentilla indica (Andrews) T. Wolf9 May, 2018(32°05′03″ N, 118°48′45″ E)324
6Kerria japonica (L.) DC.29 April, 2018(32°04′46″ N, 118°48′33″ E)323
7Malus halliana Koehne26 April, 2018(32°05′03″ N, 118°48′47″ E)326
8Photinia serratifolia (Desf.) Kalkman2 May, 2018(32°04′49″ N, 118°48′40″ E)320
9Prunus cerasifera Ehrhar f. atropurpurea (Jacq.) Rehd.28 April, 2018(32°04′44″ N, 118°48′26″ E)323
10Pyrus calleryana Decne.3 July, 2018(32°04′44″ N, 118°48′26″ E)320
11Rosa multiflora Thunb.27 April, 2018(32°04′50″ N, 118°48′50″ E)327
12Rubus hirsutus Thunb.4 May, 2018(32°05′03″ N, 118°48′45″ E)324
Table 2. Estimates and standard deviations (SD) of proportionality, as well as the goodness-of-fit (R2), for the proportional (i.e., isometric) relationship between leaf length and width for 12 Rosaceae species.
Data SetEstimateSDR2
10.40120.00220.9907
20.55480.00330.9884
30.59950.00430.9836
40.65050.00530.9796
50.63320.00320.9920
60.52610.00390.9825
70.46380.00280.9885
80.38000.00220.9897
90.57240.00300.9912
100.66230.00440.9861
110.69400.00420.9884
120.51650.00290.9898
Table 3. Correlation coefficient (r) between the left to right side leaf surface area ratio (AR), leaf surface area of 12 Rosaceae species, and the coefficients of variation (CV) in leaf area for these species (%). Notes: P > 0.05 indicates that the correlation coefficient between AR and leaf surface area is not significantly different from 0; P < 0.05 indicates that the correlation coefficient between the two variables is significantly different from 0.
Data SetrPCV in Leaf Area (%)
1−0.0166 0.7718 36.13
2−0.0344 0.5365 30.54
30.0765 0.1722 34.68
40.1171 0.0376 44.93
50.0495 0.3742 30.35
60.0786 0.1586 26.51
7−0.0617 0.2662 30.69
80.0702 0.2102 32.73
9−0.0133 0.8116 29.14
100.0404 0.4718 50.51
110.0508 0.3601 28.45
120.0254 0.6480 29.62