Article

A Framework for Automatic Building Detection from Low-Contrast Satellite Images

1
College of Computer Science, Sichuan University, Chengdu 610065, China
2
School of Software Technology, Dalian University of Technology (DUT), Dalian 116621, China
*
Author to whom correspondence should be addressed.
Symmetry 2019, 11(1), 3; https://doi.org/10.3390/sym11010003
Submission received: 26 September 2018 / Revised: 25 November 2018 / Accepted: 18 December 2018 / Published: 21 December 2018

Abstract

:
Building detection in satellite images has been considered an essential field of research in remote sensing and computer vision. There are currently numerous techniques and algorithms used to achieve building detection performance. Different algorithms have been proposed to extract building objects from high-resolution satellite images with standard contrast. However, building detection from low-contrast satellite images to predict symmetrical findings as of past studies using normal contrast images is considered a challenging task and may play an integral role in a wide range of applications. Having received significant attention in recent years, this manuscript proposes a methodology to detect buildings from low-contrast satellite images. In an effort to enhance visualization of satellite images, in this study, first, the contrast of an image is optimized to represent all the information using singular value decomposition (SVD) based on the discrete wavelet transform (DWT). Second, a line-segment detection scheme is applied to accurately detect building line segments. Third, the detected line segments are hierarchically grouped to recognize the relationship of identified line segments, and the complete contours of the building are attained to obtain candidate rectangular buildings. In this paper, the results from the method above are compared with existing approaches based on high-resolution images with reasonable contrast. The proposed method achieves high performance thus yields more diversified and insightful results over conventional techniques.

1. Introduction

The current era of technological competition among humans and organizations is marked by the desire to get a lead in capturing the most up-to-date knowledge. For decades now, organizations have been on the verge of rendering non-digitized information obsolete and have shown their inclination towards adapting and working with digitized information. The modernized aspects of working with digital knowledge capturing, processing, and utilization have created fundamental ease of use for practitioners such as GIS analysts, space analysts, engineering personnel, medical specialists, and many more. Many organizations have opted to work with the micro aspects of technology, which have augmented the conciseness and efficiency of their work. Technological advancements which have led to organizational efficiency have opened new horizons for academics and practitioners to further elucidate the specificity of technological practicality in different fields. Extending the discussion of technology adoption, some authors specifically believe that new technological aspects that have played an important role in people’s lives include the processing of information they receive during every passing minute. Essentially, the daily information people receive and work with is primarily audio and image based, such as music, video, photographs, etc., and these things play an increasingly integral role in people’s lives. The human brain can sense, process, and interpret visual information efficiently. A large part of the human brain is dedicated to processing visual information. Contrary to human brains, computer systems cannot sense visual information or process this information correctly due to variations in viewpoint and perspective, illumination, scale, deformation, and high intraclass variations. In computer sciences, digital image processing is performed by computer technology for algorithmic processing, manipulation, and interpretation of visual information. With the help of this modern technology, numerous approaches to efficiently process visual information have been developed. The extant literature provides insights into image processing that have been widely adopted by a variety of fields, such as medical image processing [1], remote sensing [2], video processing [3,4], object detection [5,6], image cropping and classification [7,8], and others.
While we discuss the importance of image processing and its properties, one cannot ignore remote sensing. Remote sensing is the scientific discipline of gathering factual knowledge about an object, such as its size, shape, and characteristics, without physically being present at the place of the object; usually, this is done from an aircraft, drone, or satellites. Capturing the earth’s features with these methods, high above the earth’s surface, has solved numerous problems related to collecting information from the human eye’s perspective. Currently, remote sensing has a wide range of applications and is used in numerous fields including agriculture [9], forestry [10], meteorology [11], military surveillance [12,13], biodiversity [14], aerial photography [15], mapping technologies [16], etc. In recent years, remote sensing has been introduced into object detection through satellite imagery, most notably for detecting buildings, as buildings are fundamental in city development and thus significant in regards to urban mapping. The information gathered from building detection in satellite imagery can be used for many applications, including urban management and population estimation, and has therefore been the aspiration of rigorous research for numerous years. The difficulty in detecting buildings in satellite imagery is very complicated and multilayered. Over the years, many techniques have been proposed for efficient building detection in very-high-resolution satellite images with reasonable contrast.
The extant literature presents its insights into the perspective of satellite imagery. Dahiya et al. [17] segmented high-resolution satellite images with reasonable contrast using the split and merge technique of segmentation. Later in their study, multiple filters were applied on segmented images to extract important features which were then converted to a vector image. Finally, the area from the vector image was used to extract the buildings. Liu et al. [18] used the discriminative feature-based approach, which characterizes buildings efficiently. In this proposed technique, the image is first segmented into different regions, and then all the extracted contours are taken as candidates. Moreover, the probability model was used in the Liu et al. study to select the “true” buildings. Furthermore, Cui et al. [19] presented a region-based technique to detect buildings. In this study, the proposed method used was semiautomatic and used a high-resolution remote sensing image repository to identify buildings. Firstly, the method combines the Hough transform with the building areas containing the computation of convex hull of pixels. This combination yields a specific outcome as soon as the contrast between the rooftop of the flat buildings and their backgrounds are high enough. Secondly, the shape of the building is computed, and then the node matrix is constructed by the dominant line sets of the building. Additionally, San et al. [20] also developed an approach based on the Hough transform. The proposed technique was used to extract circular- and rectangular-shaped buildings from very-high-resolution standard contrast satellite images. Zhang et al. [21] developed a model for detecting buildings in high-resolution remotely sensed imaginary with usual contrast on a global scale. The proposed method created population density maps for building extraction. Theng et al. [22] proposed a model to compute the contours of buildings. The proposed method initializes the model with a circular casting algorithm instead of radial casting and is considered an improvement of the snake model.
The findings of the past literature report that most building extraction methods use high-resolution images with a typical contrast. However, deep learning, which is a revolutionary technology and has been introduced to several problems in remote sensing, has an outstanding capacity to recognize buildings from satellite images. Xu et al. [23] proposed a scheme with guided filters for efficient building detection from satellite images with standard contrast and very-high resolution using deep learning. Similarly, Peng et al. [24] proposed a two-stage model for the extraction of buildings in monocular urban aerial images. Their model works without prior knowledge of illumination. Furthermore, the buildings are extracted using the context and the partially modified snake model. Peng et al. [25] introduced a method for building detection from high-resolution, gray-level aerial images. Based on these research patterns, to the best of the authors’ knowledge, the problem of building extraction from low-contrast, high-resolution images is still in its infancy in the experimental findings and needs to be addressed appropriately. Therefore, to meet this goal in this research effort, the authors have introduced a technique named “automatic building detection with low-contrast satellite images”, which detects buildings in low-contrast remote sensing imaginary. The proposed image sensing technique used in this study is an improvement over the traditional approaches. Moreover, the proposed technique robustly minimizes the cost of iterations to detect buildings more quickly, which distinguishes this study from past research paradigms.
The main contributions of this paper are:
  • Contrast enrichment of (low-contrast) satellite images using the discrete wavelet transform (DWT) based on singular value decomposition (SVD);
  • Building detection from contrast-enriched images;
  • Comparison of the developed technique with traditional approaches to building detection.
This paper is organized as follows: Section 2 discusses the theoretical background. Section 3 contains the proposed framework for building detection from low-contrast images. Section 4 analyzes and compares the existing proposed schemes. Section 5 offers discussion. Section 6 presents conclusions. Lastly, Section 7 poses implications and addresses future research gaps.

2. Theoretical Background

In recent years, a great deal of effort has been invested into the development of approaches to detect diverse kinds of objects through satellite and aerial images. These objects can include trees, roads, vehicles, buildings, ships, airports, urban areas, etc. The extraction of buildings is amongst the most exciting tasks in the field of remote sensing. The detection of buildings through satellite imagery has various significant applications in a wide variety of disciplines. The most noticeable are urban planning and mapping, detection analysis of urban change, efficient detection of targets, and geographic information systems. Prior researchers have put much effort into delivering valuable understandings of the various methods that can be adopted for image-based building extraction. However, the majority of the algorithms used for such extractions are high-resolution satellite images with reasonable contrast for efficiently detecting buildings. In this paper, one of the main objectives is to obtain the recognition of buildings from low-contrast remote sensing imaginary. Furthermore, earlier works and efforts that have been made to adequately detect and extract buildings are briefly examined as follows.
Salman et al. [26] presented a contour-based model for building detection. The proposed model requires fewer efforts to initialize that are not sensitive to noise and can deal with complex images. However, the developed technique is inadequate for some images due the radiometric likeness between the roofs of the buildings and the background of the image. Akçay et al. [27] proposed a self-regulating mechanism for building detection. The algorithm used in this study can detect buildings with complex roof structures and shapes in remotely sensed images. Similarly, Aytekın et al. [28] developed a technique for the automatic detection of roads and buildings. The proposed method first merges two different images, the high-resolution panchromatic (PAN) and the low-resolution multispectral, to give a pan-sharpened, high-resolution colorful image. Also in that study, the ratio of chromaticity to intensity in the color space “YIQ” was calculated and the irrelevant building segments regarding shape were found by applying mean shift segmentation to the partition of human-made areas. Lastly, the building was detected by the elimination of the artifacts. Benedek et al. [29] offered a scheme based on a probabilistic system which detects the buildings in remotely sensed images. The proposed approach used in their study integrates change detection with building detection in remotely sensed image pairs. Moreover, the optimal configuration of buildings was obtained by the process of global optimization. The method proposed a novel, non-uniform stochastic object birth process.
Furthermore, Ref. [30] proposed a building extraction methodology based on an object-based classification scheme. The proposed technique monitors the building construction of Spot 5 images with a 2.5-m resolution. The object-based classification methodology precisely tracks the building construction. Karantzalos et al. [31] introduced a framework for the automatic detection of multiple buildings in remotely sensed images. The proposed method extracts the buildings based on image segmentation that incorporates a data-driven term constrained from previous models. Their study is an extension of previous approaches which integrates multiple shape priors into the level-set segmentation. Lefevre et al. [32] developed a method on the basis of binary mathematical morphology (MM) operators. The proposed method first automatically determines the optimal parameters by involving several advanced morphological operators. Second, to avoid the empirical thresholding of input images, the binarization of the image is achieved by using a clustering-based technique. Lhomme et al. [33] introduced a method for building extraction from very high spatial resolution images. The developed technique can identify the buildings semi-automatically from very high spatial resolution (VHSR) images. This method can accurately detect buildings, more specifically, individual houses. The process yields the best result on Ikonos and QuickBird images.
Besides the already presented literature findings, Noronha et al. [34] proposed a technique to construct 3D models based on a process called hypothesis generation. The model has the ability to detect buildings, but they must be a specific shape, such as a regular polygon. Izadi et al. [35] used the concept of line and line intersections based on a graph-based strategy to detect buildings. Their model estimates the presence of the building through satellite images using a three-dimensional polygon. However, the computational cost of the model is very high. Ok et al. [36] introduced a method which uses the critical evidence of buildings for their automatic detection. The proposed technique utilizes the single very-high-resolution (VHR) multispectral images. The proposed method can be applied to images with different characteristics and illumination properties, although the rate of detection in their study is quite low compared with prior approaches. Cote et al. [37] proposed an automatic approach that tackles variant reflections, arbitrary illumination, and building profiles. The model accurately detects rooftops without prior shape with an accuracy of 84%. Nonetheless, the running time is higher than the previous approaches. Mayunga et al. [38] developed a semiautomatic mapping approach based on a radial casting and snake algorithms. The model is only used for gray images and is unable to detect small buildings. Wang et al. [39] proposed a framework without user intervention. The model is based on line segments and a perceptual grouping strategy. The approach yields a reasonable detection rate. However, the method is unable to extract buildings from low-contrast images.
Moreover, in the field of aerial and satellite image analysis, the extraction and recognition of buildings is a challenging problem. In recent years, the researchers Ok et al. [40], Senaras et al. [41], Shufelt et al. [42], Sirmacek et al. [43,44], Stankov et al. [45], and Wenger et al. [46] have put a great deal of effort into making the onerous task of building detection simpler, and their models show good detection performance. The proposed methods in these studies can be applied to a variety of image information, and the results achieved from these studies are more robust and reliable. Furthermore, these methods have increased the accuracy of the results.
Based on these findings, the authors are of the view that their experimental approach will provide more meaningful insights into cost iteration efficiency and the extraction of satellite images through low-contrast satellite imaging. The current study is in comparison to the recent studies and distinguished in its findings.

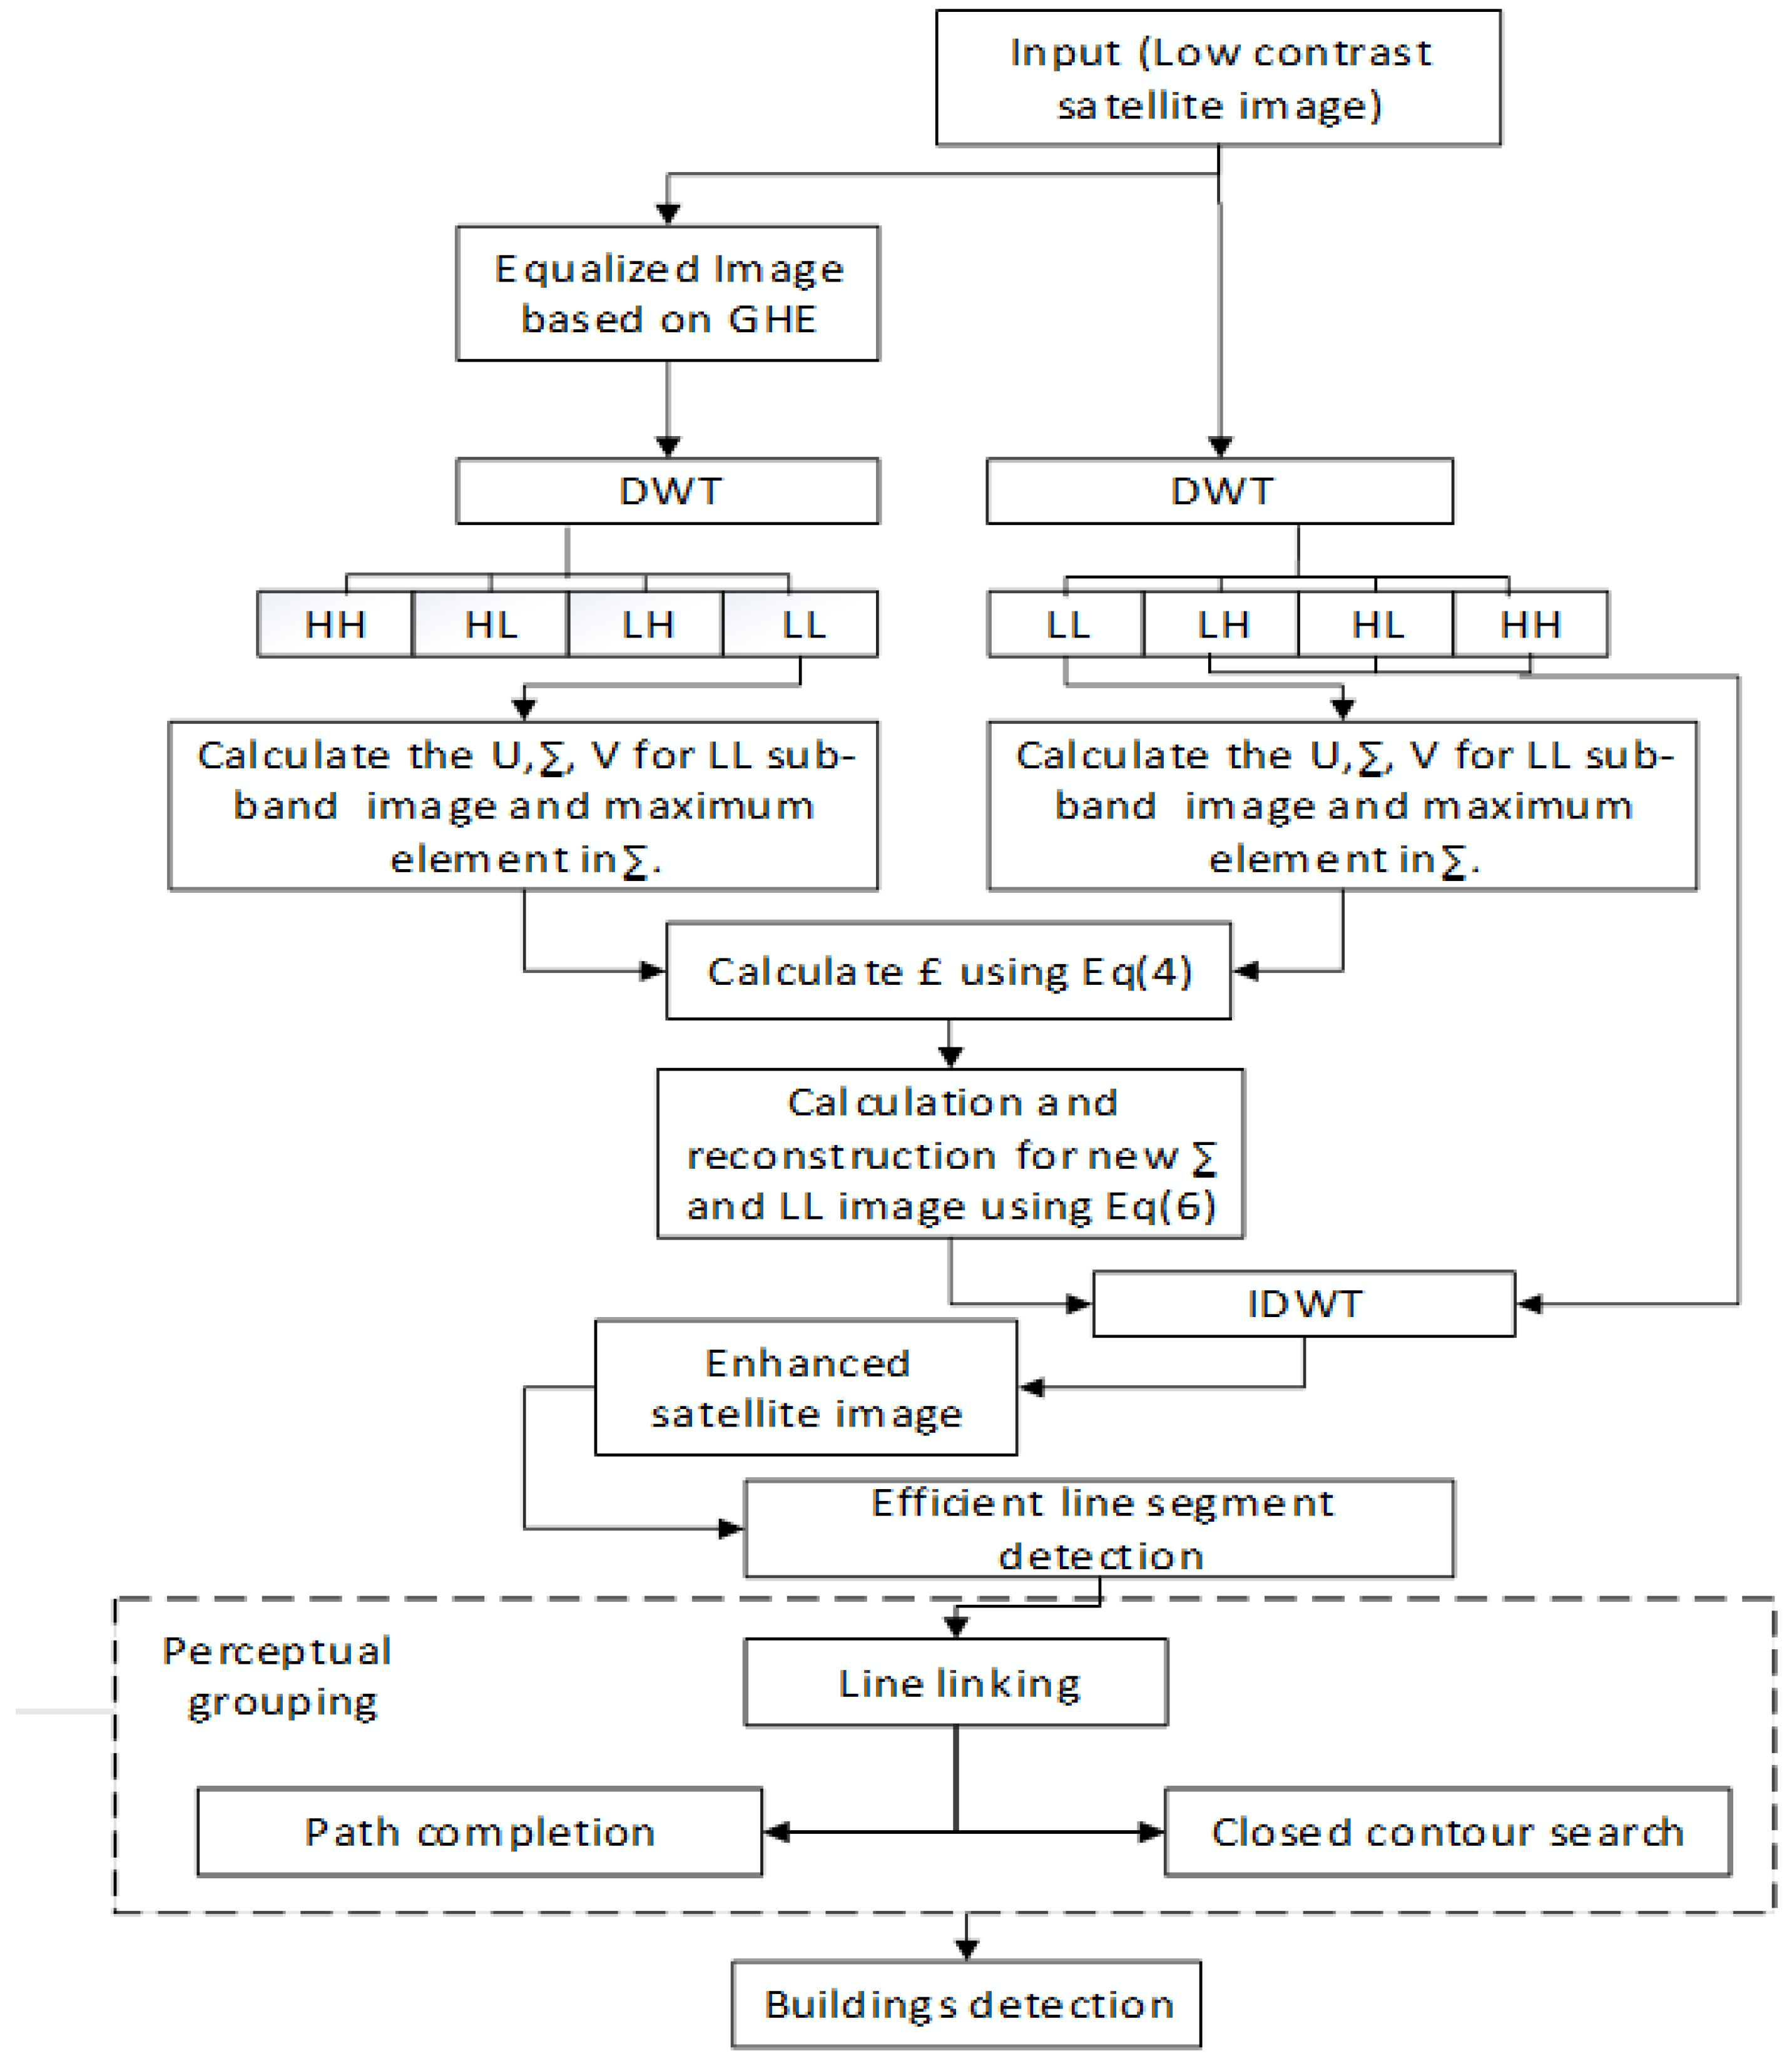
3. Proposed Methodology

In this research paper, an efficient model is proposed for building detection from low-contrast satellite imaginary. The proposed method comprises two stages, i.e., contrast enhancement and building extraction. In the first stage, the input image is taken to improve contrast by using a DWT method of Fourier transform based on SVD. Then, the perceptual grouping approach is applied on the enhanced image to detect the buildings. The flowchart of the proposed framework is shown in Figure 1.
The significant steps of the proposed algorithm are presented below.

3.1. Contrast Enhancement
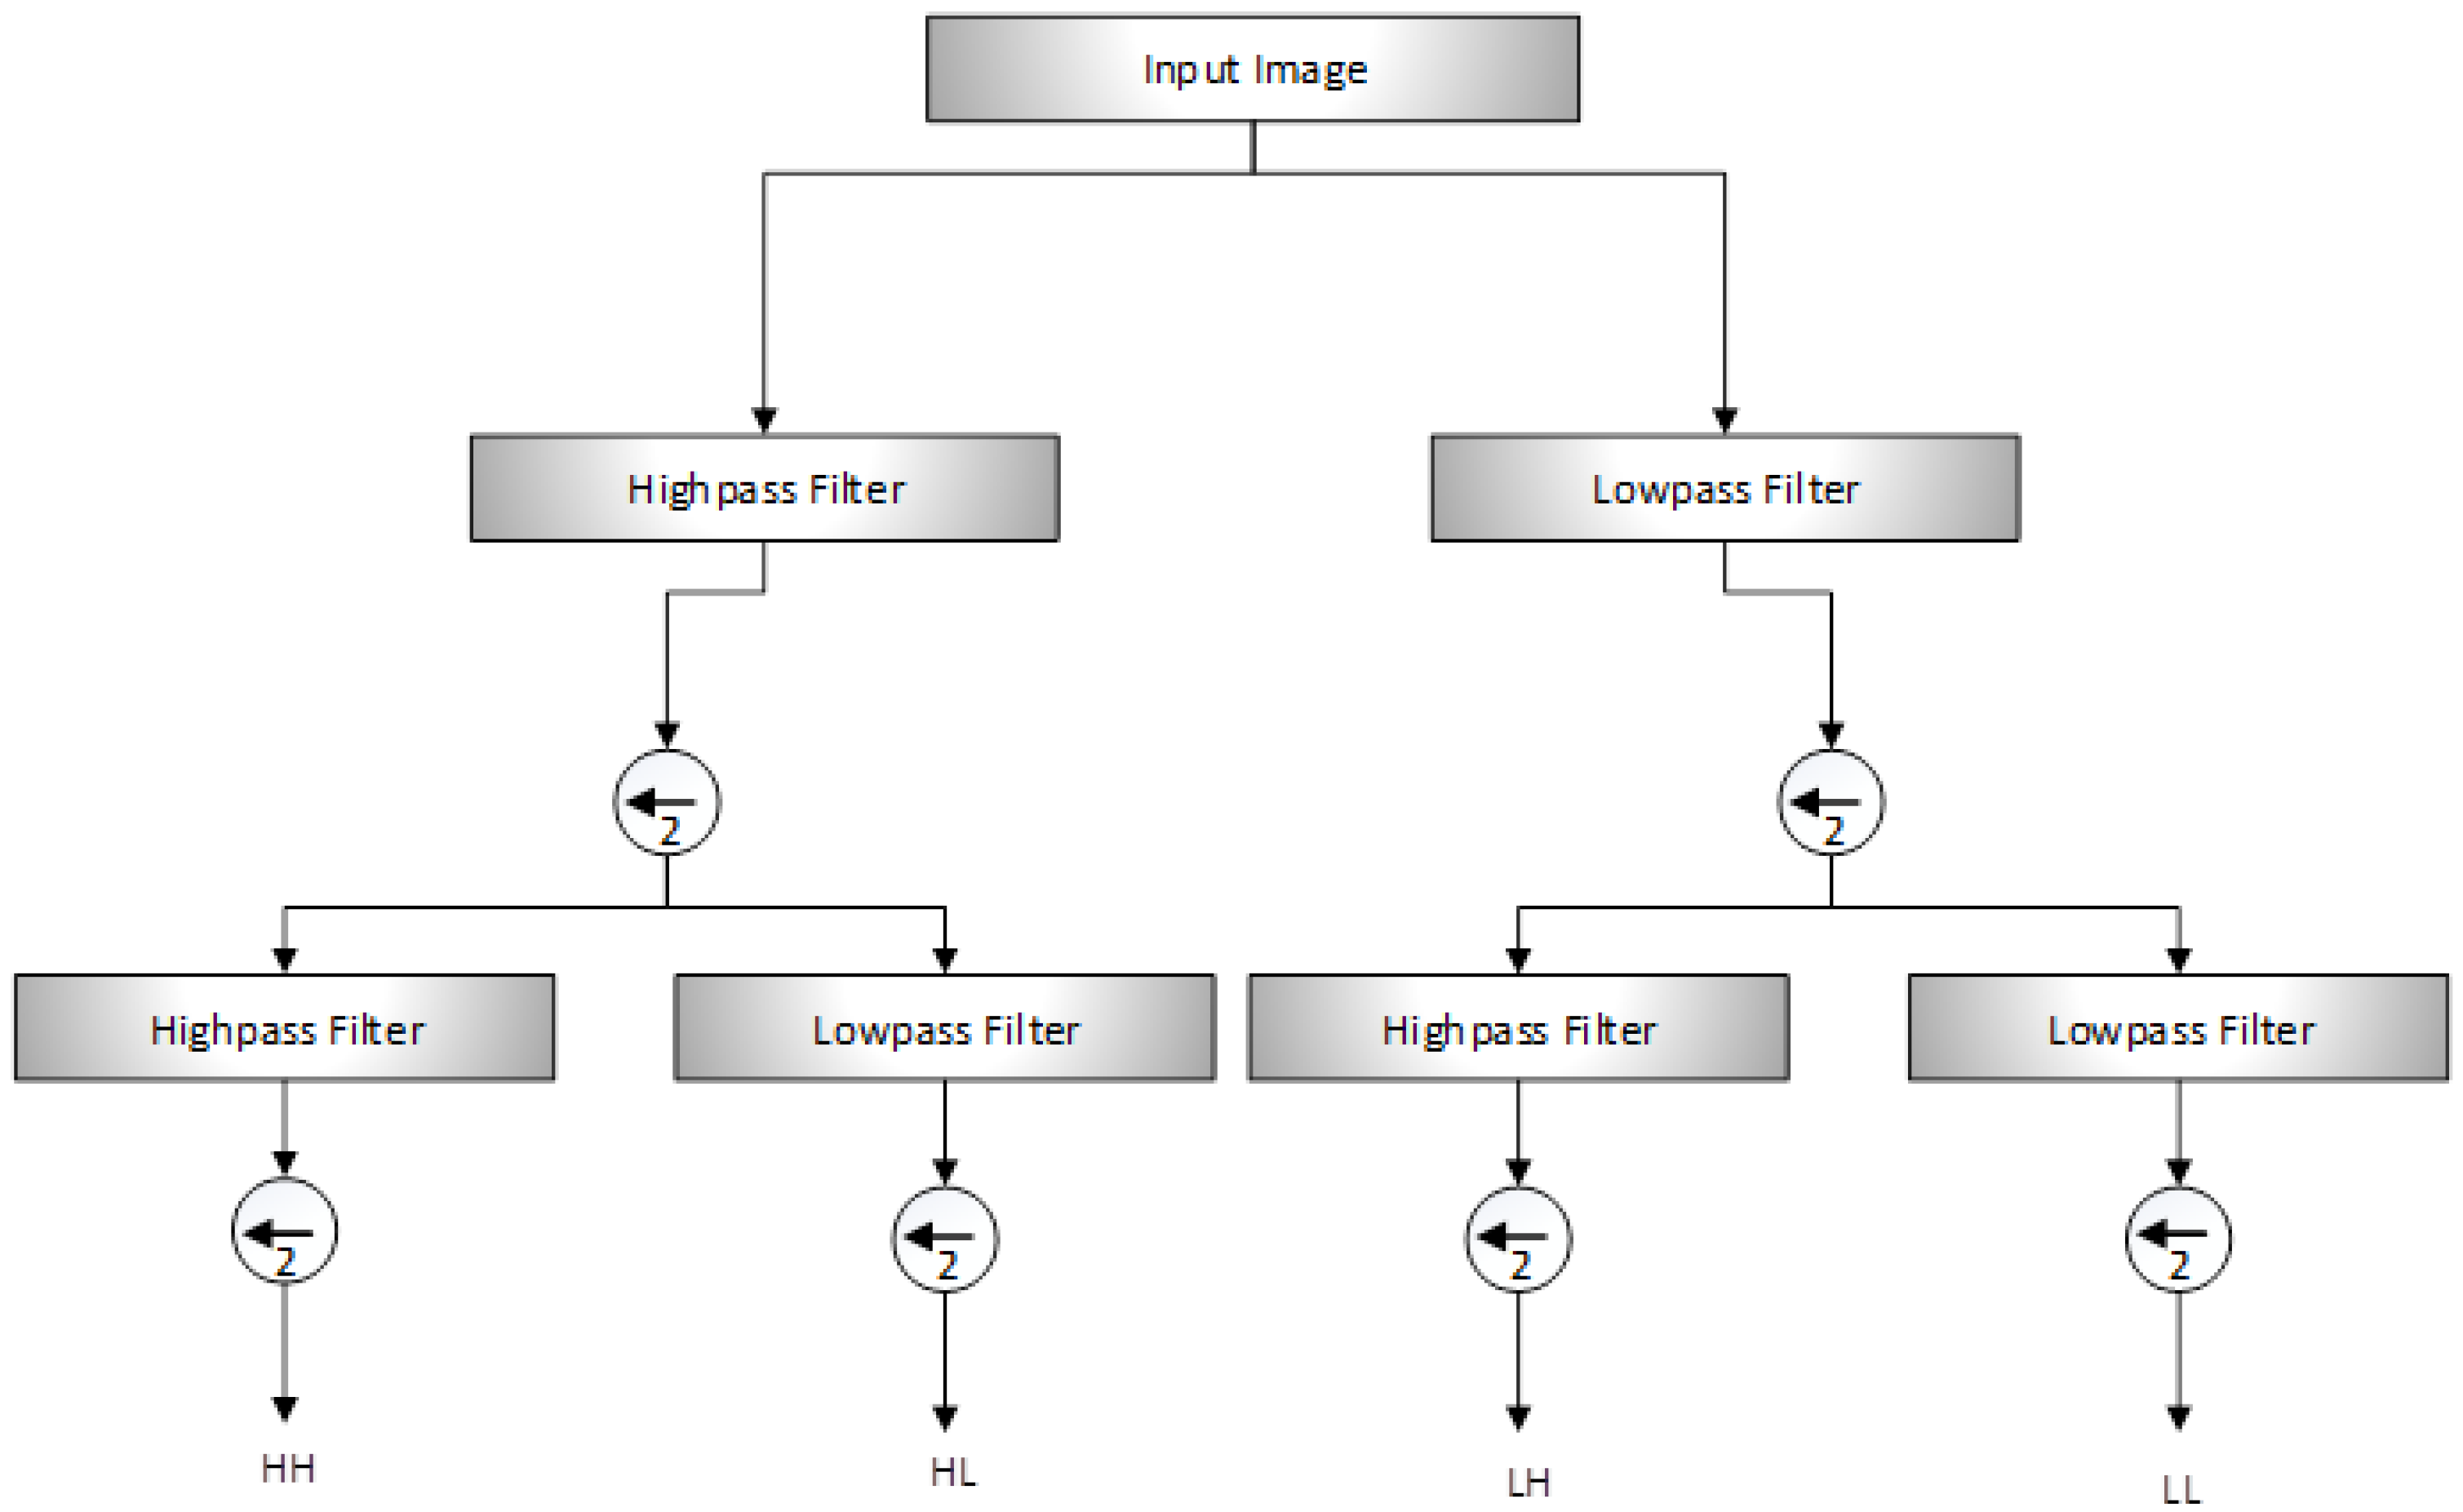
The contrast of an image degrades due to various reasons such as a low-resolution camera, aliasing due to inappropriate selection of sampling rate, poor illumination, and weather conditions. The information in low-contrast images is highly concentrated over a narrow range in some areas. Therefore, it is possible to lose a substantial amount of useful data in those areas, which are remarkably and uniformly concentrated. Contrast enhancement is necessary to provide better interpretability, analysis, representation, diagnosis, and perception of information in the images [47]. Thus, our goal is to obtain a high-contrast image that represents all the information to provide better input for building detection. Contrast enrichment is achieved based on the DWT and SVD.

DWT–SVD

The DWT and SVD have been successfully applied to many applications, including feature extraction [48,49], face recognition [50], de-noising [51], super-resolution satellite imagery [52], compression [53], image enhancement [54,55], and data reduction tasks [56]. These transforms decompose the given low-resolution image into frequency components, i.e., sub-bands and SVD are applied to improve the contrast of an image.
In this paper, first, the low-contrast input image A and its histogram-equalized image A ^ are decomposed by applying 1D DWT along the horizontal direction (rows) of the image and then the results are decomposed along the vertical direction (columns). This decomposition results in four different kinds of sub-bands, namely, low-low (LL), low-high (LH), high-low (HL), and high-high (HH) bands, as shown in Figure 2. As we discussed in the previous section, the edges are concentrated on high-frequency (HF) components such as LH, HL, and HH. Furthermore, any transformation in low-frequency components, such as the LL sub-band, will not affect the edge information in high-frequency bands since illumination information was concentrated in the LL sub-band. Second, the LL sub-band of both input image A and its histogram-equalized image A ^ are chosen for further processing to improve the contrast of an image.
At this point, the decomposed image has been converted to the SVD domain to obtain the singular value matrix (SVM) which is the product of three matrices, named an orthogonal matrix U A , the transpose of an orthogonal matrix V A , and a diagonal matrix Σ A . The SVM contains the illumination information, such as the intensity of the input image. The normalization of the SVM values is attained to change the contrast of the image. The intensity of the input image will only be affected by the modification in the singular values. The Σ A contains the intensity information of the image. It is one of the leading advantages of using SVD for image equalization [53,57]. Therefore, the SVD of an image, which can be taken as a matrix of size M × N , can be defined in Equation (1):
A = U A A V A T .
Furthermore, the method calculates the ratio of the maximum singular value of the generated normalized matrix, with zero arithmetic mean and unity variance over a normalized image. The mathematical formulation is shown in Equation (2):
ξ = max ( N ( μ = 0 , var = 1 ) ) max ( A ) ,
where N ( μ = 0 , var = 1 ) , taken as the coefficient, is the SVM of the synthetic intensity matrix and is used to regenerate an equalized image by using Equation (3):
Ξ e q A = U A ( ξ A ) V A T .
Therefore, from the definition of SVD, the SVMs of LL sub-band images of both A and A ^ are obtained. Next, the correction coefficient ς is achieved, which is the maximum element in both SVMs and take their ratio using Equation (4):
ς = max ( L L A ^ ) max ( L L A ) ,
where L L A ^ is the SVM of the LL sub-band image of the histogram-equalized image A and L L A is the SVM of the sub-band of the input image. Equations (5a) and (5b) obtain the new sub-band image:
¯ L L A = ( ξ 1 + ξ ) ( ξ L L A + 1 ξ L L A ^ ) ,
L L ¯ A = U L L A ¯ L L A V L L A .
Finally, the contrast-enhanced image A is obtained by applying inverse DWT on the estimated LL sub-band L L A along with high-frequency components L H A , H L A , and H H A sub-bands:
A ¯ = I D W T ( L L ¯ A , L H A , H L A , H H A ) .
Additionally, from the achieved results, it is quite clear that the edge components of the HF bands are not disturbed and remain undamaged. The illumination information is the only thing to be manipulated alone to enhance the contrast of an image. The image obtained from Equation (6) is the starting point for building extraction. In order to extract relevant information about an image and to detect more elaborated shapes, the line segments can be used as low-level features to obtain the geometric content of images. These line segments provide a high-level description of the objects presented in an image.
Our goal is to accurately detect line segments present in our equalized ( A ¯ ) image without false detection.

3.2. Building Extraction

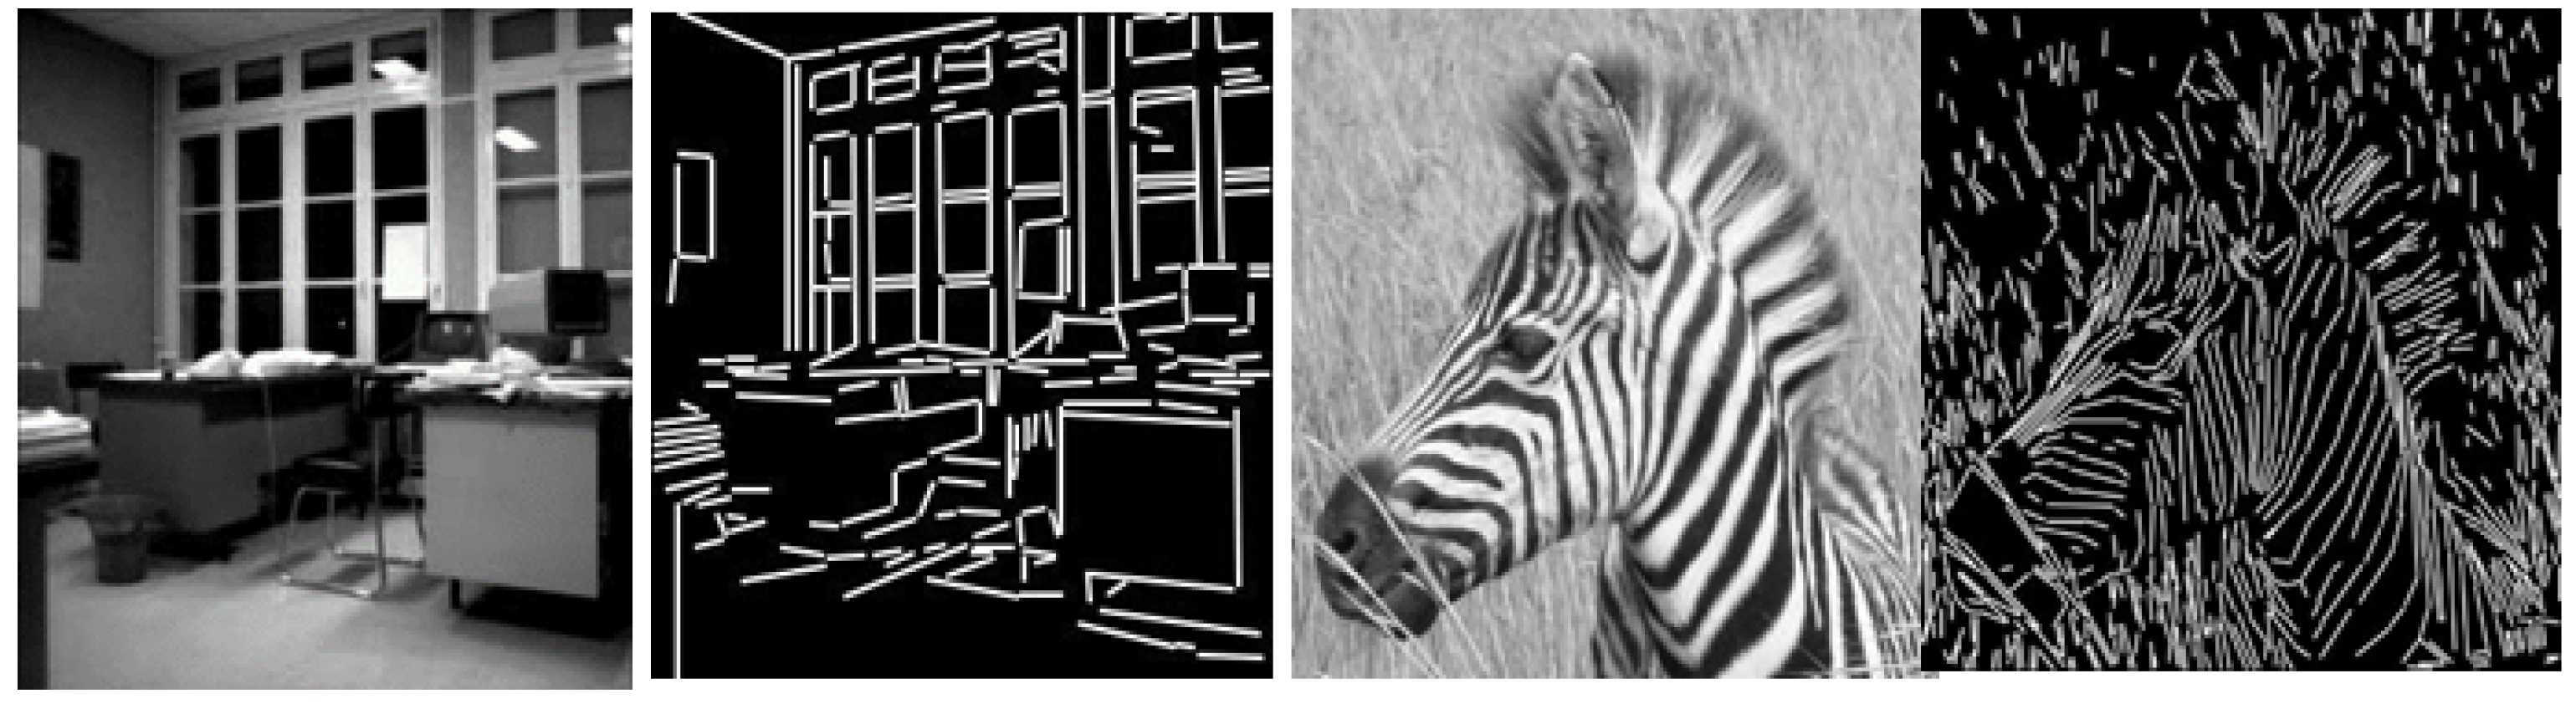
3.2.1. Efficient Line Segment Detection

The objects contained in satellite images belong to various classes, such as ships, vehicles, buildings, etc. [58]. In this paper, a line segment detector, i.e., EDLines proposed by Akinalr and Topal [59], was adopted for automatic extraction of building boundary lines, as shown in Figure 3 and Figure 4, respectively. The EDLines automatically detect line segments without requiring any parameter tuning for each image or group of images. Furthermore, it performs well and is slightly faster than other existing line detection algorithms [60]. First, the Edge Drawing (ED) algorithm [61] is used for edge detection. The ED can produce an efficient edge segment comprising a set of clean, continuous, and connected pixel chain.
Then, the obtained edge segments are comprised of a continuous chain of edge pixels. This chain of edge pixels is divided into one or more straight line segments [39]. Our goal is to obtain the initial line and determine its current direction, which is accomplished by navigating from the pixels of the edge segment to the boundary of the top-left rectangle. Starting from the first pixel of the chain and by taking a certain number of pixels, e.g., 10, a line is fit to these pixels using the least-squares line fitting method until the error exceeds a certain threshold, e.g., 1-pixel error. When the obtained error surpasses this threshold, it generates a new line segment. Then, the algorithm recursively processes the remaining pixels of the chain until all pixels are processed.
Finally, the validation of the results with the Helmholtz principle is done to determine that the obtained structure is meaningful because there is a possibility the objects can be detected as outliers of the background model. For this, a number of false alarms (NFA) of a line segment are determined. Let A be a segment having length “n” with at most “k” points. The direction of points “k” is aligned with the direction of an image A of size N × N pixels. The mathematical computation for NFA of A is defined in Equation (7):
N F A ( n , k ) = N 4 i = k n ( i n ) p i ( 1 p ) n i .
Given that, in an image, a line segment contains two endpoints and each endpoint can arise in either of the N × N pixels, there exists a total of N 2 × N 2 = N 4 line segments.
The probability “p” is the accuracy of the line direction used in the computation of the binomial tail. If N F A n , k 1 , the validation step of EDLines will accept the line segment; otherwise, the line will be rejected. The number of false detections is substantially controlled by the validation step of EDLines.

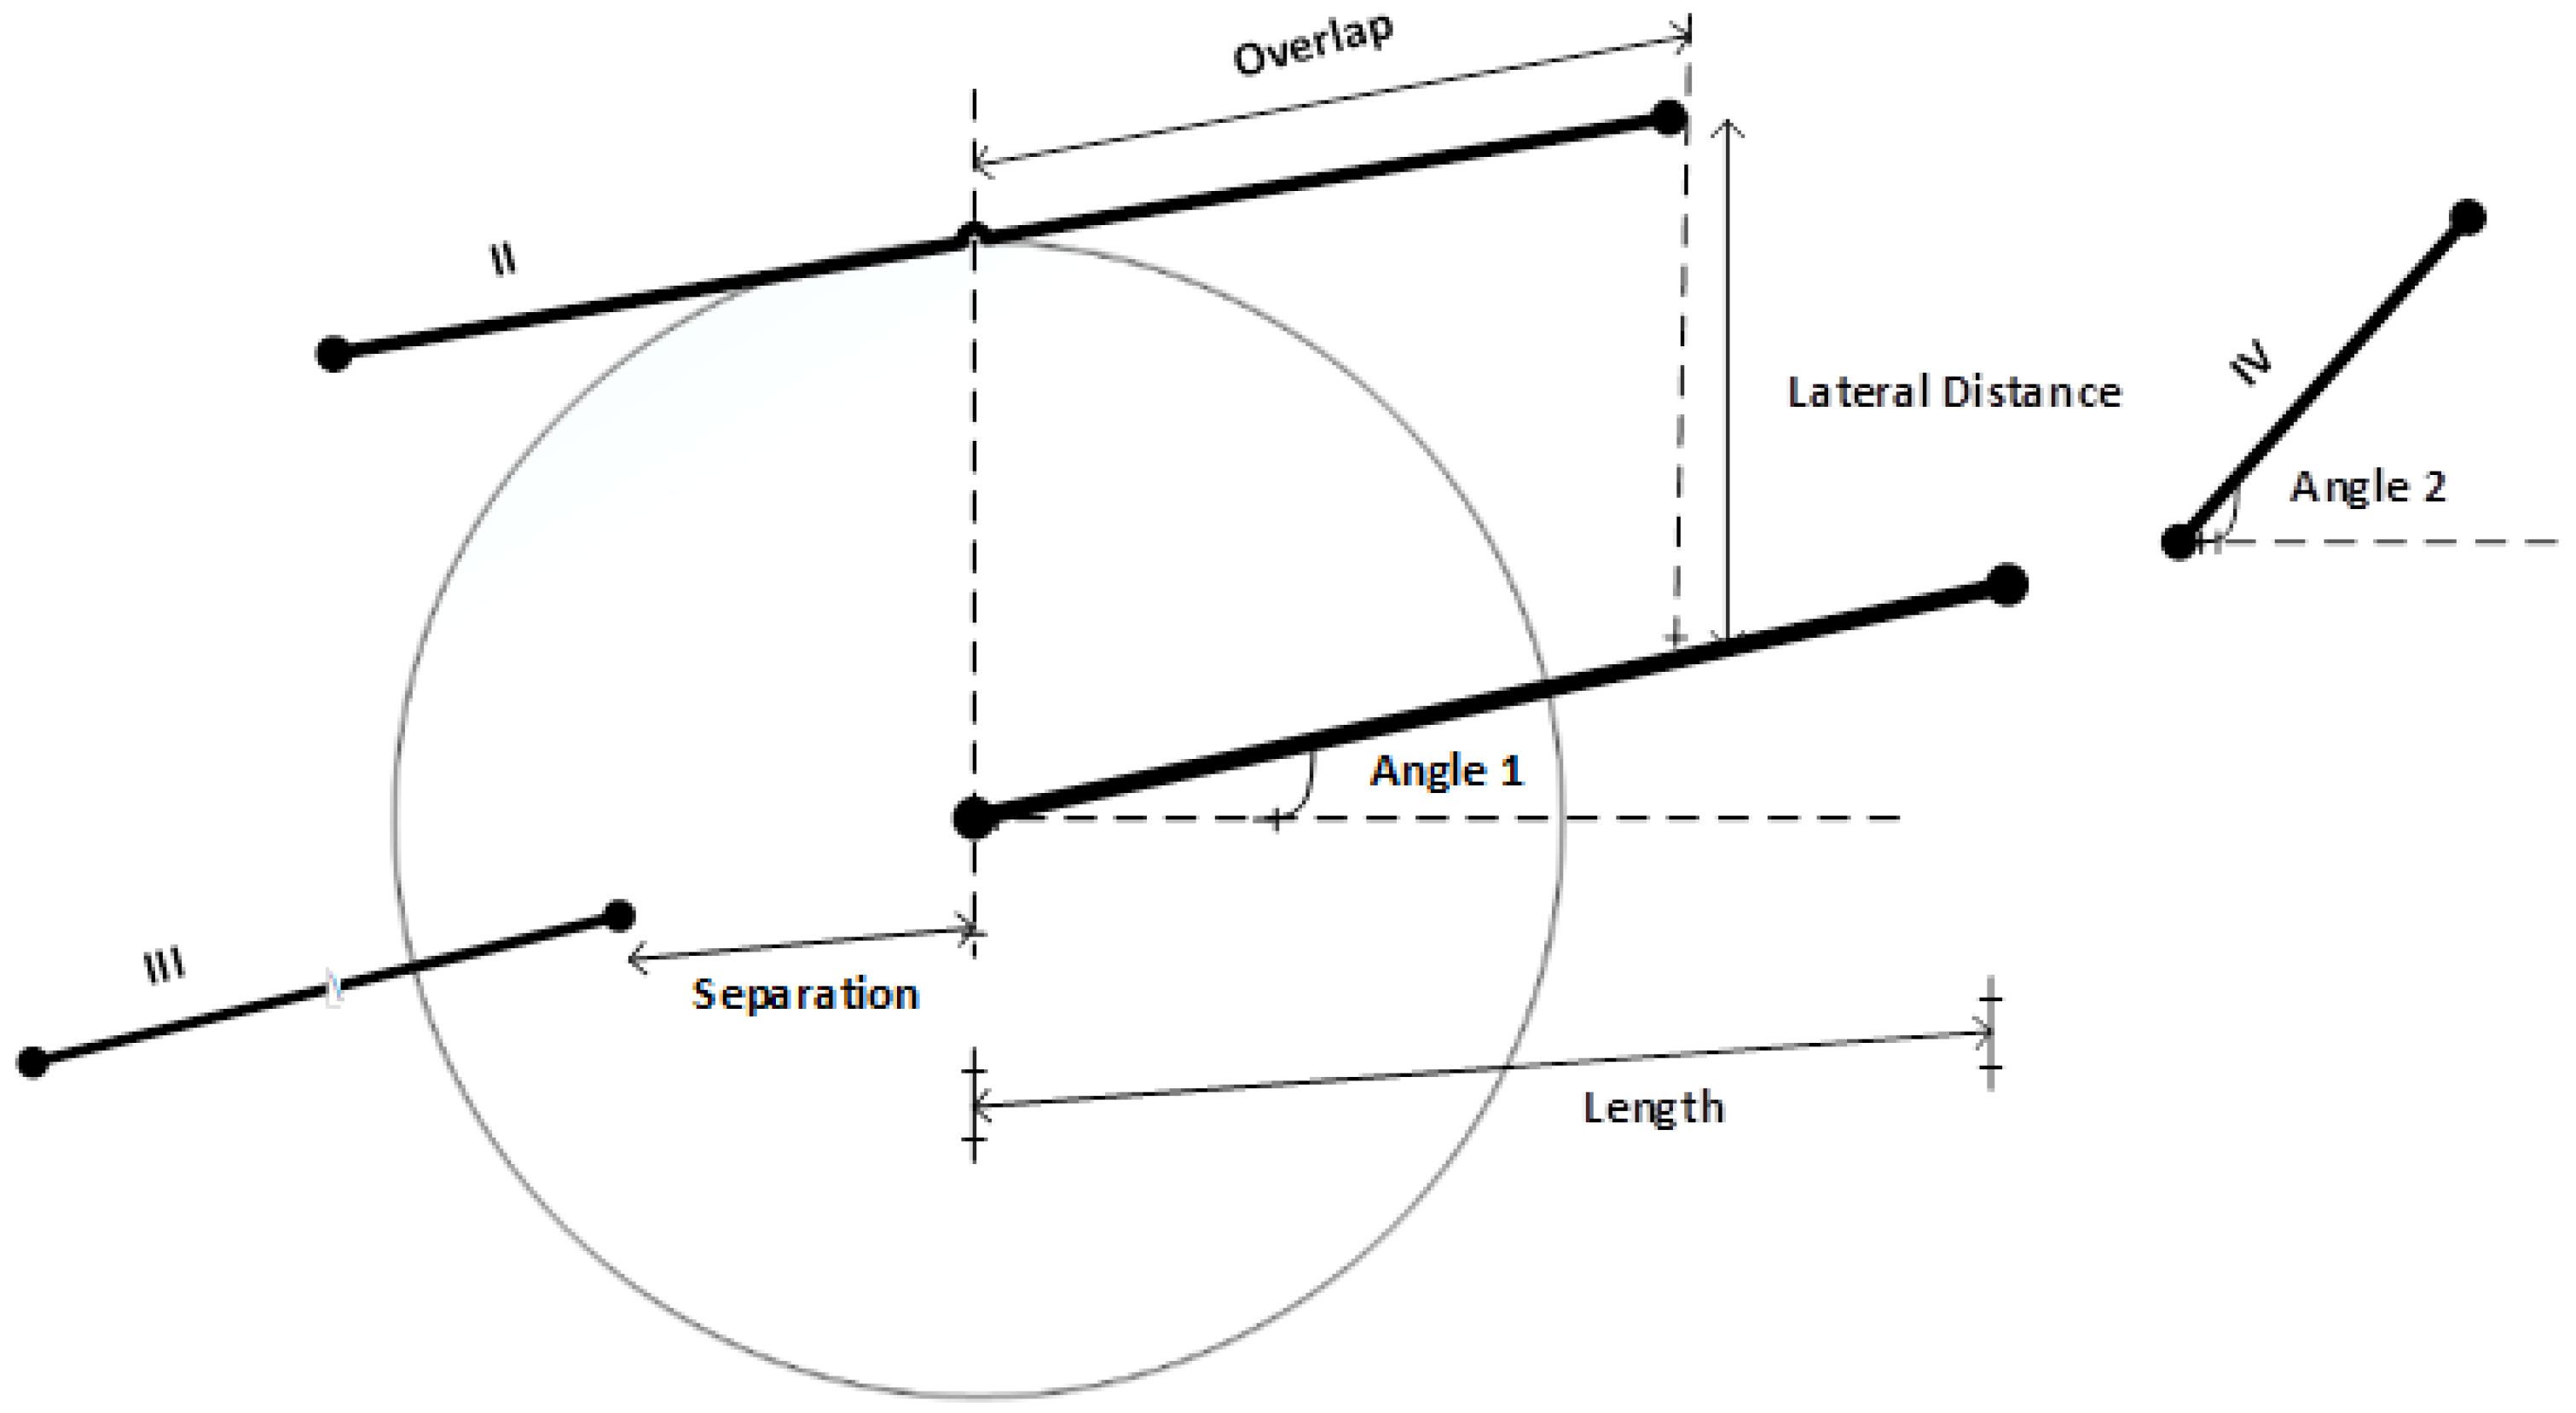
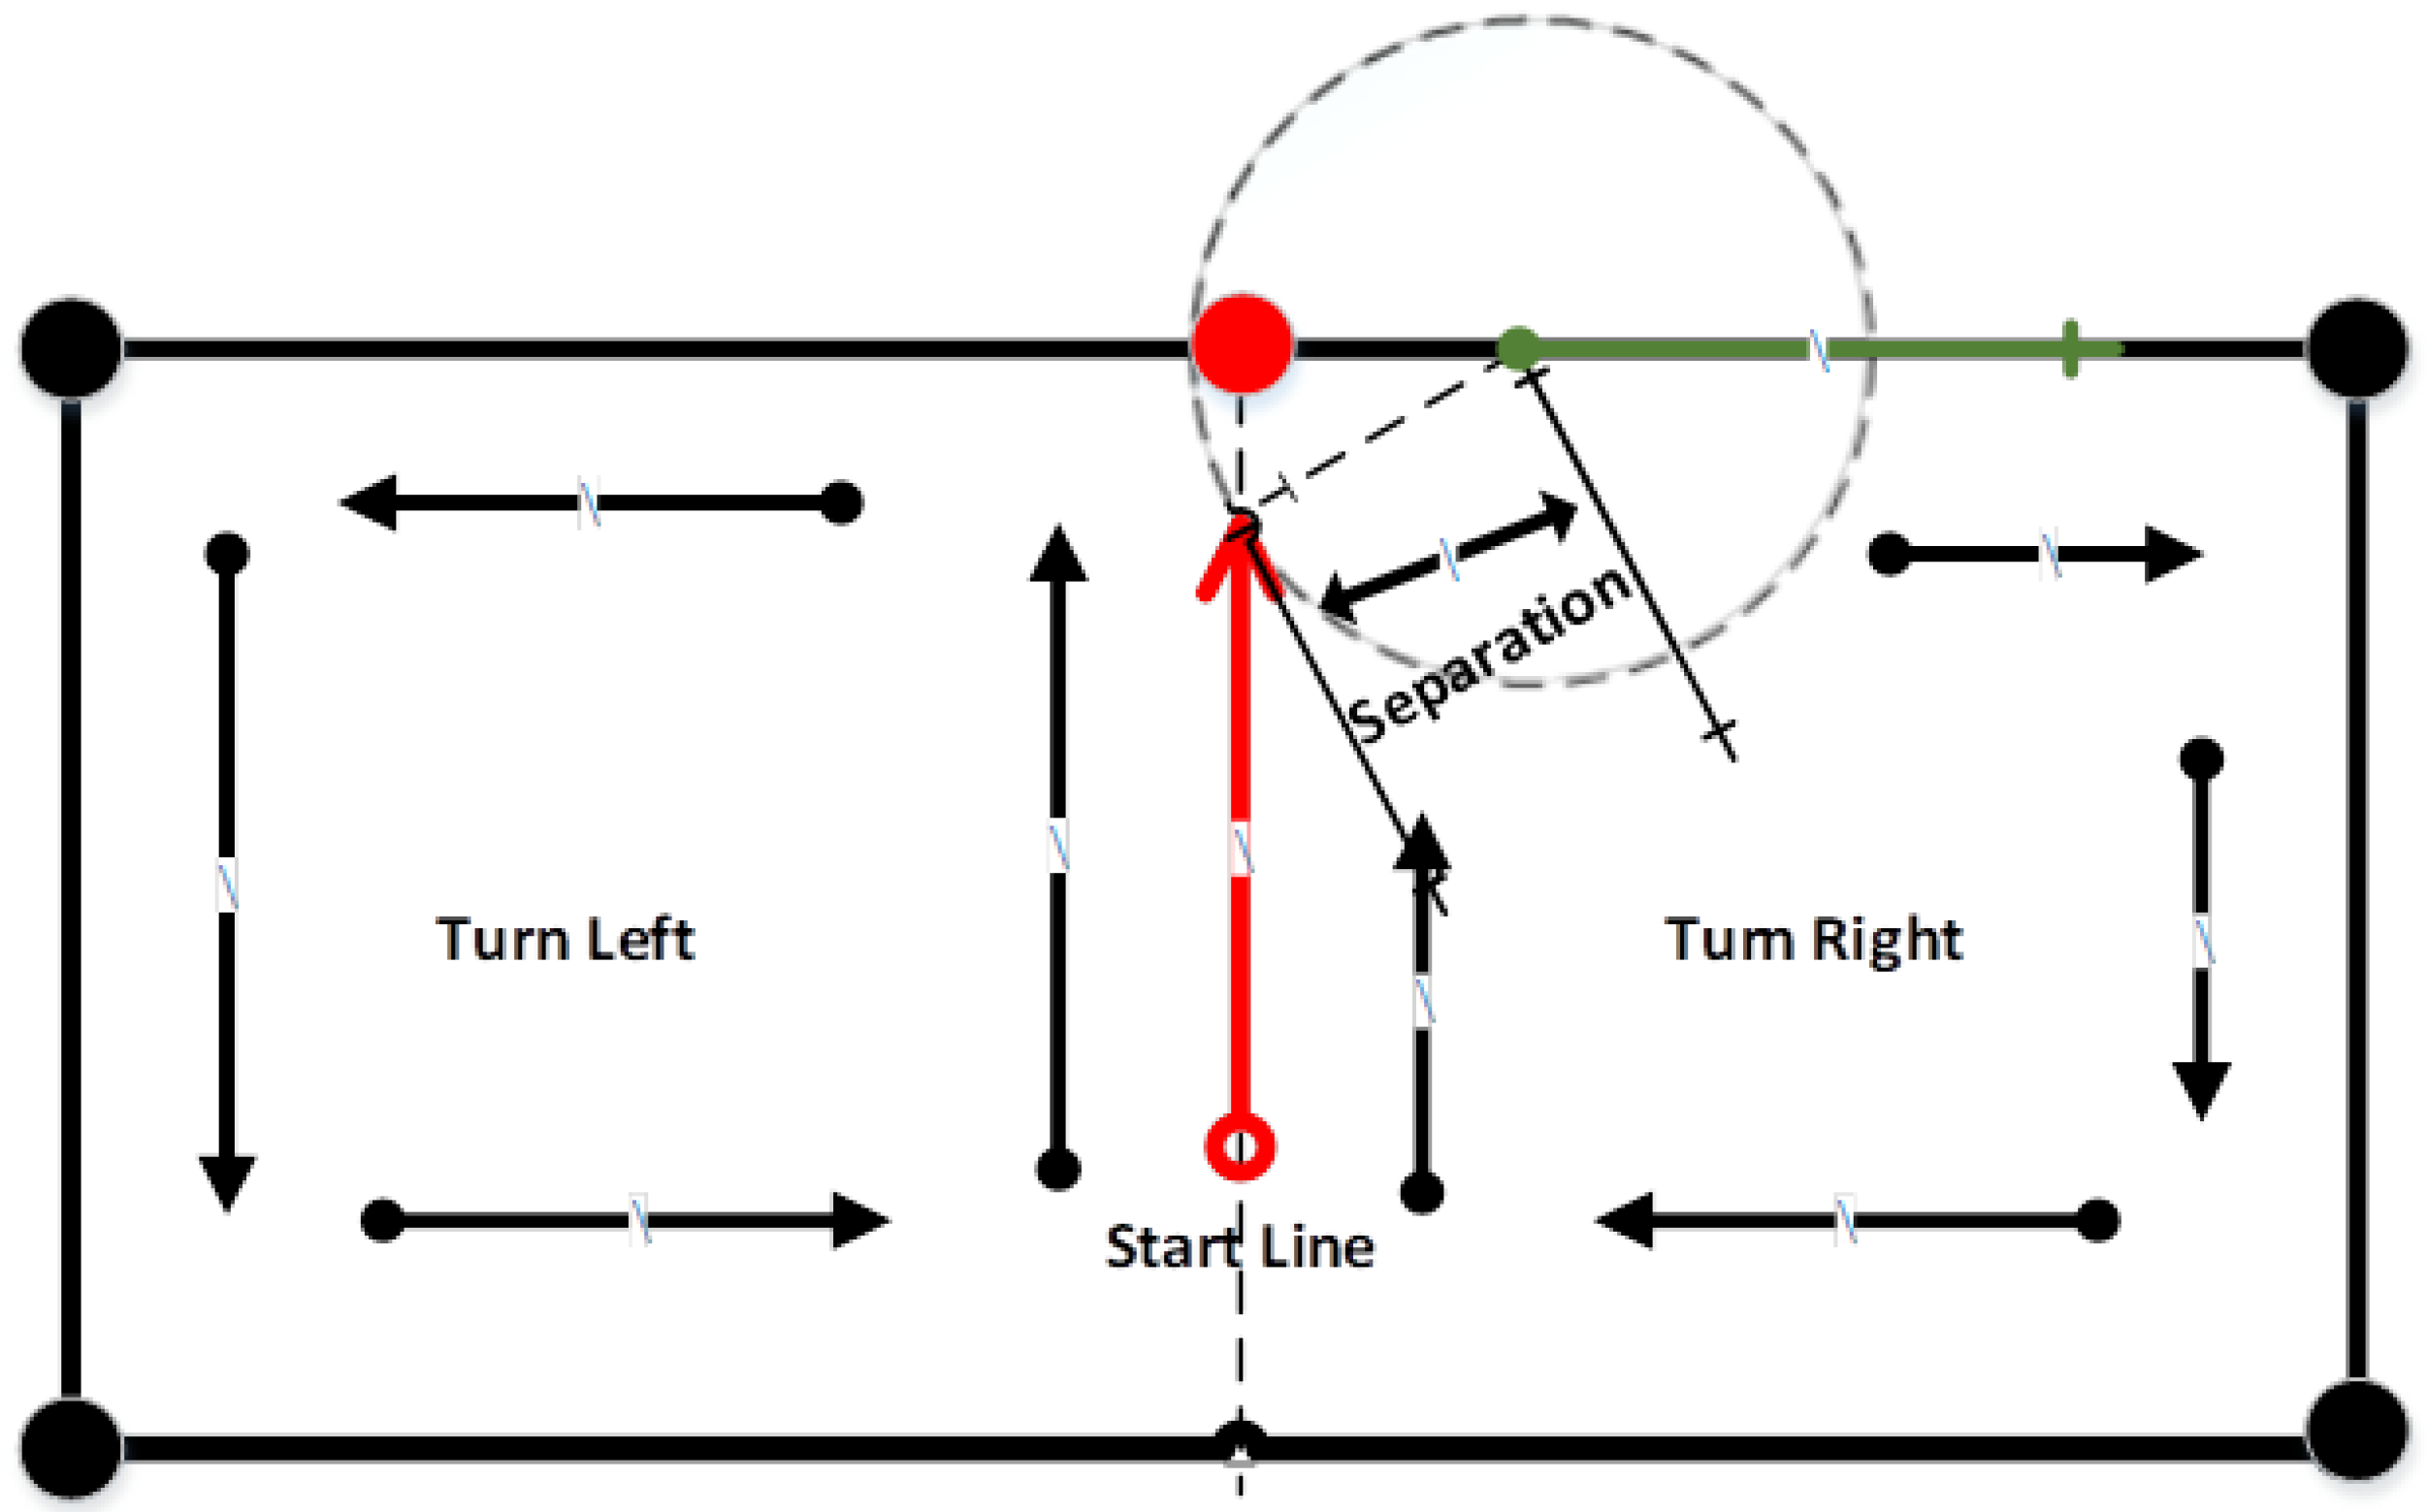
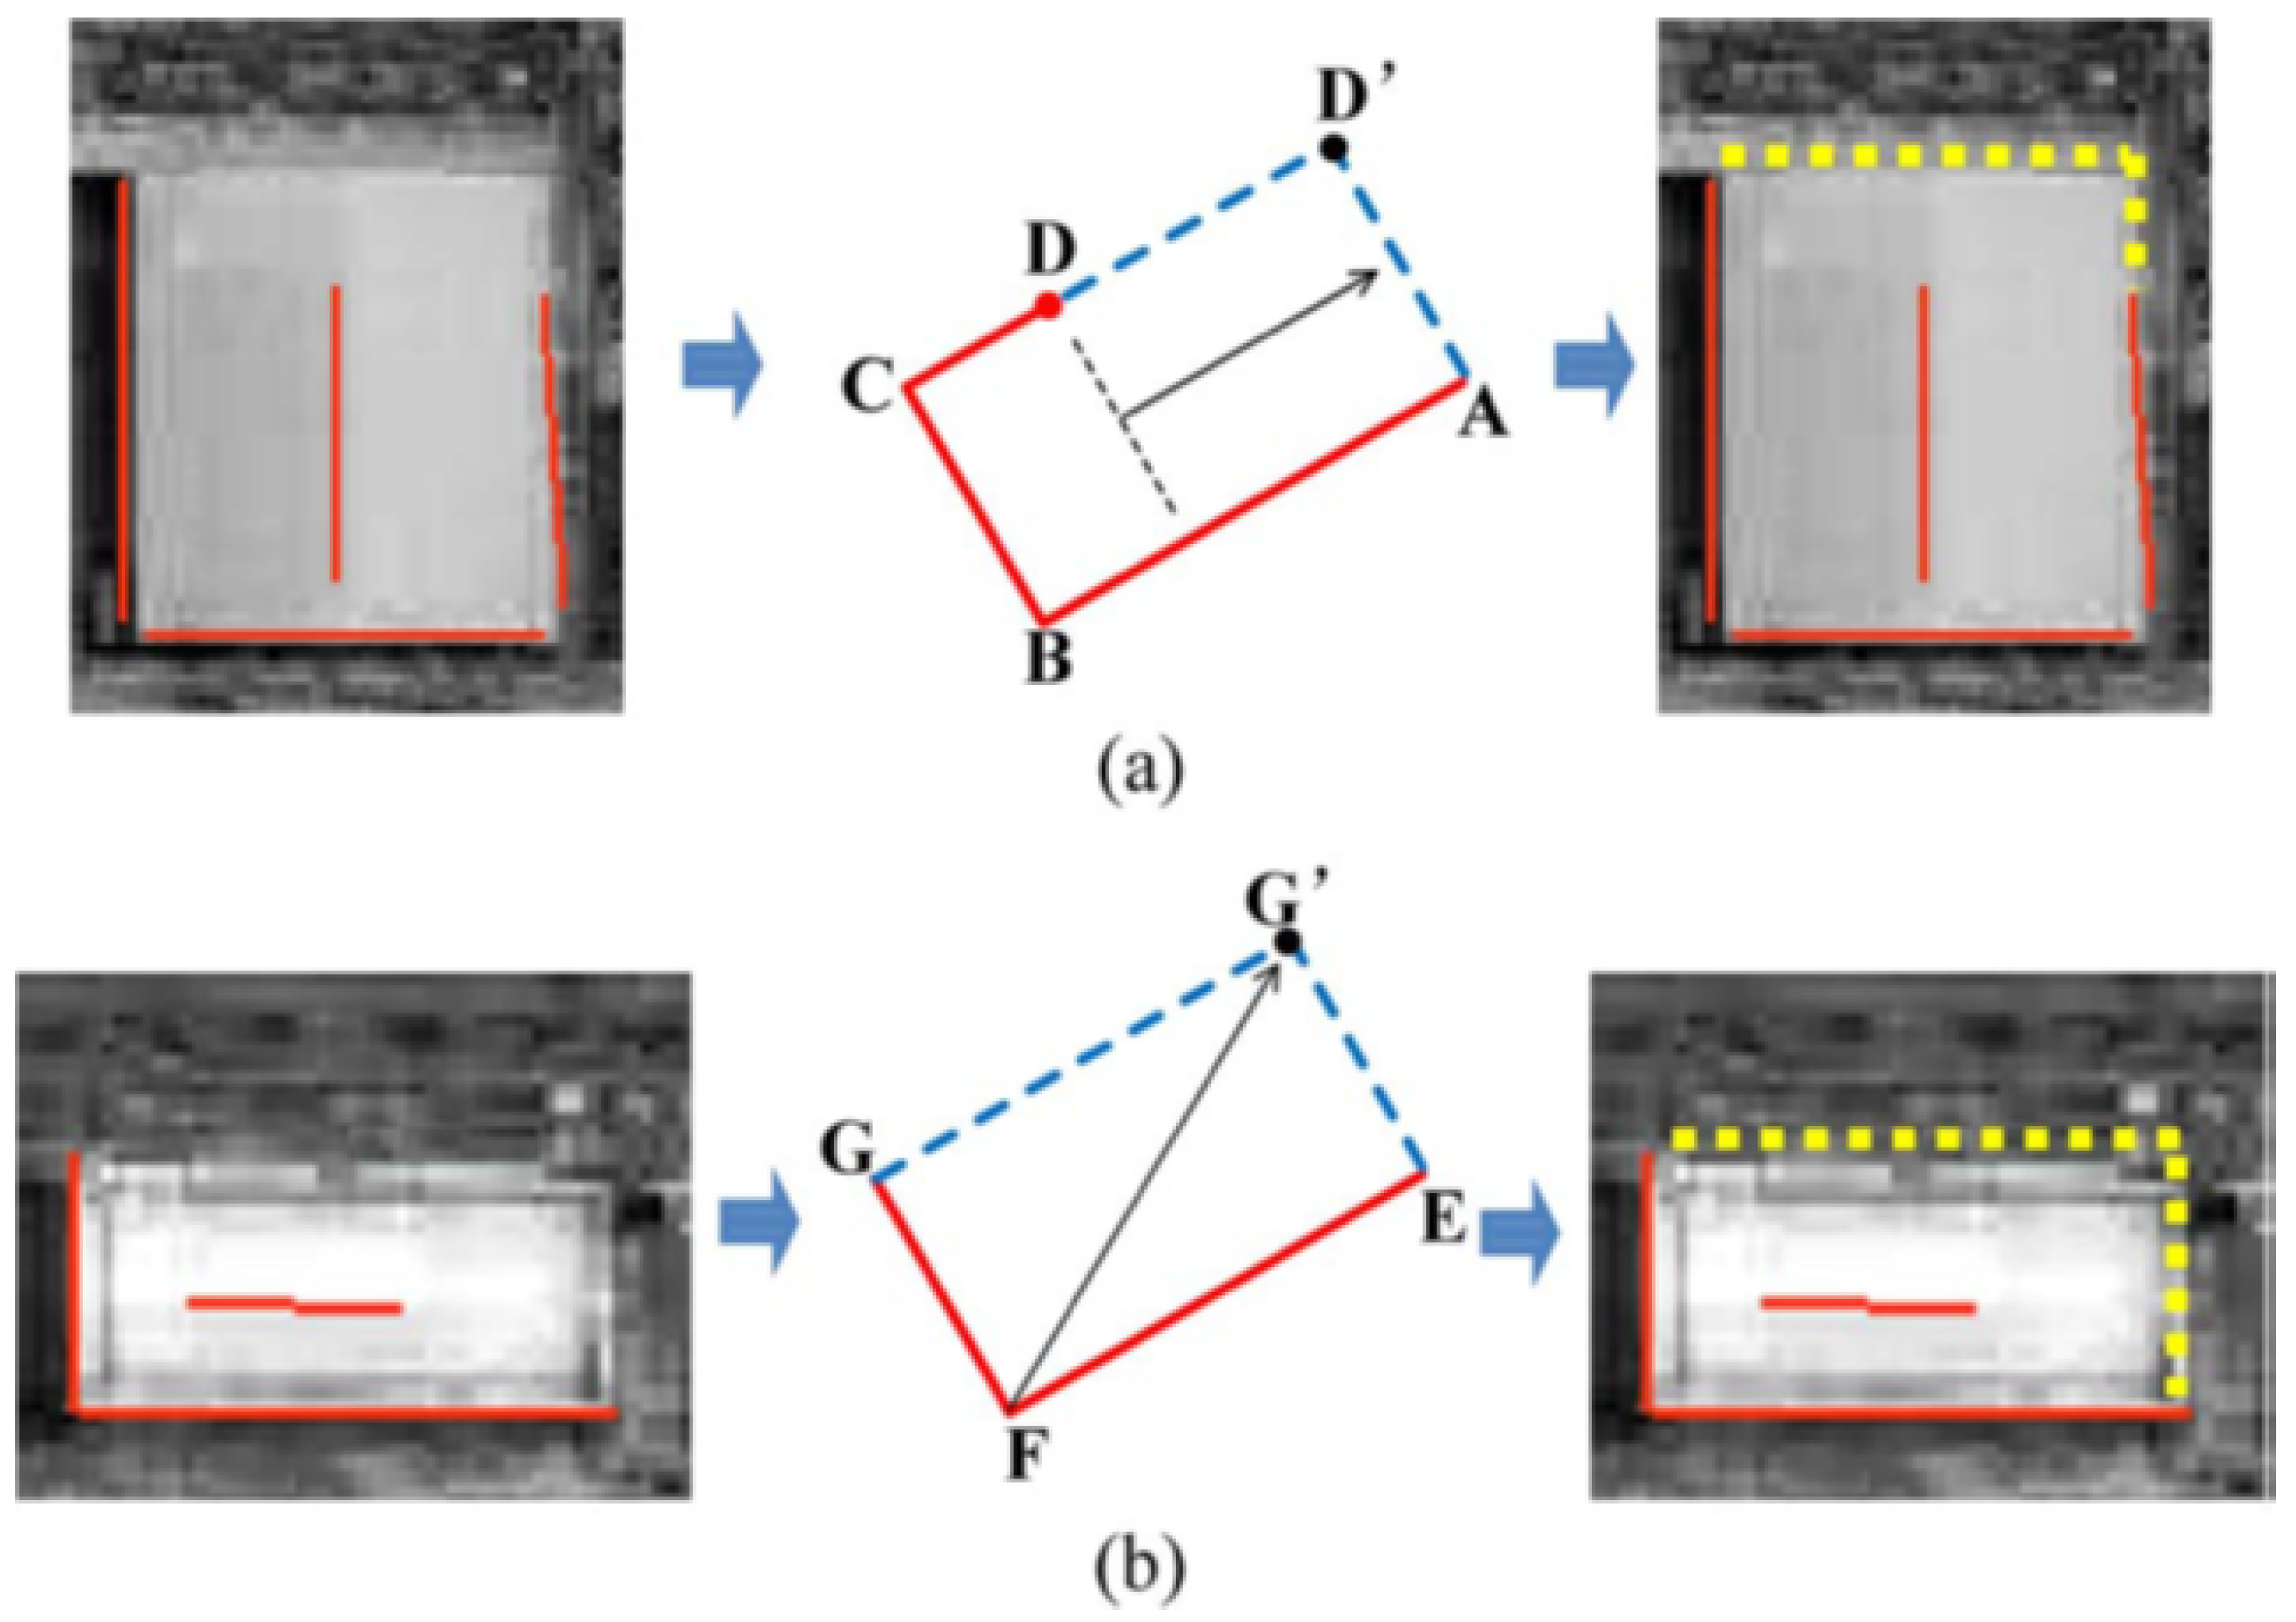
3.2.2. Perceptual Grouping

Perceptual grouping is a useful way to establish structural buildings from line segments. It is a process of making the parts whole, such as finding regions with uniform properties and linking edges into object boundaries. Moreover, some objects are critical, so it also can deal with simple objects such as linking of lines [39].
Once the line segments are obtained, then collinear line linking criteria and line intersection detection are achieved to build a relationship between line segments and line intersections and the boundaries of the objects. The grouping of the detected lines in the previous step is produced by the criteria introduced by Izadi and Saeedi [35], as elaborated in Figure 5 and defined below:
  • The ratio of overlap and length is less than 15% for lines I and II;
  • The lateral distance for lines I and II is less than 5 pixels (3 m);
  • The separation value is less than 10 pixels (6 m) for lines I and III;
  • The angle value between lines I and IV, Angle 1–Angle 2 is less than or equal to π /10.
In order to obtain lines that can be used to establish building contours, each pair of the nearby segment is evaluated by the above four steps. The criteria are based on proximity and collinearity constraints, which help to obtain lines that can be efficiently grouped further. After the line linking process, a graph search strategy is built to examine the relationship of the lines to establish a set of building rooftop hypotheses. It has been observed that most building roofs appear as rectangular and rectilinear shapes. Thus, considering this observation, a path completion strategy has been designed for rectangular buildings. A basic structure is formed which is a right-angle structure consisting of two edges, which are perpendicular, and a corresponding vertex.
Furthermore, potential vertices of the building candidate hypotheses are represented by these structures. Then, the polygonal building outlines are produced by the pairs of this right-angle structure. Finally, the process of searching continues until a building contour loop is found. Consequently, the graph search technique serves as a bridge between low-level line segments and high-level semantic building outlines.
Furthermore, Figure 6 shows the searching process after low-level lines are obtained. Now, moving left or right results in the formation of a perceptual link to complete the building outlines. The red and green lines in Figure 3 depict this formation over previously detected line segments based on geometrically related line corners and line groups which are produced if separation ≤ 10 pixels and π /2 − π /10 ≤ intersection angle ≤ π /2 + π /10. Furthermore, it results in the formation of rectilinear building boundaries and the connection of the boundary line intersections.
However, the process of detection could be affected due to many factors, such as image quality and interference in the background of the image. It can be seen in Figure 7 that the lines labeled in yellow failed to be detected previously, although it is not necessary that all lines should exist in the line sets. Therefore, the unclosed U-shape contour-based path on the most extended border AB is completed on the basis of the prior knowledge regarding building boundary shape, shown in Figure 7a. As shown in Figure 7b, the diagonal line of the present building block is used to complete the vertex G’, which was undetected previously. Like this, an isolated L-shape structure results in a completely rectangular shape.

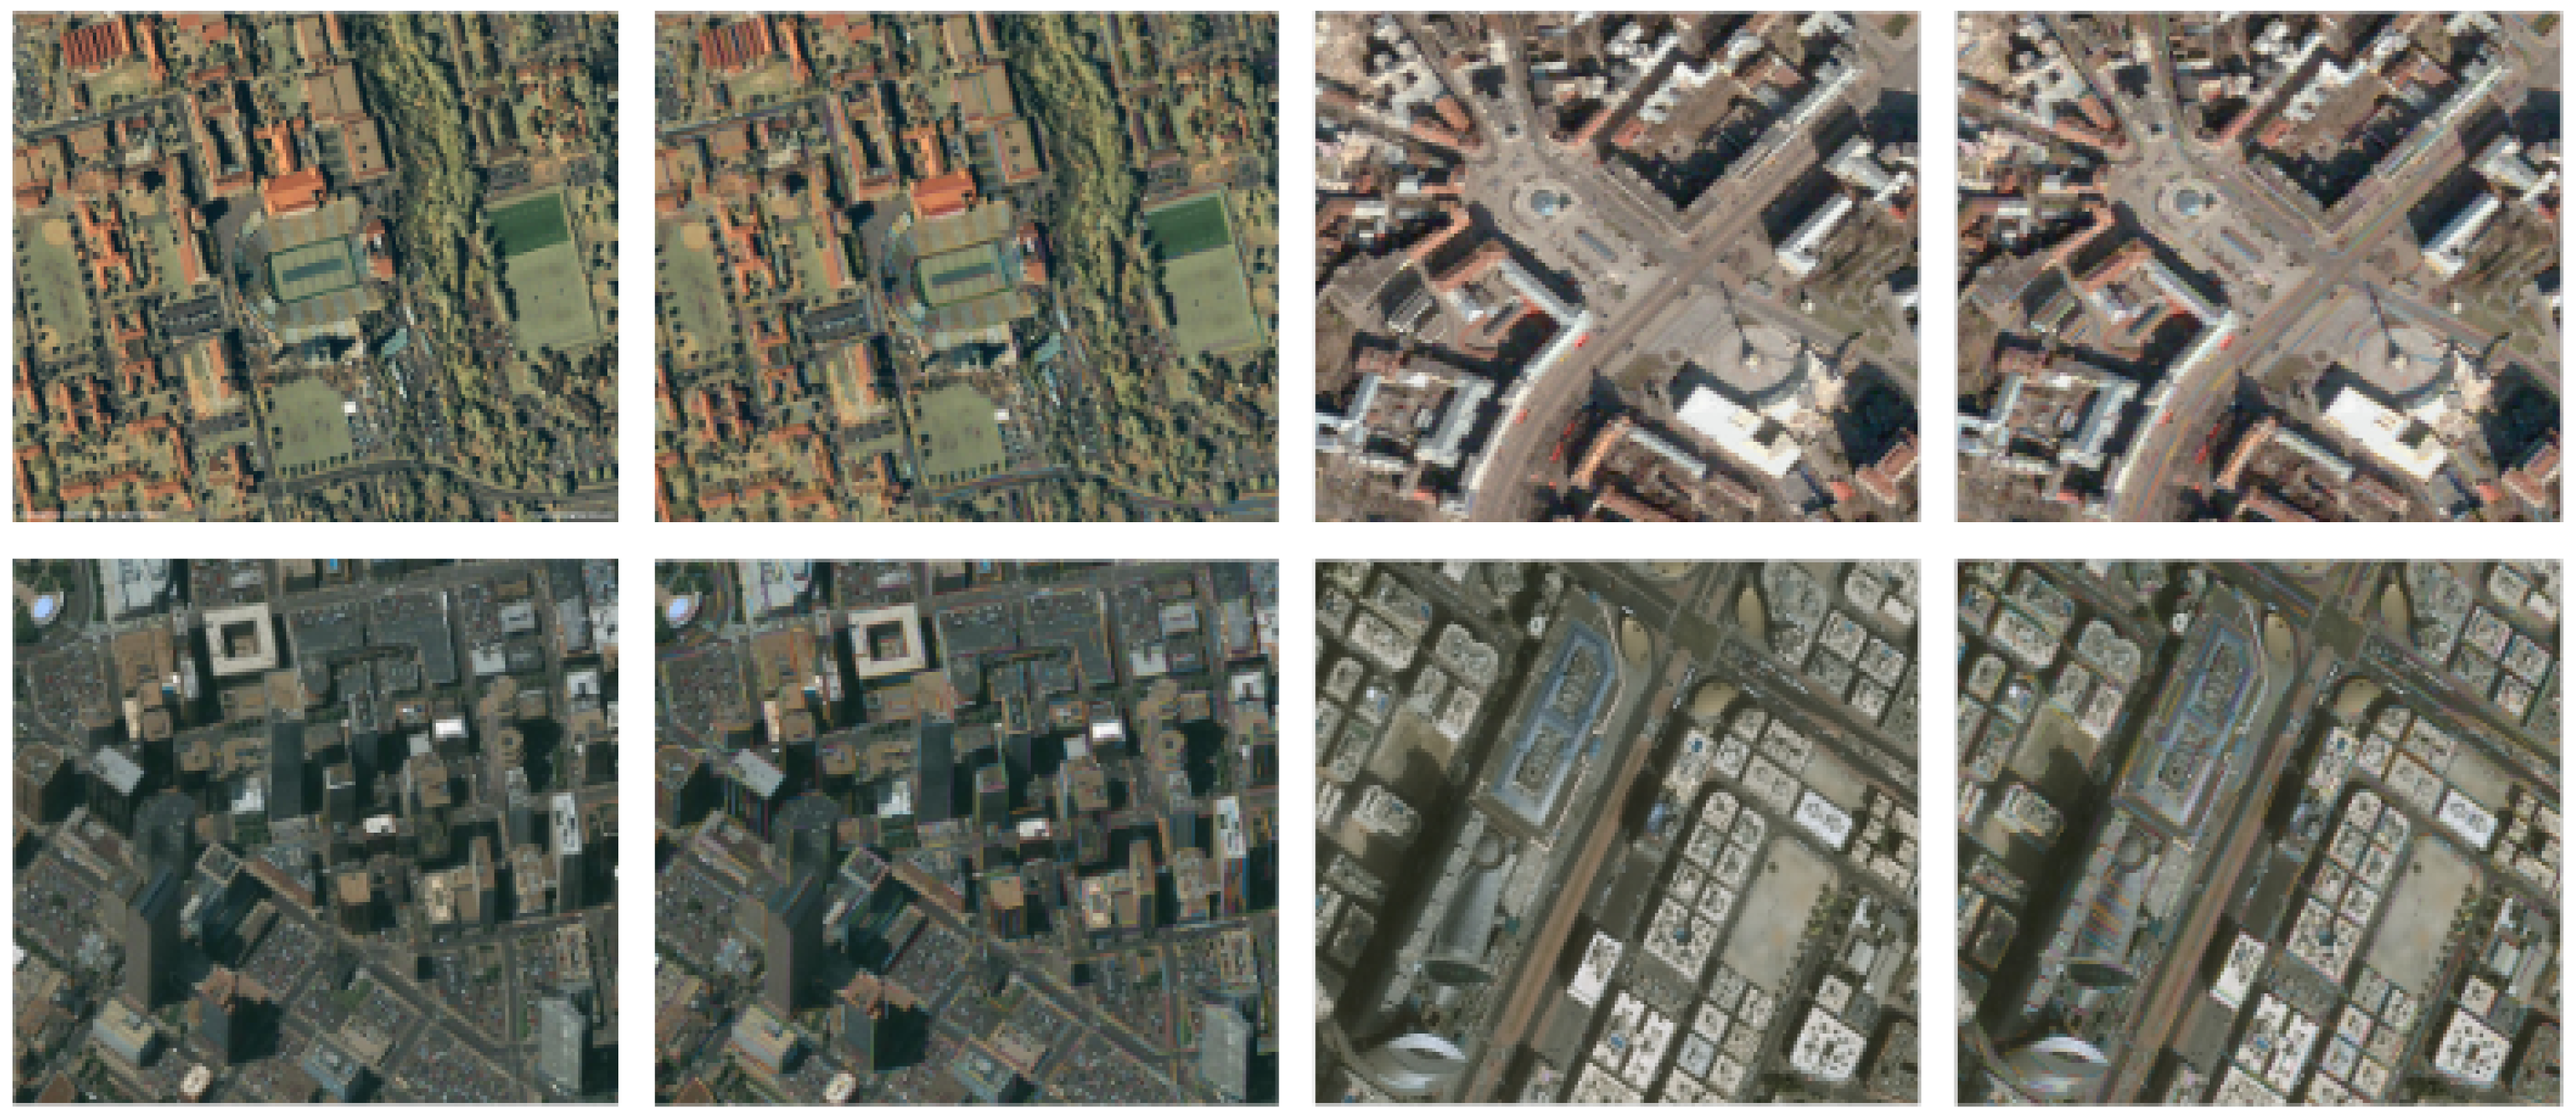
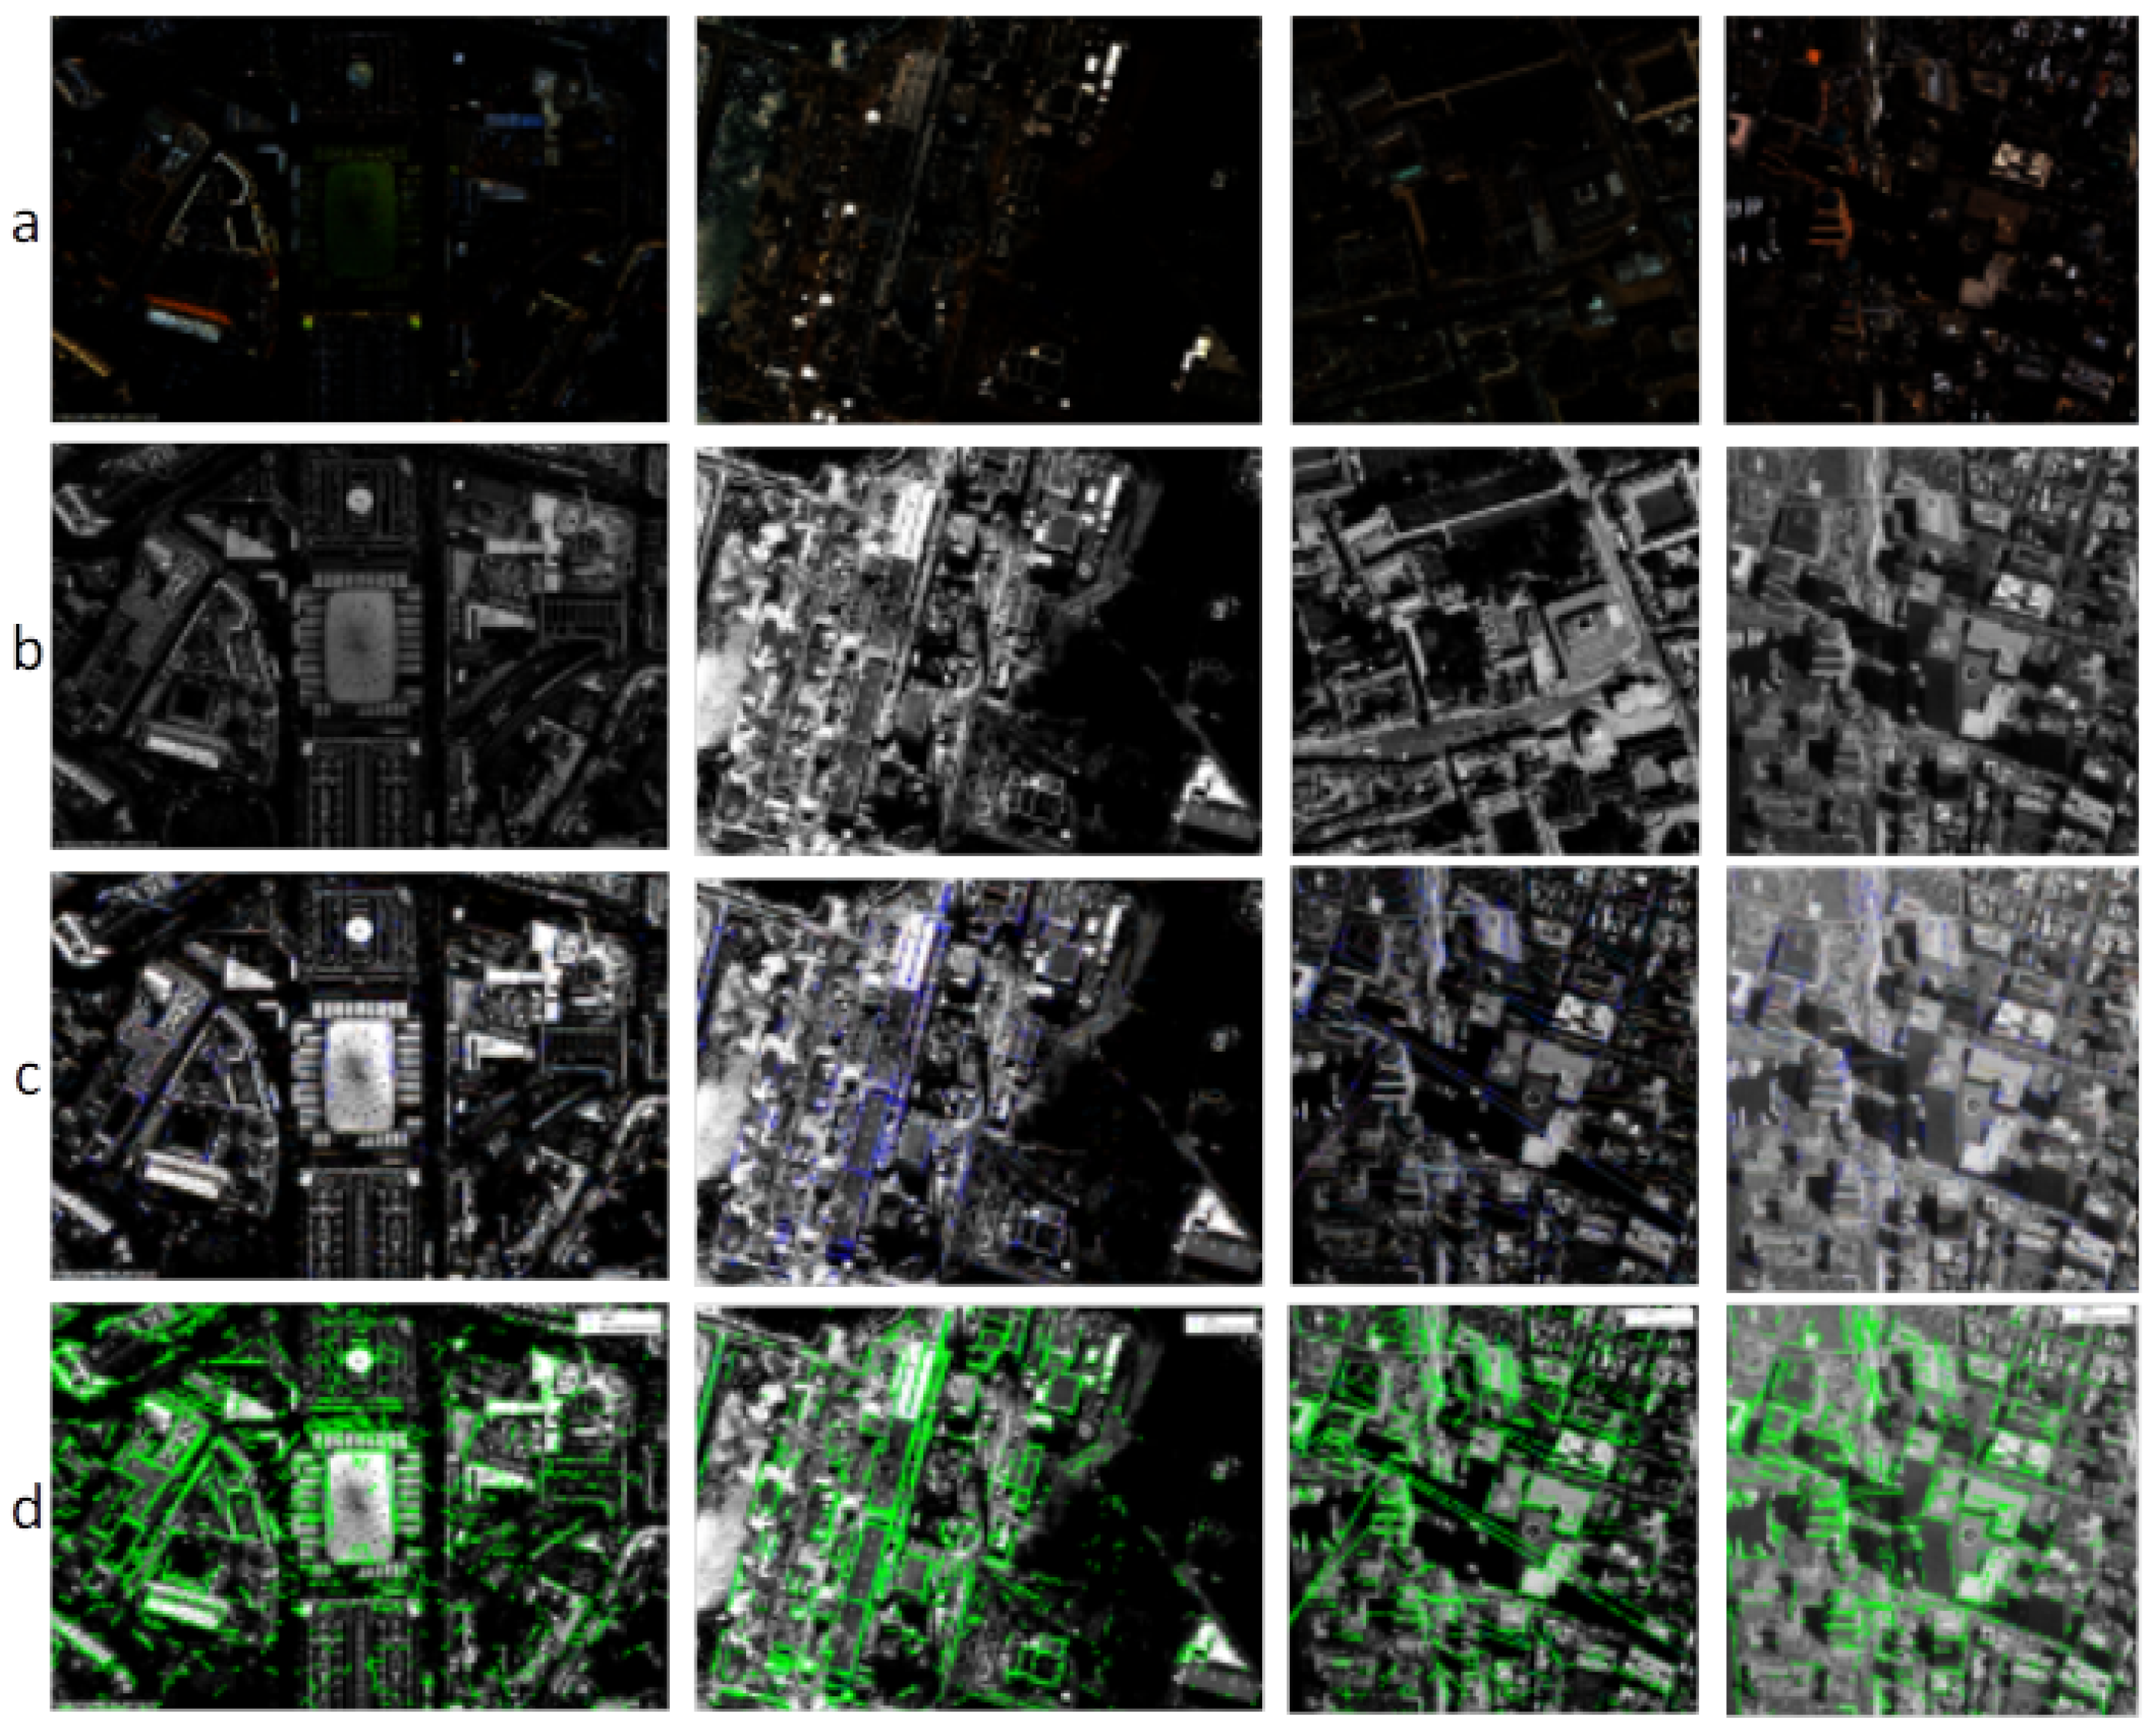
4. Evaluation and Results

To evaluate the performance of the proposed approach, most of the analysis was carried out on an image obtained from the QuickBird satellite [62], which was launched in October 2001. The imagery is owned and operated by the DigitalGlobe Inc. (Westminster, CO, USA). QuickBird imagery provides both panchromatic and multispectral imagery. Later, it is publicly made available to use for a wide variety of remote sensing tasks, such as building detection, road extraction, and contrast enhancement. It is one of the best possible options to evaluate the proposed method. All the experiments were performed in MATLAB 2015a with a PC with the specifications of Windows 10, 4 GB of RAM, and a 2.5-GHz CPU. To evaluate the performance of the proposed technique, four 512 × 512 low-contrast QuickBird satellite images were taken, as shown in Figure 8. The first row was the low-contrast image. The second row was an enhanced version. Row three was the result of the line segment. The last row was the building detection. Furthermore, the performance of the detection algorithm was assessed. The rate of detection correctness (RoD), the false negative rate (FNR), precision, recall, f-score and overall accuracy were derived from the following quantities: number objects correctly classified as buildings ( N T P ), number of other objects classified as buildings ( N F P ), and a number of buildings classified as another object ( N F N ), which were based on the quantities given in Equations (8)–(13). Mathematically, these were defined as
R o D = N T P N T P + N F P × 100 % ,
P r e c i s i o n = N T P N T P + N F P ,
R e c a l l = N T P N T P + N F N ,
f - s c o r e = 2 × P r e c i s i o n × R e c a l l P r e c i s i o n + R e c a l l ,
F N R = N F N N T P + N F N × 100 % ,
A c c u r a c y = N T P N T P + N F P + N F N × 100 % .
Furthermore, the accuracy of the proposed method is shown in Table 1. It demonstrates that the proposed approach yielded the best detection result, with an overall accuracy of 89.02%. Furthermore, many factors could have affected the detection results, in particular, background interference. Therefore, the proposed method detected 18 other objects like buildings and recognized 10 buildings as another object with the FNR of 6.4% for 168 buildings.
Furthermore, the performance evaluation of the proposed framework is summarized in Table 2. It can be seen from the table that EDLines-based line segment detection spends less time to process the images. It takes 0.06, 0.07, 0.02, and 0.06 s, respectively, which is the best processing time compared to traditional approaches for efficient building detection. In addition, 332, 682, 444, and 1063 lines were detected for the images, respectively. Furthermore, based on the linking criteria, the obtained collinear lines segments obtained were merged. In conclusion, the complete process of extraction required 12, 11, 9, and 13 s, respectively.
Table 3 shows the comparison of our approach with existing methods for building extraction. Different satellite image sizes with standard contrasts for the existing approaches chosen and the image of size 512 × 512 with low-contrast for the proposed method have been taken for testing purposes. As compared with prior techniques, our approach takes the fewer time 13 s to finish the detection task. Undoubtedly, this is due to our proposed method’s ability to efficiently extract buildings based on low-contrast satellite images. It is a lightweight approach.
On the other hand, the existing techniques are efficient at detecting buildings, but they are highly time-consuming. However, the method used in [34,35,37,38] achieved an excellent detection rate, but was more time-consuming. This is because these methods also detected some objects other than buildings such as crossroads, lawns, and parking areas, which explains the high detection rate. However, the results of the proposed method have a robust detection rate of 89.02%, which is the best rate when the input images are low-contrast satellite images.
The proposed approach was unable to detect 22 buildings. This is because of background interference and some other visual artifacts. Furthermore, based on dense residential portions, the small buildings that were closely distributed might have been extracted and merged as a single building, thus making accurate separation difficult. It might also be that small buildings are simply not easily detected.
While the authors present comparison of the proposed method with past studies in the perspective of time, RoD, TBD, TNB and image size in Table 3, at the same point, for more elucidation and a detailed comparison of the commonly accepted measurement criteria for building extraction. Table 4 presents the experimental findings to distinguish this study with most recent and current studies.
Table 4 depicts the quantitative stats to measure quality performance evaluation of the proposed method about the approaches used in the extant literature [63,64,65,66,67,68,69,70]. The results from the prior literature are compared on the basis of commonly used measurement criteria for precision, recall rate, and f-score. The said measures of measurement criterion are more indicative to examine “How efficiently can the method identify building objects in comparison to other quality assessment measures addressed in the extant literature?” Additionally, to elucidate the performance of the proposed method, in this study, the overall accuracy and the computational cost is also analyzed in comparison to the previous approaches. Experimental results of the study predict that the proposed method achieved high performance between three well-known quality assessment measurement criteria, i.e., precision (89.02%), recall (93.58%) and f-score (91.33%), respectively. The proposed method achieved the overall accuracy of 83.90% in detecting building objects from satellite images, and the method only required 13s (approximately). Upon further examination of the results illustrated in Table 4, Chandra et al. [64] study using dataset of cognitive task analysis (CTA) and marked point process (MPP) produces the lowest f-score of 62.50%, precision 68.45% and recall 59.80%, which highlights that the method used is inadequate in extracting building objects as compared to authors’ technique (Table 4). However, compared to the study of Huang et al. [67], authors’ precision is slightly below than his precision criterion, i.e., 89.02%. Nevertheless, other measurement criteria are well efficient than the Huang et al. study (Table 4). Moreover, in studies [63,65,66,67,68,69,70], f-score also depicts a good and acceptable achievement recall (completeness) values. Furthermore, methods used in [63,65,66,68,69,70] also obtained acceptable standard precision values including this study. However, based on the insights of extant literature, we considered all measurement criterion values rather than f-score, precision and recall individually to extract building objects and found our method to be the more novel for extracting building objects from satellite images and can be treated as a best fit for extracting building objects from low-contrast satellite images.
Furthermore, while comparing measurement criteria among the listed studies from current and recent past in Table 4, the Li et al. [68] study presents the lowest overall accuracy of detecting building objects i.e., 59.85%, while Chen et al. [70] in their study have achieved the highest accuracy of detecting building objects, i.e., 89.8%. Moreover, methods used in [63,64,65,66,67,69] yielded between 70.1% to 84.66% accuracy. From the perspective insights of past literature, it is highlighted that, in an extraction task, the accuracy is a less considered measurement criterion than others [70]. Therefore, the overall proposed method considers precision and recall statistics in addition to accuracy measurement to provide new methodological insights for academicians and practitioners. Furthermore, the computation cost is also taken into consideration in the authors’ proposed method, which consumes lesser computational time as compared to the already used methods, i.e., 13 s (approximately) (Table 4). The computational time presented in Table 4 for past studies’ methods [63,65,66,67,68,69,70] required a lot of computational time. Finally, the quantitative assessment capability of the proposed method shows that the method carries significant potential to extract buildings from low-contrast satellite images and surpasses the accuracy statistics of previous methods used. Therefore, the study distinguishes itself from past studies.

5. Discussion

On the basis of literature insights on building extraction from satellite imagery, this research presents a new method in extracting building objects from low-contrast satellite images. The proposed model carries the ability to enhance the quality measurement criteria such as precision, recall, f-score, computational time, and overall accuracy as compared to previous studies (Table 3 and Table 4). While the authors present their experimental results in Section 4 of this manuscript, in this section, the study highlights the benefits of the proposed model and compares its results while considering the past studies’ experimental outcomes. In comparison to a Noronha et al. [34] study, the proposed model carries the ability to extract building objects from satellite images even though the image carries poor quality and complex structures, whereas, in a Noronha et al. study, this is considered as a drawback of their model. Moreover, their model assumes more assumptions and multiple inputs of images without pre-processing of images which leads to complexities in extracting building objects. Nevertheless, the authors’ proposed model is far efficient than the Noronha et al. model in the perspective of computational time i.e., 13 s (approximately) as compared to 225 s. Furthermore, in comparison to the study of Izadi et al. [35], their model uses only gray-scaled images which is a limitation in extracting building objects. Moreover, their method use Burn’s line detector for detecting line segments which detects a lot of false positive buildings and it also requires parameter tuning and more computational time. However, in the authors’ study, the EDLines line detector is adopted, which is proven to be more efficient in detecting lines and improves the overall performance of extracting building objects [39]. Similarly, the computational time is also higher in Izadi et al. model as compared to the authors’ model.
In comparison to OK et al. [36], the authors’ study does not require shadow information which requires the prior knowledge of solar illumination to prepare shadow areas for building extraction. Moreover, in the OK et al. study, in extracting complex structures, the group of buildings is labeled as a single building which reduces the overall extraction performance in terms of computational time and rate of detection (RoD); hence, OK et al. technique is considered less robust as compared to the authors’ technique. Similarly, the Cote et al. [37] study requires ground truth information to assess the quality of method and requires more computational time, i.e., 121 s. Moreover, in comparison to the Mayunga et al. [38] study, the authors’ study is not a semi-automatic approach, which is human made and requires very high cost and computational time. The main drawback of this approach is that it also requires gray-scaled and less noise affected images with standard contrast. Furthermore, the Mayunga et al. study requires user interaction which leads to inaccuracies.
While the authors discuss past studies’ model approaches in comparison to the proposed model, this study also sheds light on the results of current and the most recent studies to further elucidate the current study’s experimental results in the perspective of computational time, overall accuracy, and commonly accepted quality measures. As presented in Table 4, in comparison to the Gao et al. [63] approach, the authors’ proposed model is efficient in computational time because the Gao et al. model uses various stages to extract buildings from simple and complex images such as sample extraction, SVM, post-processing, etc. Among these stages, there exist manual operations which degrades the performance indices. Moreover, the Chandra et al. (2017) approach which uses a segmentation process, which is a bottom-based method to obtain building boundaries that is less efficient than EDLines to detect building boundaries. Hence, the Chandra et al. approach is less efficient than the authors’ method in terms of accuracy, precision, recall, f-score and time. Similarly, in the studies of Gavankar et al. [65] and Attarzadeh et al. [66], the computational time and cost are higher than the proposed method. Moreover, in the study of Huang et al. [67] and Li et al. [68], where they have used high-resolution images instead of low-contrast images, which require a large number of tests and leads to a high computational cost. In their studies, the images taken from satellite datasets degraded the efficiency of the model due to the extraction of non-building objects. Lastly, in the studies of Li et al. [69] and Chen et al. [70], the feature extraction is more time-consuming than the proposed model and make the computational cost high and also degrades the overall efficiency.
As the core aim of this study revolves around the efficiency in the measurement criteria, the approaches discussed above have certain pros and cons. However, the proposed model is efficient mainly in terms of accuracy, recall, precision, f-score, and computational cost.

6. Implications and Future Research Gaps

To the best of our knowledge, most articles in the extant literature on building detection from satellite imagery have presented their findings using more traditional approaches and offered less analytical results in the domain of low-contrast satellite imagery. However, based on existing literature insights, the main theoretical contributions of this paper are: (1) This study compares the rate of detection from the perspective of true building objects from already existing low-contrast satellite images; (2) This study analyzes the change of rate in time efficiency of detecting building objects from low-contrast satellite imagery; (3) Moreover, this study also presents its insights regarding the overall accuracy of detecting building objects.
Furthermore, the results of this study offer meaningful insights for practitioners in the field of remote sensing. The results suggest that building detection from high-resolution satellite images with low contrast can be applied in several applications that require the formation of urban maps or the study of urban changes. A few important application areas which would benefit from the development of a system capable of monitoring and modeling urban changes that employ low-contrast imagery for detecting building objects include sociology, citizen welfare, city protection, illegal construction, and navigation. It can also be used in the field of online remote sensing applications and industrial development shortly.
Besides the above mentioned implications, the authors believe that the present study could be extended for future research using low-contrast satellite imagery for visibly darker, less clear images. A long-distance image can also be affected by various conditions, such as fog or smoke, noise, color distortion, and dense weather. In the future, researchers could extend this work for detecting building objects to images which suffer due to dense fog and mist.

7. Conclusions

In the literature, numerous techniques have been reported for building detection. These methods have mainly focused on satellite images with an average or standard contrast. In this paper, we proposed an efficient building detection model that can effectively extract buildings from low-light satellite images. The proposed system first enhances the contrast of low-light satellite images using the concept of wavelet transform based on SVD. The low-contrast satellite image is decomposed into DWT sub-bands such as LL, LH, HL, and HH. Then, the SVM of the LL sub-band is obtained. Then, the image is reconstructed using the inverse discrete wavelet transform (IDWT). Secondly, the buildings are detected using the concept of perceptual grouping by the application of the efficient line detector EDLines. Furthermore, we evaluated our model on QuickBird satellite images. The experiment showed promising results compared to similar techniques. The experimental results also elaborate on our proposed method of improving building extraction. Our method achieved a good detection rate with 89.02% accuracy.
Furthermore, the running time and detection rate were also compared with several previous approaches, and our proposed method took less time to complete the detection process. Hence, the visual results show that wavelet transforms work well to enhance low-light satellite images. Once established, the detection process detects and extracts buildings with high accuracy.

Author Contributions

M.A. and Y.-F.P. performed the experiments and wrote the manuscript; Y.-F.P. analyzed the results and conducted the mentorship, and performed research, the investigation process and evidence collection. All authors read and approved the final manuscript.

Funding

This work was supported by the National Natural Science Foundation of China under Grant No. 61571312, Academic and Technical Leaders Support Foundation of Sichuan province under Grant No. (2016)183-5, and the National Key Research and Development Program Foundation of China under Grant No. 2017YFB0802300.

Acknowledgments

The authors are thankful to the editor, academic editor and associate editor for providing us with great suggestions throughout the revision process. We are also thankful to Muhammad Awais Shakir and his thoughtful comments on improving the quality of the manuscript.

Conflicts of Interest

The authors declare no conflict of interest.

References

  1. Ansari, M.A.; Zai, S.; Moon, Y.S. Automatic segmentation of coronary arteries from computed tomography angiography data cloud using optimal thresholding. Opt. Eng. 2017, 56, 013106. [Google Scholar] [CrossRef]
  2. Chen, F.; Ren, R.; Van de Voorde, T.; Xu, W.; Zhou, G.; Zhou, Y. Fast Automatic Airport Detection in Remote Sensing Images Using Convolutional Neural Networks. Remote Sens. 2018, 10, 443. [Google Scholar] [CrossRef]
  3. Memon, S.; Bhatti, S.; Thebo, L.A.; Muhammad, M.; Talpur, B.; Memon, M.A. A Video based Vehicle Detection, Counting and Classification System. Image Graph. Signal Process. 2018, 9, 34–41. [Google Scholar] [CrossRef]
  4. Yao, Y.; Shi, Y.; Weng, S.; Guan, B.; Yao, Y.; Shi, Y.; Weng, S.; Guan, B. Deep Learning for Detection of Object-Based Forgery in Advanced Video. Symmetry 2017, 10, 3. [Google Scholar] [CrossRef]
  5. Aamir, M.; Pu, Y.-F.; Abro, W.A.; Naeem, H.; Rahman, Z. A Hybrid Approach for Object Proposal Generation; Springer: Cham, Switzerland, 2019; pp. 251–259. [Google Scholar]
  6. Ayoub, N.; Gao, Z.; Chen, B.; Jian, M. A Synthetic Fusion Rule for Salient Region Detection under the Framework of DS-Evidence Theory. Symmetry 2018, 10, 183. [Google Scholar] [CrossRef]
  7. Rahman, Z.; Pu, Y.-F.; Aamir, M.; Ullah, F. A framework for fast automatic image cropping based on deep saliency map detection and gaussian filter. Int. J. Comput. Appl. 2018. [Google Scholar] [CrossRef]
  8. Naeem, H.; Bing, G.; Naeem, M.R.; Aamir, M.; Javed, M.S. A new approach for image detection based on refined Bag of Words algorithm. Optik 2017, 140, 823–832. [Google Scholar] [CrossRef]
  9. Bhargava, A.K.; Vagen, T.; Gassner, A. Breaking Ground: Unearthing the Potential of High-resolution, Remote-sensing Soil Data in Understanding Agricultural Profits and Technology Use in Sub-Saharan Africa. World Dev. 2018, 105, 352–366. [Google Scholar] [CrossRef]
  10. Näsi, R.; Honkavaara, E.; Blomqvist, M.; Lyytikäinen-Saarenmaa, P.; Hakala, T.; Viljanen, N.; Kantola, T.; Holopainen, M. Remote sensing of bark beetle damage in urban forests at individual tree level using a novel hyperspectral camera from UAV and aircraft. Urban For. Urban Green. 2018, 30, 72–83. [Google Scholar] [CrossRef]
  11. Michel, S.; Avouac, J.-P.; Ayoub, F.; Ewing, R.C.; Vriend, N.; Heggy, E. Comparing dune migration measured from remote sensing with sand flux prediction based on weather data and model, a test case in Qatar. Earth Planet. Sci. Lett. 2018, 497, 12–21. [Google Scholar] [CrossRef]
  12. Klein, M.; Pitstick, K.; Morris, E.; Hansen, J.; Vazquez-Trejo, J. Applying video summarization to aerial surveillance. In Ground/Air Multisensor Interoperability, Integration, and Networking for Persistent ISR IX; Pham, T., Kolodny, M.A., Wiegmann, D.M., Eds.; SPIE Defense + Security: Orlando, FL, USA, 2018; Volume 10635, p. 12. [Google Scholar]
  13. He, Z.; He, H. Unsupervised Multi-Object Detection for Video Surveillance Using Memory-Based Recurrent Attention Networks. Symmetry 2018, 10, 375. [Google Scholar] [CrossRef]
  14. Rocchini, D.; Luque, S.; Pettorelli, N.; Bastin, L.; Doktor, D.; Faedi, N.; Feilhauer, H.; Féret, J.-B.; Foody, G.M.; Gavish, Y.; et al. Measuring β-diversity by remote sensing: A challenge for biodiversity monitoring. Methods Ecol. Evol. 2018, 9, 1787–1798. [Google Scholar] [CrossRef]
  15. Baughman, C.A.; Jones, B.M.; Bodony, K.L.; Mann, D.H.; Larsen, C.F.; Himelstoss, E.; Smith, J. Remotely Sensing the Morphometrics and Dynamics of a Cold Region Dune Field Using Historical Aerial Photography and Airborne LiDAR Data. Remote Sens. 2018, 10, 792. [Google Scholar] [CrossRef]
  16. Shi, T.; Guo, L.; Chen, Y.; Wang, W.; Shi, Z.; Li, Q.; Wu, G. Proximal and remote sensing techniques for mapping of soil contamination with heavy metals. Appl. Spectrosc. Rev. 2018, 53, 783–805. [Google Scholar] [CrossRef]
  17. Dahiya, S.; Garg, P.K.; Jat, M.K.; Garg, P.K. Building Extraction from High Resolution Satellite Images Using Matlab Software Building Extraction from High resolution Satellite Images. In Proceedings of the International Multidisciplinary Scientific GeoConference & EXPO (SGEM), Albena, Bulgaria, 17–26 June 2014. [Google Scholar]
  18. Liu, W.; Prinet, V. Building Detection from High-resolution Satellite Image Using Probability Model. In Proceedings of the 2005 IEEE International Geoscience and Remote Sensing Symposium (IGARSS ’05), Seoul, Korea, 29 July 2005. [Google Scholar]
  19. Cui, S.Y.; Yan, Q.; Liu, Z.J.; Li, M. Building detection and recognition from high resolution remotely sensed imagery. In Proceedings of the XXIst ISPRS Congress, Beijing, China, 3–11 July 2008. [Google Scholar]
  20. Koc San, D.; Turker, M. Building extraction from high resolution satellite images using hough transform. Int. Arch. Photogramm. Remote Sens. Spat. Inf. Sci. 2010, 38, 1063–1068. [Google Scholar]
  21. Zhang, A.; Liu, X.; Gros, A.; Tiecke, T. Building Detection from Satellite Images on a Global Scale. arXiv, 2017; arXiv:1707.08952. [Google Scholar]
  22. Theng, L.B. Automatic Building Extraction from Satellite Imagery. Eng. Lett. 2006, 13, 3. [Google Scholar]
  23. Xu, Y.; Wu, L.; Xie, Z.; Chen, Z.; Xu, Y.; Wu, L.; Xie, Z.; Chen, Z. Building Extraction in Very High Resolution Remote Sensing Imagery Using Deep Learning and Guided Filters. Remote Sens. 2018, 10, 144. [Google Scholar] [CrossRef]
  24. Peng, J.; Liu, Y.C. Model and context-driven building extraction in dense urban aerial images. Int. J. Remote Sens. 2005, 26, 1289–1307. [Google Scholar] [CrossRef]
  25. Peng, J.; Zhang, D.; Liu, Y. An improved snake model for building detection from urban aerial images. Pattern Recognit. Lett. 2005, 26, 587–595. [Google Scholar] [CrossRef]
  26. Ahmadi, S.; Zoej, M.V.; Ebadi, H.; Moghaddam, H.A.; Mohammadzadeh, A. Automatic urban building boundary extraction from high resolution aerial images using an innovative model of active contours. Int. J. Appl. Earth Obs. Geoinf. 2010, 12, 150–157. [Google Scholar] [CrossRef]
  27. Akcay, H.G.; Aksoy, S. Building detection using directional spatial constraints. In Proceedings of the 2010 IEEE International Geoscience and Remote Sensing Symposium, Honolulu, HI, USA, 25–30 July 2010; pp. 1932–1935. [Google Scholar]
  28. Aytekın, Ö.; Erener, A.; Ulusoy, İ.; Düzgün, Ş. Unsupervised building detection in complex urban environments from multispectral satellite imagery. Int. J. Remote Sens. 2012, 33, 2152–2177. [Google Scholar] [CrossRef]
  29. Benedek, C.; Descombes, X.; Zerubia, J. Building Development Monitoring in Multitemporal Remotely Sensed Image Pairs with Stochastic Birth-Death Dynamics. IEEE Trans. Pattern Anal. Mach. Intell. 2012, 34, 33–50. [Google Scholar] [CrossRef] [PubMed] [Green Version]
  30. Durieux, L.; Lagabrielle, E.; Nelson, A. A method for monitoring building construction in urban sprawl areas using object-based analysis of Spot 5 images and existing GIS data. ISPRS J. Photogramm. Remote Sens. 2008, 63, 399–408. [Google Scholar] [CrossRef]
  31. Karantzalos, K.; Paragios, N. Recognition-Driven 2D Competing Priors Towards Automatic And Accurate Building Detection. IEEE Trans. Geosci. Remote Sens. 2009, 47, 133–144. [Google Scholar] [CrossRef]
  32. Lefevre, S.; Weber, J.; Sheeren, D. Automatic Building Extraction in VHR Images Using Advanced Morphological Operators. In Proceedings of the 2007 Urban Remote Sensing Joint Event, Paris, France, 11–13 April 2007; pp. 1–5. [Google Scholar]
  33. Lhomme, S.; He, D.; Weber, C.; Morin, D. A new approach to building identification from very-high-spatial-resolution images. Int. J. Remote Sens. 2009, 30, 1341–1354. [Google Scholar] [CrossRef]
  34. Noronha, S.; Nevatia, R. Detection and modeling of buildings from multiple aerial images. IEEE Trans. Pattern Anal. Mach. Intell. 2001, 23, 501–518. [Google Scholar] [CrossRef]
  35. Izadi, M.; Saeedi, P. Three-Dimensional Polygonal Building Model Estimation From Single Satellite Images. IEEE Trans. Geosci. Remote Sens. 2012, 50, 2254–2272. [Google Scholar] [CrossRef]
  36. Ok, A.O. Automated detection of buildings from single VHR multispectral images using shadow information and graph cuts. ISPRS J. Photogramm. Remote Sens. 2013, 86, 21–40. [Google Scholar] [CrossRef]
  37. Cote, M.; Saeedi, P. Automatic Rooftop Extraction in Nadir Aerial Imagery of Suburban Regions Using Corners and Variational Level Set Evolution. IEEE Trans. Geosci. Remote Sens. 2013, 51, 313–328. [Google Scholar] [CrossRef]
  38. Mayunga, S.D.; Coleman, D.J.; Zhang, Y. A semi-automated approach for extracting buildings from QuickBird imagery applied to informal settlement mapping. Int. J. Remote Sens. 2007, 28, 2343–2357. [Google Scholar] [CrossRef]
  39. Wang, J.; Yang, X.; Qin, X.; Ye, X.; Qin, Q. An Efficient Approach for Automatic Rectangular Building Extraction From Very High Resolution Optical Satellite Imagery. IEEE Geosci. Remote Sens. Lett. 2015, 12, 487–491. [Google Scholar] [CrossRef]
  40. Ok, A.O.; Senaras, C.; Yuksel, B. Automated Detection of Arbitrarily Shaped Buildings in Complex Environments From Monocular VHR Optical Satellite Imagery. IEEE Trans. Geosci. Remote Sens. 2013, 51, 1701–1717. [Google Scholar] [CrossRef]
  41. Senaras, C.; Ozay, M.; Yarman Vural, F.T. Building Detection With Decision Fusion. IEEE J. Sel. Top. Appl. Earth Obs. Remote Sens. 2013, 6, 1295–1304. [Google Scholar] [CrossRef]
  42. Shufelt, J.A. Performance evaluation and analysis of monocular building extraction from aerial imagery. IEEE Trans. Pattern Anal. Mach. Intell. 1999, 21, 311–326. [Google Scholar] [CrossRef]
  43. Sirmacek, B.; Unsalan, C. Urban-Area and Building Detection Using SIFT Keypoints and Graph Theory. IEEE Trans. Geosci. Remote Sens. 2009, 47, 1156–1167. [Google Scholar] [CrossRef]
  44. Sirmacek, B.; Unsalan, C. A Probabilistic Framework to Detect Buildings in Aerial and Satellite Images. IEEE Trans. Geosci. Remote Sens. 2011, 49, 211–221. [Google Scholar] [CrossRef]
  45. Stankov, K.; He, D.-C. Detection of Buildings in Multispectral Very High Spatial Resolution Images Using the Percentage Occupancy Hit-or-Miss Transform. IEEE J. Sel. Top. Appl. Earth Obs. Remote Sens. 2014, 7, 4069–4080. [Google Scholar] [CrossRef]
  46. Wegne, J.D.; Soergel, U.; Rosenhahn, B. Segment-based building detection with conditional random fields. In Proceedings of the 2011 Joint Urban Remote Sensing Event, Munich, Germany, 11–13 April 2011; pp. 205–208. [Google Scholar]
  47. Lee, J.; Pant, S.R.; Lee, H.-S. An Adaptive Histogram Equalization Based Local Technique for Contrast Preserving Image Enhancement. Orig. Artic. Int. J. Fuzzy Log. Intell. Syst. 2015, 15, 35–44. [Google Scholar] [CrossRef]
  48. Demirel, H.; Anbarjafari, G.; Jahromi, M.N.S. Image equalization based on singular value decomposition. In Proceedings of the 2008 23rd International Symposium on Computer and Information Sciences, Istanbul, Turkey, 27–29 October 2008; pp. 1–5. [Google Scholar]
  49. Yu, N.; Qiu, T.; Bi, F.; Wang, A. Image Features Extraction and Fusion Based on Joint Sparse Representation. IEEE J. Sel. Top. Signal Process. 2011, 5, 1074–1082. [Google Scholar] [CrossRef]
  50. Liu, C.-C.; Dai, D.-Q.; Yan, H. Local Discriminant Wavelet Packet Coordinates for Face Recognition. J. Mach. Learn. Res. 2007, 8, 1165–1195. [Google Scholar]
  51. Starck, J.L.; Candès, E.J.; Donoho, D.L. The curvelet transform for image denoising. IEEE Trans. Image Process. 2002, 11, 670–684. [Google Scholar] [CrossRef] [PubMed] [Green Version]
  52. Demirel, H.; Ozcinar, C.; Anbarjafari, G. Satellite Image Contrast Enhancement Using Discrete Wavelet Transform and Singular Value Decomposition. IEEE Geosci. Remote Sens. Lett. 2010, 7, 333–337. [Google Scholar] [CrossRef]
  53. Lamard, M.; Daccache, W.; Cazuguel, G.; Roux, C.; Cochener, B. Use of a JPEG-2000 Wavelet Compression Scheme for Content-Based Ophtalmologic Retinal Images Retrieval. In Proceedings of the 2005 IEEE Engineering in Medicine and Biology 27th Annual Conference, Shanghai, China, 17–18 January 2005; pp. 4010–4013. [Google Scholar]
  54. Bhandari, A.K.; Soni, V.; Kumar, A.; Singh, G.K. Cuckoo search algorithm based satellite image contrast and brightness enhancement using DWT–SVD. ISA Trans. 2014, 53, 1286–1296. [Google Scholar] [CrossRef] [PubMed]
  55. Das, S.; Mirnalinee, T.T.; Varghese, K. Use of Salient Features for the Design of a Multistage Framework to Extract Roads From High-Resolution Multispectral Satellite Images. IEEE Trans. Geosci. Remote Sens. 2011, 49, 3906–3931. [Google Scholar] [CrossRef]
  56. Abujarad, F.; Nadim, G.; Omar, A. Clutter reduction and detection of landmine objects in ground penetrating radar data using singular value decomposition (SVD). In Proceedings of the 3rd International Workshop on Advanced Ground Penetrating Radar (IWAGPR 2005), Delft, The Netherlands, 2–3 May 2005; pp. 37–42. [Google Scholar]
  57. Demirel, H.; Anbarjafari, G. Satellite Image Resolution Enhancement Using Complex Wavelet Transform. IEEE Geosci. Remote Sens. Lett. 2010, 7, 123–126. [Google Scholar] [CrossRef]
  58. Cheng, G.; Han, J. A survey on object detection in optical remote sensing images. ISPRS J. Photogramm. Remote Sens. 2016, 117, 11–28. [Google Scholar] [CrossRef] [Green Version]
  59. Akinlar, C.; Topal, C. EDLines: A real-time line segment detector with a false detection control. Pattern Recognit. Lett. 2011, 32, 1633–1642. [Google Scholar] [CrossRef]
  60. Burns, J.B.; Hanson, A.R.; Riseman, E.M. Extracting Straight Lines. IEEE Trans. Pattern Anal. Mach. Intell. 1986, PAMI-8, 425–455. [Google Scholar] [CrossRef]
  61. Topal, C.; Akinlar, C.; Genc, Y. Edge Drawing: A Heuristic Approach to Robust Real-Time Edge Detection. In Proceedings of the 2010 20th International Conference on Pattern Recognition, Istanbul, Turkey, 23–26 August 2010; pp. 2424–2427. [Google Scholar]
  62. Cheng, P. QuickBird-A Milestone for High Resolution Mapping. Earth Obs. Mag. 2002, 11, 14–18. [Google Scholar]
  63. Gao, X.; Wang, M.; Yang, Y.; Li, G. Building Extraction From RGB VHR Images Using Shifted Shadow Algorithm. IEEE Access 2018, 6, 22034–22045. [Google Scholar] [CrossRef]
  64. Chandra, N.; Ghosh, J.K. A Cognitive Viewpoint on Building Detection from Remotely Sensed Multispectral Images. IETE J. Res. 2018, 64, 165–175. [Google Scholar] [CrossRef]
  65. Gavankar, N.L.; Ghosh, S.K. Automatic building footprint extraction from high-resolution satellite image using mathematical morphology. Eur. J. Remote Sens. 2018, 51, 182–193. [Google Scholar] [CrossRef]
  66. Attarzadeh, R.; Momeni, M. Object-Based Rule Sets and Its Transferability for Building Extraction from High Resolution Satellite Imagery. J. Indian Soc. Remote Sens. 2018, 46, 169–178. [Google Scholar] [CrossRef]
  67. Huang, X.; Yuan, W.; Li, J.; Zhang, L. A New Building Extraction Postprocessing Framework for High-Spatial- Resolution Remote-Sensing Imagery. IEEE J. Sel. Top. Appl. Earth Obs. Remote Sens. 2017, 10, 654–668. [Google Scholar] [CrossRef]
  68. Li, W.; He, C.; Fang, J.; Fu, H. Semantic Segmentation based Building Extraction Method using Multi-Source GIS Map Datasets and Satellite Imagery. In Proceedings of the IEEE Conference on Computer Vision and Pattern Recognition Workshops, Salt Lake City, UT, USA, 18–22 June 2018; pp. 238–241. [Google Scholar]
  69. Li, S.; Tang, H.; Huang, X.; Mao, T.; Niu, X.; Li, S.; Tang, H.; Huang, X.; Mao, T.; Niu, X. Automated Detection of Buildings from Heterogeneous VHR Satellite Images for Rapid Response to Natural Disasters. Remote Sens. 2017, 9, 1177. [Google Scholar] [CrossRef]
  70. Chen, R.; Li, X.; Li, J.; Chen, R.; Li, X.; Li, J. Object-Based Features for House Detection from RGB High-Resolution Images. Remote Sens. 2018, 10, 451. [Google Scholar] [CrossRef]
Figure 1. The general flow diagram.
Symmetry 11 00003 g001
Figure 2. General flow diagram of discrete wavelet transform (DWT).
Symmetry 11 00003 g002
Figure 3. Results produced by EDLines on satellite images.
Symmetry 11 00003 g003
Figure 4. Results produced by EDLines.
Symmetry 11 00003 g004
Figure 5. Collinear line linking criteria.
Symmetry 11 00003 g005
Figure 6. Ninety-degree linking criteria of path completion and search direction.
Symmetry 11 00003 g006
Figure 7. U-shape (a) and L-shape (b) path completion of building boundaries.
Symmetry 11 00003 g007
Figure 8. Row (a) is low-contrast satellite images; row (b) enhanced images; row (c) line linking; and row (d) building extraction.
Symmetry 11 00003 g008
Table 1. The accuracy assessment of the proposed framework.
Total No. of BuildingsNo. of TPNo. of FPNo. of FNRoDFNRAccuracy
168146181089.02%6.4%83.90%
Notes: TP = True positive, FP = False Positive, RoD = Rate of detection, FNR = False negative rate.
Table 2. Performance evaluation of the proposed framework.
Image IDEDLines (s)Number of LinesNumber of Lines after LinkingTotal Time
(a)0.0633228812
(b)0.0768259811
(c)0.024444129
(d)0.06106396213
Table 3. Comparison evaluation of the proposed approach with traditional approaches.
MethodsImage SizeTNBTBDRoDTime (s)
Noronha et al. [34]800 × 40014513492.4%228
Izadi et al. [35]400 × 400706294.3%1390
OK et al. [36]641 × 863114599581.4%188
Cote et al. [37]400 × 40023319790.2%121
Mayunga et al. [38]600 × 600453489.9%60
Jun Wang et al. [39]512 × 51216514487.3%16
Authors512 × 51216814689.02%13
NOTE: RoD = Rate of detection, TBD = Total buildings detected, TNB = Total number of buildings.
Table 4. Comparison of the proposed method with approaches used in prior literature.
MethodsDatasetsImage Typef-ScorePrecision (%)Recall (%)Overall Accu. (%)Time (s)
[63]Dataset NSRGB76.8074.7081.3079.8047s
[64]CTA/MPPRGB62.5068.4559.8070.10Time ∝ IS
[65]Dataset NSGrayscale89.9089.0091.0082.01HCC
[66]QuickBirdRGB86.0283.6988.5084.66HCC
[67]QuickBirdRGB90.4591.4989.4082.53174.1s
[68]OpenSt. MapRGB74.9087.9265.2259.85HCC
[69]QuickBirdRGB80.6575.6286.3982.34HCC
[70]Google EarthRGB83.8085.2082.5089.80HCC
AuthorsQuickBirdRGB & GrayScale91.3389.0293.5883.9013s
NOTE: Dataset NS = Dataset not specified, HCC = High computation cost, IS= Image size.

