Article

Visualization of High-Dimensional Data by Pairwise Fusion Matrices Using t-SNE

by
Mujtaba Husnain
1,*,
Malik Muhammad Saad Missen
1,
Shahzad Mumtaz
1,
Muhammad Muzzamil Luqman
2,
Mickaël Coustaty
2 and
Jean-Marc Ogier
2
1
Department of Computer Science & IT, The Islamia University of Bahawalpur, Bahawalpur 63100, Pakistan
2
L3i, La Rochelle University, Avenue Michel Cŕepeau, 17000 La Rochelle, France
*
Author to whom correspondence should be addressed.
Symmetry 2019, 11(1), 107; https://doi.org/10.3390/sym11010107
Submission received: 12 December 2018 / Revised: 3 January 2019 / Accepted: 12 January 2019 / Published: 17 January 2019

Abstract

:
We applied t-distributed stochastic neighbor embedding (t-SNE) to visualize Urdu handwritten numerals (or digits). The data set used consists of 28 × 28 images of handwritten Urdu numerals. The data set was created by inviting authors from different categories of native Urdu speakers. One of the challenging and critical issues for the correct visualization of Urdu numerals is shape similarity between some of the digits. This issue was resolved using t-SNE, by exploiting local and global structures of the large data set at different scales. The global structure consists of geometrical features and local structure is the pixel-based information for each class of Urdu digits. We introduce a novel approach that allows the fusion of these two independent spaces using Euclidean pairwise distances in a highly organized and principled way. The fusion matrix embedded with t-SNE helps to locate each data point in a two (or three-) dimensional map in a very different way. Furthermore, our proposed approach focuses on preserving the local structure of the high-dimensional data while mapping to a low-dimensional plane. The visualizations produced by t-SNE outperformed other classical techniques like principal component analysis (PCA) and auto-encoders (AE) on our handwritten Urdu numeral dataset.

1. Introduction

Handwriting recognition is an active area of research in the field of pattern recognition, and has various applications in industrial and professional fields. Some of these applications include form processing in government, administrative, health, and academic institutes; postal address recognition, processing of bank cheques, etc. Handwriting recognition is concerned with automated transformation of a source language into its symbolic representation. The source language can be represented either in its spatial (offline) form [1] or temporal (online) [2] form in graphical marks. In-depth analysis of handwritten text gives rise to a number of useful applications such as author profiling [3], named entity recognition [4], and overlapped characters recognition [5].
In late 1950s, the first optical character recognition (OCR) system was developed for the recognition of Latin text [6,7] and dealt with recognition of numerals only. With advancements in OCR, systems available nowadays have been expanded to recognize Latin script as well as characters of a variety of other languages, including Chinese, Japanese, Arabic, and Persian. Optical character recognition of Urdu script was started in late 2000 [7] and the first work on Urdu OCR was published in 2004. A literature review identified a lack of research efforts in unsupervised classification (or clustering) of Urdu handwritten text at the character level [2,6,8]. There are a few commercially available Urdu OCR systems for printed text [7,9], but to date there is no system available for recognition of Urdu handwritten text. Furthermore, there is a lack of research on visualizing the high-dimensional data of the handwritten Urdu character set.
The development of Urdu handwritten recognition system at character level can assist in reading historic Urdu manuscripts, to make the content of these manuscripts available. The content of manuscripts is written in a clear and readable way as compared to handwritten text, thus making the task of recognition of contents of manuscripts much simpler. It is pertinent to mention that most handwritten text is processed in the form of images that require a number of pre-processing steps to extract the raw data from the text images. The raw data is usually represented in the form of high dimensional matrices. Visualization of high-dimensional data is one of the important and challenging problems in the field of computer vision and pattern recognition. This problem becomes even more relevant when the data consists of widely varying dimensionality. From UCI dataset repository (Accessed last time on 28 December 2018 https://archive.ics.uci.edu/ml/index.php) it was observed that datasets related to the medical field contain more than 20 dimensions, for example hypoglycemic symptoms that are relevant to diabetes disease can be described using 20 attributes [10], whereas data of cancer-carrying RNA genes [11] may be represented by thousands of dimensions. The high dimensionality of the data needs an approach that can visualize it efficiently. In [12,13], the authors present a comprehensive review of a number of techniques for the visualization of high-dimensional data, including pixel-oriented methods like recursive pattern [14], hierarchical techniques like InfoCube [15], and iconographic based methods like shape coding [16]. One of the major limitations of these approaches is that they provide tools to display more than two data dimensions [17,18], and leave the interpretation to the observer.
The dimensionality reduction technique is mainly concerned with conversion of a high-dimensional data set H = h 1 , h 2 , h 3 , …, h n to two (or three) dimensional space L = l 1 , l 2 , l 3 , …, l n in such a way that the significant features of the high-dimensional data are preserved as much as possible in the low dimensional space. Here, L depicts the low-dimension map of H and l i is the individual data point that can be viewed as a scatter plot. It is noteworthy that different type of properties of the data are preserved in the different dimensionality reduction techniques proposed so far. Some of the most widely used techniques for dimensionality reduction, like prinicpal component analysis (PCA) [19] and multidimensional scaling (MDS) [20], support linear data and primarily focus on structural properties of dissimilar data points that are far apart. In order to achieve efficient low-dimensional representation of very high-dimensional data, it is important to exploit the non-linear features and dimensions and focus on very similar data points that are close together. A detailed survey is presented in [21] discussing non-linear dimensionality reduction techniques that aim to preserve the structural properties of the dataset. These techniques include local linear embedding (LLE) [22], Laplacian eigenmaps [23], maximum variance unfolding (MVU) [24], stochastic neighbor embedding (SNE) [25], and curvilinear components analysis (CCA) [26]. Since the above-mentioned approaches are not successful in retaining both the local and the global structure of the whole data in a single low-dimension map [17], they are not recommended for correct and perfect visualization of factual and high-dimensional data. Furthermore, the authors of [27] observed that MVU is not proficient in separating handwritten digits into their natural clusters. In order to resolve these issues, we make use of t-distributed stochastic neighbor embedding (t-SNE) in order to get a clear and perfect visualization of the high-dimensional data with precise separations.
We applied t-SNE to visualize high-dimensional data containing Urdu handwritten numeral images, by converting the images into matrices with pairwise similarity information. This visualization enabled finding clusters in the data points of the data set. These clusters (if they exist) are the true identifiers when applying the appropriate classification techniques. Furthermore, one of the most promising features of t-SNE is that it not only retains much of the local features of high-dimensional data, but also allows for close observation of the global characteristic features. The global features include existence of inter- and intra-clusters variations at several scales in the data set. We evaluated the performance of t-SNE on Urdu-handwritten numeric data set by comparing the results with PCA [19] and AE [28].
The outline of the paper is as follows. In Section 2, we discuss SNE [25], whihc is the basis for t-SNE [17]. A detail discussion of t-SNE is given in Section 3, with comparison to SNE. Section 4 depicts the logical reasoning for our motivation and Section 5 presents a detailed discussion on the data set and experimental results. Section 6 and Section 7 conclude the paper and suggests future work.

2. Stochastic Neighbor Embedding (SNE)

Stochastic neighbor embedding (SNE) [25] is a non-linear dimensionality reduction technique that converts Euclidean distances between high-dimensional data points into conditional probability measurements. These measurements represent the similarity indexes between data points. For example, if the similarity of data point a i to data point a j is considered as the conditional probability, p j | i , it means that a i would likely to select a j as its neighbor, provided that the neighbors were selected according to the proportion of their respective probability density. In SNE, the probability distribution is assumed to be a Gaussian function centered at a i . Furthermore, the value of p j | i is relatively high for nearby data points, but for widely separated data points, p j | i converges to minimum value. Mathematically, the conditional probability p j | i is given by
p j | i = e a i a j 2 2 σ 2 k i e a i a k 2 2 σ 2 .
Here, σ is the Gaussian (or normal) variance centered at point a i . In practice, we set the value of p j | j to zero because we are only interested in modeling pairwise similarities of single space values only. Furthermore, an interesting fact of the model is that, if the data points a i and a j correctly identify the correspondence between high-dimensional data points x i and x j , then the conditional probabilities p i | j and q j | i will be equal. Based on this calculation, SNE finds a low-dimensional data representation by minimizing the inconsistency between p j | i and q j | i . Furthermore, the Kullback–Leibler divergence [29] method is used to measure the degree of accuracy in the way q j | i models p j | j . In our case, this accuracy measure is equal to the perplexity value up to some threshold constant. In order to achieve higher accuracy, SNE uses a gradient descent method to minimize the sum of Kullback–Leibler divergences [29] over all data points that incurs some cost. The cost function C is given by
C = i K u l l L e i P i C P i = i j p j | i log p j | i p i | j
where P i is the conditional probability distribution over all other data points given the data point a i , and C P i is the conditional probability distribution over all other mapping points given map point a j . The only parameter to be measured is the Gaussian variance σ i . Since it is practically not possible to consider a single optimal value for all data points, density measure tends to change in the overall data. Furthermore, the value of σ i varies from one region to another in the data set, i.e., for dense regions, σ i tends to have more smaller values than sparse regions. In order to calculate the appropriate value of σ i , the probability distribution P i is assumed to be uniform over all data points. It is noteworthy that while assuming the probability distribution, one has to take care of the entropy value, since this value tends to increase as σ i increases. Therefore, a binary search is performed by SNE in order to calculate the value of σ i for defining P i with a fixed perplexity (or entropy) specified by the user. The entropy value can be interpreted as the number of effective neighboring data points found and is mathematically calculated by
E n t r P i = 2 H ( p i )
where H(pi) represents Shannon entropy [30], defined as
H P i = j p j | i l o g 2 p j | i .
It is noteworthy that if the noise in the variance tends to vary gradually in the critical area where the global structure of the data set exists, SNE searches for the mapping function in order to retain the global structure.

3. t-Distributed Stochastic Neighbor Embedding (t-SNE)

t-distributed stochastic neighbor embedding (t-SNE) [17] is a widely used non-linear dimensionality reduction technique for visualizing high-dimensional data with clear and perfect separation, in the two (or three) dimensional plane. The t-SNE algorithm works in two phases. First, a probability distribution is estimated among the pairs of high-dimensional data points in such a way that similar objects are assigned a high probability of being selected and dissimilar points are assigned small probability of being chosen. Second, t-SNE assigns a uniform probability distribution model in the low-dimensional map by minimizing the Kullback–Leibler divergence [29] as discussed in above section. Pseudo code for t-SNE is presented in Algorithm 1 [17].
Algorithm 1: t-Distributed Stochastic Neighbor Embedding [17]
Data: data set X = x 1 , x 2 , x 3 , …, x n
 cost function parameters: perplexity Perp
 optimization parameters: number of iterations T, learning rate h, momentum a(t).
Result: low-dimensional data representation Y T = y 1 , y 2 , y 3 , …, y n
begin
 compute pairwise affinities p j | i with perplexity Perp (using Equation (1))
 set p i | j = p j | i + p i | i 2 n sample initial solution Y ( 0 ) = y 1 , y 2 , …, y n from N ( 0 , 10 4 )
for k 1 to N
 compute low-dimensional affinities q ij (using Equation (5))
 compute gradient δ C δ y (using Equation (6))
 set Y t = Y t 1 + η δ C δ Y + α t ( Y t 1 Y t 2 )
end
end
t-SNE has been widely used for visualization of high-dimensional data from a wide range of applications in different domains such as cyber security research [31], analysis of musical notes [32], cancer research [33], and bioinformatics [34]. Furthermore, t-SNE has been used to visualize artificial neural network-trained high-dimension data [35].
We modified the standard t-SNE by embedding Euclidean pairwise distance calculations from multiple independent spaces with a single degree of freedom, because it has the particularly nice property that ( 1 + ( y i y j ) 2 ) approaches a square law for large pairwise distances ( y i y j ) in the low-dimensional map. Assuming a Gaussian distribution, the joint Euclidean distance can be calculated as
q ij = ( 1 + ( y i y j ) 2 ) k i 1 + ( y k y l ) 2 ) .
The gradient of the Kullback–Leibler [29] divergence between the the two independent spaces and is given by
δ C δ y i = j ( p ij q ij ) ( y i y j ) ( 1 + y i y j 2 ) 1 .
The authors of [36,37,38] claim that t-SNE plots may be seen as clusters. These visual clusters can be efficiently enhanced by regulating the appropriate parameters. In order to get the most efficient resulting clusters, one should have the correct information and understanding of the parameters of t-SNE. Furthermore, exploratory analysis and supplementary data may help to choose the correct parameters and validate the results [37,38]. The cluster structure produced by t-SNE tends to be more separated to have more stable shape and be more repeatable.

4. Motivation

As mentioned earlier, Urdu digits inherently share shape similarity, as shown in Figure 1. This issue of handwritten text makes the task of developing a system for visualization and recognition of handwritten text more challenging and complicated. Some other related issues are differences in writing style (even from the same author), image degradation, poor quality, and illegible handwriting. One of the major issues is the shape similarity in Urdu numerals, as shown in Figure 1. The figure shows that both the digits have almost same shape. The only difference is that the Urdu digit two has one arc while digit three has two arcs. This minute difference becomes a reason for incorrect classification of these two digits. Since the writers usually do not take much care while writing, it is possible for a writer to write ambiguous digits that are also not recognizable to human beings. In Figure 2 there are some sample images of handwritten Urdu digit three from our data set that looks like two. The purpose of this paper is to make use of an efficient visualization algorithm that produces the clusters with perfect separations.
This issue becomes more critical and challenging while trying to correctly visualize high-dimensional data from Urdu handwritten digits in low dimensions. The visualization of high-dimensional data with precise and clear separations helps in applying an appropriate classifier. The following factors motivate the researchers to undertake the research in this field.
  • First, there is dearth of research visualizing the high-dimensional data of Urdu handwritten text at character level.
  • Second, there is ambivalence as to whether to use the heterogeneous data fusion from multiple data sources while visualizing high-dimensional data.
  • Third, there is need to enhance the visualization of Urdu handwritten digit data by increasing the inter-cluster separation.

5. Our Approach

In order to evaluate the performance of t-SNE, a series of experiments was performed on Urdu handwritten numeral data set. To our knowledge, there is no publicly available standard data set for handwritten Urdu numerals. That is the reason we also created a novel data set of handwritten numerals, by inviting authors of different ages and professions, as mentioned earlier. A detailed discussion is also given below. The performance and results produced by t-SNE were compared with two classical non-parametric dimensionality reduction techniques, namely PCA [19] and AE [28]. Furthermore, the standard algorithm of t-SNE was modified by introducing novel approach of using a pairwise fusion matrix of Euclidean distances from multiple independent spaces. The fusion matrix embedded with t-SNE locates each data point in a two or three-dimensional map in a very different way and focuses on preserving the local distances of the high-dimensional data in low-dimensional space. The results of our experiments show that t-SNE outperformed the existing techniques for dimensionality reduction of high dimensional data.

5.1. Dataset

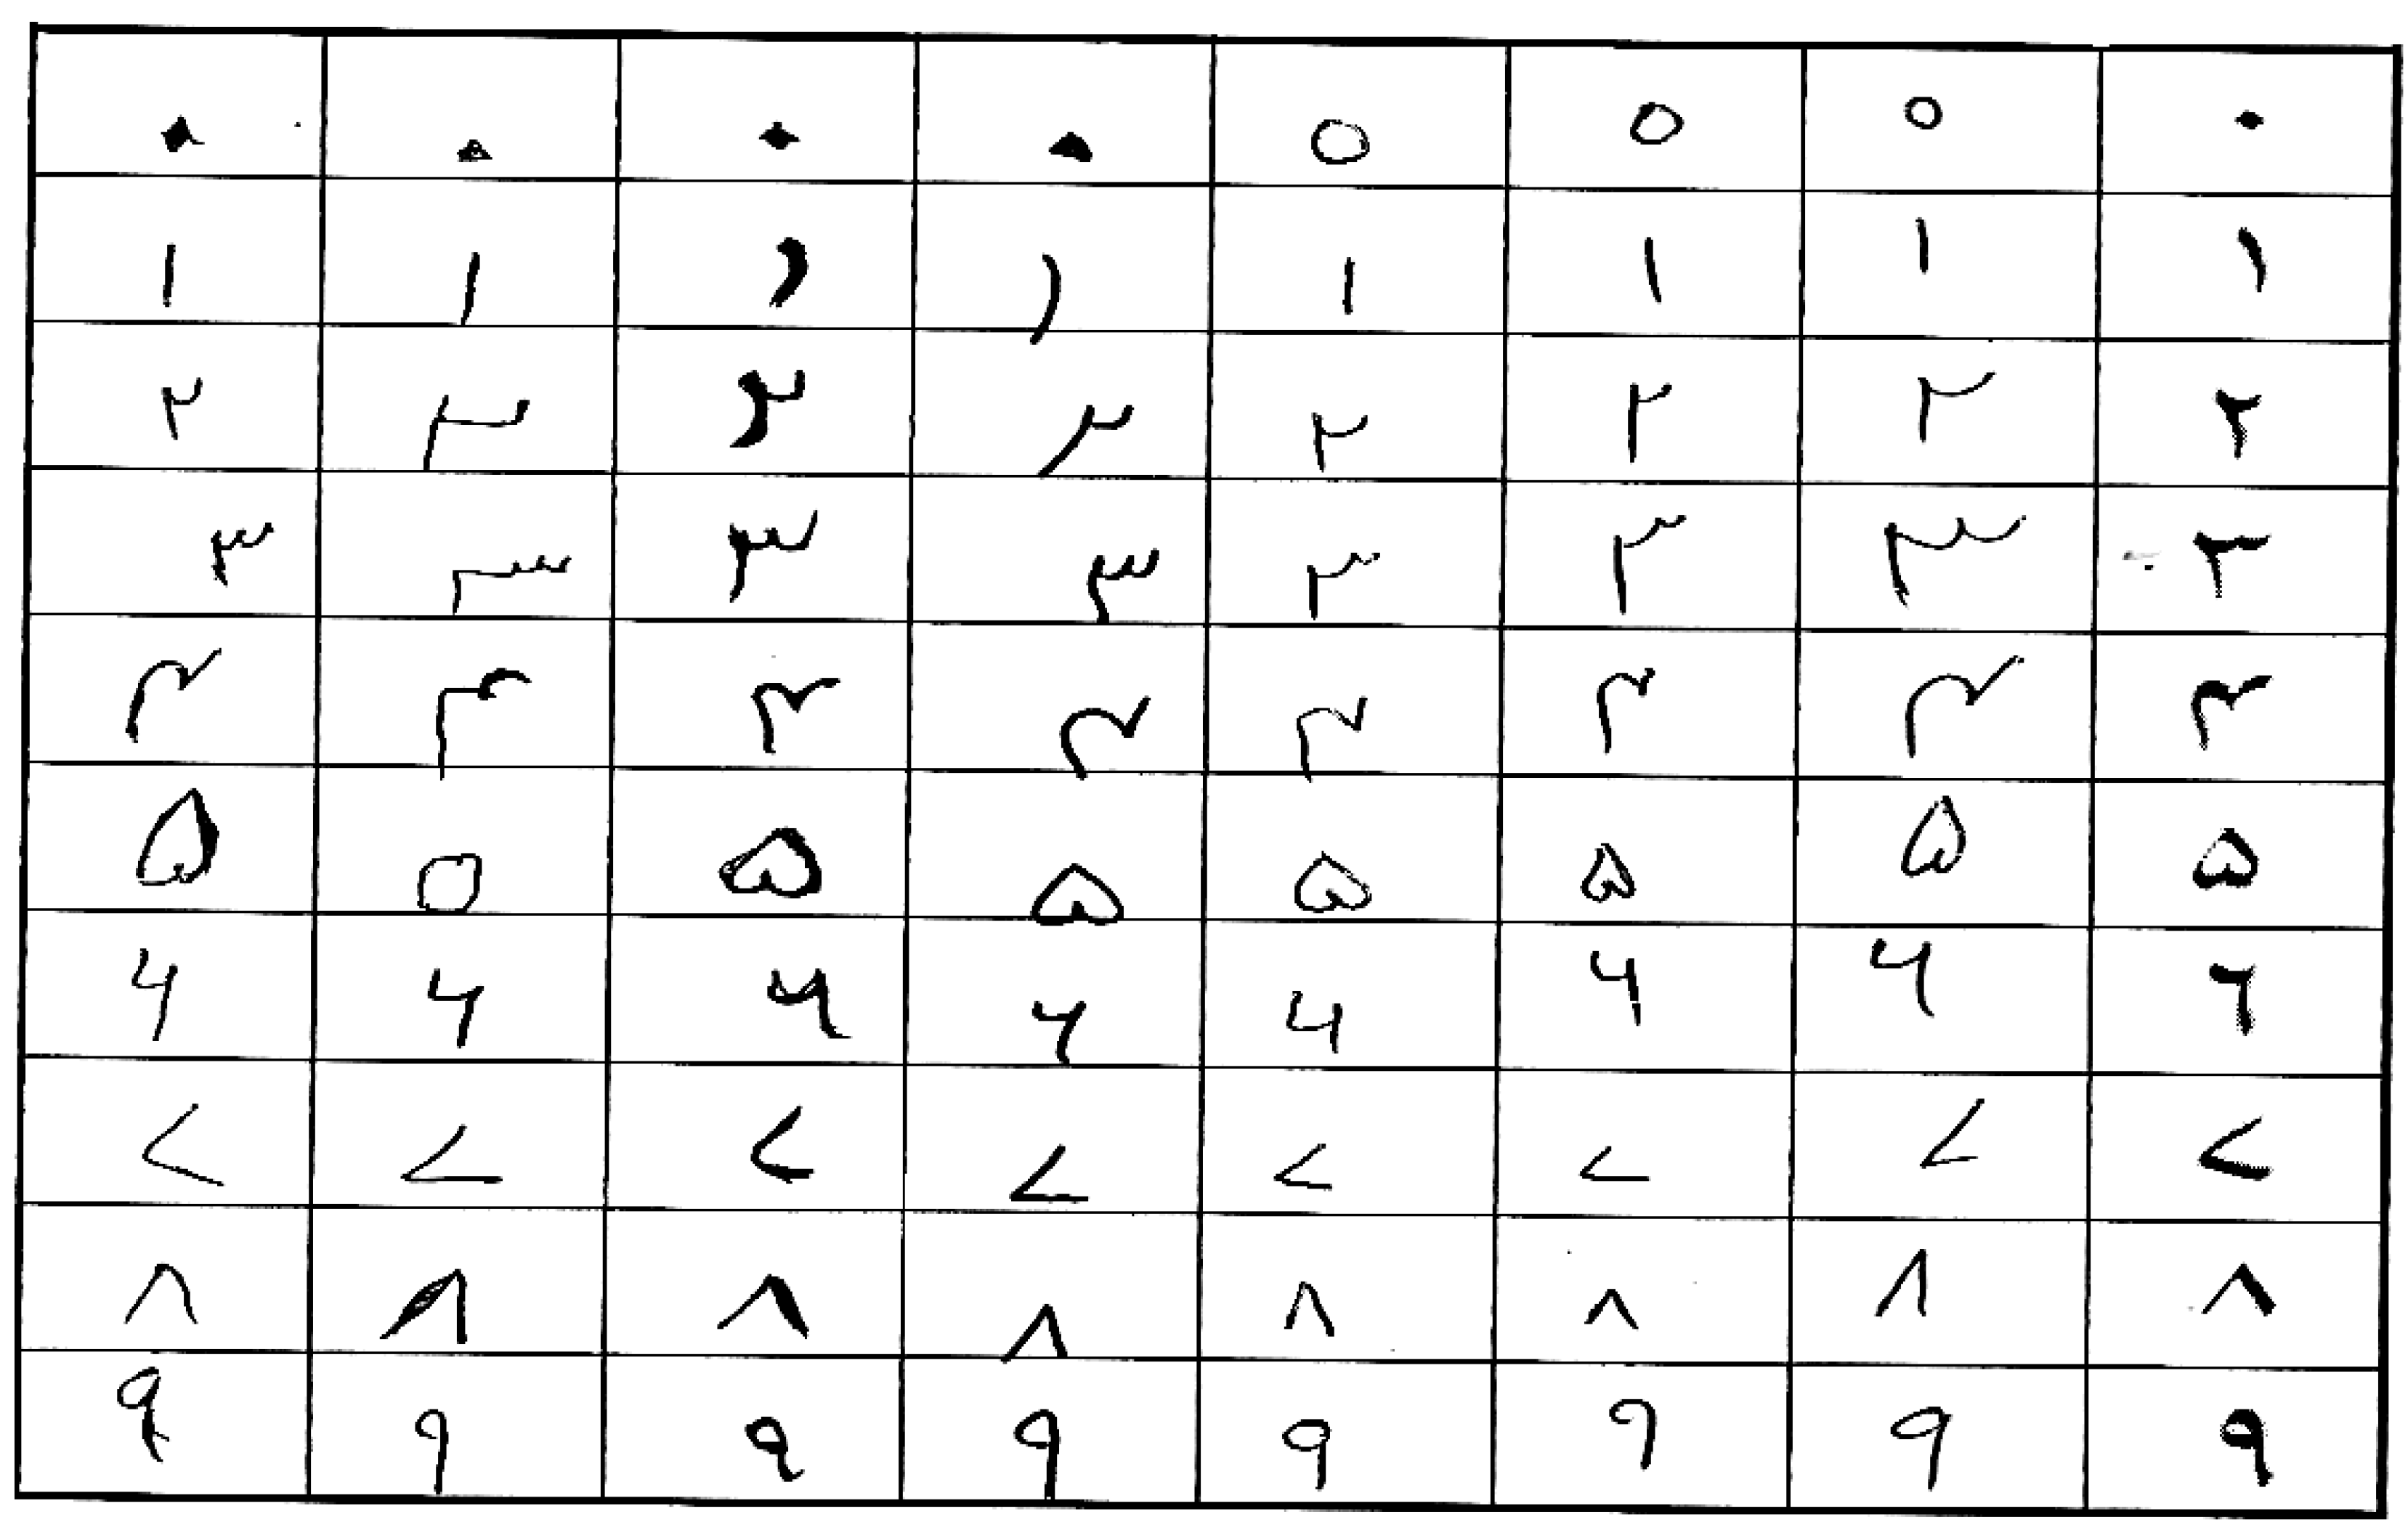
We developed a novel dataset of Urdu handwritten numeral digits, since there is no public standard available dataset of Urdu numerals. Our dataset contains 800 images of each of ten numerals. The data set was built by inviting 500 native Urdu speakers from different social groups. Each author was directed to write 10 numerals each in his or her own handwriting in Nastaliq font in a column, as shown in Figure 3. The necessary information about each author e.g., age, gender, hand preference while writing (left hand/right hand or both), physical impairment (if any), and profession, were also recorded. After dataset collection, the text pages were scanned on a flatbed scanner at 300 dpi and segmented into images of 28 by 28 for each Urdu handwritten numeral data. As mentioned earlier, the dataset consists of 800 × 10 = 8000 images, out of which we selected 5000 (500 each for the ten numerals) images for our experimental work. We plan to increase the number of authors to 1000 later in order to enrich the dataset by adding as many variations of handwriting as possible. On completion of the dataset, we will make the dataset publicly available to researchers.
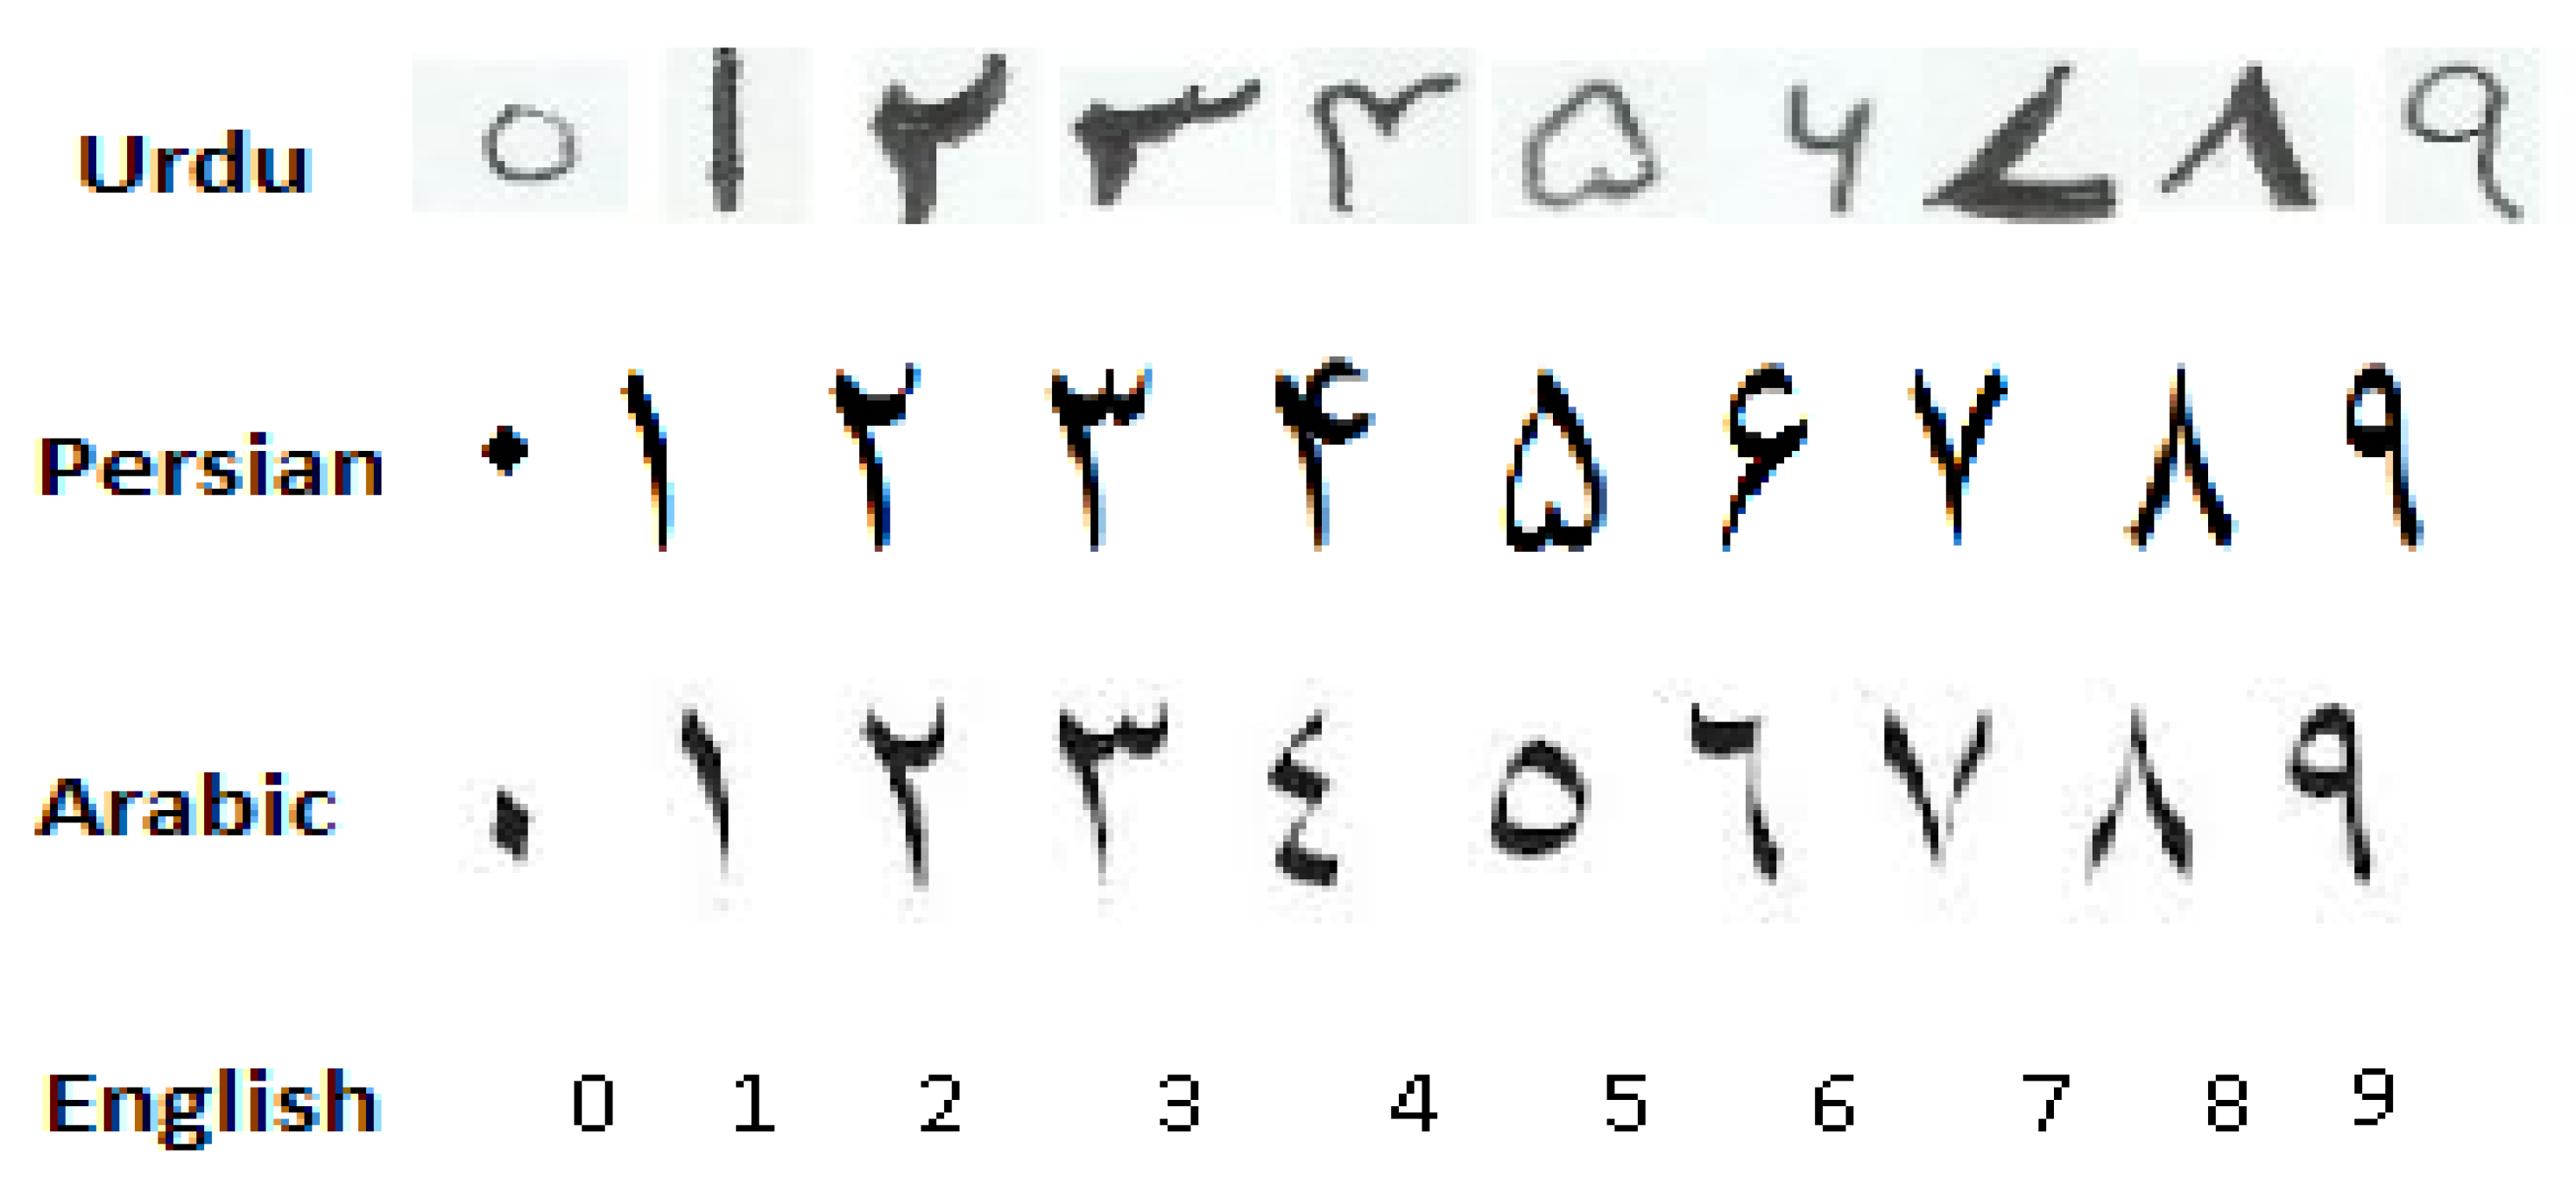
Since the handwritten text was scanned, noise may occur that needs to be removed. We note that while preparing the dataset the authors were requested to use black ink to write the numerals, therefore all the colors other than black are considered as noise and thus removed from the image. In order to make use of t-SNE, we applied some preprocessing steps to transform the dataset into an appropriate form. Normally these steps included noise removal, gray-scale conversion, resizing the text image and image segmentation to extract the area of interest from the image. The images were then converted in binary form in order to normalize the raw data. Figure 4 shows a sample of our Urdu handwritten numeral dataset and its equivalent Arabic, Persian, and English digits.
As discussed earlier, one of the challenging issues in Urdu handwritten numerals is to learn each shape of every numeral, since these numerals share shape similarity, for example digits two and three. In order to solve this problem, raw pixel-based information dealt with the issue of shape similarity among Urdu numerals. It is clear from Figure 4 that Urdu, Persian, and Arabic digits are quite similar to each other in shape, with the exception of some digits. Therefore, our approach is equally applicable to Arabic and Persian digits, with some minor changes.

5.2. Experimental Setup and Results

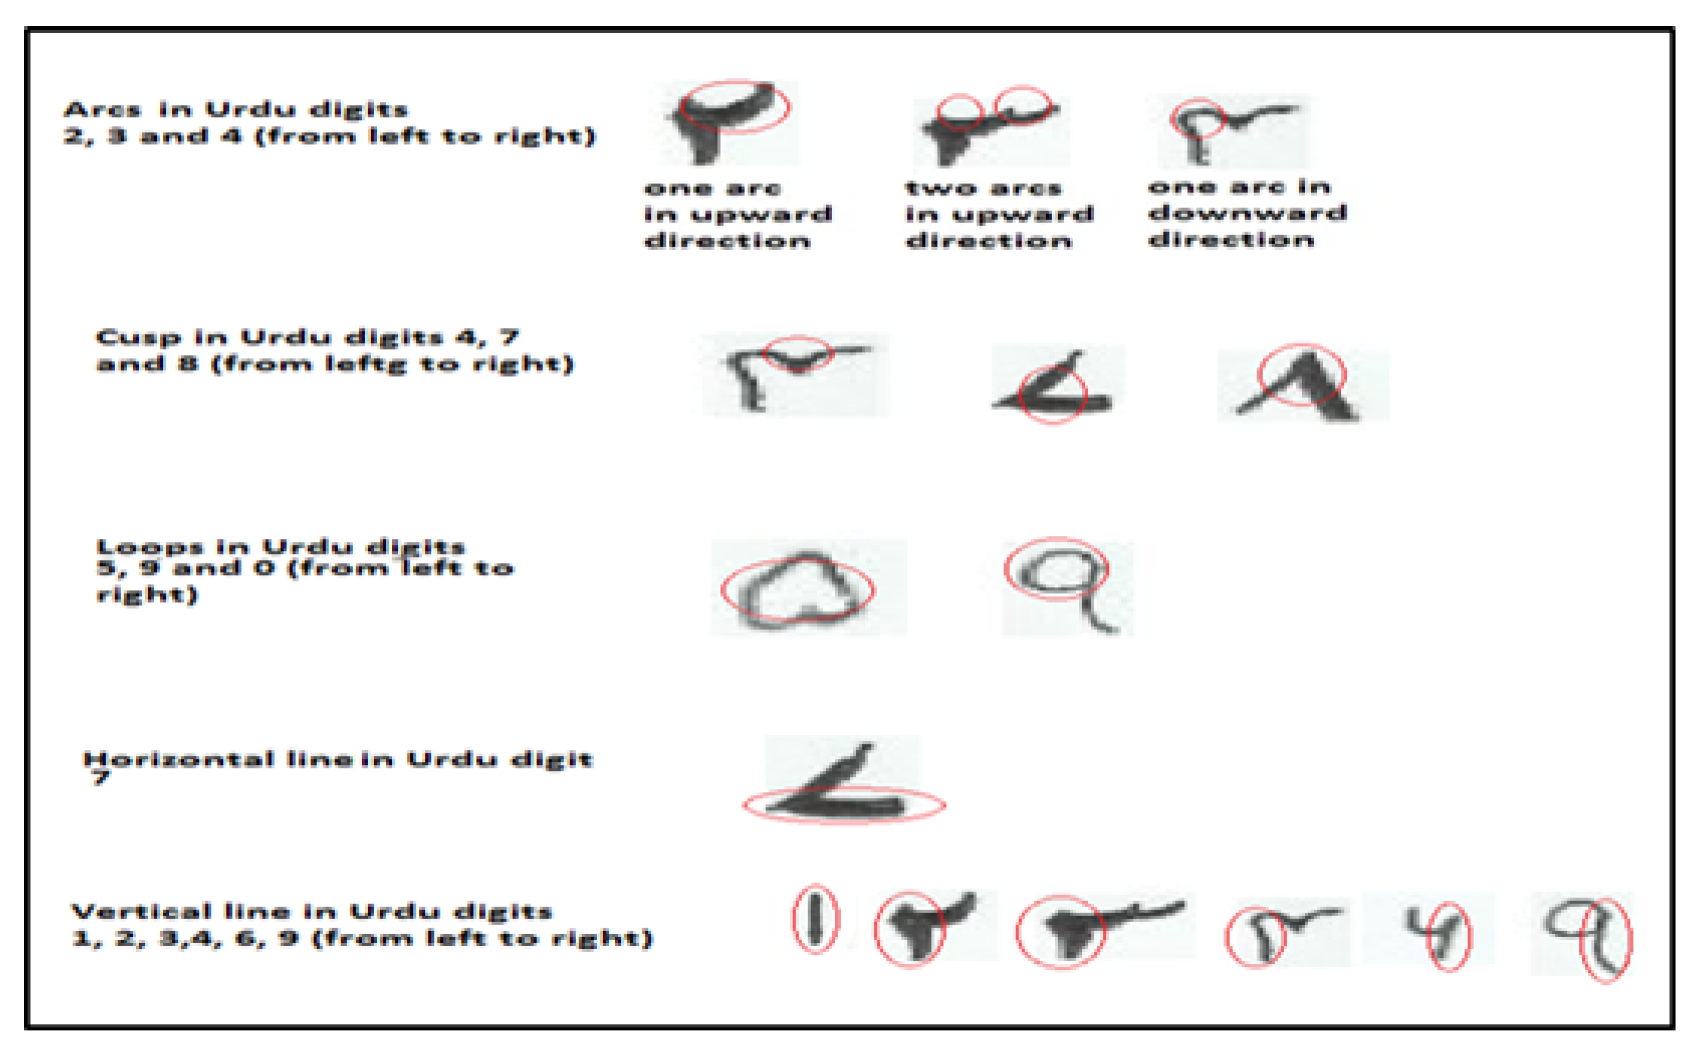
In our experiments, we considered two variants of the dataset: The first variant only considered pixel-based features extracted from images, whereas the second variant not only considered pixel-based features but also structural features extracted from the images. The structural features may include the existence of full loops/arcs, number of arcs, arcs opening direction etc. For example, the Urdu numerals two and four have arcs but their opening side direction is upward and downward, respectively; similarly numerals two and three have upward opening arcs but they differ in the number of arcs.
In our dataset, each of the images in our data set is represented as 28 × 28 = 784 pixel values (or dimensions). We applied three dimensionality reduction techniques, namely principal component analysis (PCA) [22], autoencoders (AE) [28] and t-SNE [21] to our handwritten Urdu digits dataset. For all the visualization results presented in this paper using t-SNE and its variant, the parameter setting process for the optimization was as follows: the number of gradient descent iterations T was set to 1000, the momentum term was set to α (t) = 0.5 for t < 250 and α (t) = 0.8 for t ≥ 250. The learning rate η was initially set to 100 and updated after every iteration by means of the adaptive learning rate scheme. Experiments were also performed with varying initial learning rates, but not much variation was observed in the quality of visualization results. Furthermore, as explained in the original t-SNE paper, the perplexity can be taken as a smooth measure for the effective number of neighbors. Selecting an optimal value of perplexity is not trivial and can only be determined empirically ny varying perplexity values to generate multiple visualizations; based on the quality of visualization, the best result is chosen. It is also noteworthy to mention that standard t-SNE and its variant proposed in this paper both work on an assumption of a single perplexity value for the whole dataset. The results obtained by standard t-SNE on our data sets are discussed in the following subsection.

5.3. Applying Standard t-SNE

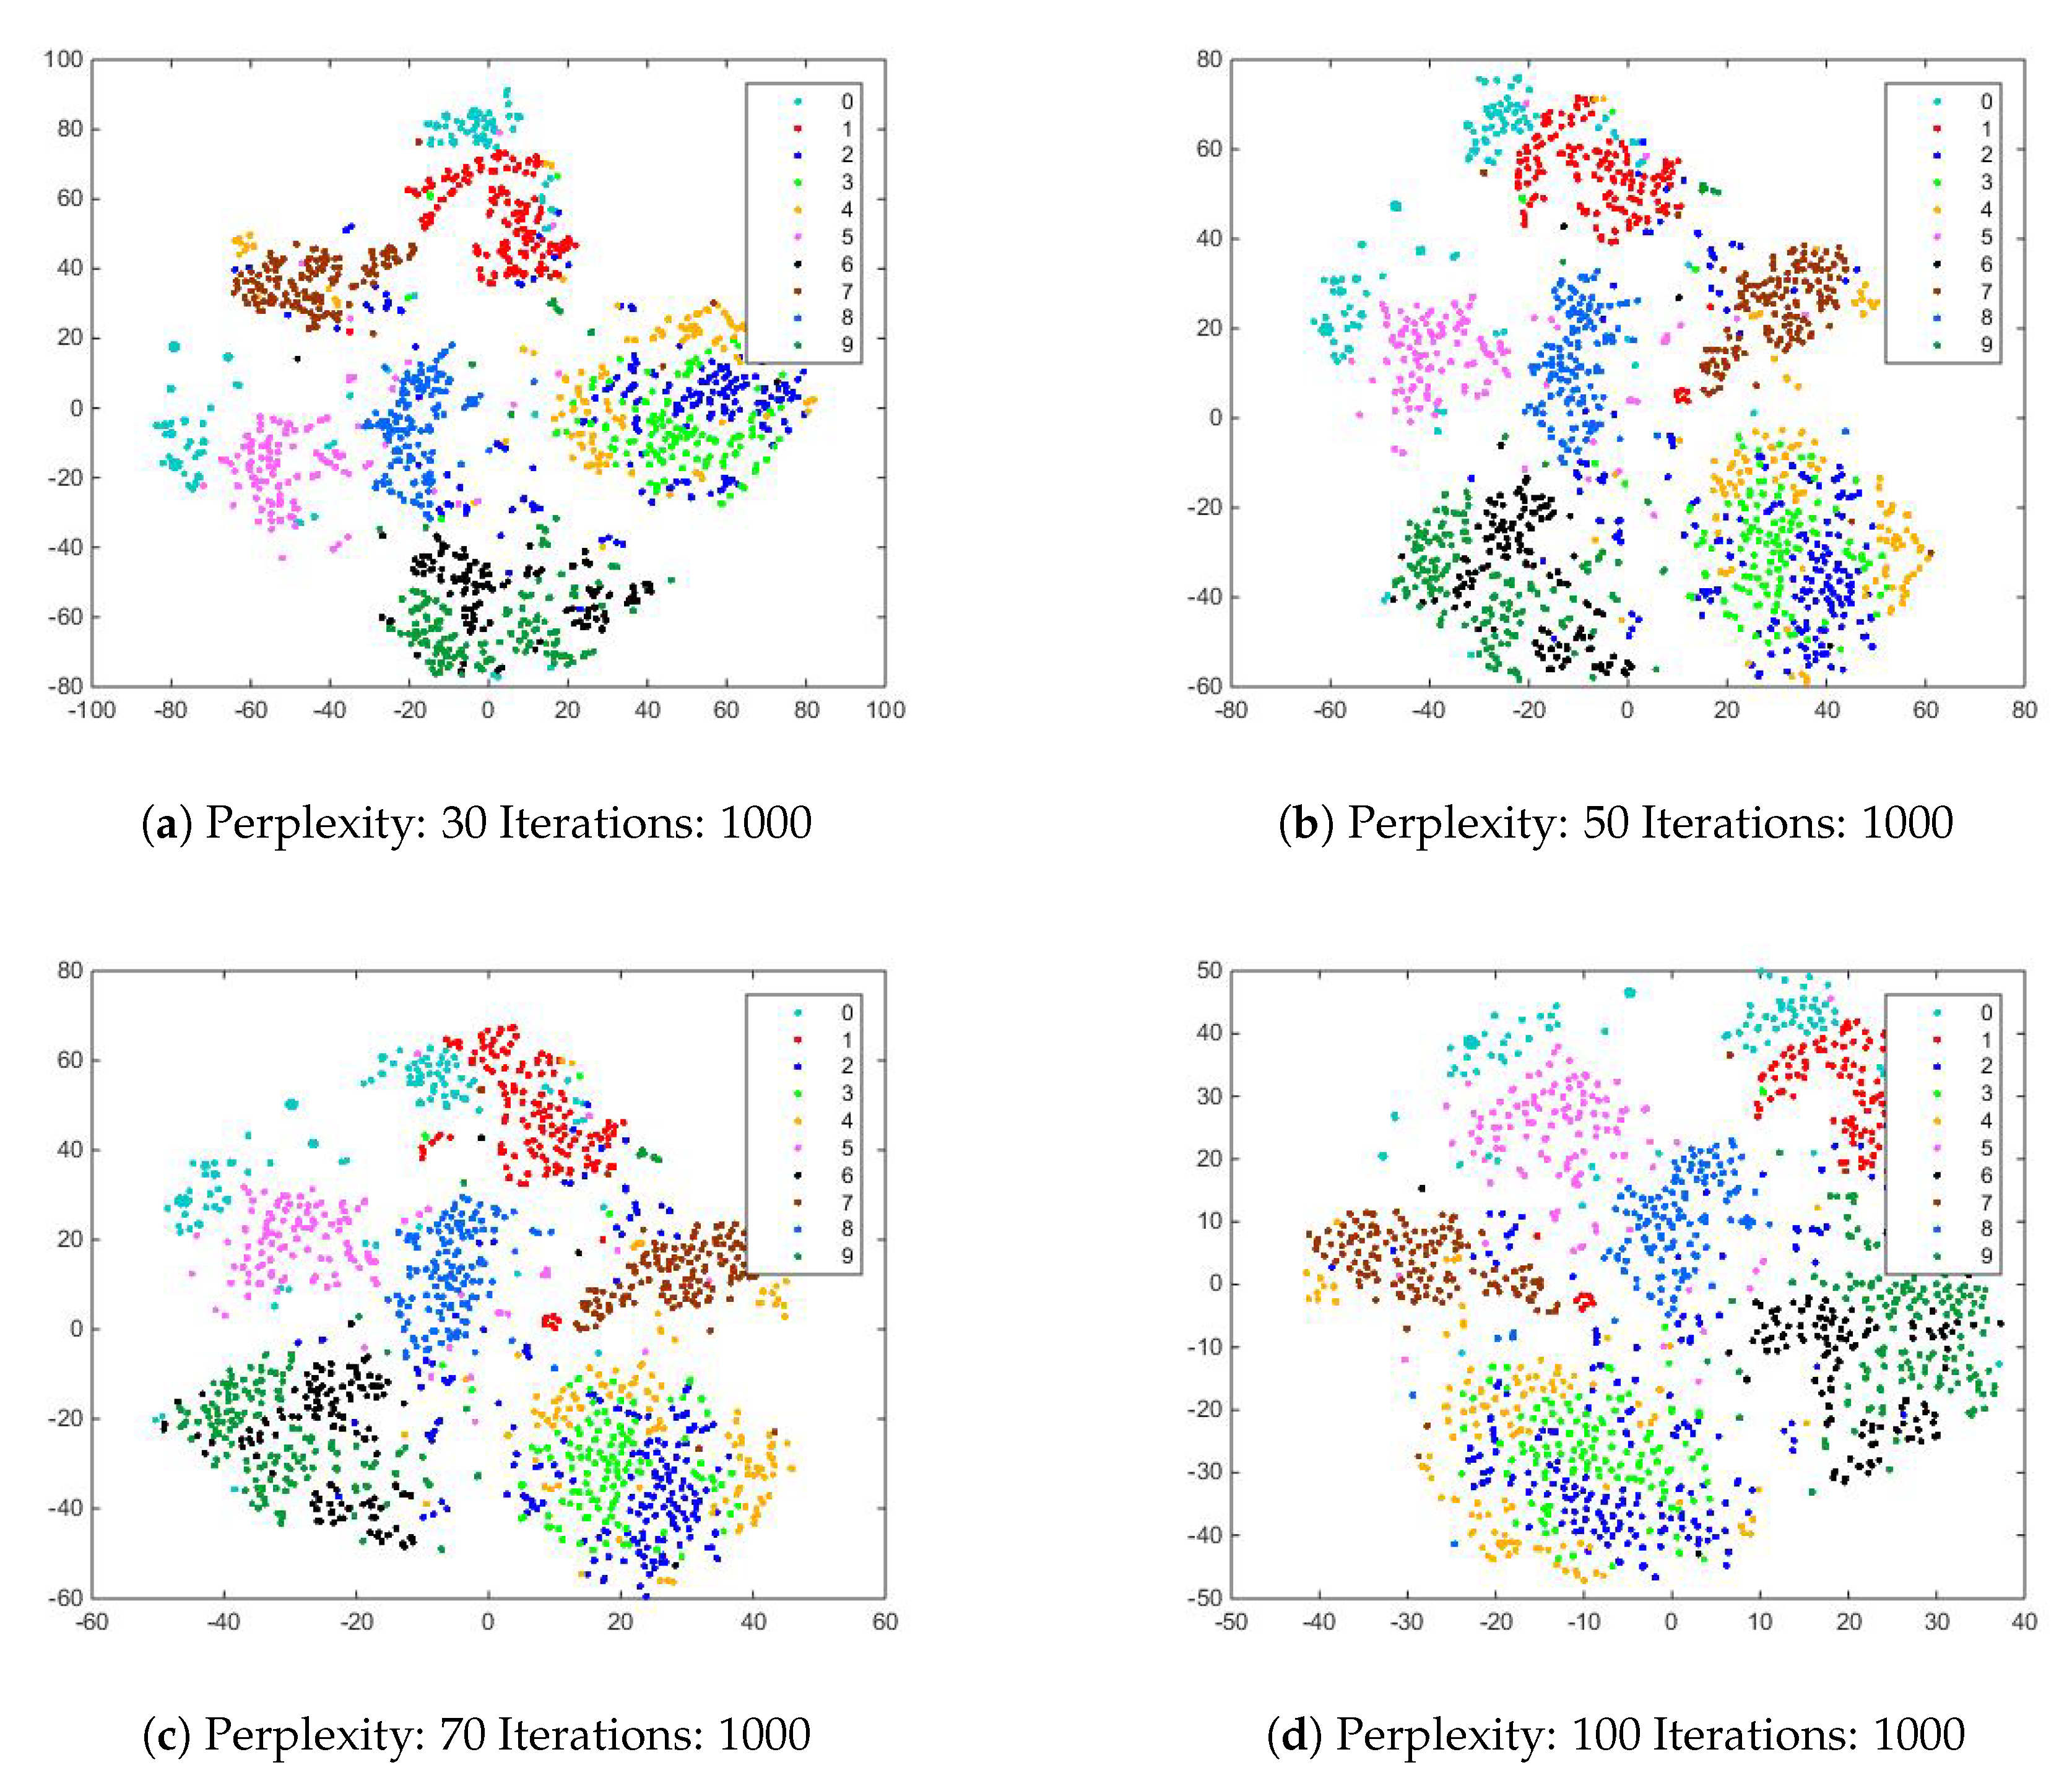
In Figure 5, we show the results of standard t-SNE on a dataset having pixel-based data of Urdu handwritten numerals. The results show that visualizations using pixel-based data does not demonstrate clear separation between clusters of handwritten numerals. t-SNE based visualizations were also performed with multiple perplexity values (see Figure 5). The results with a perplexity value of 70 are slightly better in terms of separation between each numeral cluster compared with results having perplexity values such as 30, 50, 100.
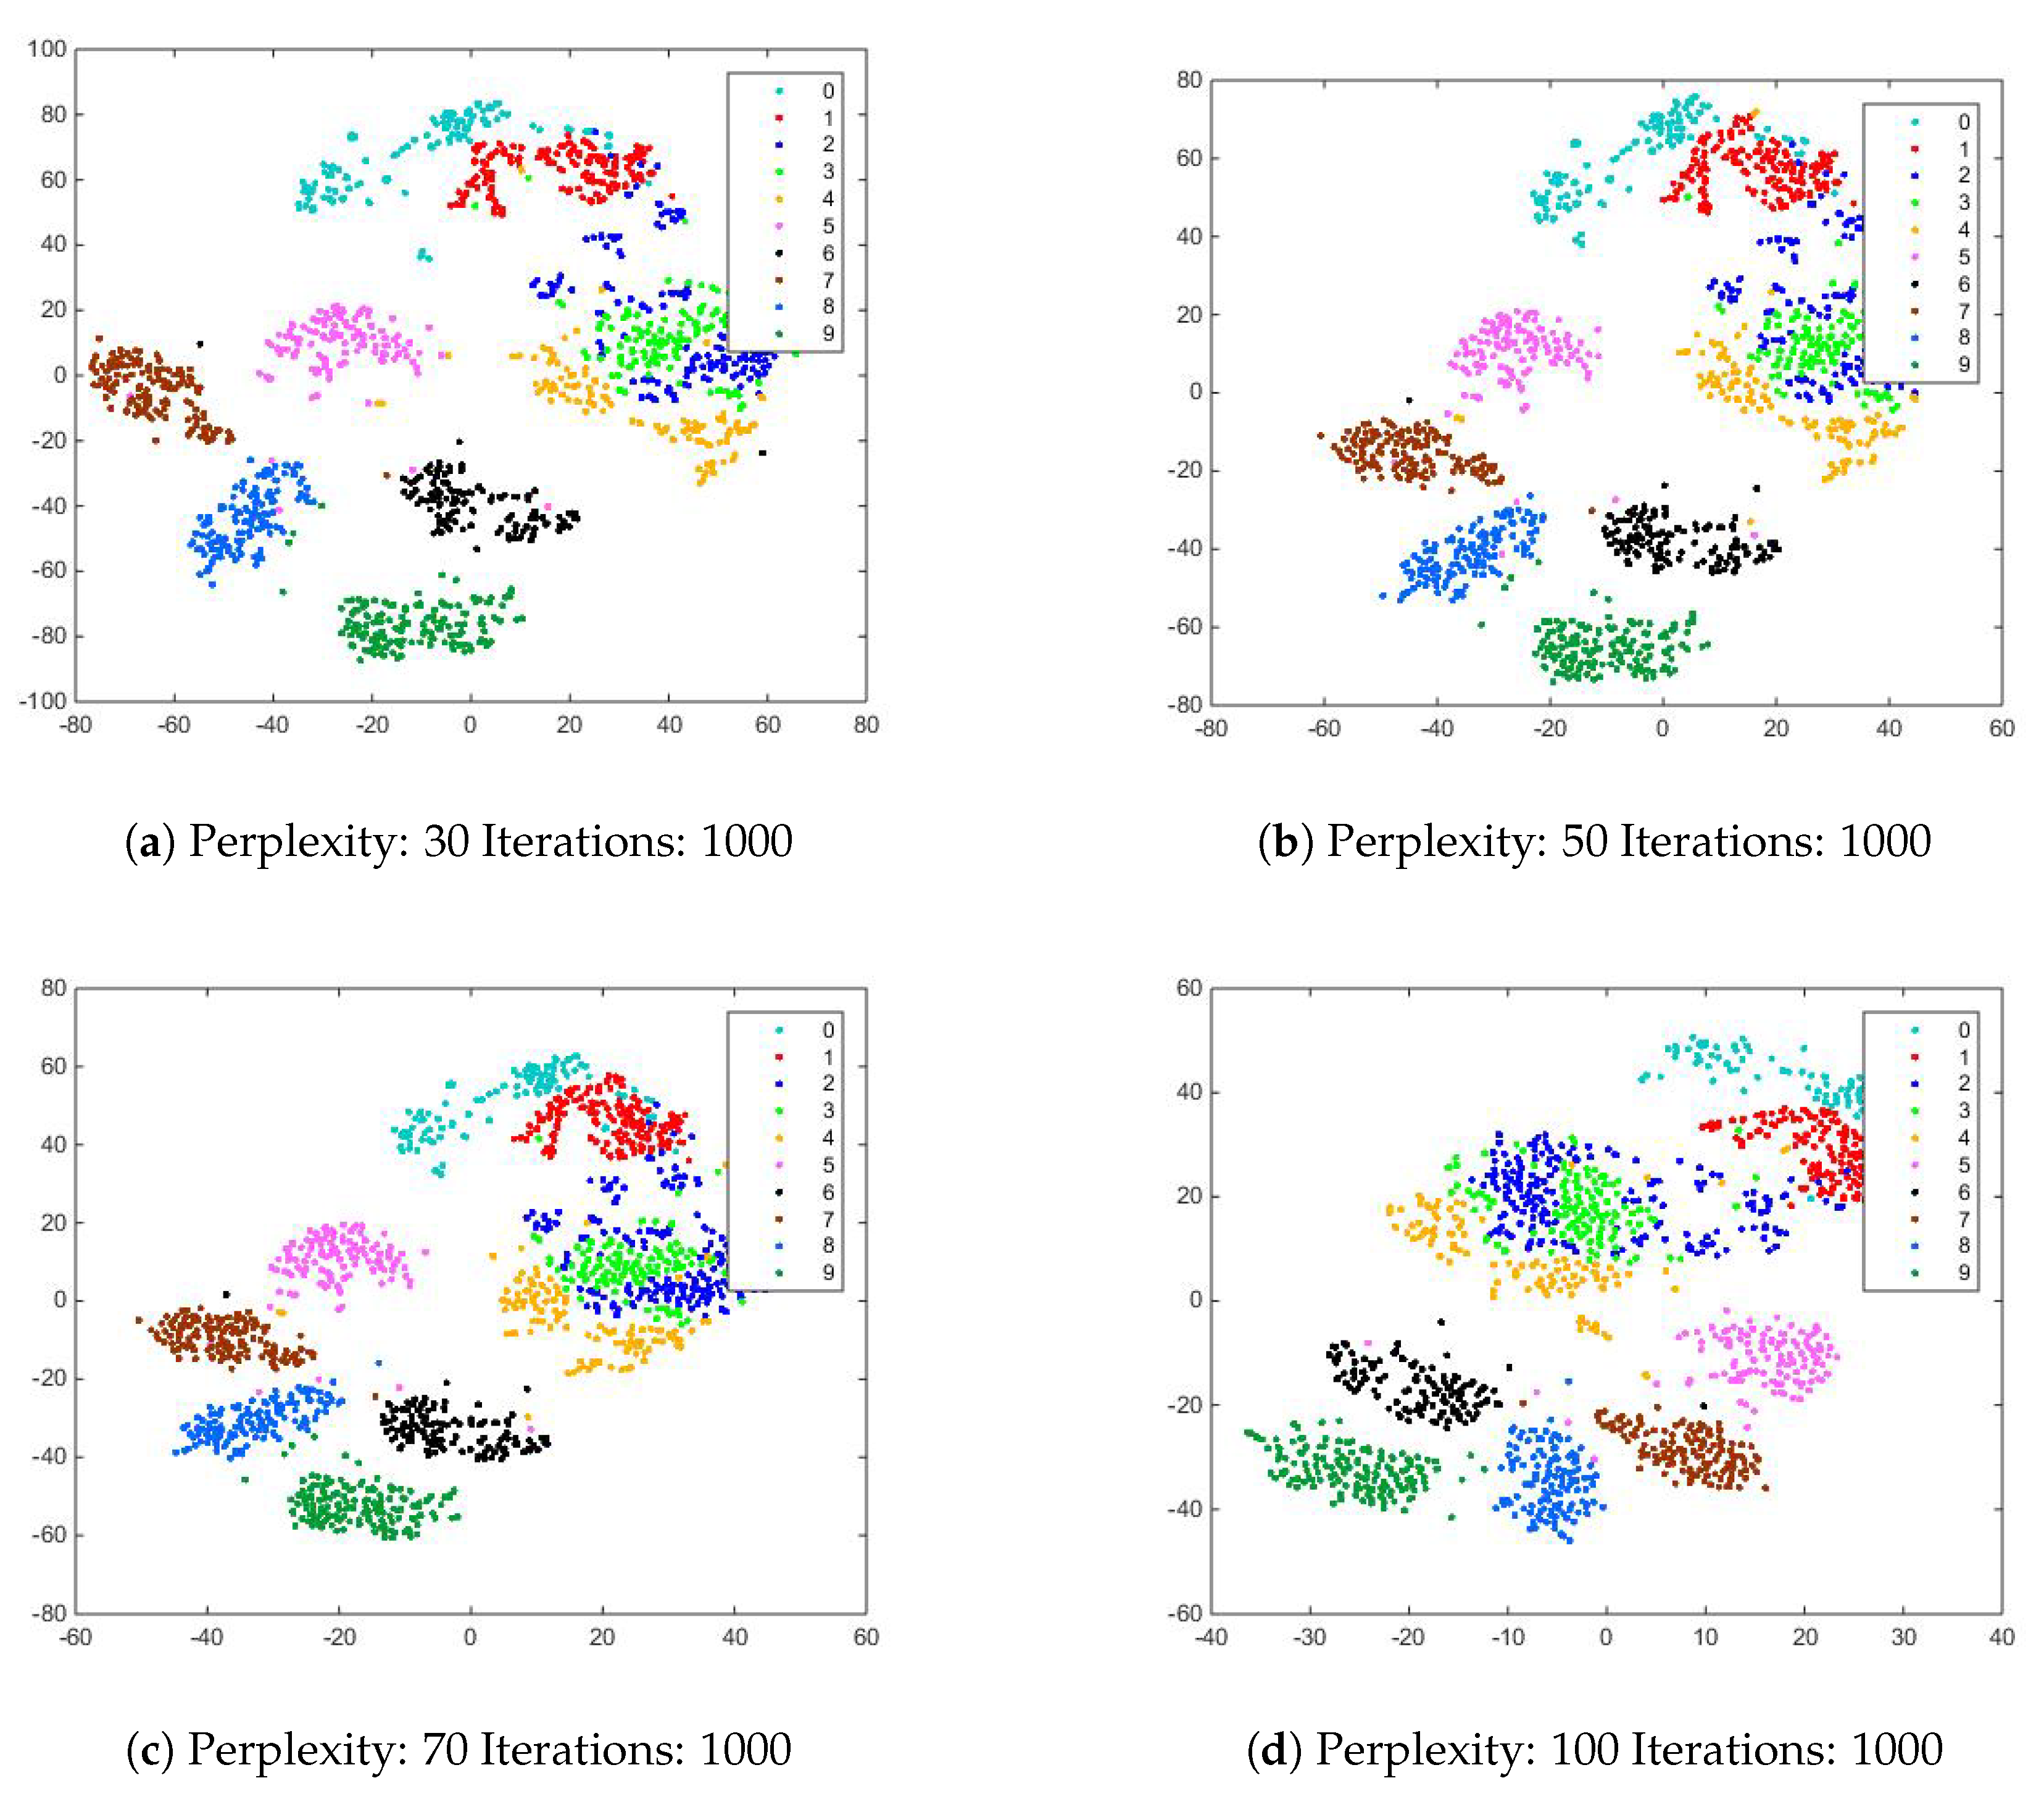
In general, it is observed that lower the perplexity value, the more local structure is preserved (having compact clusters with small number of data points in each cluster); and with higher perplexity more global structure is preserved (more sparseness between samples of a cluster and separation between clusters). Figure 6 show results for the dataset having pixel-based and structural features in combination, demonstrating much improvement with clear separate clusters. However, it was observed that some numerals like 2, 3 and 4 have overlapping clusters and likewise the same behavior was observed for 0 and 1. Combining pixel-based (i.e., 784 features) and structural features (i.e., 10 features) did not prove to be useful with standard t-SNE.

5.4. Fusion Matrix

The standard t-SNE does not allow to combine two independent feature spaces in a way that considers their contribution equally. This situation raised the need to combine two feature spaces in such a way that both feature spaces have an equal contribution. In order to achieve this objective, we proposed a fusion matrix containing Euclidean distances of two or multiple observation spaces, to work in combination with t-SNE. The following subsection discusses the results of t-SNE with a fusion matrix for Urdu handwritten numerals. In this paper, we propose a pairwise Euclidean distance based approach for these two independent spaces (pixel-based and structure-based) embedded in t-SNE for high dimensional data clustering. In order to achieve this, we fused the pixel-based and structure-based data for each image to make a single matrix of the dataset. As mentioned earlier, in our case the data from both the sources has complementary and correlative information, so their fusion leads to higher accuracy in visualizing the high-dimensional data in low-dimensional space, compared to using either textual content or structural data alone. Furthermore, we have combined the winning unit for both the spaces by calculating the minimum value in the set of fused Euclidean distances (Equation (7)). As a result, two independent spaces are fused into a single space, so that both of the independent original spaces contribute equally. The weighted combinations of both of the independent original spaces can be varied, but in our case we have assigned equal weight to both spaces.
E u c l i d f u s e d a , b = α t E u c l i d P S a , P S m a p b + 1 α t E u c l i d ( S S a , S S m a p b )
Equation (7) helps in exploiting the similarities in both the contextual (pixel space values, PS) information and structural space (SS) values in a very straightforward way. Here α is the relative weight between the similarities of both the independent space values and t represents the epoch number during the dimensionality reduction. In our work, the value of α is set to 0.5 in order to assign equal weight to both of the independent spaces. The purpose of assigning equal weight is to determine the common successful unit by locating the minimum in E u c l i d f u s e d ( a , b ) . Equation (7) is modified in order to get the product of the normalized Euclidean distances of the two independent spaces. This helped to greatly improve the results, by increasing the intercluster separations while visualizing in low dimensions.

5.5. Experimental Results of PCA, AE and Modified t-SNE

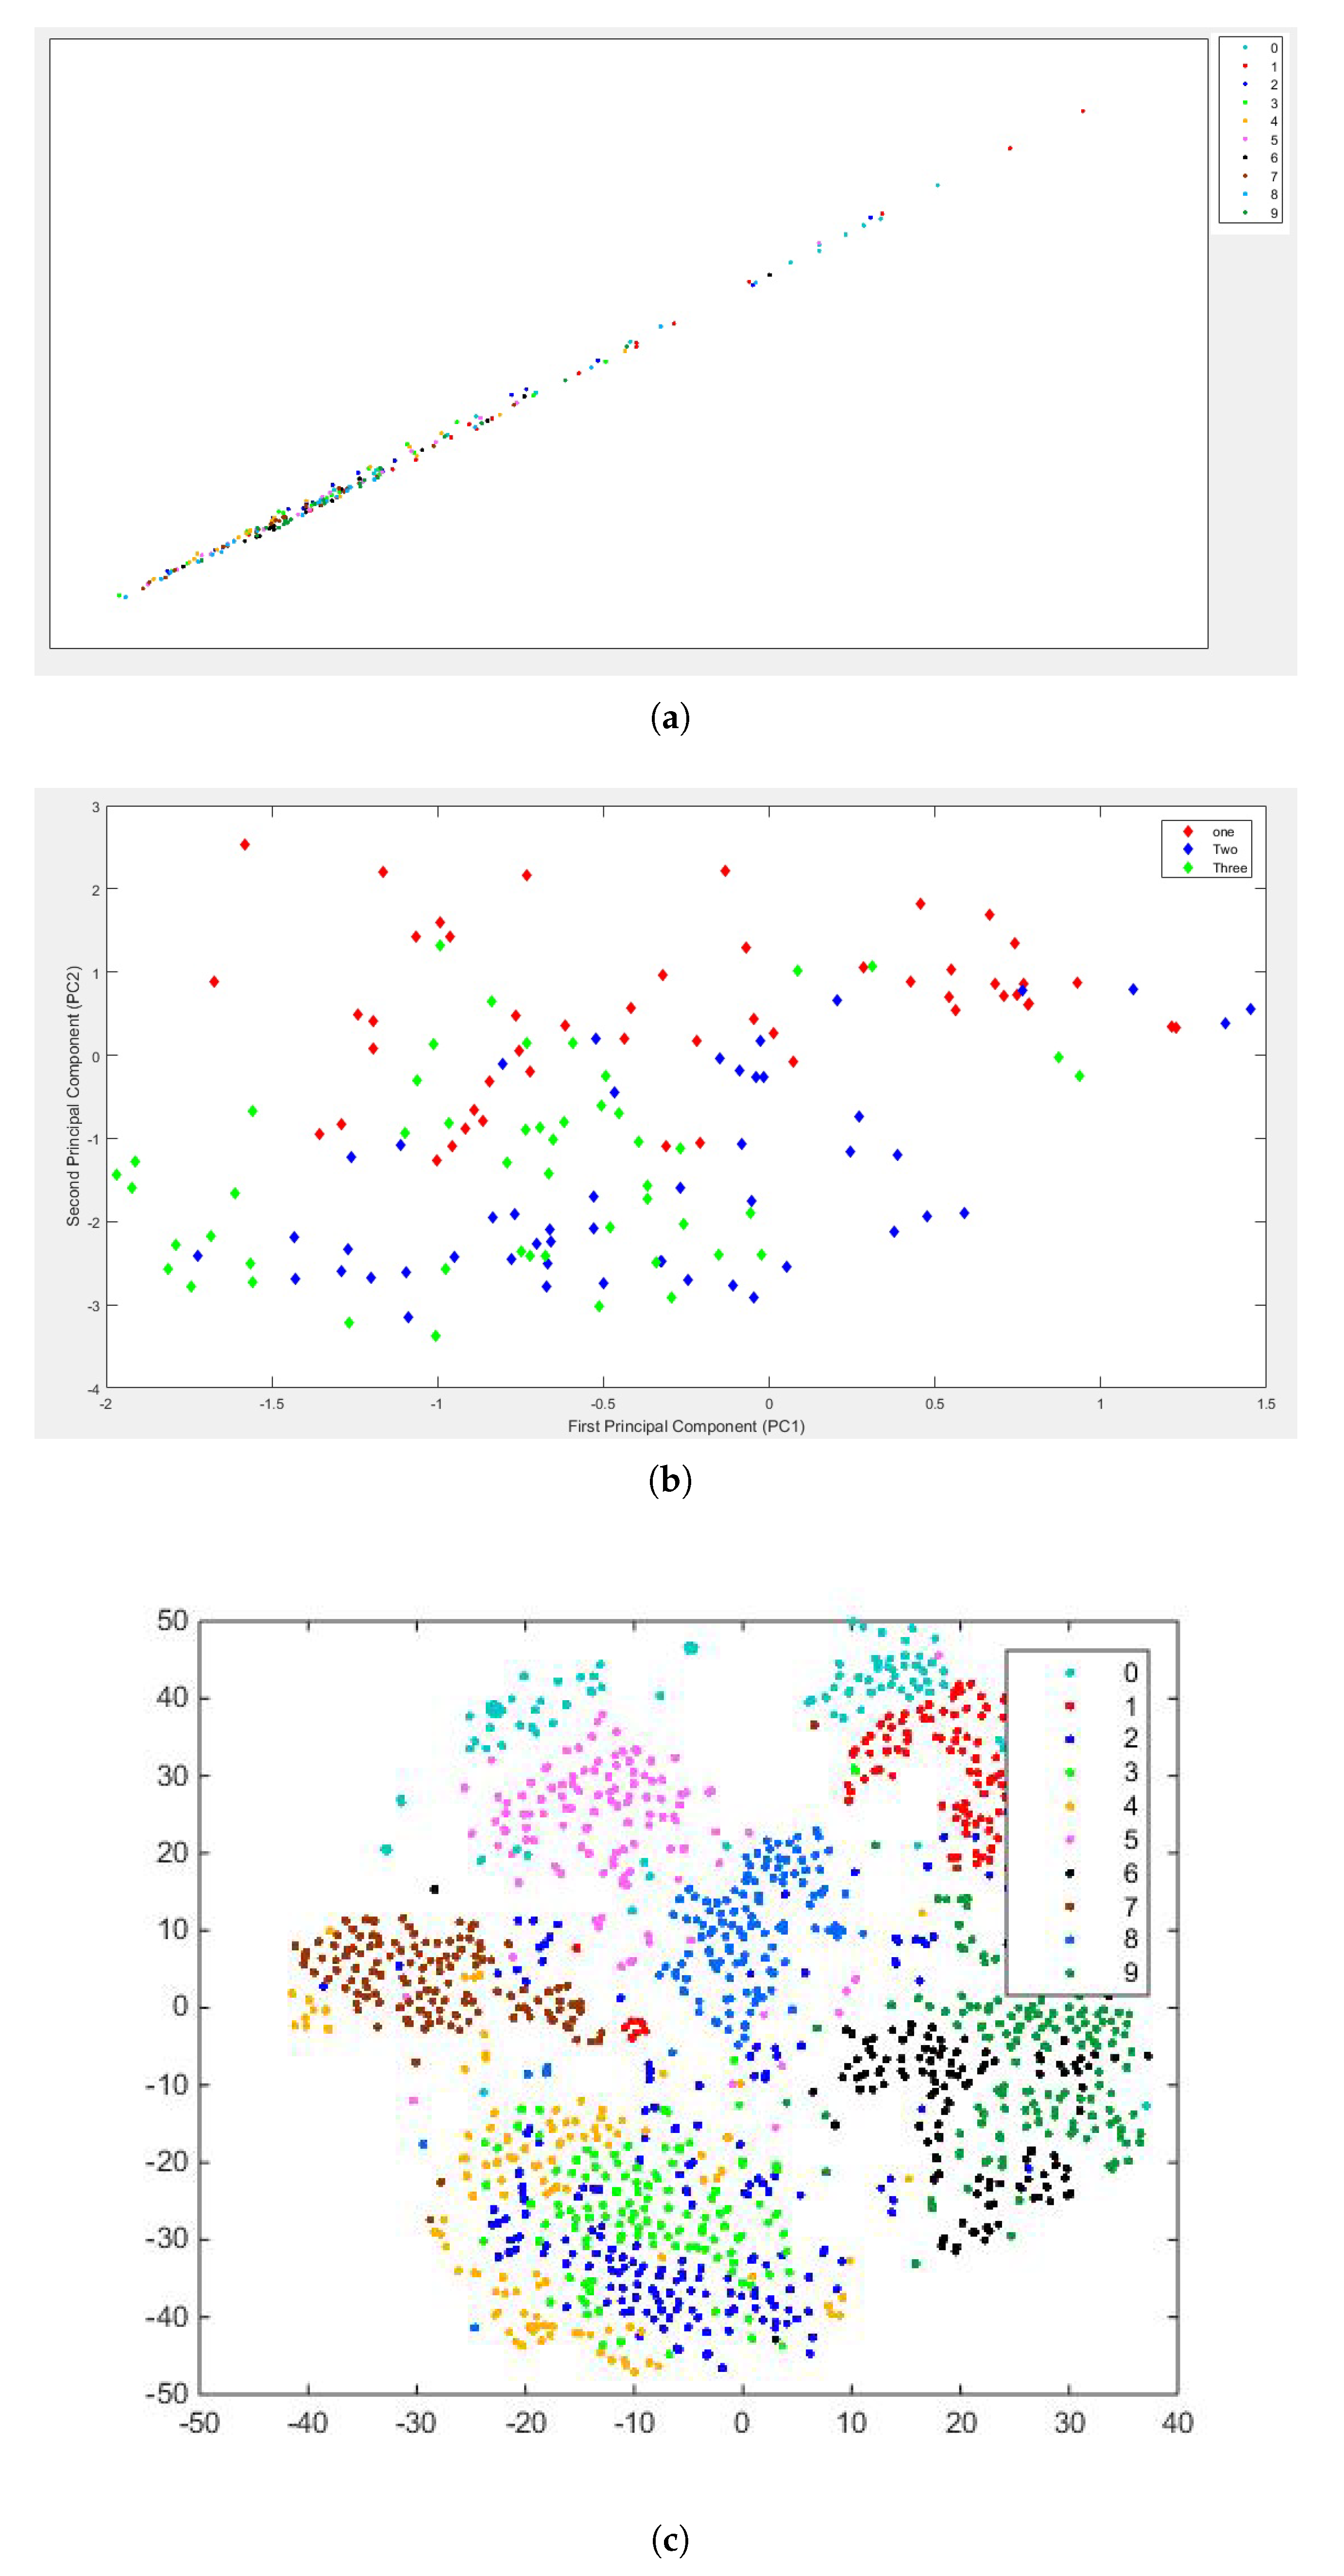
It is clear from the results (Figure 7) that t-SNE outperformed the other two techniques in visualizing the Urdu handwritten numerals using pixel-based data. It is noteworthy that in our dataset, we have also mentioned the class information (or label) of each data point that is used only in selecting the appropriate color (or symbol) for the scatter plot. The coloring of data points in the plot helps in evaluating the similarities within each class.
The AE [28] mapping algorithm provides a straight line in the scatter plot (Figure 7a) that failed to show any separation between numeral clusters. Similarly, the results generated by PCA (Figure 7b) show large overlapping among the numeral clusters. For PCA [19], we show the scatter plot of the first three numerals in order to reduce the ink-noise ratio. In contrast, the map constructed by t-SNE (Figure 7c) shows better clustering of the classes than AE [28] and PCA [19]. Furthermore, t-SNE mapping has also retained much of the local structure of the high-dimensional data while visualizing the data points. It is noteworthy while using t-SNE, some data points are also grouped in the wrong classes. This is due to having some distorted handwritten numeral images that are also difficult for a human to identify. Some of the reasons of distortion in handwritten numeral images are different writing styles, even from the single author, shaky and jagged style of writing, and sloppy writing.
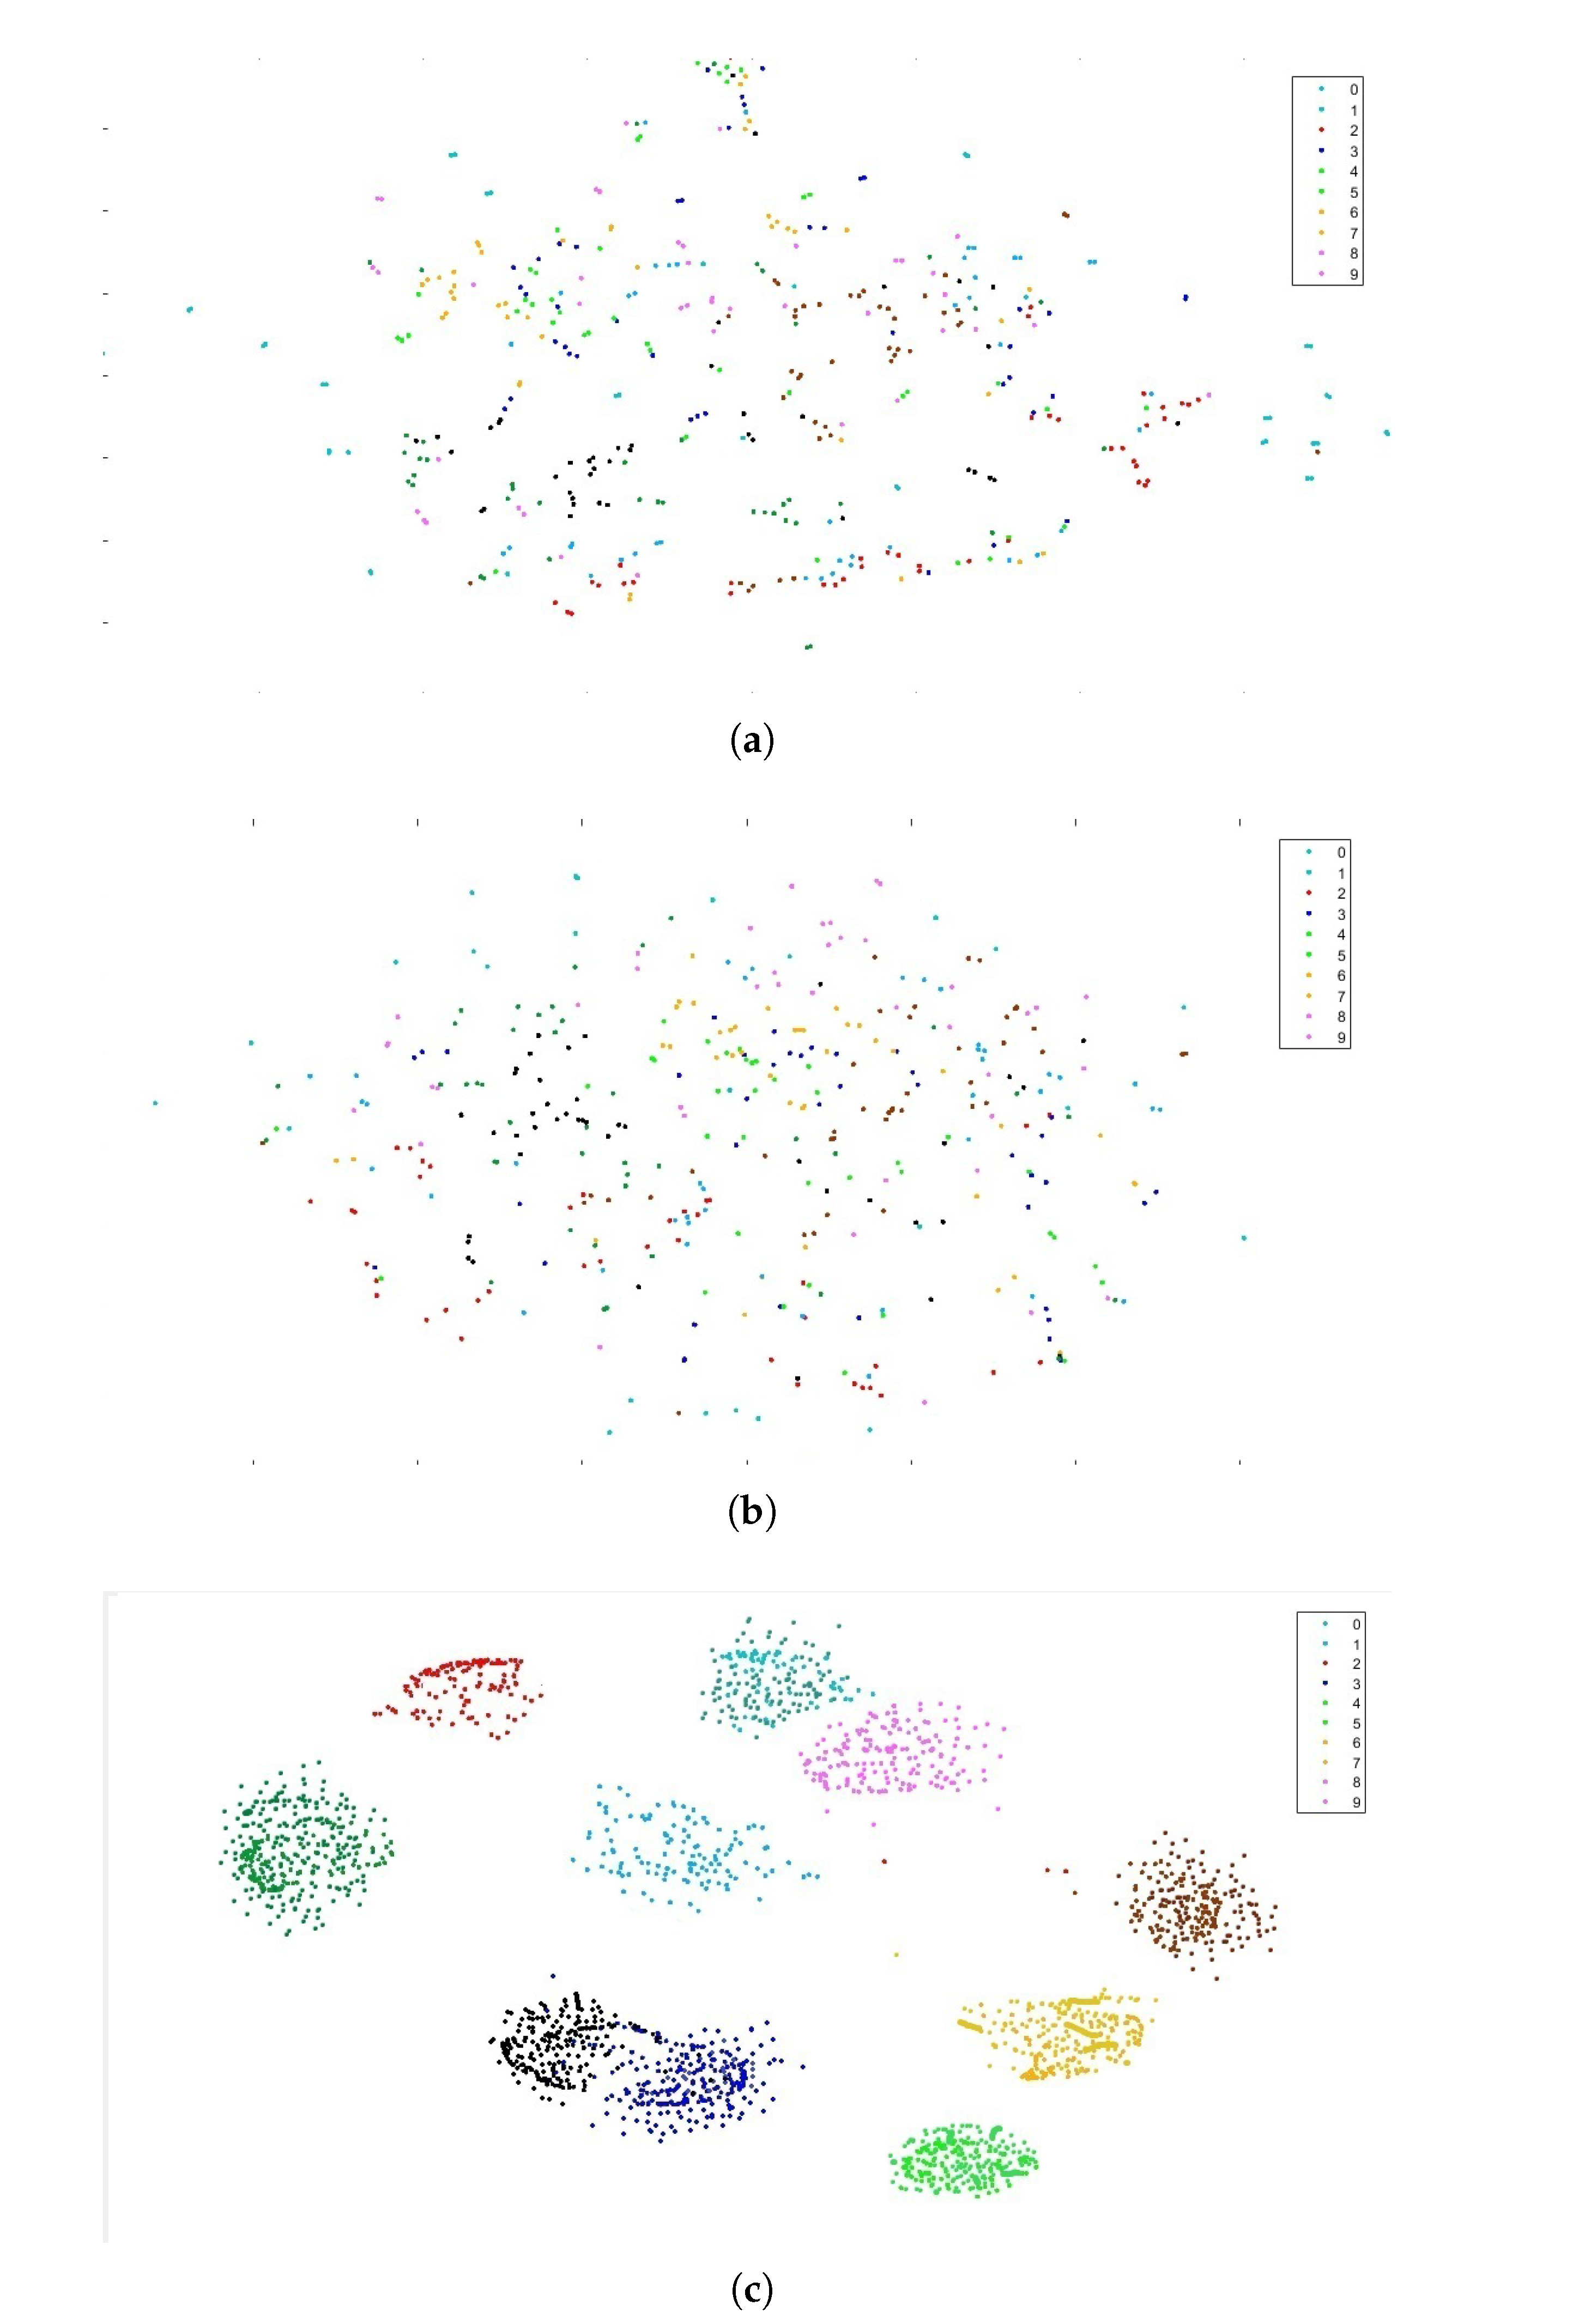
As mentioned above, in the results produced by t-SNE (Figure 7c) some of the data points are wrongly grouped. For example, the images of Urdu digit six appeared in the cluster of images of nine because of a similar shape structure. Similarly, the images of two, three, and four look similar in shape and are grouped in same cluster. Another similar case is with five and eight, which also made one cluster. In order to resolve these issues, we extended the data set by adding structural features computed accordingly for each numeral image. These features are specific to each Urdu digit and help in classifying them correctly. Some of the important structural features include the number of the arcs in the image, direction and position of arcs, cusps (sharp edges), looping structures, numbers of horizontal and vertical lines, etc. For example, in two there is one arc, while in three there are two arcs. Similarly, in digits two and three the direction of arcs is upward, but in digit four the direction of arc is downward. Besides directions of arcs, the position of arcs also plays an important role in differentiating digit two (containing an arc structure on the right) and digit six (where the arc is on the left). Similarly, the loop structure in digit nine may help in differentiating it from digit six, since both the digits are quite similar in shape in Urdu script. The details about structural features of Urdu digits are shown in Figure 8. Figure 9 shows the results of applying the same set of algorithms to the fusion matrix.
After calculating pairwise distance values for both pixel-based and structure-based data points (Equation (7)), we obtained better results on all the 5000 images of our handwritten Urdu numeric dataset. The results are shown in Figure 9, giving clear separation between all the classes. It is noteworthy that the results of t-SNE are improved by introducing the basic structural features as new dimensions within each class. The computational cost of pairwise distance calculation for t-SNE is prudent and it took 15 min of CPU time to plot the map.
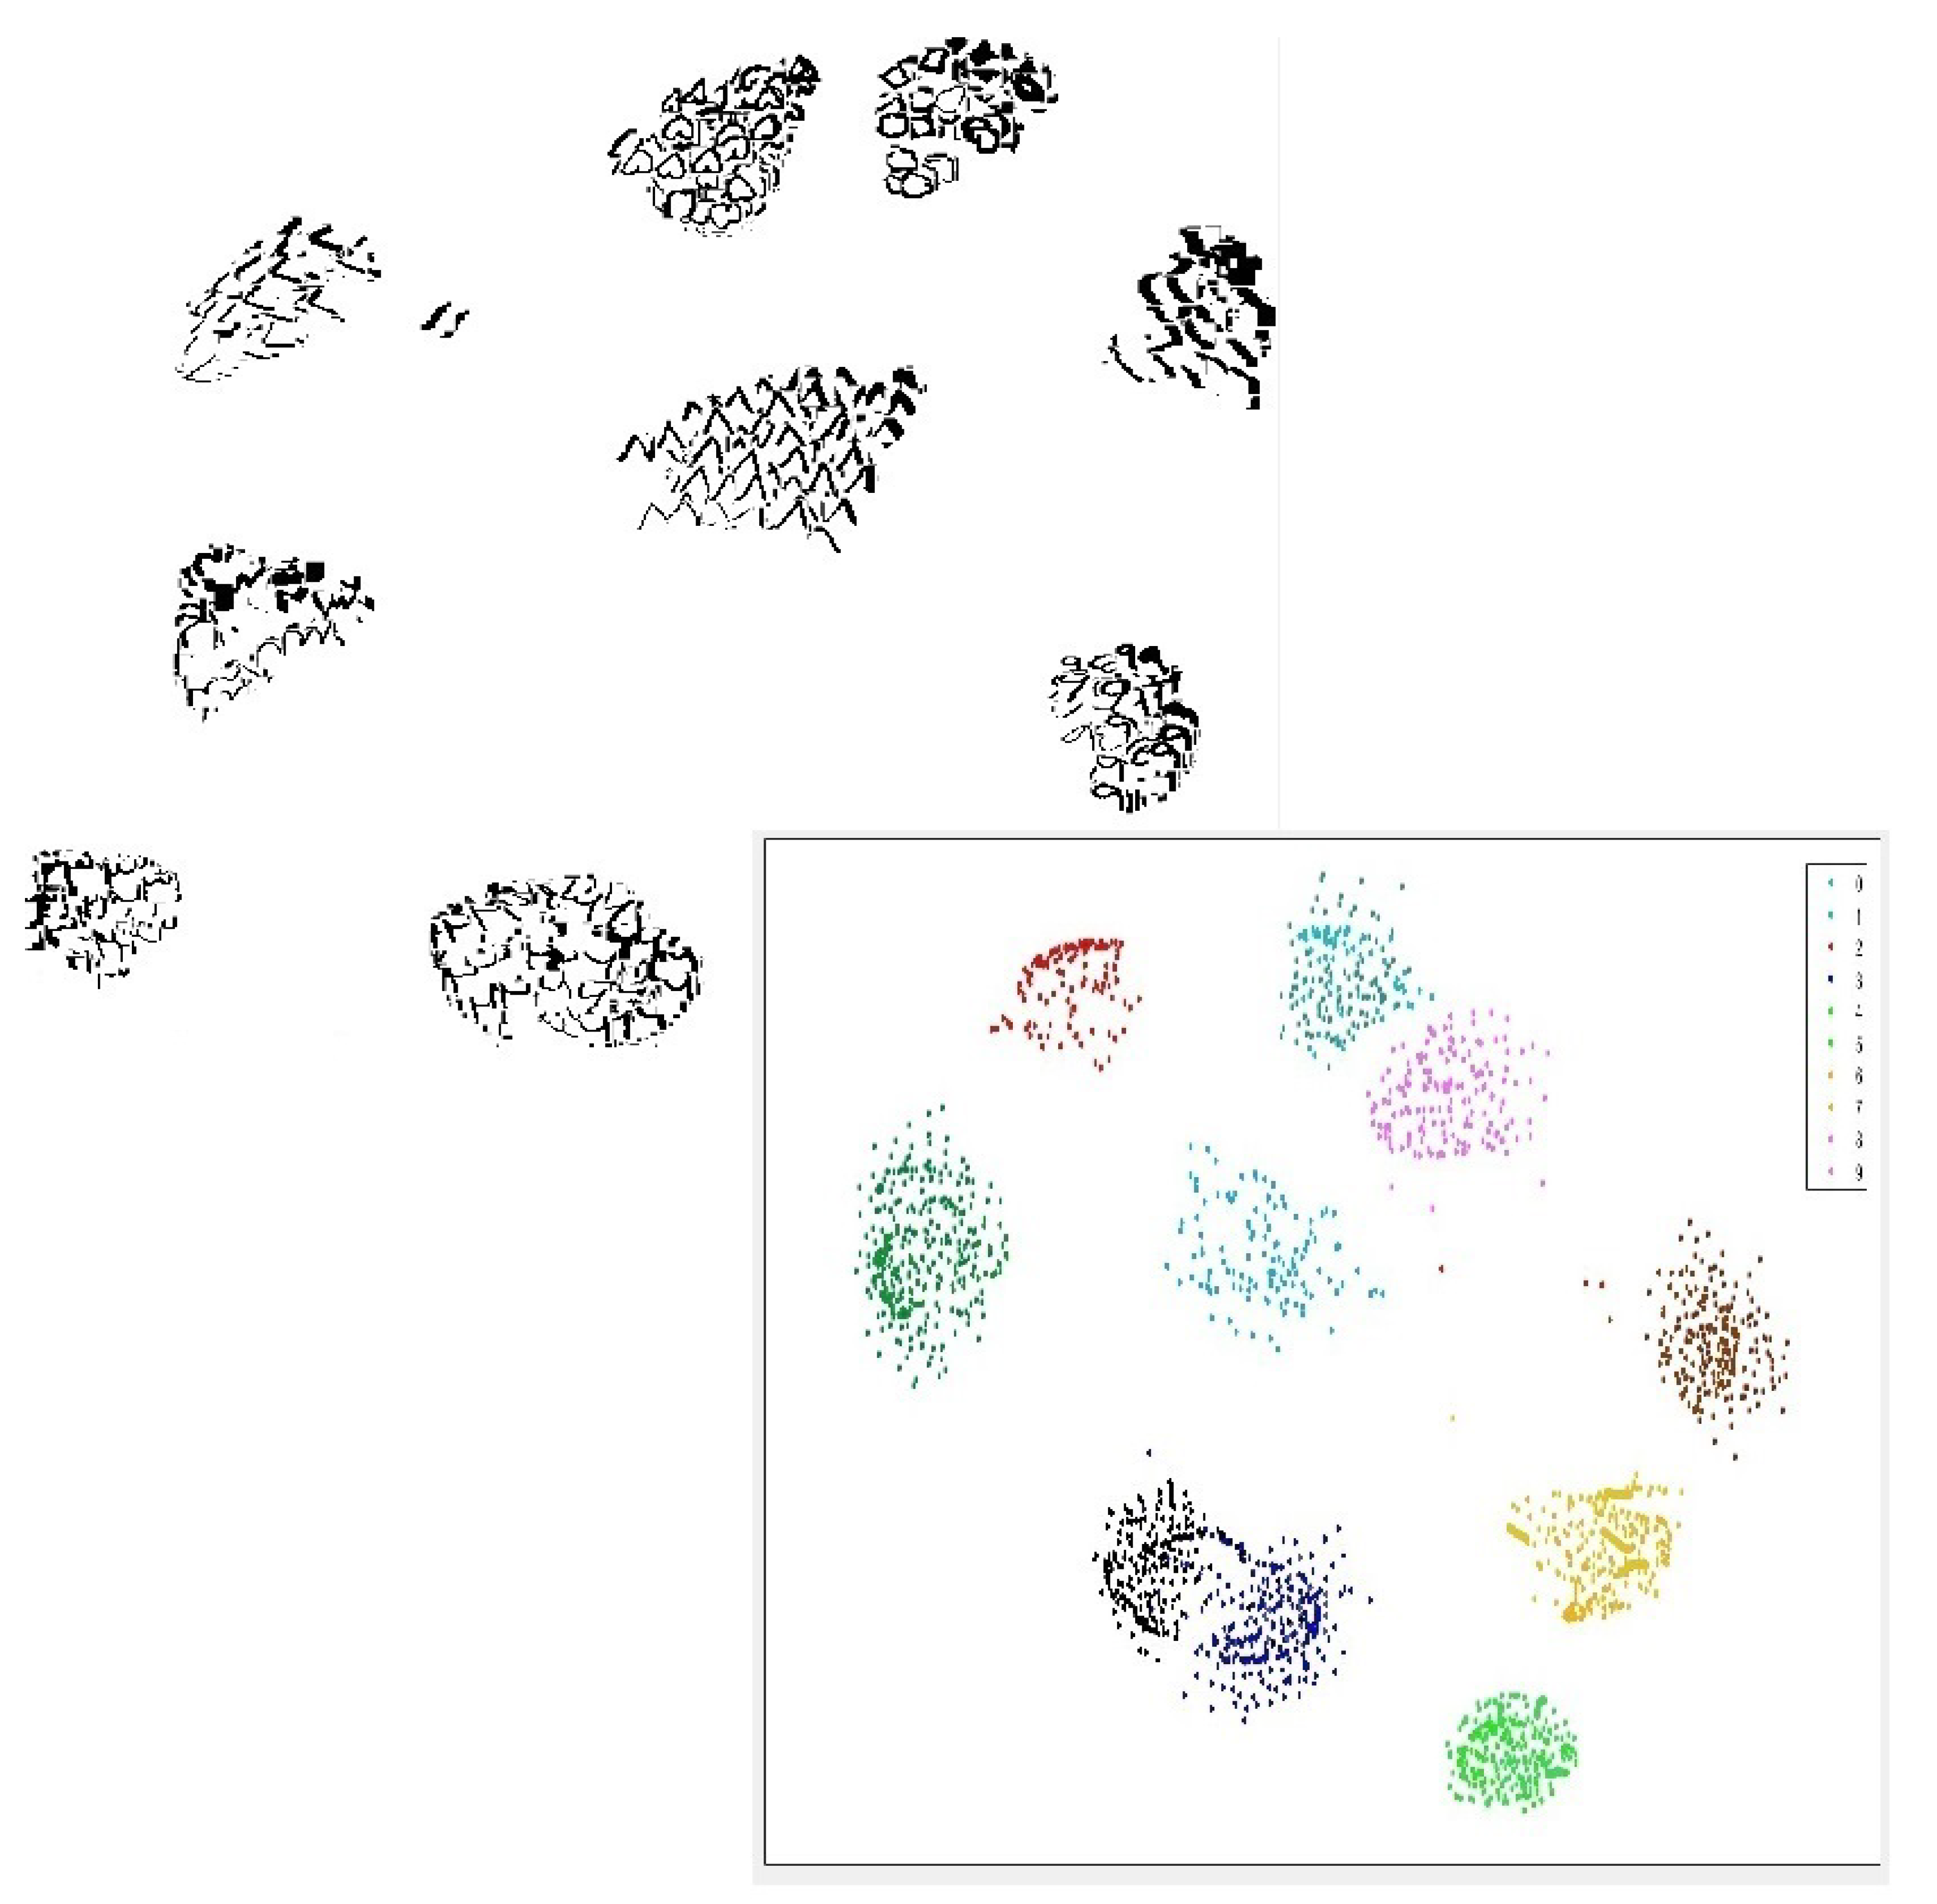
Figure 10 shows the results of an experiment, in which we applied the modified version of t-SNE to all the images of Urdu numeric dataset of fusion matrix. It is noteworthy that the original images from the dataset are plotted which will be helpful in targeting the wrongly grouped images. The inset image is impression of the large image.

6. Discussion

In the previous section we demonstrated the performance of t-SNE on our handwritten Urdu numeral dataset. In this section, a detailed discussion is given on the differences between t-SNE and other non-parametric dimensionality reduction techniques. Furthermore, we also highlight some major limitations and weaknesses with possible improvements in t-SNE.
PCA [19] performs linear transformation of the data. In order to perform this transformation, the pairwise distances in high-dimensional data points is calculated and then the sum of the squared errors is minimized using their low-dimensional representatives. PCA is not good for providing efficient low-dimensional mapping because it mainly emphases on widely separated data points while calculating the pairwise distances, rather than focusing on the distances between neighboring data points. This weakness of PCA [19] is the reason behind the efficient and stronger performance of t-SNE. On the other hand, an AE [28] is capable of incorporating as much information of the data points as possible, rather than focusing on the relevant information. It is possible for an AE [28] model to ignore major part of the relevant information if it is makes up of only a small amount of the total. Another major weakness of AE is that it has a higher value for the cost function, since it takes a lot of time for processing and model validation before starting to build the real model. This limitation of AE [28] makes t-SNE favorable in applying dimensionality reduction of data sets with high dimensions.
The standard t-SNE algorithm uses conditional probability in order to select the neighboring data points that may increase the cost function estimation. We have reduced the cost function of t-SNE by using a pairwise Euclidean distance calculation (Equation 5) for the data points instead of conditional probability. This calculation makes the process of producing efficient clusters economical when visualizing the large data set in low dimensions. Moreover, this pairwise Euclidean calculation helps in retaining the local structure of the whole data set.
It is concluded from the discussion that t-SNE is favorable and more efficient than other techniques in terms of dimensionality reduction and data visualization. However, t-SNE has two prospective weaknesses: (1) It fails to retain the local structure of high dimensional data in the case where the data points are highly cohesive and dependent and (2) it is not guaranteed that t-SNE will converge to optimize its cost function to some generic value.

7. Conclusions

In this paper, we modified standard t-SNE in order to visualize high-dimensional data while retaining the local structure of the data. Furthermore, it also retains the global structure by producing clusters with perfect separation. The novelty of our approach lies in the fact that we embed Euclidean distances in standard t-SNE in order to successfully visualize the high-dimensional data represented in multiple independent observations.
In future work, we plan to have a comparison of t-SNE with other dimensionality reduction approaches like Sammon mapping [39], isomap [40], and locally linear embedding [28], etc. We also aim to modify t-SNE further in order to generalize the t-SNE objective function by training a neural network that provides an explicit mapping to the low-dimensional space.

Author Contributions

All authors contributed equally.

Funding

This research was co-funded by HEC Pakistan in collaboration with CampusFrance, France. PERIDOT is the Franco-Pakistani Hubert Curien Partnership (PHC) Program providing opportunities to Pakistani and French researchers to interact for joint research activities. Check the details at http//www.hec.gov.pk/english/services/faculty/peridot/Pages/default.aspx.

Acknowledgments

The Région Nouvelle-Aquitaine and and the European Union have partially funded this work in the framework of the project P-2017-BAFE-46.

Conflicts of Interest

The authors declare no conflicts of interest.

References

  1. Bahlmann, C. Directional features in online handwriting recognition. Pattern Recognit. 2006, 39, 115–125. [Google Scholar] [CrossRef] [Green Version]
  2. Razzak, M.I.; Anwar, F.; Husain, S.A.; Belaid, A.; Sher, M. HMM and fuzzy logic: A hybrid approach for online Urdu script-based languages character recognition. Knowl.-Based Syst. 2010, 23, 914–923. [Google Scholar] [CrossRef]
  3. Herrera-Luna, E.C.; Felipe-Riveron, E.M.; Godoy-Calderon, S. A supervised algorithm with a new differentiated-weighting scheme for identifying the author of a handwritten text. Pattern Recognit. Lett. 2011, 32, 1139–1144. [Google Scholar] [CrossRef]
  4. Carbonell, M.; Villegas, M.; Fornés, A.; Lladós, J. Joint recognition of handwritten text and named entities with a neural end-to-end model. arXiv, 2018; arXiv:1803.06252. [Google Scholar]
  5. Shinde, A.; Shinde, A. Overlapping character recognition for handwritten text using discriminant hidden Semi-Markov model. In Intelligent Computing and Information and Communication; Springer: Singapore, 2018; pp. 163–172. [Google Scholar]
  6. Mori, S.; Nishida, H.; Yamada, H. Optical Character Recognition; John Wiley & Sons, Inc.: New York, NY, USA, 1999. [Google Scholar]
  7. Schantz, H.F. The History of OCR, Optical Character Recognition; Recognition Technologies Users Association: Manchester, VT, USA, 1982. [Google Scholar]
  8. Khan, N.H.; Adnan, A.; Basar, S. An analysis of off-line and on-line approaches in urdu character recognition. In Proceedings of the 15th International Conference on Artificial Intelligence, Knowledge Engineering and Data Bases (AIKED ’16), Venice, Italy, 29–31 January 2016. [Google Scholar]
  9. Akram, Q.U.A.; Hussain, S. Ligature-based font size independent OCR for Noori Nastalique writing style. In Proceedings of the 2017 1st International Workshop on Arabic Script Analysis and Recognition (ASAR), Nancy, France, 3–5 April 2017; pp. 129–133. [Google Scholar]
  10. Melville, P.; Mooney, R.J. Diverse ensembles for active learning. In Proceedings of the Twenty-First International Conference on Machine Learning, Banff, AB, Canada, 4–8 July 2004; p. 74. [Google Scholar]
  11. Weinstein, J.N.; Collisson, E.A.; Mills, G.B.; Shaw, K.R.M.; Ozenberger, B.A.; Ellrott, K.; Shmulevich, I.; Sander, C.; Stuart, J.M.; Network, C.G.A.R.; et al. The cancer genome atlas pan-cancer analysis project. Nat. Genet. 2013, 45, 1113. [Google Scholar] [CrossRef] [PubMed]
  12. Ravi, L.; Yan, Q.; Dascalu, S.M.; Harris, F.C., Jr. A survey of visualization techniques and tools for environmental data. In Proceedings of the 2013 Intl. Conference on Computers and Their Applications (CATA 2013), Honolulu, HI, USA, 4–6 March 2013. [Google Scholar]
  13. De Oliveira, M.F.; Levkowitz, H. From visual data exploration to visual data mining: A survey. IEEE Trans. Vis. Comput. Graph. 2003, 9, 378–394. [Google Scholar] [CrossRef]
  14. Keim, D.A.; Ankerst, M.; Kriegel, H.-P. Recursive pattern: A technique for visualizing very large amounts of data. In Proceedings of the 6th Conference on Visualization’95; IEEE Computer Society, Atlanta, GA, USA, 29 October–9 November 1995; p. 279. [Google Scholar]
  15. Rekimoto, J.; Green, M. The information cube: Using transparency in 3rd information visualization. In Proceedings of the Third Annual Workshop on Information Technologies & Systems (WITS93), Orlando, FL, USA, 5 December 1993; pp. 125–132. [Google Scholar]
  16. Pickett, R.M.; Grinstein, G.G. Iconographic displays for visualizing multidimensional data. In Proceedings of the 1988 IEEE Conference on Systems, Man, and Cybernetics, Beijing, China, 18–12 August 1988; Volume 514, p. 519. [Google Scholar]
  17. Van der Maaten, L.; Hinton, G. Visualizing data using t-SNE. J. Mach. Lear. Res. 2008, 9, 2579–2605. [Google Scholar]
  18. Maaten, L. Learning a parametric embedding by preserving local structure. In Proceedings of the 12th International Conference on Artificial Intelligence and Statistics, Clearwater Beach, FL, USA, 8–12 June 2009; pp. 384–391. [Google Scholar]
  19. Hotelling, H. Analysis of a complex of statistical variables into principal components. J. Educ. Psychol. 1933, 24, 417. [Google Scholar] [CrossRef]
  20. Torgerson, W.S. Multidimensional scaling: I. Theory and method. Psychometrika 1952, 17, 401–419. [Google Scholar] [CrossRef]
  21. Lee, J.A.; Verleysen, M. Nonlinear Dimensionality Reduction; Springer Science & Business Media: New York, NY, USA, 2007. [Google Scholar]
  22. Roweis, S.T.; Saul, L.K. Nonlinear dimensionality reduction by locally linear embedding. Science 2000, 290, 2323–2326. [Google Scholar] [CrossRef]
  23. Belkin, M.; Niyogi, P. Laplacian eigenmaps and spectral techniques for embedding and clustering. In Proceedings of the Advances in Neural Information Processing Systems, Vancouver, BC, Canada, 3–8 December 2002; pp. 585–591. [Google Scholar]
  24. Weinberger, K.Q.; Sha, F.; Saul, L.K. Learning a kernel matrix for nonlinear dimensionality reduction. In Proceedings of the Twenty-First International Conference on Machine Learning, Banff, AB, Canada, 4–8 July 2004; p. 106. [Google Scholar]
  25. Hinton, G.E.; Roweis, S.T. Stochastic neighbor embedding. In Proceedings of the Advances in Neural Information Processing Systems, Vancouver, BC, Canada, 8–13 December 2003; pp. 857–864. [Google Scholar]
  26. Demartines, P.; Hérault, J. Curvilinear component analysis: A self-organizing neural network for nonlinear mapping of data sets. IEEE Trans. Neural Netw. 1997, 8, 148–154. [Google Scholar] [CrossRef] [PubMed]
  27. Song, L.; Gretton, A.; Borgwardt, K.M.; Smola, A.J. Colored maximum variance unfolding. In Proceedings of the Advances in Neural Information Processing Systems, Vancouver, BC, Canada, 12–13 December 2008; pp. 1385–1392. [Google Scholar]
  28. Liou, C.-Y.; Cheng, W.-C.; Liou, J.-W.; Liou, D.-R. Autoencoder for words. Neurocomputing 2014, 139, 84–96. [Google Scholar] [CrossRef]
  29. Joyce, J.M. Kullback-leibler divergence. In International Encyclopedia of Statistical Science; Springer: Berlin/Heidelberg, Germany, 2011; pp. 720–722. [Google Scholar]
  30. Lin, J. Divergence measures based on the Shannon entropy. IEEE Trans. Inf. Theory 1991, 37, 145–151. [Google Scholar] [CrossRef] [Green Version]
  31. Gashi, I.; Stankovic, V.; Leita, C.; Thonnard, O. An experimental study of diversity with off-the-shelf antivirus engines. In Proceedings of the 2009 Eighth IEEE International Symposium on Network Computing and Applications (NCA 2009), Cambridge, MA, USA, 9–11 July 2009; pp. 4–11. [Google Scholar]
  32. Hamel, P.; Eck, D. Learning Features from Music Audio with Deep Belief Networks. In Proceedings of the 11th International Society for Music Information Retrieval Conference ISMIR, Utrecht, The Netherlands, 9–13 August 2010; Volume 10, pp. 339–344. [Google Scholar]
  33. Jamieson, A.R.; Giger, M.L.; Drukker, K.; Li, H.; Yuan, Y.; Bhooshan, N. Exploring nonlinear feature space dimension reduction and data representation in breast CADx with Laplacian eigenmaps and t-SNE. Med. Phys. 2010, 37, 339–351. [Google Scholar] [CrossRef] [PubMed]
  34. Wallach, I.; Lilien, R. The protein–small-molecule database, a non-redundant structural resource for the analysis of protein-ligand binding. Bioinformatics 2009, 25, 615–620. [Google Scholar] [CrossRef] [PubMed]
  35. Najafabadi, M.M.; Villanustre, F.; Khoshgoftaar, T.M.; Seliya, N.; Wald, R.; Muharemagic, E. Deep learning applications and challenges in big data analytics. J. Big Data 2015, 2, 1. [Google Scholar] [CrossRef]
  36. Kiselev, V.Y.; Kirschner, K.; Schaub, M.T.; Andrews, T.; Yiu, A.; Chandra, T.; Natarajan, K.N.; Reik, W.; Barahona, M.; Green, A.R.; et al. SC3: Consensus clustering of single-cell RNA-seq data. Nat. Methods 2017, 14, 483. [Google Scholar] [CrossRef]
  37. Pezzotti, N.; Lelieveldt, B.P.; van der Maaten, L.; Höllt, T.; Eisemann, E.; Vilanova, A. Approximated and user steerable tSNE for progressive visual analytics. IEEE Trans. Vis. Comput. Graph. 2017, 23, 1739–1752. [Google Scholar] [CrossRef]
  38. Wattenberg, M.; Viégas, F.; Johnson, I. How to use t-sne effectively. Distill 2016, 1, e2. [Google Scholar] [CrossRef]
  39. De Ridder, D.; Duin, R.P. Sammon’s mapping using neural networks: a comparison. Pattern Recognit. Lett. 1997, 18, 1307–1316. [Google Scholar] [CrossRef]
  40. Tenenbaum, J.B.; De Silva, V.; Langford, J.C. A global geometric framework for nonlinear dimensionality reduction. Science 2000, 290, 2319–2323. [Google Scholar] [CrossRef] [PubMed]
Figure 1. Images of Urdu digit 2 left and 3 right. Digit 2 has one arc and digit 3 has two arcs.
Symmetry 11 00107 g001
Figure 2. Different handwriting styles of Urdu digit 3 sharing shape similarity with Urdu digit 2.
Symmetry 11 00107 g002
Figure 3. Handwritten Urdu numerals sample on A4 size paper.
Symmetry 11 00107 g003
Figure 4. Sample of Urdu handwritten numerals, in comparison with Persian and Arabic digits, with equivalent English digits from 0 to 9 (left to right).
Symmetry 11 00107 g004
Figure 5. Results of standard t-SNE on our data set having pixel-based data of Urdu handwritten numerals.
Symmetry 11 00107 g005
Figure 6. Results of standard t-SNE on our data set having pixel-based and structure-based data of Urdu handwritten numerals.
Symmetry 11 00107 g006
Figure 7. Visualization of handwritten Urdu numerals (pixel-based features only) using (a) autoencoders, (b) principal component analysis and (c) standard t-SNE.
Symmetry 11 00107 g007
Figure 8. Details of types of structural (geometrical) features of Urdu digits.
Symmetry 11 00107 g008
Figure 9. Visualization of handwritten Urdu numerals (fusion matrix) using (a) autoencoders, (b) principal component analysis and (c) t-SNE.
Symmetry 11 00107 g009
Figure 10. Visualization of our handwritten Urdu numeral data using original images from the data set (all 5000 images).
Symmetry 11 00107 g010