Article

Automatic Grading of Palsy Using Asymmetrical Facial Features: A Study Complemented by New Solutions

1
Department of Electrical Engineering, Mirpur University of Science and Technology (MUST), Mirpur 10250 (AJK), Pakistan
2
Faculty of Computing, Engineering and Science, Staffordshire University, Stoke-on-Trent ST4 2DE, UK
3
Department of Electrical Engineering (Power), Mirpur University of Science and Technology, Mirpur 10250 (AJK), Pakistan
4
School of Electronic Information and Communications, Huazhong University of Science and Technology, Wuhan 430074, China
*
Author to whom correspondence should be addressed.
Symmetry 2018, 10(7), 242; https://doi.org/10.3390/sym10070242
Submission received: 29 May 2018 / Revised: 19 June 2018 / Accepted: 25 June 2018 / Published: 26 June 2018

Abstract

:
Facial palsy caused by nerve damage results in loss of facial symmetry and expression. A reliable palsy grading system for large-scale applications is still missing in the literature. Although numerous approaches have been reported on facial palsy quantification and grading, most employ hand-crafted features on relatively smaller datasets which limit the classification accuracy due to non-optimal face representation. In contrast, convolutional neural networks (CNNs) automatically learn the discriminative features facilitating the accurate classification of underlying tasks. In this paper, we propose to apply a typical deep network on a large dataset to extract palsy-specific features from face images. To prevent the inherent limitation of overfitting frequently occurring in CNNs, a generative adversial network (GAN) is applied to augment the training dataset. The deeply learned features are then used to classify the palsy disease into five benchmarked grades. The experimental results show that the proposed approach offers superior palsy grading performance compared to some existing methods. Such an approach is useful for palsy grading at large scale, such as primary health care.

1. Introduction

The classification of facial palsy is an important yet challenging problem in health care informatics owing to its diversity, varying symptoms and complex underlying mechanisms. Adequate feature learning plays a vital role to enhance the accuracy of classification systems. The previous methods to encode facial palsy in terms of asymmetric facial features can be broadly classified as hand-crafted features based or learning-based methods. The hand-crafted methods rely on prior knowledge to extract the underlying asymmetrical features. The representative works in this category include [1,2,3,4]. Kim et al. [1] proposed an automatic diagnosis system for facial nerve palsy. The authors suggested facial landmarks to be tracked by a regression model. The asymmetry index is then calculated for different facial regions for distinct facial motions. Normal and palsy-affected subjects are then classified on a private dataset using support vector machine (SVM), and linear discriminant analysis (LDA) as classifiers. But this study is suggested for smart-phone based smaller applications and thus not suitable for large applications such as diagnosis systems required for primary health care [5]. Wang et al. [2] used an active shape model and local binary patterns to encode actions for palsy-affected faces. He et al. [3] demonstrated a facial palsy grading system employing multiresolution local binary patterns along with SVM as classifier. Delannoy and Ward [4] used an active appearance model lo localize facial landmarks. The authors then used facial astrometric distances and smile as discriminative features. Apart from face palsy, hand-crafted features have also been used in other facial disease analysis, such as [6,7,8,9]. Sumithra et al. [6] used a region-growing strategy for automatic lesion segmentation. Facial skin color and texture was used for feature extraction. SVM and k-nearest neighbor (k-NN) classifiers were used to classify diseases into five distinct categories. Yuan et al. [7] proposed a narrow band graph partitioning approach to segment skin lesions. The authors also suggested how to achieve invariance like topological variations, asymmetry and false contours of lesions. In [8], Manoorkar et al. used clinical features including magnitude, phase, and real and imaginary parts of an impedence-based index to classify human skin diseases. El abbadi et al. [9] developed a skin disease diagnostic system based on skin color and texture. The authors employed a gray level co-occurrence matrix (GLCM) to extract texture features.
Although hand-crafted feature-based approaches are successful in classifying facial skin and nerve diseases, their strong dependence on prior knowledge and non-optimal feature representation limits the classification accuracy. Recently, a number of deep learning-based approaches have been devised to learn automatically the discriminative features for accurate classification. Convolutional neural networks (CNNs) have been widely used in related applications and can even surpass the human-level performance in recognition and classification tasks [10,11]. The most prominent representative works used in computing devices for facial palsy disease include the study presented in [12]. Wang and McGrenary et al. [12] proposed to train artificial neural networks on bilateral displacements and regional mean intensities to quantify facial palsy disease. But their work has certain limitations. First, the results are reported on quite a small dataset consisting of 43 video sequences of only 14 subjects. Second, the study relies on bilateral facial displacements which require accurate landmark detection which is not a trivial task, especially when palsy affects certain facial parts thus dislocating the vital facial landmarks. Apart from facial palsy, the CNNs have been actively utilized in other facial disease analysis such as [13,14,15,16]. Wang and Luo [13] proposed to use a semi-supervised strategy combined with visual features extracted from normal face images to detect and classify abnormal disease symptoms. The authors reported classification results on University of California, San Diego (UCSD) [17], Primary Care Dermatology Society PCDS [18], and a private dataset acquired through online sources [19]. Liao et al. [14] applied CNNs to classify both the disease and lesions for computer-assisted skin disease diagnosis on a large scale dataset. A combination of local and global features has been employed by Ge et al. [15] for skin-lesion classification. The authors suggested a deep residual network and bilinear pooling technique to learn global and local features, respectively. Competitive results have been reported on two standard datasets. Despite their tremendous performance, the CNNs with deeper architectures represent a large number of parameters. This results in frequently occurring phenomenon called “overfitting” in the training. Overfitting means small training errors but large test errors. More precisely, the network becomes biased towards training data. To fight overfitting, certain strategies are applied such as dropout, transfer learning and data augmentation [20,21,22].
The above presented methods show three main limitations. First, most of the related studies use hand-crafted features which are not useful for optimal facial representation and thus limit the classification accuracy. Second, the existing datasets are small and thus lack the disease diversity and thus are not suitable for large-scale applications. Third, most of the existing methods report classification accuracies using a limited number of evaluation metrics. This may lead to inconsistent classification results. Moreover, the evaluation metrics results reported on such datasets may lead to inappropriate conclusions due to unbalanced classes. Finally, the existing methods on palsy grade classification reveals that inherent in these methods is a major limitation in terms of repeatability. Contrary to the existing methods, in this paper CNNs have been proposed to learn facial palsy-specific features automatically. To this end, a CNN-based model is proposed which is capable of automatic feature learning and grading palsy-affected face images into five categories including mild, moderate, moderately-severe, severe and total paralysis benchmarked by House and Brackmann [23]. The presented work uses CNN as a classifier which is capable of distinguishing between the different facial palsy categories based on the learned features during the training process. An inherent limitation of CNNs is overfitting, which means that the model shows a small training error but large validation errors. To prevent the overfitting, a generative adversial network (GAN) [24] is applied to augment the training dataset. More precisely, the deep CNN will facilitate the automatic feature learning, while application of GAN will automatically augment the training dataset. With the novel data augmentation, more samples are available to train the deep architecture for the underlying classification problem. In the experiments, the performance of VGG-16 features is compared with the proposed data augmentation with that obtained with data augmentation and transfer-learning approach. The experimental results suggest the robust performance of our method in the skin disease classification problem of patients’ faces.
The aims of this study are as follows.
  • Build a large facial palsy dataset;
  • Demonstrate a deep learning based facial palsy-specific features extraction strategy in conjunction with CNNs;
  • Address the problem of overfitting of CNNs by generating additional face images using GANs;
  • Show that such a method tested on a large dataset will be suitable for large scale facial palsy grading applications, such as primary health care.
The remainder of this paper is structured as follows. The proposed methodology is presented in Section 2. Experiments and results are given in Section 3. Results related discussion is presented in Section 4, while the last section concludes this study.

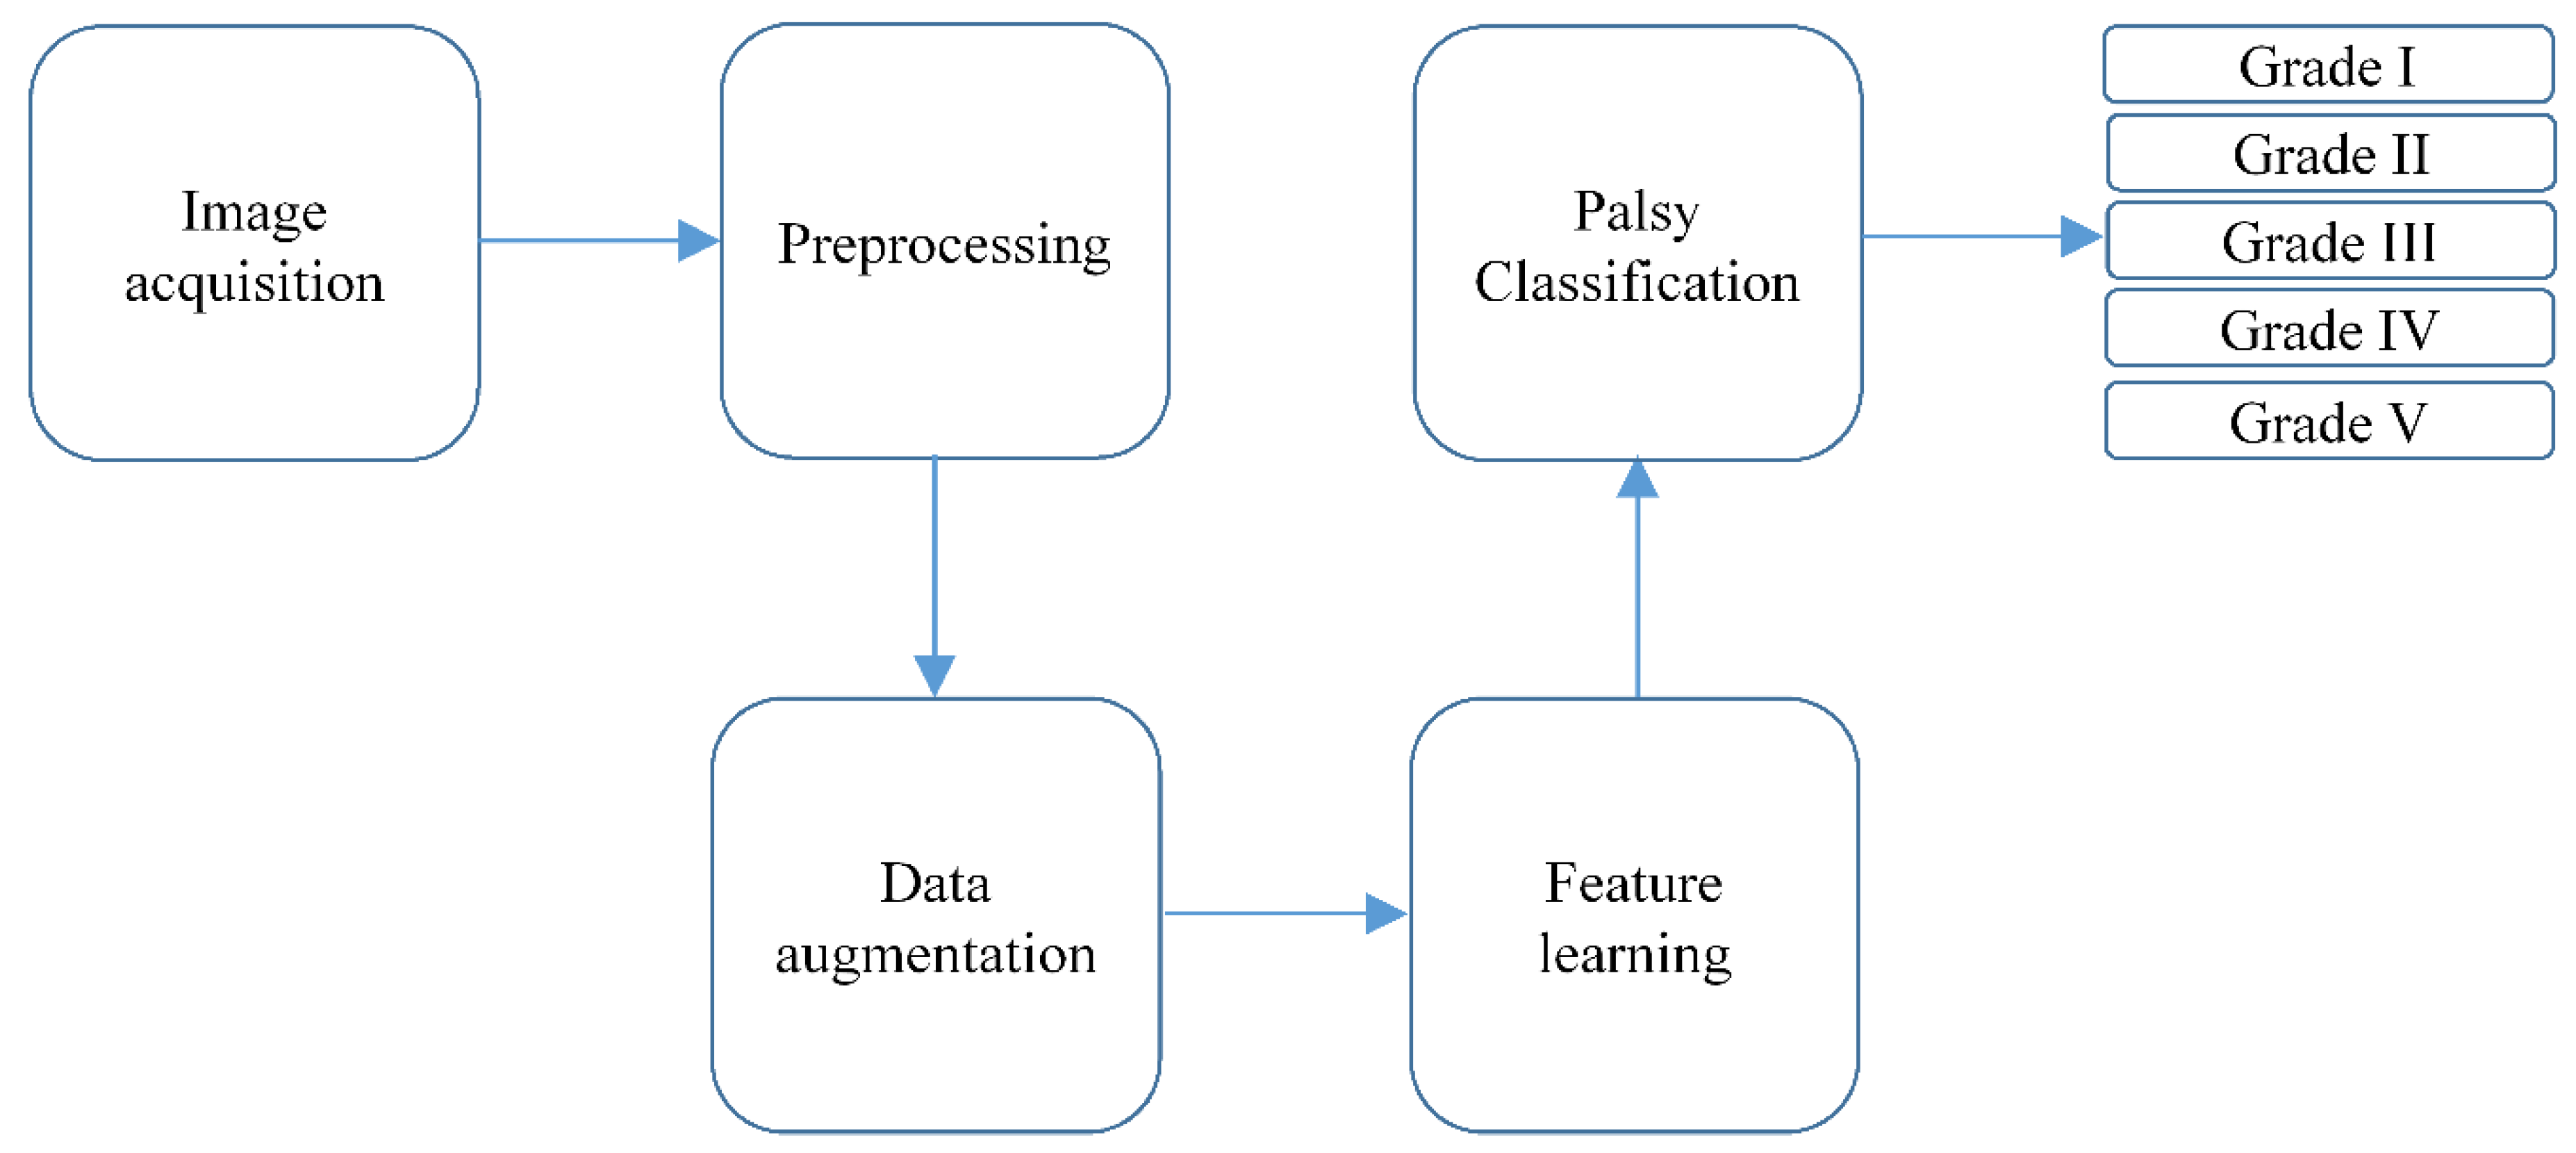
2. Proposed Methodology

The automatic process of palsy grading using face images with CNNs is shown in Figure 1. There are five steps: (1) image acquisition or dataset collection; (2) preprocessing; (3) data augmentation; (4) feature learning; and (5) classification of facial palsy to one of the five grades. Each of these steps is explained in the following subsection.

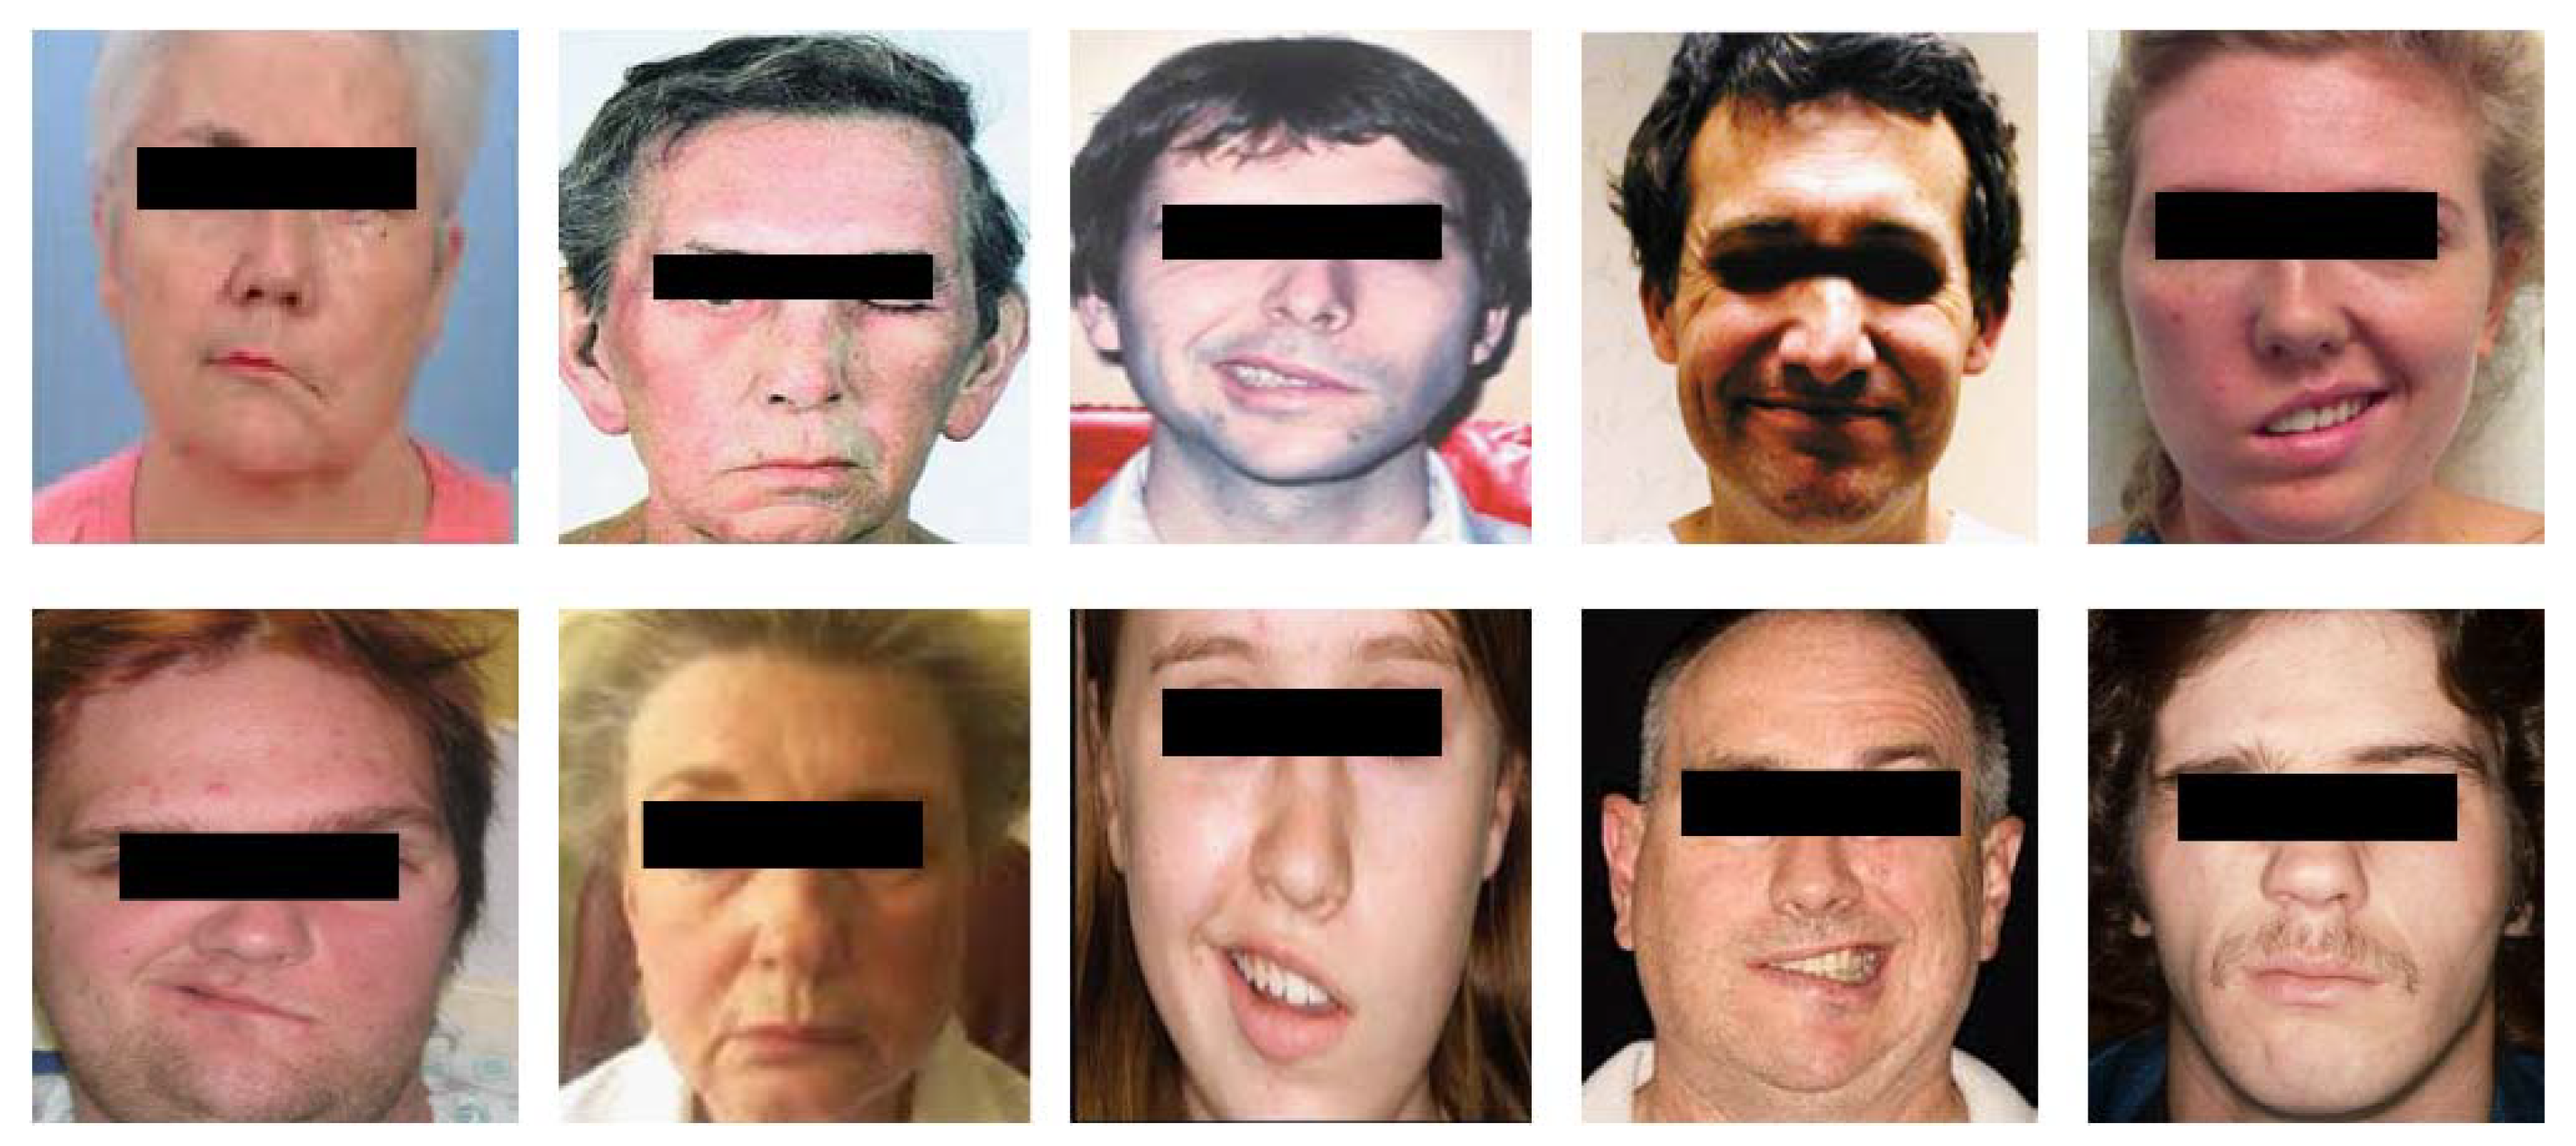
2.1. Image Acquisition or Dataset Collection

A dataset consisting of 2000 face images with varying amount of facial palsy has been collected. The dataset includes palsy-affected face images collected from UCSD [17], PCDS [18], and through online sources. The data is annotated and labeled using the facial palsy assessment characteristics originally set by the House and Brackmann scale [23]. This scale is a widely accepted system that grades the facial function from normal (grade 0) to total paralysis (grade V). In this study, we use grade I to grade V for mild, moderate, moderately-severe, severe and total paralysis, respectively. Table 1 displays the salient characteristics of each grading scale. The resulting dataset presented in this study is composed of face images for 2000 subjects belonging to five grades. Some example face images from our collected dataset are shown in Figure 2.

2.2. Preprocessing

All the face images are preprocessed as follows:
  • Face images are aligned such that these are upright;
  • Color face images are converted into gray scale to eliminate unwanted color cast;
  • Histogram equalization is used to remove shadows and illumination variations;
  • Finally, the face images are cropped to 200 × 200 pixels with a 100 pixel interpupillary distance [25]. A binary elliptical mask is then applied to remove unwanted hair and background variations.

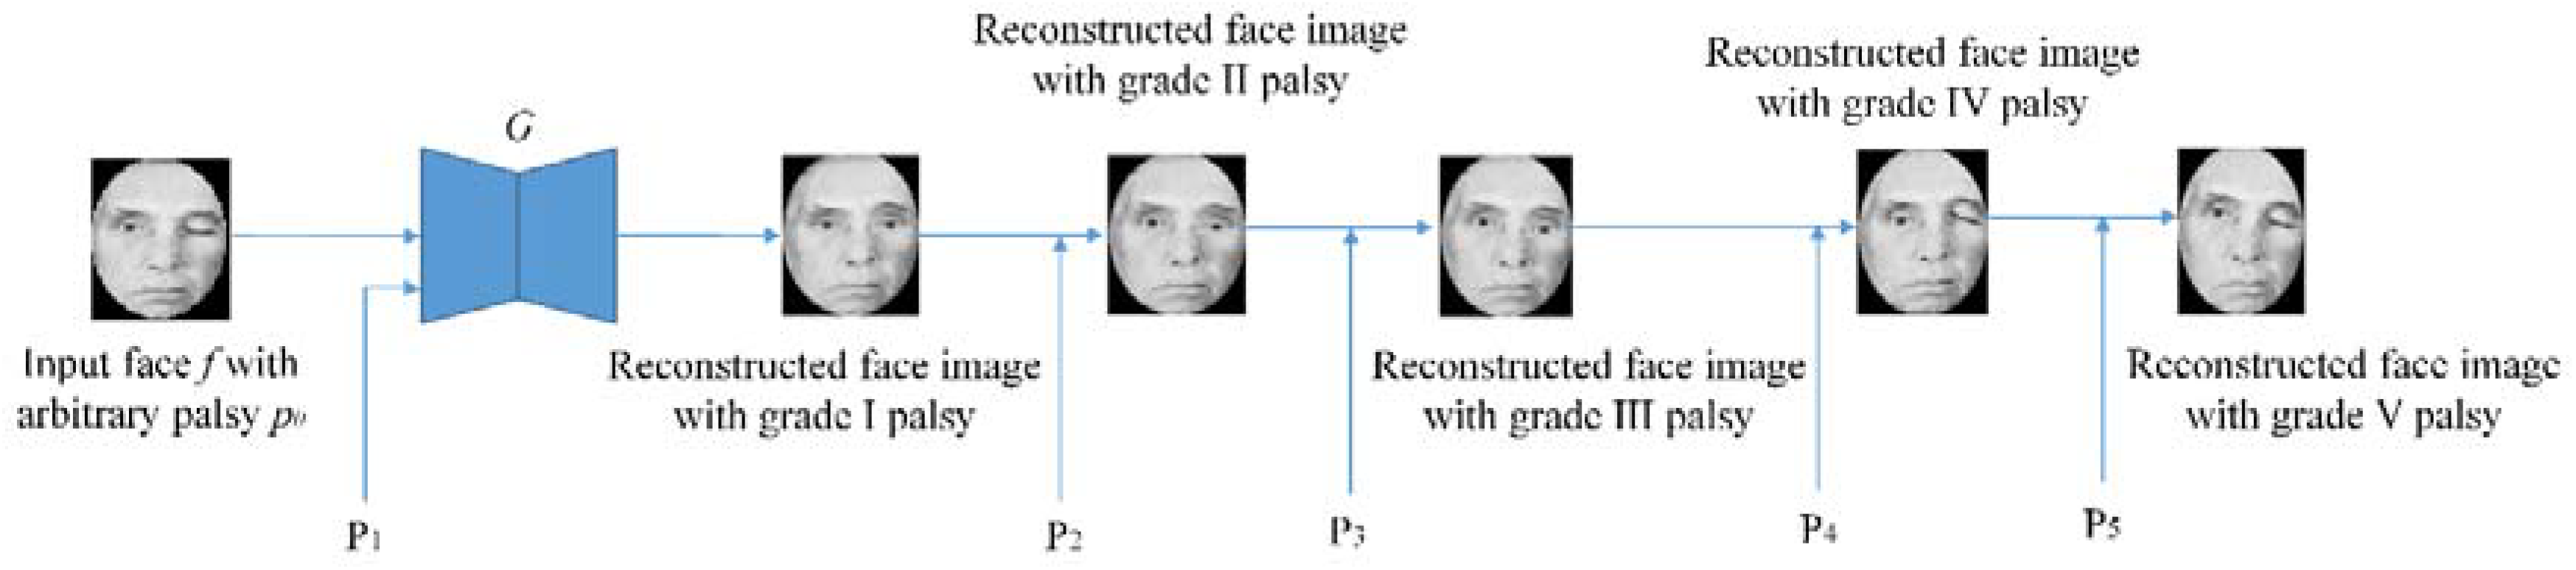
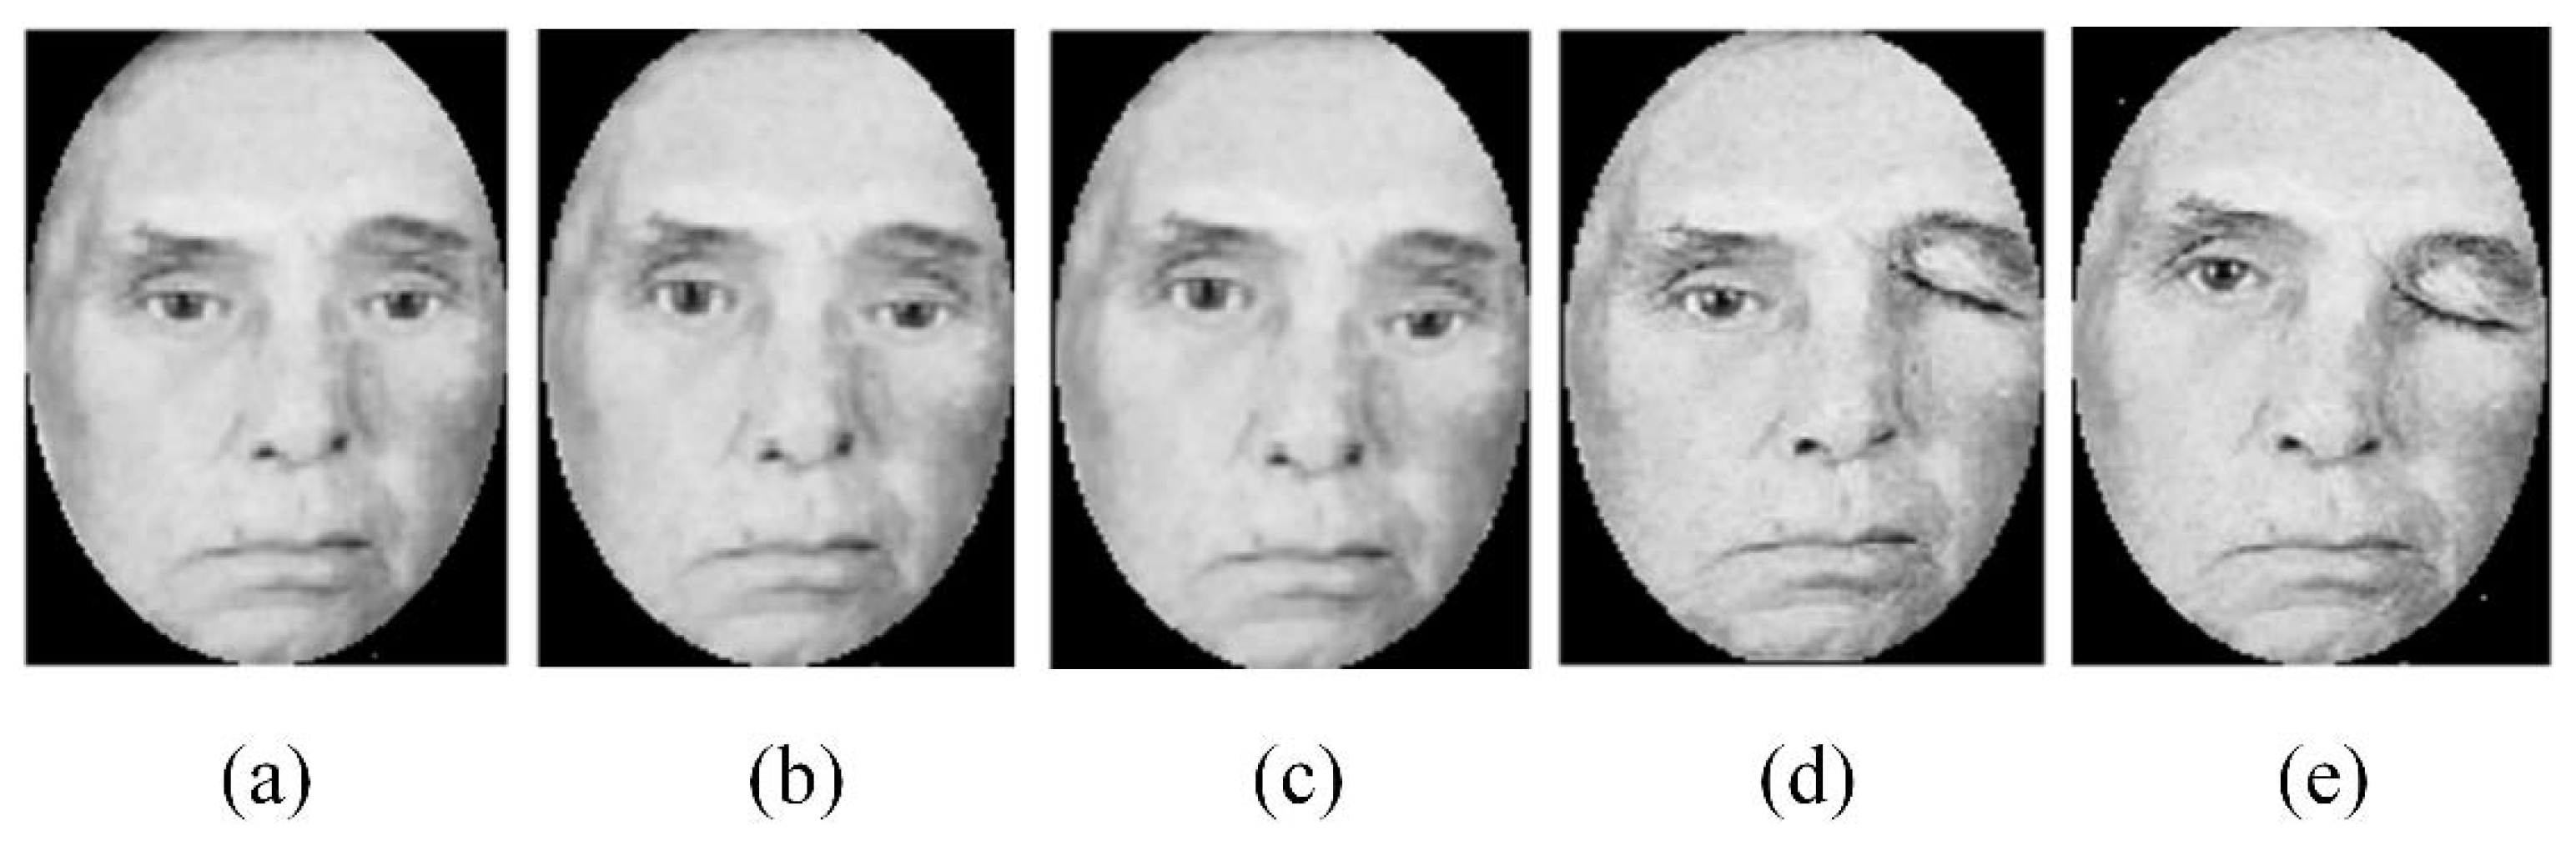
2.3. Data Augmentation

An inherent limitation of CNNs is overfitting during the testing stage [21]. Overfitting means the CNNs have a small training error but large validation errors. To prevent overfitting, a data augmentation strategy has been proposed. Many approaches have been reported in the literature that can generate augmented data. For example, a built-in method has been suggested in [26] to randomly generate an augmented dataset using transformations like flipping, cropping, rotation and scaling. But all of these methods are not suitable to augment the datasets if they are used “blindly” [27]. Keeping in view the significance of the choice of augmentation strategy, we propose to use GAN to synthesize face images with varying facial palsy. More precisely, for each original face image, face images are generated with 5 types of palsy including mild, moderate, moderately-severe, severe and total paralysis. This type of augmentation is quite useful to train the CNNs for underlying the classification task. The GAN framework typically employs a generator and a discriminator in an adversarial environment. The discriminator aims to differentiate between samples from model and training data. In contrast, the generator aims to maximally confuse the discriminator. Following [24], the objective function is to minimize the value function as:
min g max d ( E i ~ p d a t a ( i ) [ l o g d ( i ) ] + E j ~ p j ( j ) [ log ( 1 d ( g ( j ) ) ] )
where, j is noise space, i is data space which represents output from the generator or input to the discriminator, and pdata is the density model.
The face synthesis method is based on a generative model to synthesise face images within the desired range of palsy severity ranging from mild to total paralysis, as shown in Figure 3. More precisely, the synthesis process is done as follows.
Given a preprocessed input face image f with an arbitrary palsy po, a generator G is used which allows the generation of a reconstructed face with different palsy levels, such that the reconstructed face is as close as possible to the original face image. Five distinct face images are generated with palsy grade I to V by simply switching the palsy levels P1 to P5 at the input of the generator. The examples of generated faces with five distinct severity levels of facial palsy are shown in Figure 4.

2.4. Feature Learning

The CNNs can learn to discriminate features automatically for an underlying task. In this work, a typical deep model is used consisting of 2 CNNs, and a pre-trained deep CNN called VGG-16 [28]. The networks C1 and C2 consist of 2 convolutional and 2 max pooling layers each, while the pre-trained VGG-16 network, hereinafter called C3, is used as a deep architecture for palsy grading classification. The VGG-16 network consists of 16 convolutional and 5 pooling layers. The top layers consist of 2 fully connected layers. Originally, the pre-trained deep network was trained on ImageNet dataset [29] and is designed for 1000 neurons in the softmax layer (one for each class). In this paper, we replace the softmax layer with 5 neurons to output 5 posterior probabilities, each representing a particular palsy grade. The choice of this deep architecture is motivated by its superior performance as reported in the literature [28]. Since the severity of face palsy depends upon the difference between the symmetry of the left and right half of the face, to encode palsy-specific features the procedure described in [30] has been followed. However, different from [30], the preprocessed face image and its mirror image are applied to two separate CNNs. More specifically, a given input face image is applied to network C1, and its mirror face image to network C2. Using convolutional layers of CNNs, max pooling maps are obtained both for the input face image and its mirror image. The max pooling maps are then applied to a deep network C3 which is trained to classify face palsy into one of the five grades. This procedure is shown in Figure 5.

2.5. Classification

After training on the augmented dataset, the deep CNN can classify a given face image into one of the five grades of facial palsy. The classification task is performed by the softmax layer of deep network C3. This layer updates the network weights through a process called back propagation. Back propagation is based on the loss function used in the training stage. Keeping in view the underlying classification problem, the categorical cross entropy has been used as the loss function, as shown in Equation (2).
( Y , g ) = i = 1 5 g i l o g x i
where, x i is the probability that the network assigns to the label t i and five palsy grades g = { I , I I , I I I , I V , V } .

3. Experiments and Results

3.1. Experimental Protocol

The dataset consisting of 2000 face images is split into 3 subject-exclusive subsets including training, validation and testing subsets. One thousand face images are used to build an augmented training dataset such that for each original face image, five synthesized face images are generated using the process illustrated in Section 2.3. Thus there are 6000 face images in the augmented training subset. The remaining 1000 face images are further split into a validation and a testing subset such that each subset contains 500 images. It is worthwhile to note that the data augmentation is performed using the training dataset only as suggested in [27]. The subject-exclusive validation set is then used to analyze how the deep model works on real face images. Thus the validation subset contains only the real face images without data augmentation.
Table 2 displays the number of face images in each subset. To ensure the robust performance of our proposed classification model, the training and the testing subsets include face images with varying facial palsy disease. For example, there are 2066 face images with grade 1 palsy disease in the training subset, 151 in the validation subset, and 144 in testing subset.

3.2. Experimental Results and Evaluation

It is common to use the transfer learning approach in CNNs to apply the knowledge learned while classifying natural images to classify face images with palsy. The transfer learning employed in this paper involves replacing and retraining the softmax layer and also fine-tuning the weights of the pre-trained network. More precisely, the pre-trained network is trained by the stochastic gradient descent (SGD) using the standard backward propagation as gradient computing technique [31]. SGD is an iterative optimization algorithm used to calculate the parameters that minimizes the loss function of the deep network. The conventional optimization algorithms like gradient descent take into account the cost of each training sample for each iteration while calculating the gradient of the cost function. Thus, the larger the training set, the slower our algorithm updates the weights and it will take a long time to converge to the global cost minimum. In contrast, SGD takes in account the cost gradient of only one training sample for each iteration, instead of using the sum of the cost gradient of the entire training dataset. Thus, learning can be fast to achieve a global cost minimum using SGD compared to conventional methods such as gradient descent. Backward propagation can compute the gradients in SGD in linear time compared to naive gradient computation methods which scale exponentially with the depth of the network.
Since SGD is an iterative method, it has a parameter called learning rate to reach the cost minimum. Specifically, the learning rate determines the influence of each updating step on the current value of the weights. Initially, the learning rate is set to a higher value and as the cost function starts decreasing, the learning rate becomes smaller following a shorter step size. Updating the weights using a single dataset pass (called one epoch) by SGD and backward propagation is, therefore, not sufficient as it leads to under-fitting the deep model. To prevent the under-fitting and to get the optimal performance, the deep network is trained using multiple epochs. The repeated weight updating results in optimal model fitting. The total number of training examples in a single epoch is called a batch. In case of large training sets, an entire epoch is too big to be passed through a network, and therefore the dataset is divided into batches, while the number of batches present in one epoch is called iterations. Weight decay is an additional term used while updating the weights and it prevents the weights grow too large after each update. In all of our experiments, we set the initial learning rate of our deep model at 0.001 which is decreased by a factor of 10 after every 50 epochs. The weight decay is 0.0005 with a mini batch size of 100. Finally, the best model is chosen after 500 epochs by evaluating the network performance in classifying face images across five palsy types.
Commonly, to evaluate the performance of a given algorithm, a single evaluation metric is not appropriate due to the presence of some imbalanced classes in the dataset or a large number of training labels [32]. Therefore, the performance of the deep model is reported in terms of four distinct metrics including accuracy, precision, sensitivity and F1 score [33]. Before further analysis, first a brief explanation of each of the four measures is given as follows.
  • Accuracy: The metric which represents correct predictions out of total predictions, i.e.,
    A c c u r a c y = T P + F N T P + F N + F P + T N
    where, TP, TN, FP, and FN represent true positive, true negative, false positive and false negatives respectively.
  • Precision: The precision metric represents the correctly predicted labels out of total true predictions as:
    P r e c i s i o n = T P T P + F P
  • Sensitivity: The recall metric is used to quantify the cases that are predicted correctly; predicted labels over all positive observations, i.e.,
    S e n s i t i v i t y = T P T P + F N
  • F1 score: The weighted average of precision and sensitivity is called F1 score as:
    F 1 = 2 P r e c i s i o n × s e n s i t i v i t y P r e c i s i o n + s e n s i t i v i t y
The accuracy of our proposed model on the test set is expressed in terms of a confusion matrix as shown in Figure 6.
By analyzing the confusion matrix, one can observe that the proposed method can predict the palsy types well. The highest classification accuracy is 0.969 attributed to the face palsy type 6 while the lowest classification accuracy is 0.891 attributed to the type 1 facial palsy. The average accuracy achieved by the VGG-16 network for underlying task is 0.926.
The precision, sensitivity and F1 score metrics for our proposed method are displayed in Table 3, where the performance comparison of VGG-16 net with [1,34] is presented. Precision and recall metrics represent the cases that are predicted correctly over all positive predictions and observations, respectively. The precision value of our method is 92.91% compared to 89.11% and 89.23% for [1,34] respectively. This indicates that the prediction accuracy of our classification model is better than the existing models. Similarly, the sensitivity of 93.14% implies better performance of the proposed method compared to the existing methods in classifying the facial palsy into one of the 5 grades. Finally, a F1 score of 93.00% is achieved compared to 89.66% and 90.00% for existing methods [1,34], respectively.

4. Results and Related Discussion

Based on the experimental results presented in this study, the following key observations are made.
  • Compared with traditional hand-crafted features, the palsy grading method in this paper is more effective and robust. This is because CNNs have been used to encode palsy-specific face features automatically. In traditional methods such as [1,2,3,4], both the landmark detection and feature extraction strategies are hand-crafted which limit the classification accuracy owing to non-optimal feature representation and landmark detection. In contrast, this method uses automatic face features to encode face representation and thus achieve superior classification accuracy across a range of facial palsy severity.
  • To the best of our knowledge, this is the first study to perform palsy grade classification on a large dataset containing 2000 face images. In contrast, the existing methods performed the similar task on quite smaller datasets. For example only 36 subjects have been analyzed in [1] for palsy classification. The smaller datasets have two main limitations. First, these datasets are less diverse in representing severity of palsy disease. Second they are not suitable to perform classification task using CNNs, owing to inherent problem of overfitting for small datasets. Recall that overfitting means lower training loss and higher validation loss due to poor generalization of the CNN models. Since our model is designed for large dataset, such an approach is useful for large scale applications such as primary health care, where smart-phones based palsy grading systems are not adequate.
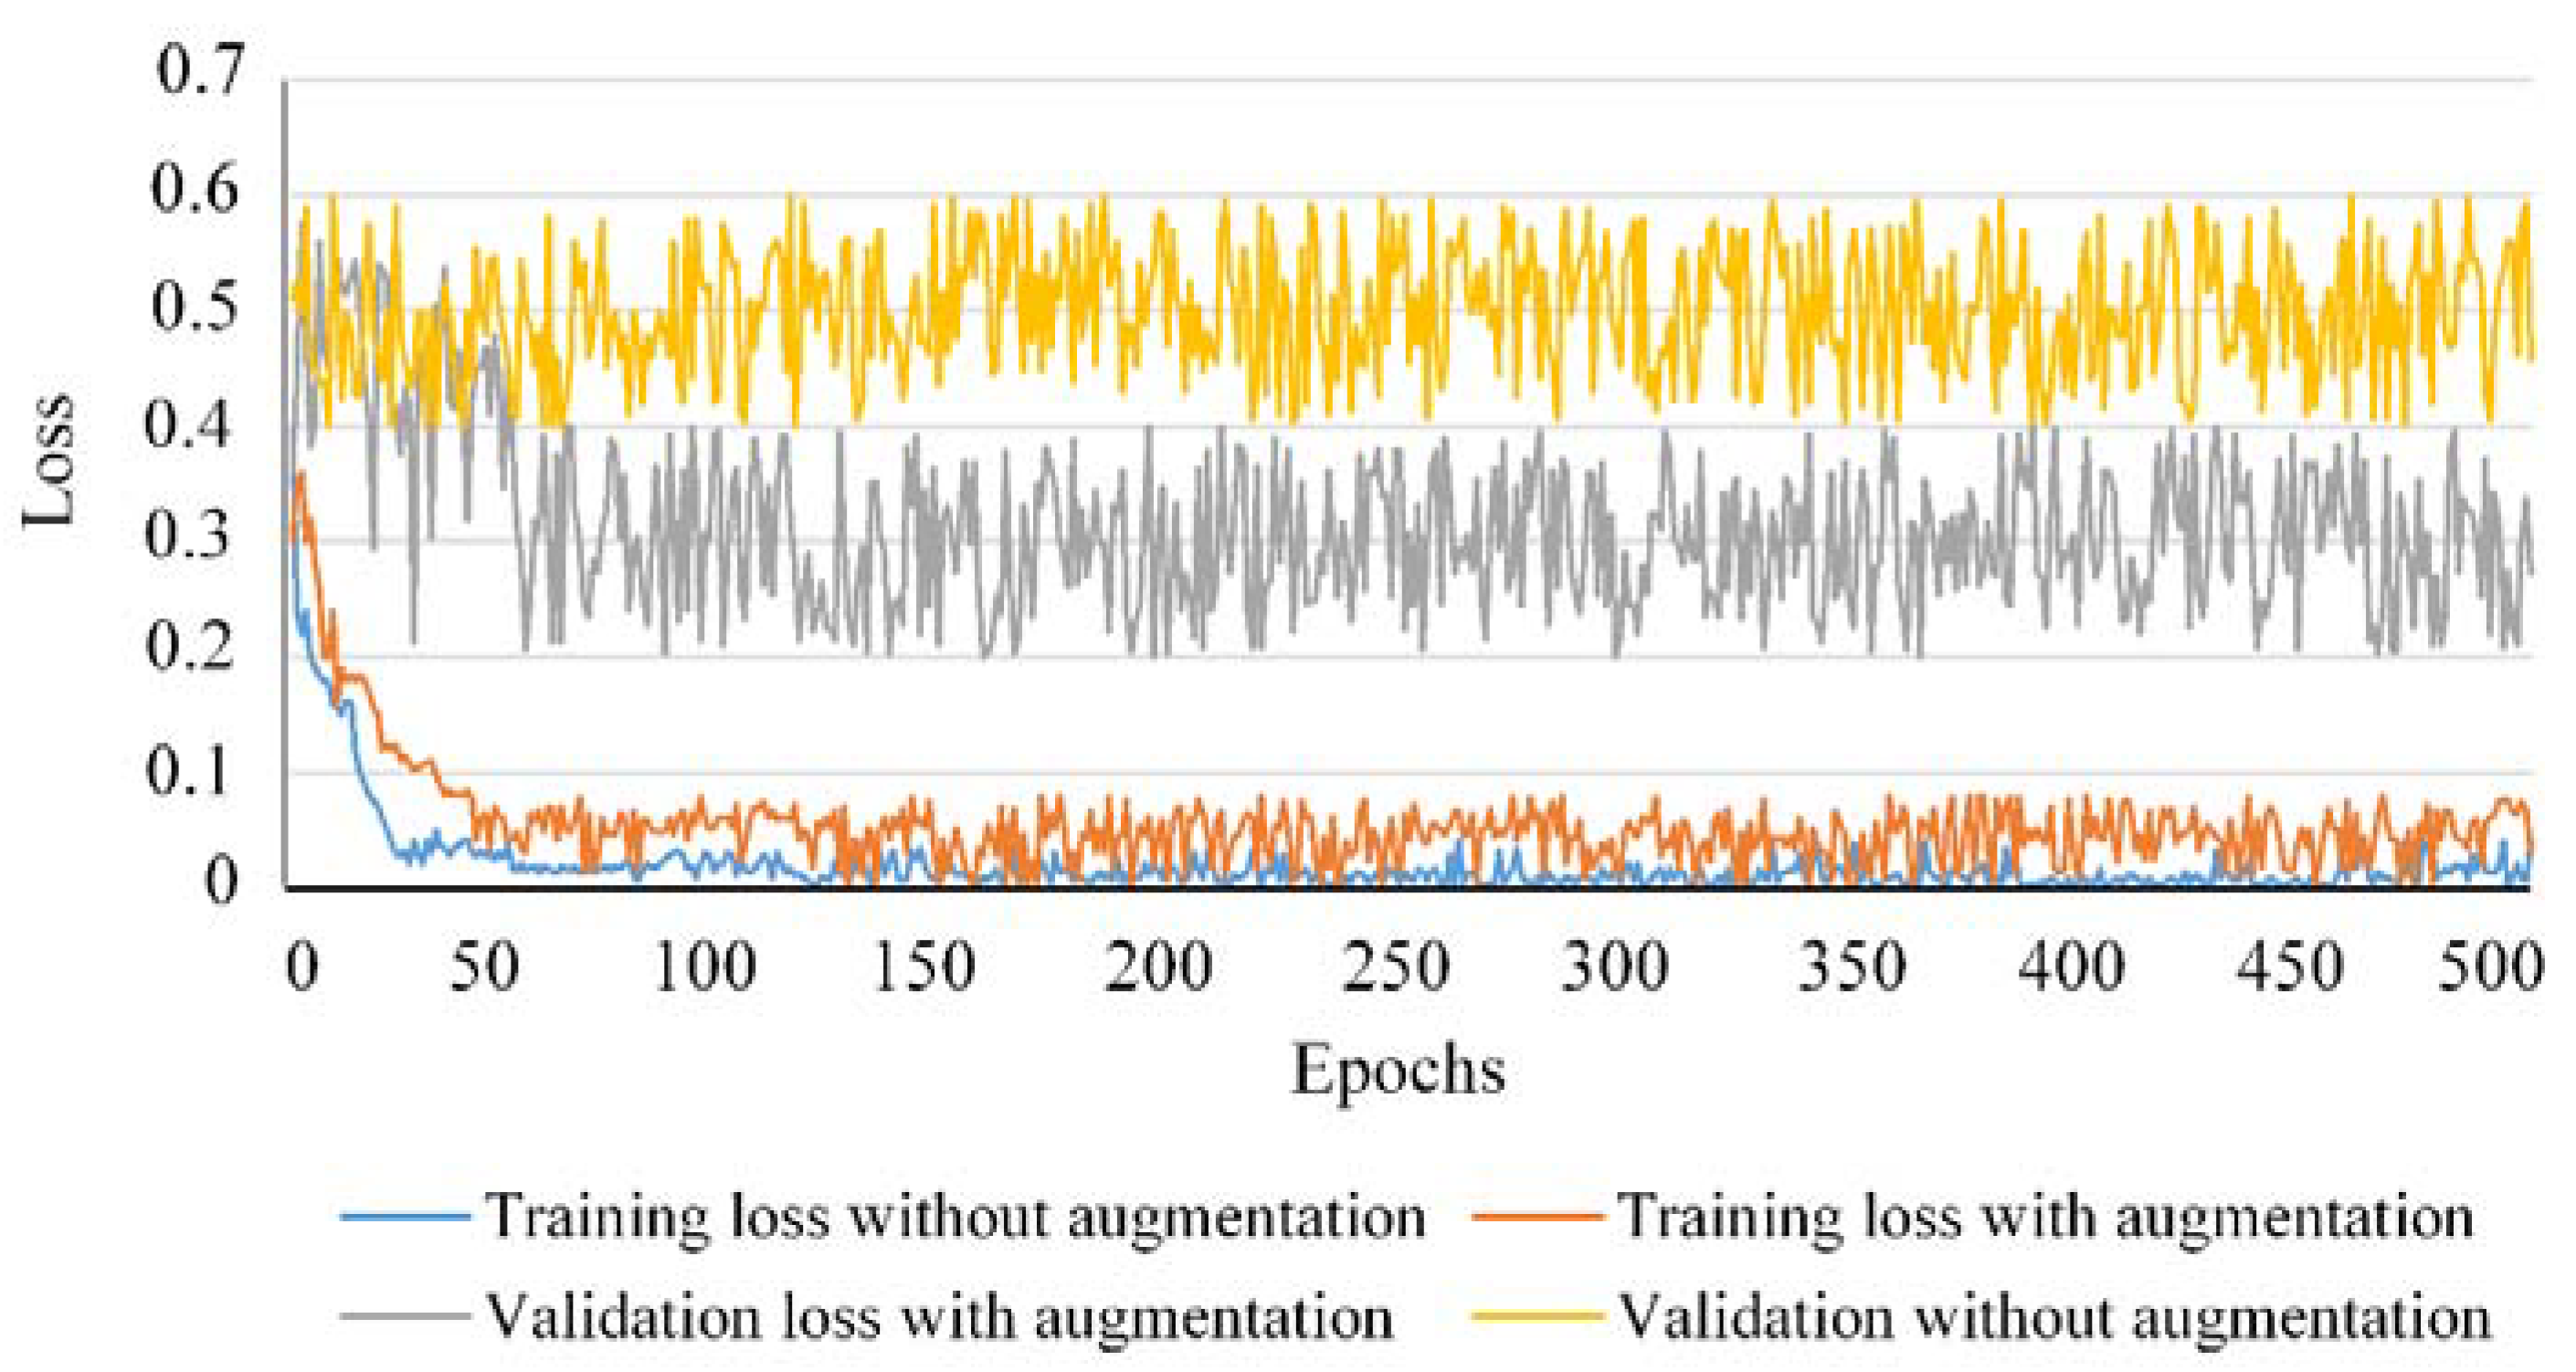
  • To prevent overfitting, a data augmentation strategy suitable for the underlying task of palsy grading has been proposed. To analyze the impact of the proposed data augmentation on classification accuracy, the training and validation losses for 500 epochs have been traced as shown in Figure 7. One can observe that the rate of overfitting is greatly reduced when the data augmentation strategy is applied compared to the scenario when no data augmentation was applied to train our classification model. The smaller difference between training and test losses caused by data augmentation shows how this strategy is useful for the classification model to learn the most discriminative features for the desired task. More precisely, the model works across a variety of palsy grades and preserves the discriminative information in the training stage. In the testing stage, a face image with arbitrary level of palsy severity can be easily classified into the true grading level. This suggests the efficacy of our method to prevent the classification model from overfitting and provides robustness for classification accuracy against varying nature of facial palsy disease.
  • Generally speaking, a single evaluation metric can lead to inappropriate classification results due to the presence of some imbalanced classes in the dataset or too small or large a number of training labels. To this end, some existing methods such as [1] expressed relevant classification performance in terms of accuracy metric only. In contrast, we reported the classification performance of our model using four distinct evaluation metrics including accuracy, precision, sensitivity and F1 score. The experimental results displayed in Table 3 show the consistent performance of our model in palsy grade classification across a variety of evaluation metrics, i.e., accuracy, precision, sensitivity and F1 score. This suggests the effectiveness of our method for underlying task in the presence of a wide variety of palsy disease ranging from mild to total paralysis of face.
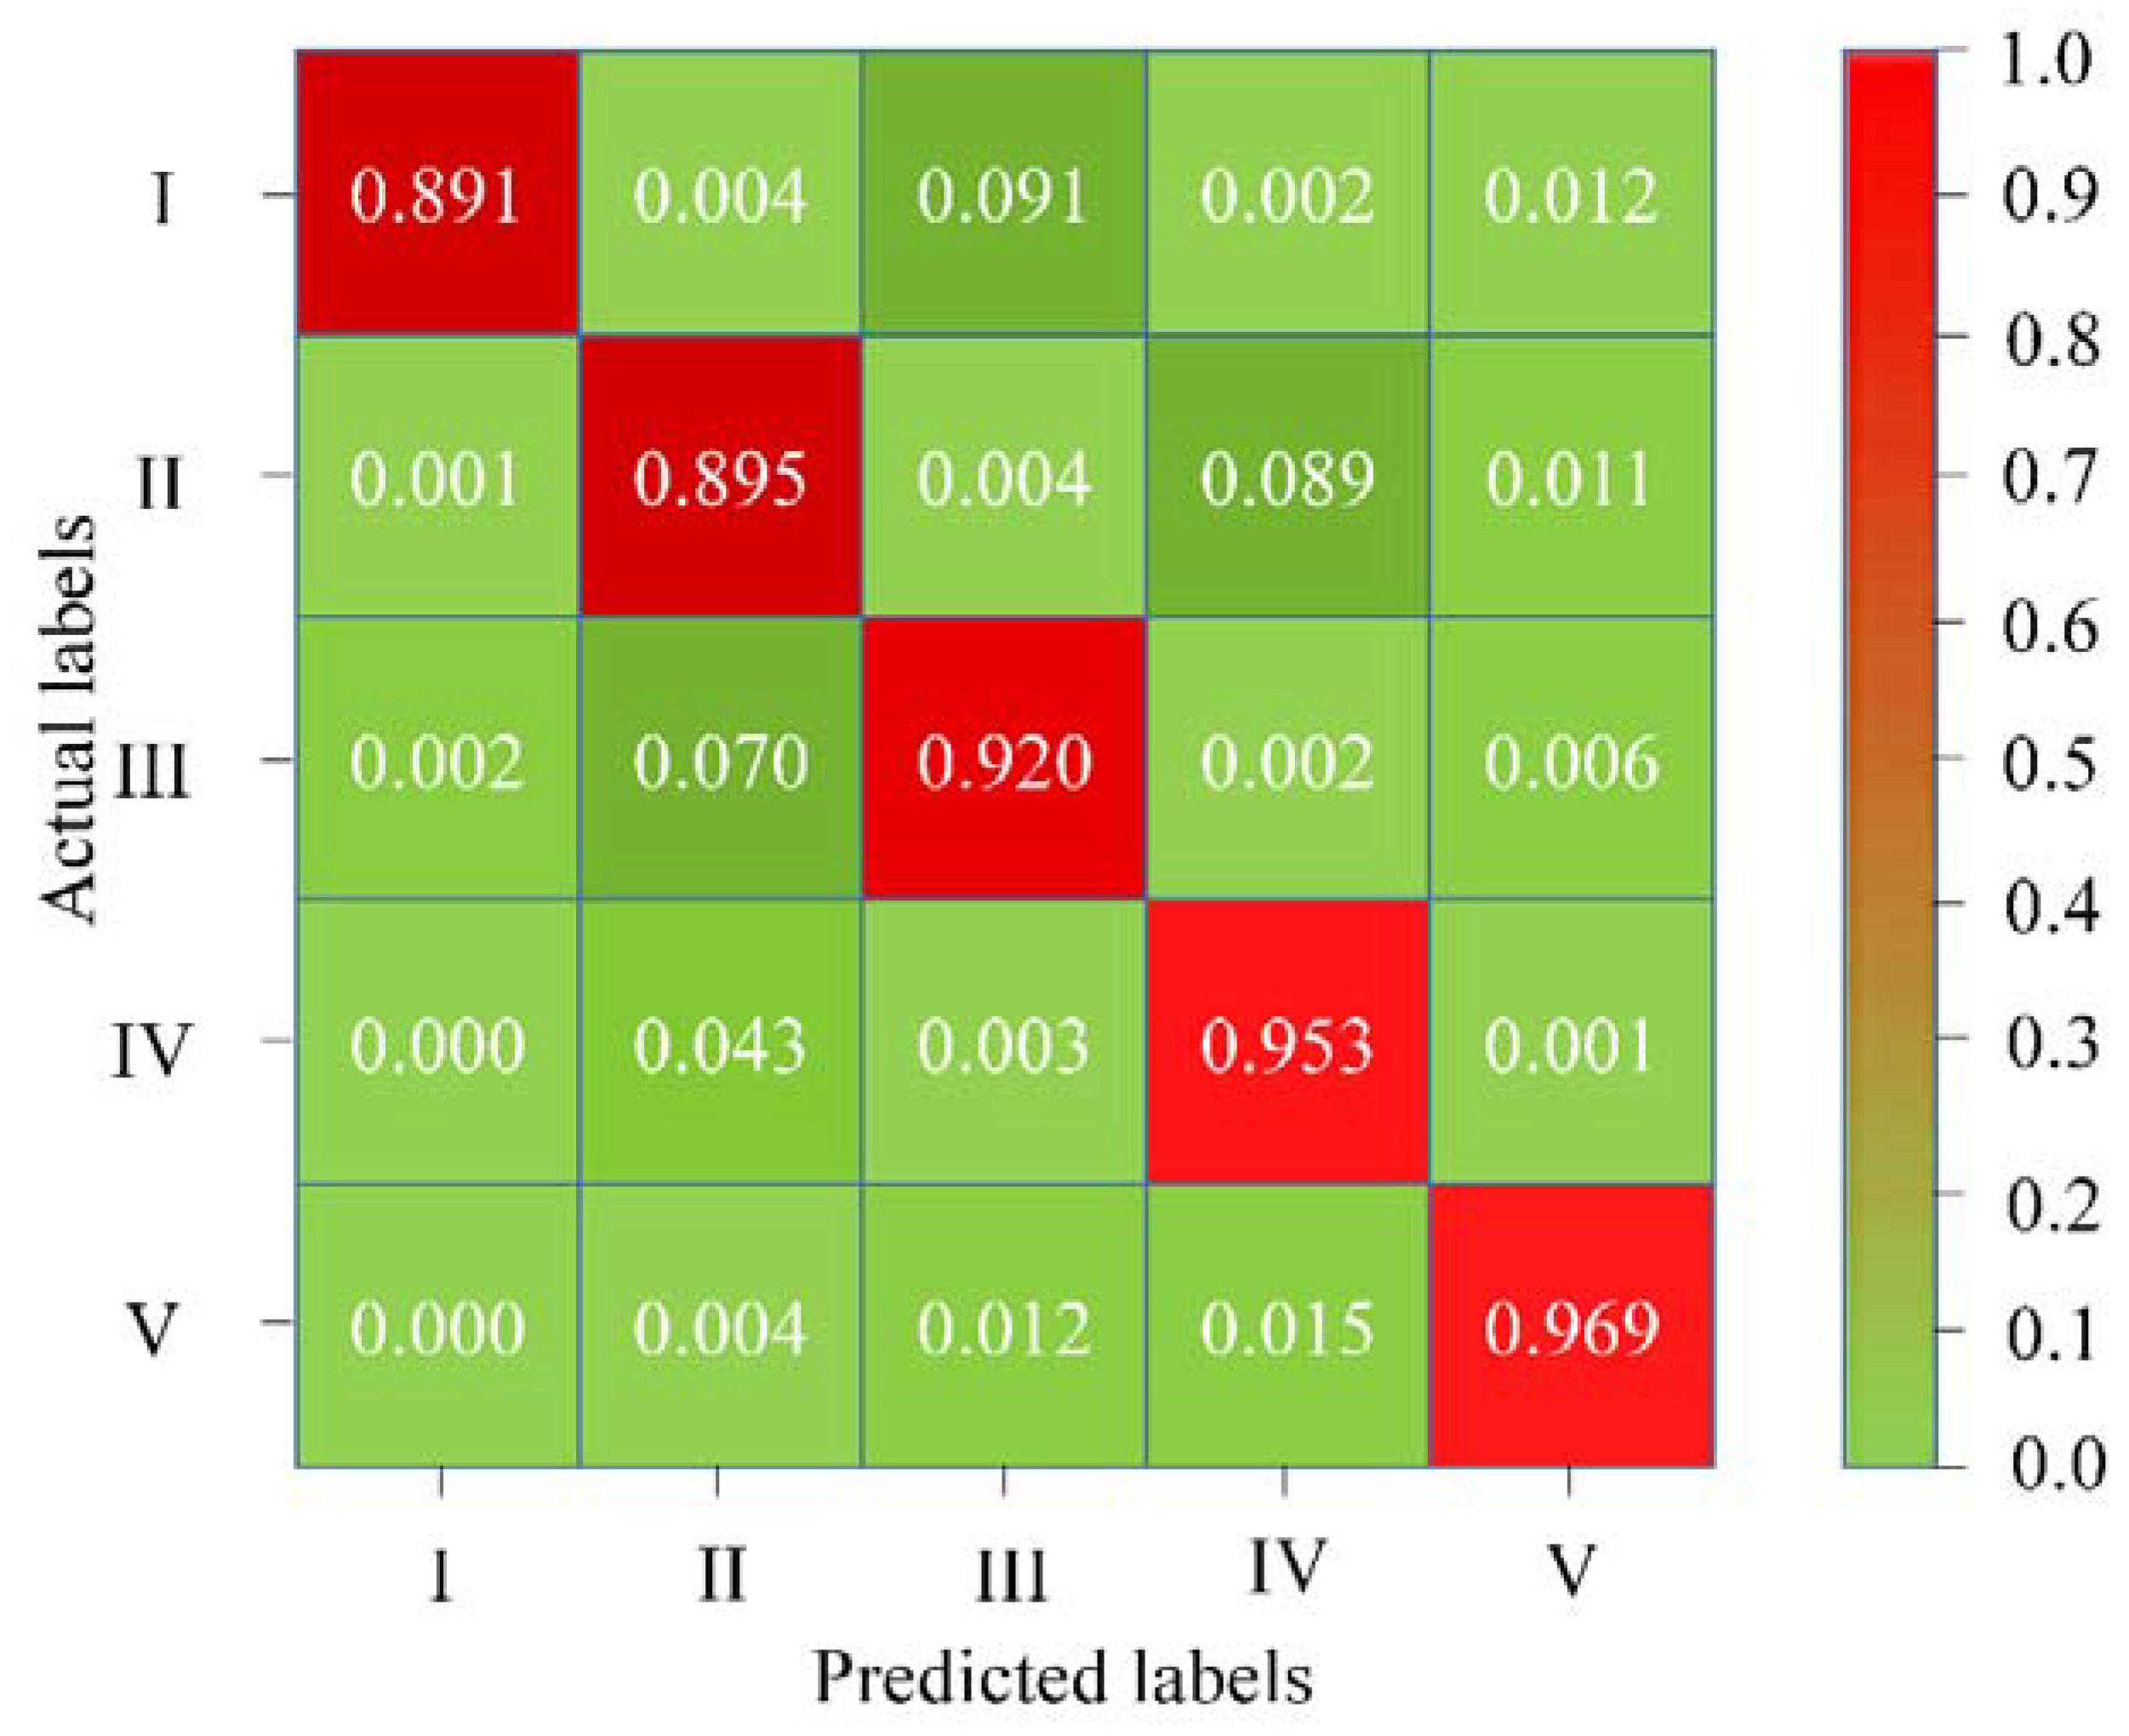
  • The confusion matrix displayed in Figure 6 shows that if the facial palsy is more obvious, the classification ability of our model is also stronger. For example, the classification accuracy for grade V palsy is the highest (96.90%) among all grades. This is because this type of facial palsy can be expressed more effectively by the underlying model. In contrast, the classification performance for mild and moderate facial palsy for grade I and II respectively, is relatively lower (89.10% and 89.50%) owing to lesser palsy-specific discriminative information presented to the model.
  • The literature review of the existing methods on palsy grade classification reveals that inherent in these methods is a major limitation in terms of repeatability. Repeatability is a very important factor for a reliable classification system and can be evaluated through an experiment under repeated measurements of the same subject over a short period. For example, the study presented in [1] describes the unavailability of repeatability as one of its main limitations. This issue has been addressed in this study by leveraging the advantage of the data augmentation strategy suitable for a particular scenario of palsy grade classification. More precisely, face photos of a given image are generated across a variety of palsy severities ranging from mild to total paralysis. This type of data augmentation makes our model capable of learning varying palsy severities which can substitute the repeated measurements and thus helpful in the repeatability of the classification system.
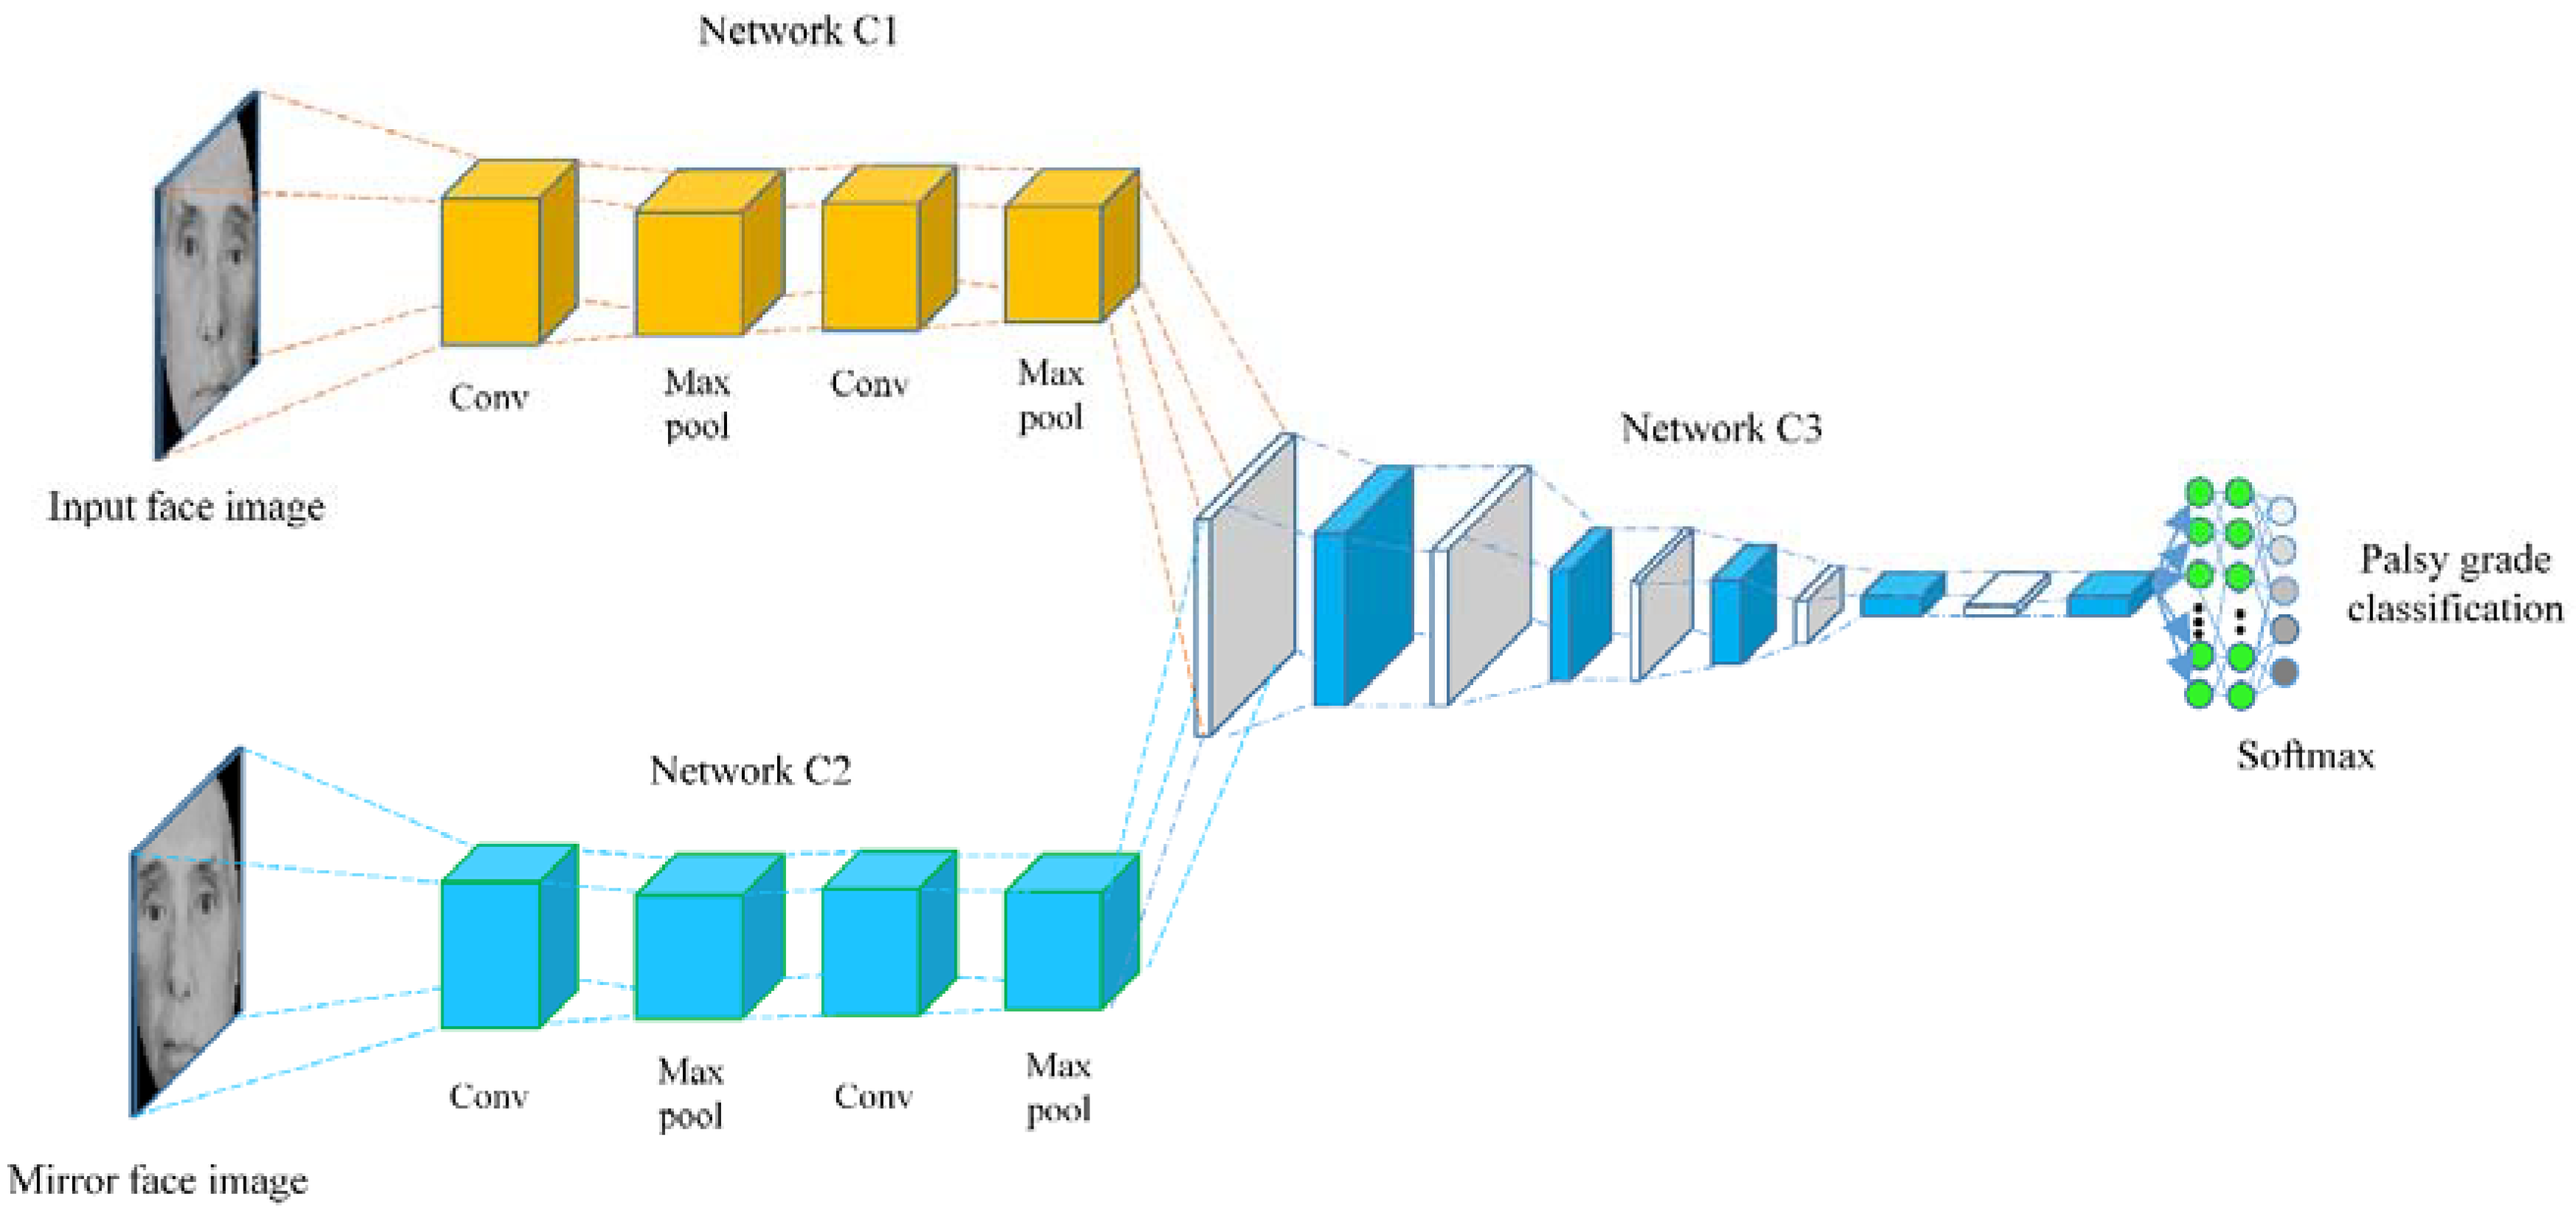
  • The CNN-based classification model is the core of this article with GAN-based face image generation as the necessary step to achieve the overall robust classification of palsy grades. The proposed model has managed to classify facial palsy into one of the five major types benchmarked by House and Brackmann [23]. The practical significance is proved through the performance indicators in Figure 6 and Table 3. Compared with existing methods, we break the restrictions of dividing face images into regions for classification purposes. For example, the study presented in [12] proposed to train artificial neural networks on bilateral displacements and regional mean intensities to quantify the damage caused by facial palsy. In contrast, our model achieves the palsy grade classification based on the automatic asymmetry feature extraction. The most important advancement is the integral analysis of patients’ faces instead of regions on a large dataset.

5. Conclusions

In this paper a CNN-based model was presented to classify face images carrying palsy into five distinct grades benchmarked by House and Brackmann [23]. The study offers a unique mechanism for learning palsy-specific asymmetric face features and configuring CNN capabilities through an appropriate data augmentation strategy to accurately classify face images with palsy disease. The experimental results achieved on a large dataset suggest that, firstly, it is more appropriate to use CNN-based asymmetrical features instead of hand-crafted features for the palsy grade classification task. Secondly, the data augmentation can add to the repeatability of the grading system which is imperative for robust classification. Thirdly, the proposed model evaluates the classification results across a variety of evaluation metrics showing its efficacy in classifying face images against five distinct palsy grades. Fourthly, the proposed model offers an integral analysis of whole face image instead of different facial parts. This offers the advantage of analyzing the effects of palsy on the entire face image. Finally, our model is more adaptable for palsy classification on large-scale applications such as primary health care systems.
In the future research, the current dataset will be extended into a more standardized one, by including a greater number of face images labelled with demographic information including age, gender and race. As the data set grows stronger with additional information, we will consider analyzing the effects of different populations on palsy disease and its grading. Additionally, the performance comparison of different pre-trained CNN models in classifying face images with palsy disease will be considered as a potential research problem.

Author Contributions

M.S. and I.R. supervised the study. T.S. and S.M. collected the dataset and prepared the figures. M.S., S.M. and I.R. programmed the model and wrote the manuscript. S.A., and M.J.A.B. took part in revising the manuscript.

Funding

This research received no external funding.

Conflicts of Interest

None of the authors of this paper declare any conflict of interest.

References

  1. Kim, H.S.; Kim, S.Y.; Kim, Y.H.; Park, K.S. A smartphone-based automatic diagnosis system for facial nerve palsy. Sensors 2015, 15, 26757–26768. [Google Scholar] [CrossRef] [PubMed]
  2. Wang, T.; Dong, J.; Sun, X.; Zhang, S.; Wang, S. Automatic recognition of facial movement for paralyzed face. Biomed. Mater. Eng. 2014, 24, 2751–2760. [Google Scholar] [PubMed]
  3. He, S.; Soraghan, J.J.; O’Reilly, B.F.; Xing, D. Quantitative analysis of facial paralysis using local binary patterns in biomedical videos. IEEE Trans. Biomed. Eng. 2009, 56, 1864–1870. [Google Scholar] [CrossRef] [PubMed]
  4. Delannoy, J.R.; Ward, T.E. A preliminary investigation into the use of machine vision techniques for automating facial paralysis rehabilitation therapy. In Proceedings of the IET Irish Signals and Systems Conference (ISSC 2010), Cork, Ireland, 23–24 June 2010. [Google Scholar]
  5. Walley, J.; Lawn, J.E.; Tinker, A.; de Francisco, A.; Chopra, M.; Rudan, I.; Black, R.E. Primary health care: Making Alma-Ata a reality. Lancet 2008, 372, 1001–1007. [Google Scholar] [CrossRef]
  6. Sumithra, R.; Suhil, M.; Guru, D.S. Segmentation and classification of skin lesions for disease diagnosis. Procedia Comput. Sci. 2015, 45, 76–85. [Google Scholar] [CrossRef]
  7. Yuan, X.; Situ, N.; Zouridakis, G. A narrow band graph partitioning method for skin lesion segmentation. Pattern Recognit. 2009, 42, 1017–1028. [Google Scholar] [CrossRef]
  8. Manoorkar, P.B.; Kamat, D.K.; Patil, P.M. Analysis and classification of human skin diseases. In Proceedings of the 2016 International Conference on Automatic Control and Dynamic Optimization Techniques (ICACDOT), Pune, India, 9–10 September 2016. [Google Scholar]
  9. El abbadi, N.K.; Dahir, N.; Al-Dhalimi, M.; Restom, H. Psoriasis detection using skin color and texture features. J. Comput. Sci. 2010, 6, 648–652. [Google Scholar] [CrossRef]
  10. Ciregan, D.; Meier, U.; Schmidhuber, J. Multi-column deep neural networks for image classification. In Proceedings of the 2012 IEEE Conference on Computer Vision and Pattern Recognition, Providence, RI, USA, 16–21 June 2012. [Google Scholar]
  11. Sermanet, P.; Chintala, S.; LeCun, Y. Convolutional neural networks applied to house numbers digit classification. In Proceedings of the 21st International Conference on Pattern Recognition (ICPR2012), Tsukuba, Japan, 11–15 November 2012. [Google Scholar]
  12. McGrenary, S.; O’Reilly, B.F.; Soraghan, J.J. Objective grading of facial paralysis using artificial intelligence analysis of video data. In Proceedings of the 18th IEEE Symposium on Computer-Based Medical Systems, Dublin, Ireland, 23–24 June 2005. [Google Scholar]
  13. Wang, K.; Luo, J. Detecting visually observable disease symptoms from faces. EURASIP J. Bioinf. Syst. Biol. 2016, 2016, 13. [Google Scholar] [CrossRef] [PubMed]
  14. Liao, H.; Li, Y.; Luo, J. Skin disease classification versus skin lesion characterization: Achieving robust diagnosis using multi-label deep neural networks. In Proceedings of the International Conference on Pattern Recognition, Cancun, Mexico, 4–8 December 2016. [Google Scholar]
  15. Ge, Z.; Demyanov, S.; Bozorgtabar, B.; Abedini, M.; Chakravorty, R.; Bowling, A.; Garnavi, R. Exploiting local and generic features for accurate skin lesions classification using clinical and dermoscopy imaging. In Proceedings of the 14th International Symposium on Biomedical Imaging, Melbourne, VIC, Australia, 18–21 April 2017. [Google Scholar]
  16. Shen, X.; Zhang, J.; Yan, C.; Zhou, H. An automatic diagnosis method of facial acne ulgaris based on convolutional neural network. Sci. Rep. 2018, 8, 5839. [Google Scholar] [CrossRef] [PubMed]
  17. Goldberg, C.; Catalog of Clinical Images. UCSD School of Medicine and VA Medical Center. Available online: http://meded.ucsd.edu/clinicalimg/ (accessed on 25 May 2018).
  18. The Primary Care Dermatology Society (PCDS). Available online: http://www.pcds.org.uk (accessed on 20 May 2018).
  19. Wang, K.; Luo, J. Clinical Images for Symptoms on Face, University of Rochester. 2015. Available online: http://tinyurl.com/h77ty86 (accessed on 20 May 2018).
  20. Hinton, G.E.; Srivastava, N.; Krizhevsky, A.; Sutskever, I.; Salakhutdinov, R.R. Improving neural networks by preventing co-adaptation of feature detectors. arXiv, 2012; arXiv:1207.0580. [Google Scholar]
  21. Krizhevsky, A.; Sutskever, I.; Hinton, G.E. Imagenet classification with deep convolutional neural networks. Adv. Neural Inf. Process. Syst. 2012, 25, 1097–1105. [Google Scholar] [CrossRef]
  22. He, K.; Zhang, X.; Ren, S.; Sun, J. Delving deep into rectifiers: Surpassing human-level performance on imagenet classification. In Proceedings of the IEEE International Conference on Computer Vision, Santiago, Chile, 7–13 December 2015. [Google Scholar]
  23. House, J.W.; Brackmann, D.E. Facial nerve grading system. Otolaryngol. Head Neck Surg. 1985, 93, 146–147. [Google Scholar] [CrossRef] [PubMed]
  24. Goodfellow, I.; Pouget-Abadie, J.; Mirza, M.; Xu, B.; Warde-Farley, D.; Ozair, S.; Courville, A.; Bengio, Y. Generative Adversarial Nets. Adv. Neural Inf. Process. Syst. 2014, 27, 2672–2680. [Google Scholar]
  25. Han, H.; Otto, C.; Liu, X.; Jain, A.K. Demographic estimation from face images: Human vs. machine performance. IEEE Trans. Pattern Anal. Mach. Intell. 2015, 37, 1148–1161. [Google Scholar] [CrossRef] [PubMed]
  26. Chollet, F. Keras. 2015. Available online: https://github.com/fchollet/keras (accessed on 8 April 2018).
  27. Lemley, J.; Bazrafkan, S.; Corcoran, P. Smart augmentation learning an optimal data augmentation strategy. IEEE Access 2017, 5, 5858–5869. [Google Scholar] [CrossRef]
  28. Simonyan, K.; Zisserman, A. A Very deep convolutional networks for large-scale image recognition. arXiv, 2014; arXiv:1409.1556. [Google Scholar]
  29. Russakovsky, O.; Deng, J.; Su, H.; Krause, J.; Satheesh, S.; Ma, S.; Huang, Z.; Karpathy, A.; Khosla, A.; Bernstein, M.; et al. Imagenet large scale visual recognition challenge. Int. J. Comput. Vis. 2015, 115, 211–252. [Google Scholar] [CrossRef]
  30. Brachmann, A.; Redies, C. Using convolutional neural network filters to measure left-right mirror symmetry in images. Symmetry 2016, 8, 144. [Google Scholar] [CrossRef]
  31. Lecun, Y.; Bottou, L.; Bengio, Y.; Haffner, P. Gradient-based learning applied to document recognition. Proc. IEEE 1998, 11, 2278–2324. [Google Scholar] [CrossRef]
  32. Moayedikia, A.; Ong, K.L.; Boo, Y.L.; Yeoh, W.G. Feature selection for high dimensional imbalanced class data using harmony search. Eng. Appl. Artif. Intell. 2017, 57, 38–49. [Google Scholar] [CrossRef]
  33. Powers, D.M. Evaluation: From precision, recall and F-measure to ROC, informedness, markedness and correlation. J. Mach. Learn. Technol. 2011, 2, 37–63. [Google Scholar]
  34. Song, I.; Yen, N.Y.; Vong, J.; Diederich, J.; Yellowlees, P. Profiling Bell’s Palsy based on House-BrackMann score. J. Artif. Intell. Soft Comput. Res. 2013, 3, 41–50. [Google Scholar] [CrossRef]
Figure 1. The process of facial palsy grading.
Symmetry 10 00242 g001
Figure 2. Example face images with palsy disease.
Symmetry 10 00242 g002
Figure 3. Face synthesis using GAN.
Symmetry 10 00242 g003
Figure 4. Data augmentation by generated face images using a generative adversial network (GAN) representing (a) mild, (b) moderate (c) moderately severe, (d) severe, (e) total paralysis.
Symmetry 10 00242 g004
Figure 5. The procedure of feature learning using convolutional neural networks (CNNs).
Symmetry 10 00242 g005
Figure 6. Confusion matrix with actual and predicted labels.
Symmetry 10 00242 g006
Figure 7. Training and test losses showing reduced overfitting when data augmentation is used compared to the scenario when data augmentation is not used.
Symmetry 10 00242 g007
Table 1. Facial palsy grades according to severity level [23].
Palsy GradeSeverityDescription
IMildThe forehead, eyes and mouth show moderate to good function with slight facial asymmetry.
IIModerateSlight to moderate changes around mouth and eyes, with slight facial asymmetry.
IIIModerately severeEyes are not completely closed despite efforts, and mouth exhibits asymmetry with maximum effort.
IVSevereEyes show incomplete closure and mouth shows asymmetry.
VTotal paralysisRemarked facial asymmetry without movement.
Table 2. Data subsets used in the classification task.
Data SubsetPalsy Grades
IIIIIIIVVTotal
Training (augmented subset)206617569128943726000
Validation1511091118156500
Testing1441161037851500
Total23611981112610534797000
Table 3. Performance comparison of VGG-16 and existing methods in classifying palsy types.
ApproachFeaturesAverage Classification Accuracy (%)PrecisionSensitivityF1 Score
Reference [1]Bilateral facial landmarks with support vector machine (SVM) and linear discriminant analysis (LDA) as classifiers88.9087.1190.0786.66
Reference [34]Emergent self-organizing map and SVM classifier89.0089.2388.4988.00
VGG-16 Net (Our method)Deep feature learning on augmented dataset92.6092.9193.1493.00

