Article

A Hybrid Neutrosophic Group ANP-TOPSIS Framework for Supplier Selection Problems

by
Mohamed Abdel-Basset
1,*,
Mai Mohamed
1 and
Florentin Smarandache
2
1
Department of Operations Research, Faculty of Computers and Informatics, Zagazig University, Sharqiyah 44519, Egypt
2
Math & Science Department, University of New Mexico, Gallup, NM 87301, USA
*
Author to whom correspondence should be addressed.
Symmetry 2018, 10(6), 226; https://doi.org/10.3390/sym10060226
Submission received: 9 May 2018 / Revised: 10 June 2018 / Accepted: 12 June 2018 / Published: 15 June 2018

Abstract

:
One of the most significant competitive strategies for organizations is sustainable supply chain management (SSCM). The vital part in the administration of a sustainable supply chain is the sustainable supplier selection, which is a multi-criteria decision-making issue, including many conflicting criteria. The valuation and selection of sustainable suppliers are difficult problems due to vague, inconsistent and imprecise knowledge of decision makers. In the literature on supply chain management for measuring green performance, the requirement for methodological analysis of how sustainable variables affect each other, and how to consider vague, imprecise and inconsistent knowledge, is still unresolved. This research provides an incorporated multi-criteria decision-making procedure for sustainable supplier selection problems (SSSPs). An integrated framework is presented via interval-valued neutrosophic sets to deal with vague, imprecise and inconsistent information that exists usually in real world. The analytic network process (ANP) is employed to calculate weights of selected criteria by considering their interdependencies. For ranking alternatives and avoiding additional comparisons of analytic network processes, the technique for order preference by similarity to ideal solution (TOPSIS) is used. The proposed framework is turned to account for analyzing and selecting the optimal supplier. An actual case study of a dairy company in Egypt is examined within the proposed framework. Comparison with other existing methods is implemented to confirm the effectiveness and efficiency of the proposed approach.

1. Introduction

The major priority for decision makers and managers in many fields such as agriculture, tourism, business development or manufacturing is the management of environmental and social issues, and the emergency to address them with the economic factors [1]. The sustainability is the synthesis of social, environmental and economic development [2]. The sustainability applies to all pertinent supply chain sides in supply chain management [3]. In sustainable supply chain management, managers seek to enhance the economic realization of their organization not only to survive, but also to succeed in close and distant future. The social and environmental activities that can enhance economic goals of organizations should be undertaken by managers in sustainable supply chain management [4]. Selecting the sustainable suppliers is very significant when designing new strategies and models in the case of lack of available knowledge and resources. Thus, the most important part in sustainable supply chain management is to construct and implement an effective and efficient supplier section process [5]. The supplier selection problems, combining social and environmental factors for estimating and ranking suppliers to select the best, can be regarded as a sustainable supplier selection problems (SSSPs). The selection process of sustainable suppliers involves several conflicting criteria. The evaluation and selection of suppliers is very difficult due to vague, inconsistent and imprecise knowledge of decision makers. In order to deal with vague information, Zadeh introduced the theory of fuzzy sets in 1965 [6]. It is difficult to identify the truth-membership degree of a fuzzy set to a specific value. Therefore, Turksen introduced interval-valued fuzzy sets in 1986 [7]. Because fuzzy set only considers the truth-membership (membership) degree and fails to consider falsity-membership (non-membership) degree, Atanassov introduced intuitionistic fuzzy sets [8]. Moreover, intuitionistic fuzzy sets were expanded to interval-valued intuitionistic fuzzy sets [9]. The intuitionistic fuzzy sets have been exercised to disband multi-criteria decision-making problems [10,11,12]. The fuzzy and intuitionistic fuzzy sets fail to treat all types of uncertainties such as indeterminacy and inconsistency that exist usually in natural decision-making processes. For instance, when a decision maker gives his/her judgment toward anything, he/she may say that: this statement is 50% correct, 60% false and 20% I am not sure [13]. From this concept, Smarandache suggested the neutrosophic logic, probability and sets [14,15,16]. In neutrosophy, the indeterminacy degree is independent of truth and falsity degrees [17]. To facilitate the practical side of neutrosophic sets, a single-valued neutrosophic set (SVNS) was presented [13,18]. In real life problems, the statement could not be accurately defined by a certain degree of truth, indeterminacy and falsity, but indicated by various interval values. Therefore, interval neutrosophic set (INS) was conceptualized. The interval neutrosophic set (INS) was introduced by Wang et al. [19]. The authors in [17] used interval-valued neutrosophic set to present multi-criteria decision-making (MCDM) problems using aggregation operators. The neutrosophic linguistic environment was used by Broumi and Smarandache [20] to deal with multi-criteria decision-making problems. Zhang et al. [21] introduced an outranking technique to solve MCDM problems by using an interval-valued neutrosophic set. However, the current literature did not advance the integration of ANP and TOPSIS using INS for solving sustainable supplier selection problems. Consequently, we are the first to use an interval-valued neutrosophic set for representing a group ANP-TOPSIS framework for sustainable supplier selection.

Research Contribution

Our contribution can be summed up as follows:
  • The sustainable supplier selection is a multi-criteria decision-making issue including many conflicting criteria. The valuation and selection of sustainable suppliers is a difficult problem due to vague, inconsistent and imprecise knowledge of decision makers. The literature on supply chain management for measuring green performance, the requirement for methodological analysis of how sustainable variables affect each other and of how to consider vague, imprecise and inconsistent knowledge is somehow inconclusive, but these drawbacks have been treated in our research.
  • In most cases, the truth, falsity and indeterminacy degrees cannot be defined precisely in the real selection of sustainable suppliers, but denoted by several possible interval values. Therefore, we presented ANP TOPSIS, and combined them with interval-valued neutrosophic sets to select sustainable suppliers for the first time.
  • The integrated framework leads to accurate decisions due to the way it treats uncertainty. The sustainable criteria for selecting suppliers are determined from the cited literature and the features of organizations under analysis. Then, the decision makers gather data and information.
  • We select ANP and TOPSIS for solving sustainable supplier selection problems for the following reasons:
    -
    Since the independent concept of criteria is not constantly right and in actual life, there exist criteria dependent on each other, and we used ANP for precise weighting of criteria.
    -
    The ANP needs many pairwise comparison matrices based on numerals and interdependence of criteria and alternatives, and, to escape this drawback, the TOPSIS was used to rank alternatives.
    -
    The main problem of sustainable supplier selection problems is how to design and implement a flexible model for evaluating all available suppliers; since it considers the uncertainty that usually exists in real life, our model is the best.
    -
    The proposed framework is used to study the case of a dairy and foodstuff company in Egypt, and can be employed to solve any sustainable supplier selection problem of any other company.
    -
    Comparison with other existing methods, which are popular and attractive, was presented to validate our model.
The plan of this research is as follows: a literature review on the multi-criteria decision-making techniques to disband sustainable supplier selection problems is presented in Section 2. The basic concepts and definitions of interval-valued neutrosophic sets and its operations are discussed in Section 3. The ANP and TOPSIS methods are described in Section 4. The proposed framework for selecting optimal suppliers is presented in Section 5. An actual case study of a dairy and foodstuff company in Egypt is examined in Section 6. The conclusion and future directions are presented in Section 7.

2. Literature Review

Many research works intensify a supplier selection problem using various MCDM methods. For listing the optimal supplier under environmental factors, Govindan et al. [22] proposed a fuzzy TOPSIS framework. For evaluating sustainable suppliers’ performance in a supply chain, Erol et al. [23] validated a multi-criteria setting based on fuzzy multi-attribute utility. The fuzzy inference system, the fuzzy logic and ranking method are used to address the subjectivity of DM estimation.
To handle sustainable supplier selection in a group decision environment, Wen et al. [24] proposed a fuzzy intuitionistic TOPSIS model. To analyze sustainability criteria and select the optimal sustainable supplier, Orji and Wei [25] used fuzzy logic, decision-making trial and evaluation laboratory (DEMATEL) and TOPSIS.
To bridge the gap between numerous existing research works on supplier selection and others who depend on environmental issues, Shaw et al. [26] were the first to employ AHP in fuzzy environment for green supplier selection. The fuzzy ANP and multi-person decision-making schema through imperfect preference relations are used by Buyukozkan and Cifci [27].
The requirements of company stakeholders are translated into multiple criteria for supplier selection by Ho et al. [28] by using a QFD approach. A family group decision-making model was developed by Dursun and Karsak [29] by using a QFD method to determine the characteristics that a product must hold to achieve customer needs and construct the assessment criteria for suppliers. A two-stage structure including data envelopment analysis (DEA) and rough set theory was proposed by Bai and Sarkis [30] to determine and evaluate relative performance of suppliers.
To rank sustainable suppliers, Kumar et al. [31] proposed a unified green DEA model. A fuzzy DEA model was used by Azadi et al. [32] to measure the efficiency, effectiveness and productivity of sustainable suppliers. To optimize supplier selection processes, numerous models have been integrated. The integrated analytic frameworks were combined through the recent research: ANP and/or AHP integrated with QFD by many researchers [33,34,35,36,37,38]. The DEMATEL was integrated with fuzzy ANP and TOPSIS as in [39]. Kumaraswamy et al. [40] integrated QFD with TOPSIS.
The integration of a fuzzy Delphi approach, ANP and TOPSIS were proposed by Chung et al. [41] for supplier selection. A review of multi-attribute decision-making techniques for evaluating and selecting suppliers in fuzzy environment is presented in [42]. In addition, the ANP was integrated with intuitionistic fuzzy TOPSIS by Rouyendegh [43] for selecting an optimal supplier. Tavana et al. [44] integrated ANP with QFD for sustainable supplier selection.
A neutrosophic group decision-making technique based on TOPSIS was proposed by Şahin and Yiğider for a supplier selection problem [45]. A hybrid multi-criteria group decision-making technique based on interval-valued neutrosophic sets was proposed by Reddy et al. [46] for lean supplier selection. An extended version of EDAS using an interval valued neutrosophic set for a supplier selection problem is presented in [47]. A quality function deployment technique for supplier selection and evaluation based on an interval neutrosophic set is presented in [48]. To develop supplier selection criteria, the DEMATEL technique is presented in neutrosophic environment, as in [49].
The main criteria for supplier selection problems have been identified in many studies. The economic factors, which were considered in traditional supplier selection methods, are as follows:
  • Cost,
  • Quality,
  • Flexibility,
  • Technology capability.
There exist environmental factors for sustainable supplier selection as follows:
  • Defilement production,
  • Resource exhaustion,
  • Eco-design and environmental administration.
The critical aspects of selecting green sustainable factors of supply chain design were provided by Dey and Ho [38] in a review of the recent research development.

3. Preliminaries

The significant definitions of interval-valued neutrosophic sets and its operations are presented in this section.

3.1. Interval-Valued Neutrosophic Sets (INS)

The interval-valued neutrosophic set V in X is described by truth T V ( x ) , indeterminacy I V ( x ) and falsity F V ( x ) membership degrees for each x X . Here, T V ( x ) = [ T V L ( x ) , T V U ( x ) [ 0 ,   1 ] ] , I V ( x ) = [ I V L ( x ) , I V U ( x ) [ 0 ,   1 ] ] and F V ( x ) = [ F V L ( x ) , F V U ( x ) [ 0 ,   1 ] ] . Then, we can write interval-valued neutrosophic set as V = < [ T V L ( x ) , T V U ( x ) ] , [ I V L ( x ) , I V U ( x ) ] , [ F V L ( x ) , F V U ( x ) ] > .
The INS is a neutrosophic set.

3.2. The Related Operations of Interval-Valued Neutrosophic Sets

  • Addition
    Let A 1 , A 2 be two INSs, where
    A 1 = < [ T A 1 L , T A 1 U ] , [ I A 1 L , I A 1 U ] , [ F A 1 L , F A 1 U ] > , A 2 = < [ T A 2 L , T A 2 U ] , [ I A 2 L , I A 1 U ] , [ F A 2 L , F A 2 U ] > then A 1 + A 2 = < [ T A 1 L + T A 2 L T A 1 L T A 2 L , T A 1 U + T A 2 U T A 1 U T A 2 U ] , [ I A 1 L I A 2 L , I A 1 U I A 2 U ] , [ F A 1 L F A 2 L , F A 1 U F A 2 U ] > .
  • Subset
    A 1 A 2 if and only if T A 1 L T A 2 L , T A 1 U T A 2 U ; I A 1 L I A 2 L , I A 1 U I A 2 U ; F A 1 L F A 2 L , F A 1 U F A 2 U .
  • Equality
    A 1 = A 2 if and only if A 1 A 2 and A 2 A 1 .
  • Complement
    Let V = < [ T V L ( x ) , T V U ( x ) ] , [ I V L ( x ) , I V U ( x ) ] , [ F V L ( x ) , F V U ( x ) ] > , then
    V c = < [ F V L ( x ) , F V U ( x ) ] , [ 1 I V U ( x ) , 1 I V L ( x ) ] , [ T V L ( x ) , T V U ( x ) ] > .
  • Multiplication
    A 1 × A 2 = < [ T A 1 L T A 2 L , T A 1 U T A 2 U ] , [ I A 1 L + I A 2 L I A 1 L I A 2 L , I A 1 U + I A 2 U I A 1 U I A 2 U ] ,
    [ F A 1 L + F A 2 L F A 1 L F A 2 L , F A 1 U + F A 2 U F A 1 U F A 2 U ] > .
  • Subtraction
    A 1 A 2 = < [ T A 1 L F A 2 U , T A 1 U F A 2 L ] ,   [ max ( I A 1 L , I A 2 l ) , max ( I A 1 U , I A 2 U ) ] , [ F A 1 L T A 2 U ,   F A 1 U T A 2 L ] > .
  • Multiplication by a constant value
    λ   A 1 = < [ 1 ( 1 T A 1 L ) λ , 1 ( 1 T A 1 U ) λ ] , [ ( I A 1 L ) λ   , ( I A 1 U ) λ ] , [ ( F A 1 L ) λ   , ( F A 1 U ) λ ] > ,
    where λ >0.
  • Addition
    Let A 1 ,   A 2 two INSs where
    A 1 = < [ T A 1 L , T A 1 U ] , [ I A 1 L , I A 1 U ] , [ F A 1 L , F A 1 U ] > ,   A 2 = < [ T A 2 L , T A 2 U ] , [ I A 2 L , I A 1 U ] , [ F A 2 L , F A 2 U ] > then A 1 + A 2 = < [ T A 1 L + T A 2 L T A 1 L T A 2 L , T A 1 U + T A 2 U T A 1 U T A 2 U ] , [ I A 1 L I A 2 L , I A 1 U I A 2 U ] , [ F A 1 L F A 2 L , F A 1 U F A 2 U ] > .
  • Subset
    A 1 A 2 if and only if T A 1 L T A 2 L , T A 1 U T A 2 U ; I A 1 L I A 2 L , I A 1 U I A 2 U ; F A 1 L F A 2 L , F A 1 U F A 2 U .
  • Equality
    A 1 = A 2 if and only if A 1 A 2 and A 2 A 1 .
  • Complement
    Let V = < [ T V L ( x ) , T V U ( x ) ] , [ I V L ( x ) , I V U ( x ) ] , [ F V L ( x ) , F V U ( x ) ] > ,
    then V c = < [ F V L ( x ) , F V U ( x ) ] , [ 1 I V U ( x ) , 1 I V L ( x ) ] , [ T V L ( x ) , T V U ( x ) ] > .
  • Multiplication
    A 1 × A 2 = < [ T A 1 L T A 2 L , T A 1 U T A 2 U ] , [ I A 1 L + I A 2 L I A 1 L I A 2 L , I A 1 U + I A 2 U I A 1 U I A 2 U ] , [ F A 1 L + F A 2 L F A 1 L F A 2 L , F A 1 U + F A 2 U F A 1 U F A 2 U ] > .
  • Subtraction
    A 1 A 2 = < [ T A 1 L F A 2 U , T A 1 U F A 2 L ] , [ max ( I A 1 L , I A 2 l ) , max ( I A 1 U , I A 2 U ) ] , [ F A 1 L T A 2 U ,   F A 1 U T A 2 L ] > .
  • Multiplication by a constant value
    λ   A 1 = < [ 1 ( 1 T A 1 L ) λ , 1 ( 1 T A 1 U ) λ ] , [ ( I A 1 L ) λ   , ( I A 1 U ) λ ] , [ ( F A 1 L ) λ   , ( F A 1 U ) λ ] > , where λ >0.

3.3. Weighted Average for Interval-Valued Neutrosophic Numbers (INN)

Let y j = < [ T j L , T j U ] , [ I j L , I j U ] , [ F j L , F j U ] > be a group of interval-valued neutrosophic numbers, j = 1 ,   2 , n is the number of decision makers. The weighted arithmetic average of interval-valued neutrosophic number
INNWAA   ( y 1 , y 2 , , y n ) =   k = 1 n w k y j = < [ 1 k = 1 n ( 1 T j L ) w k , 1 k = 1 n ( 1 T j U ) w k , ] [ k = 1 n ( I j L ) w k , k = 1 n ( I j U ) w k ] , [ k = 1 n ( F j L ) w k , k = 1 n ( F j U ) w k ] > ,
where w k is the decision maker’s weight vector.

3.4. INS Deneutrosophication Function

The deneutrosophication function converts each interval-valued neutrosophic number into crisp number. Let A = < [ T A L , T A U ] , [ I A L , I A U ] , [ F A L , F A U ] > be an interval-valued neutrosophic number, then the deneutrosophication function D ( A ) will be defined by
D ( A ) = 10 ( 2 + ( T A L + T A U ) 2 ( I A L + I A U ) ( F A L , F A U ) 4 ) .

3.5. Ranking Method for Interval-Valued Neutrosophic Numbers

Let A 1 , A 2 be interval-valued neutrosophic numbers, then,
  • if D ( A 1 ) greater than D ( A 2 ) , then A 1 > A 2 ;
  • if D ( A 1 ) less than D ( A 2 ) , then A 1 < A 2 ;
  • if D ( A 1 ) equals D ( A 2 ) , then A 1 = A 2 .

4. The ANP and TOPSIS Methods

In this section, we present an overview of the two techniques used in our proposed research.

4.1. The Analytic Network Process (ANP)

The ANP is a development of analytic hierarchy process (AHP), and it was advanced by Saaty in 1996 for considering dependency and feedback among decision-making problem’s elements. The ANP structures the problem as a network, not as hierarchies as with the AHP. In the analytic hierarchy process, it is assumed that the alternatives depend on criteria and criteria depend on goal. Therefore, in AHP, the criteria do not depend on alternatives, criteria do not affect (depend on) each other, and alternatives do not depend on each other. Nevertheless, in the analytic network process, the dependencies between decision-making elements are allowed. The differences between ANP and AHP are presented with the structural graph in Figure 1. The upper side of Figure 1 shows the hierarchy of AHP in which elements from the lower level have an influence on the higher level or, in other words, the upper level depends on the lower level. However, in the lower side of Figure 1, which shows the network model of ANP, we have a cluster network, and there exists some dependencies between them. The dependencies may be inner-dependencies when the cluster influence itself or may be outer-dependencies when cluster depends on another one. The complex decision-making problem in real life may contain dependencies between problem’s elements, but AHP does not consider them, so it may lead to less optimal decisions, and ANP is more appropriate.
The general steps of ANP [50]:
  • The decision-making problem should be structured as a network that consists of a main objective, criteria for achieving this objective and can be divided to sub-criteria, and finally all available alternatives. The feedback among network elements should be considered here.
  • To calculate criteria’s and alternatives’ weights, the comparisons matrices should be constructed utilizing the 1–9 scale of Saaty. After then, we should check the consistency ratio of these matrices, and it must be 0.1 for each comparison matrix. The comparison matrix’s eigenvector should be calculated after that by summing up the columns of comparison matrix. A new matrix is constructed by dividing each value in a column by the summation of that column, and then taking the average of new matrix rows. For more information, see [51]. The ANP comparison matrices may be constructed for comparing:
    • Criteria with respect to goal,
    • Sub-criteria with respect to criterion from the same cluster,
    • Alternatives with respect to each criterion,
    • Criteria that belong to the same cluster with respect to each alternative.
  • Use the eigenvectors calculated in the previous step for constructing the super-matrix columns. For obtaining a weighted super-matrix, a normalization process must be established. Then, raise the weighted matrix to a larger power until the raw values will be equal to each column values of super-matrix for obtaining the limiting matrix.
  • Finally, choose the best alternative by depending on weight values.

4.2. The TOPSIS Technique

The technique for order preference by similarity to ideal solution (TOPSIS) is proposed by Hwang and Yoon for aiding decision makers in determining positive ( A + ) and negative ( A ) ideal solutions [52]. The chosen alternative is the one with the least distance from the positive ideal solution and the greatest distance from the negative ideal solution. The TOPSIS steps summarized as follows:
  • The decision makers should construct the evaluation matrix that consists of m alternatives and n criteria. The intersection of each alternative and criterion is denoted as x i j , and then we have ( x i j ) m * n matrix.
  • Use the following equation for obtaining the normalized evaluation matrix:
    r ij = x ij i = 1 m x ij 2 ;   i = 1 ,   2 , , m ;   j = 1 ,   2 , , n .
  • Structure the weighted matrix through multiplying criteria’s weights w j , by the normalized decision matrix r ij as follows:
    v ij = w j   ×   r ij .
  • Calculate the positive A + and negative ideal solution A using the following:
    A + = { < max ( v i j | i = 1 ,   2 , , m ) | j J + > , < min ( v i j | i = 1 ,   2 , , m ) | j J > } ,
    A = { < min ( v i j | i = 1 ,   2 , , m ) | j J + > , < max ( v i j | i = 1 ,   2 , , m ) | j J > } ,
    where J + associated with the criteria that have a beneficial influence and J associated with the criteria that have a non-beneficial influence.
  • Calculate the Euclidean distance among positive ( d i + ) and negative ideal solution ( d i ) as follows:
    d i + = j = 1 n ( v i j v j + ) 2   i = 1 ,   2 , , m ,
    d i = j = 1 n ( v i j v j ) 2     i = 1 ,   2 , , m .
  • Calculate the relative closeness to the ideal solution and make the final ranking of alternatives
    c i = d i d i + + d i for i = 1 ,   2 , , m , and based on the largest c i value, begin to rank alternatives. (9)
  • According to your rank of alternatives, take your final decision.

5. The Proposed Framework

The steps of the proposed interval-valued neutrosophic ANP-TOPSIS framework are presented with details in this section.
The proposed framework consists of four phases, which contains a number of steps as follows:
Phase 1: For better understanding of a complex problem, we must firstly breakdown it.
Step 1.1.
Select a group of experts to share in making decisions. If we select n experts, then we have the panel = [ e 1 , e 2 , …, e n ].
Step 1.2.
Use the literature review to determine problem’s criteria and ask experts for confirming these criteria.
Step 1.3.
Determine the alternatives of the problem.
Step 1.4.
Begin to structure the hierarchy of the problem.
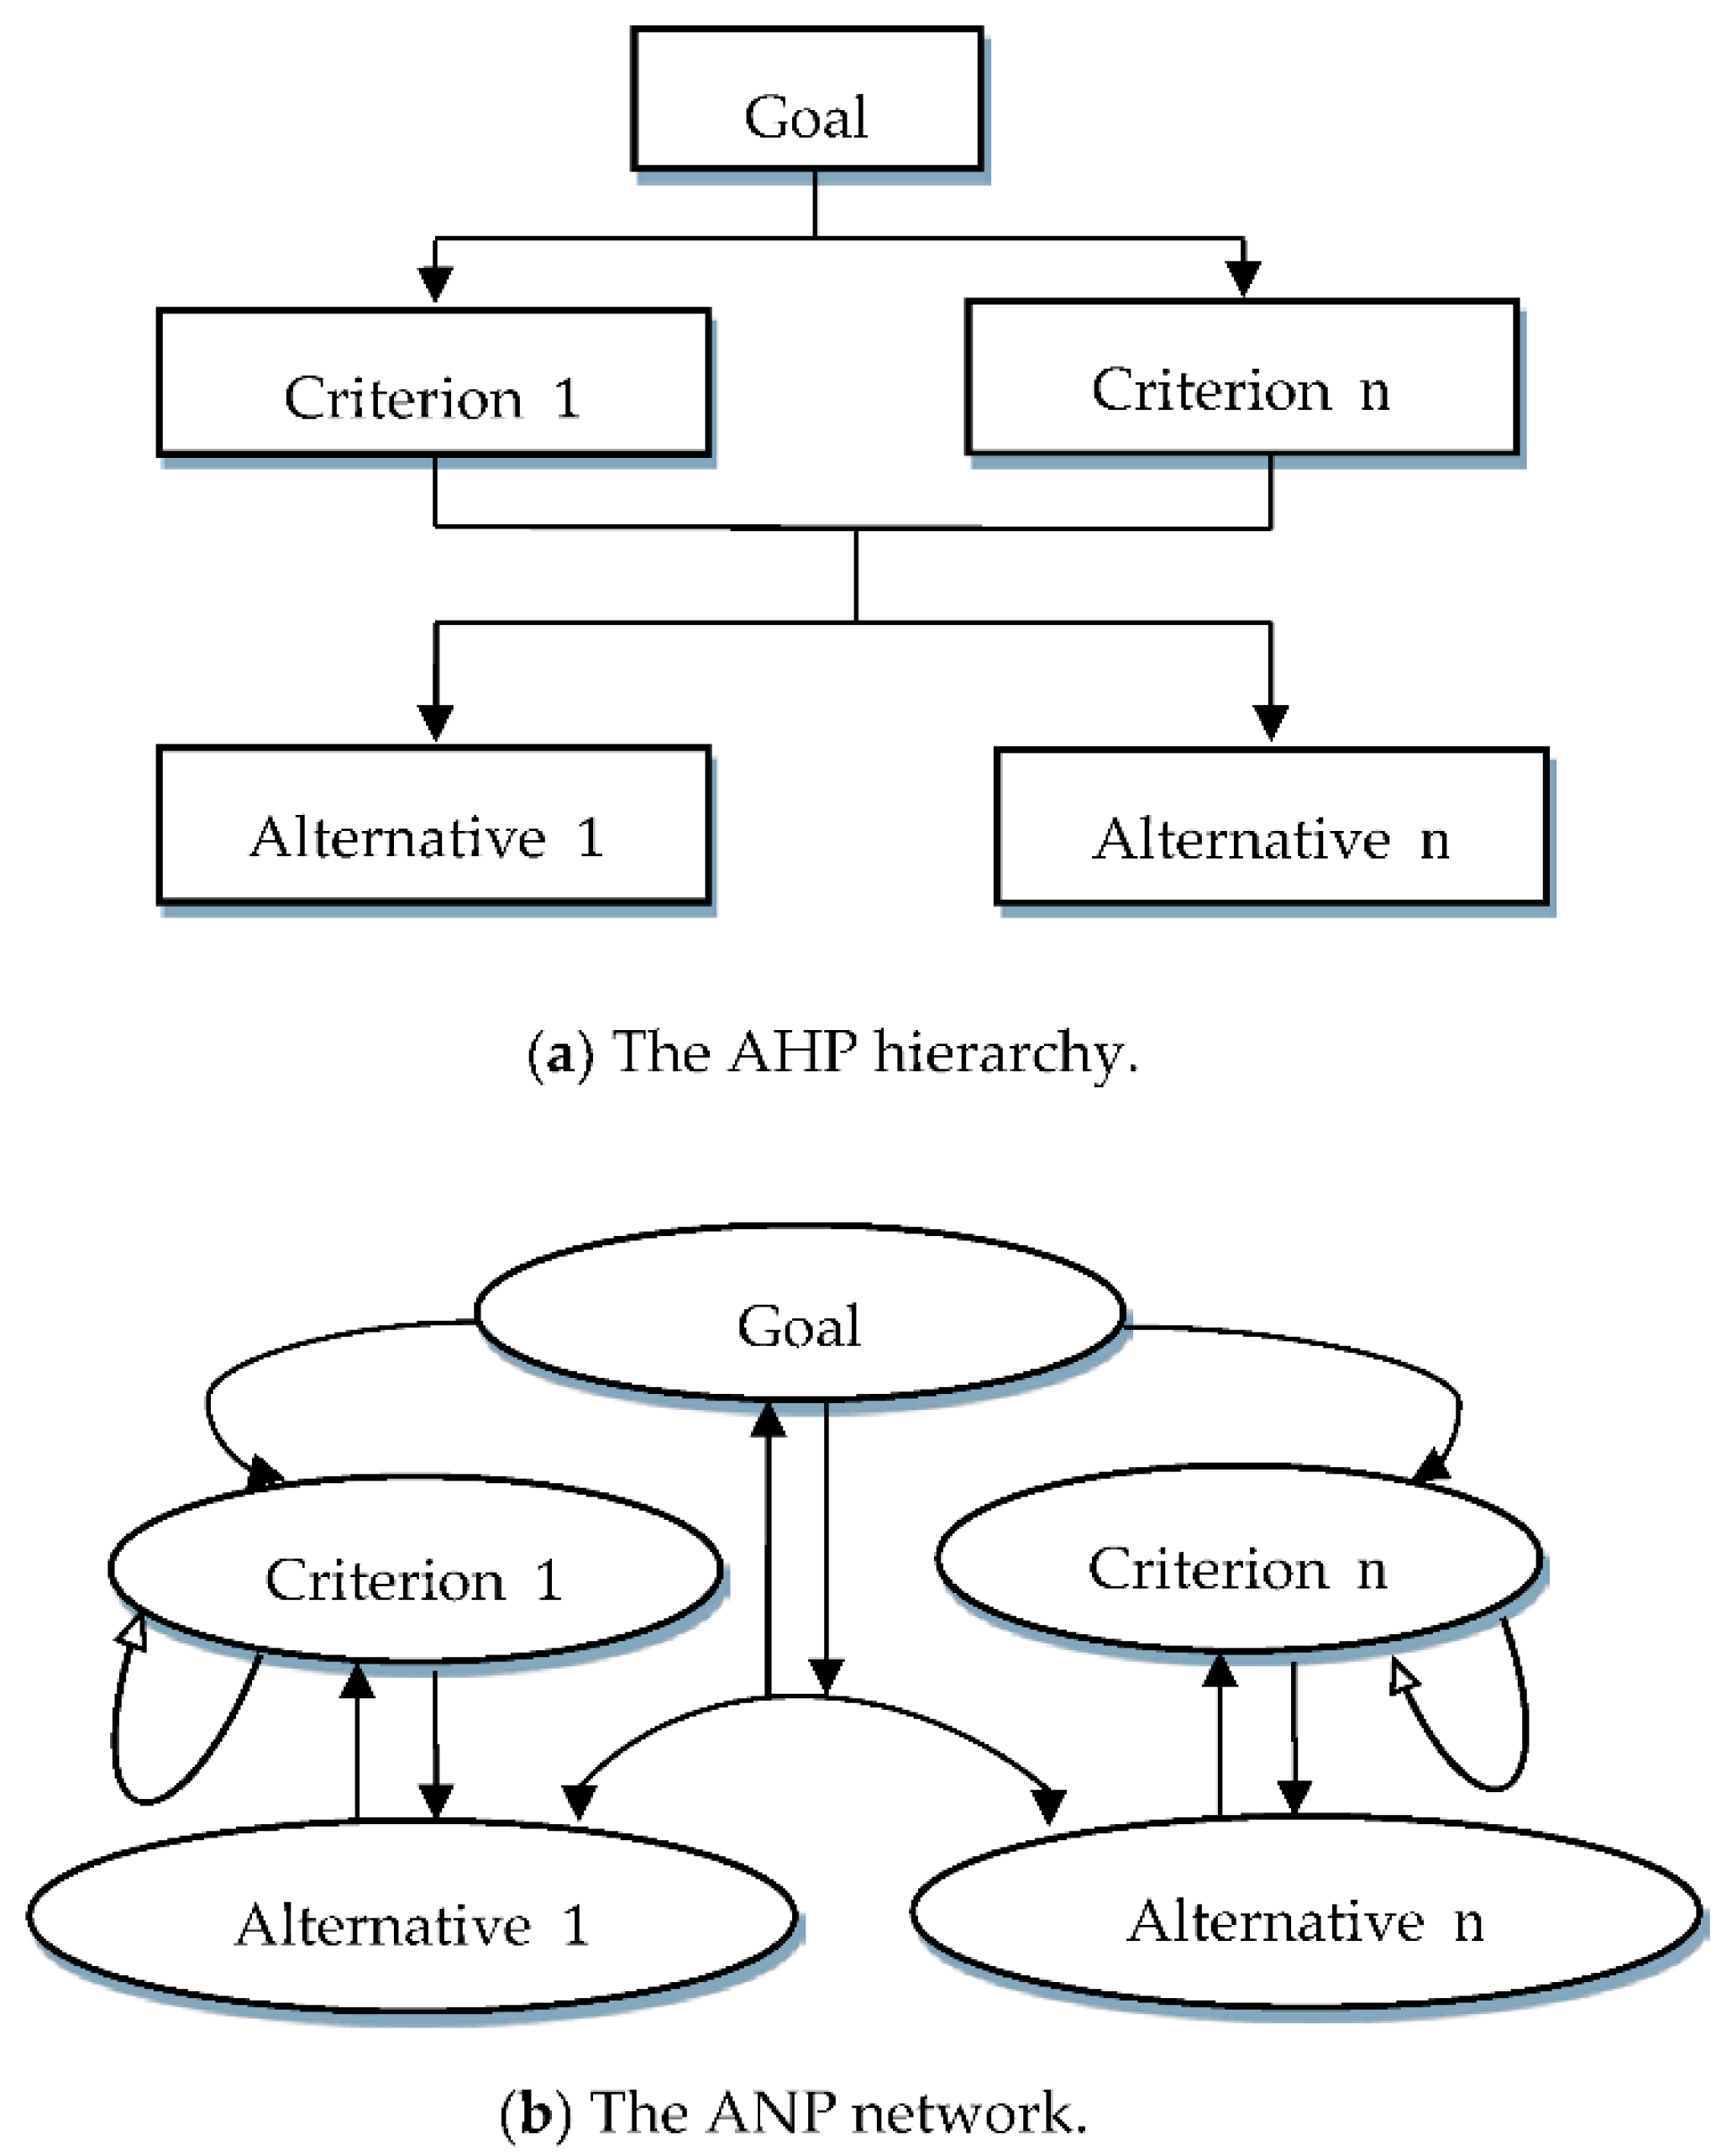
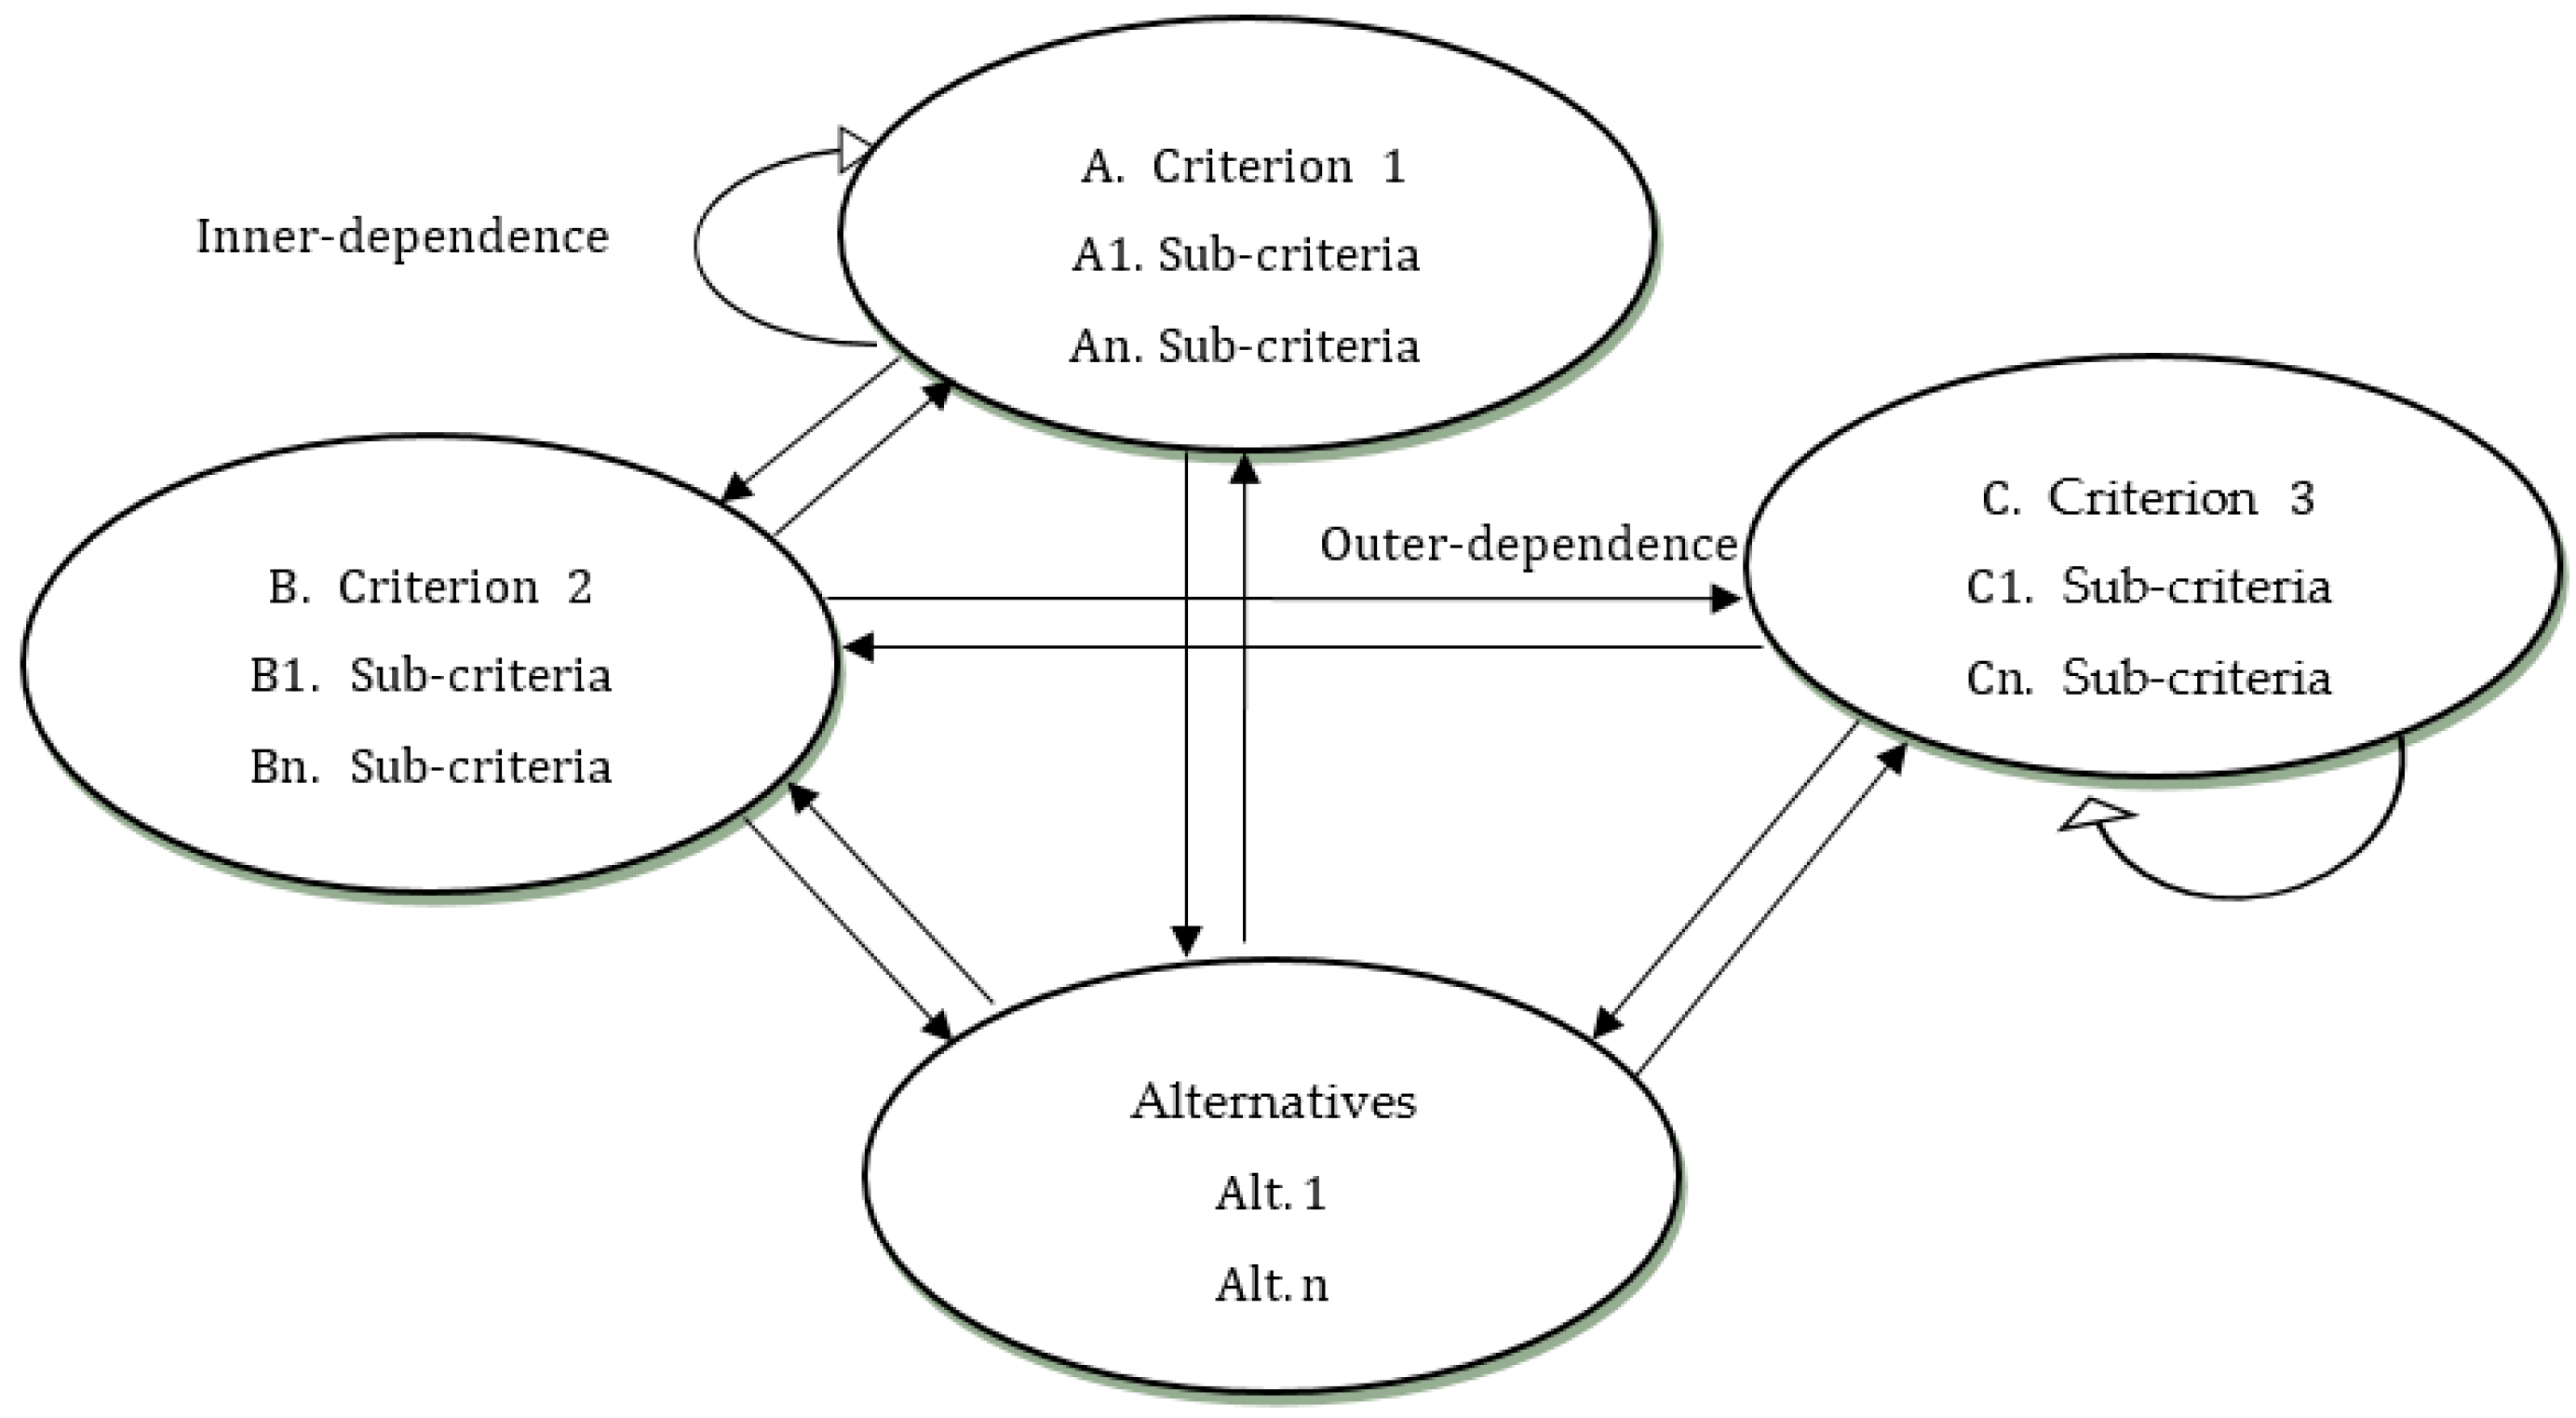
In an analytic hierarchy process, it is assumed that the alternatives depend on criteria, criteria affects goal, and in real complex problems, there likely is a dependency between a problem’s elements. In order to overcome this drawback of AHP, we utilized ANP for solving the problem. Figure 2 presents a sample of an ANP network.
Phase 2: Calculate the weight of problem’s elements as follows:
Step 2.1.
The interval-valued comparison matrices should be constructed according to each expert and then aggregate experts’ matrices by using Equation (1).
In this step, we compare criteria according to overall goals, sub-criteria according to criteria, and alternatives according to criteria. In addition, the interdependencies among problem’s elements must be pair-wisely compared. The 9-point scale of Saaty [53] was used to represent comparisons in traditional ANP.
In our research, we used the interval-valued neutrosophic numbers for clarifying pair-wise comparisons as presented in Table 1, and these values returned to authors’ opinions. When comparing alternative 1 with alternative 2, and the first alternative was “Very strongly significant” than second one, then the truth degree is high and indeterminacy degree is very small because the term “Very strongly important” means that the decision makers are very confident of comparison results in a large percentage. Therefore, we represented this linguistic term using interval-neutrosophic number equals ([0.8, 0.9], [0.0, 0.1], [0.0, 0.1]), as it appears in Table 1. All other values in Table 1 were scaled with the same approach.
Step 2.2.
Use the de-neutrosophication function for transforming the interval-valued neutrosophic numbers to crisp numbers as in Equation (2).
Step 2.3.
Use super decision software, which is available here (http://www.superdecisions.com/downloads/) to check the consistency of comparison matrices.
Step 2.4.
Calculate the eigenvectors for determining weight that will be used in building a super-matrix.
Step 2.5.
The super-matrix of interdependencies should be constructed after then.
Step 2.6.
Multiply the local weight, which was obtained from experts’ comparison matrices of criteria according to goal, by the weight of interdependence matrix of criteria for calculating global weight of criteria. In addition, calculate the global weights of sub-criteria by multiplying its local weight by the inner interdependent weight of the criterion to which it belongs.
Phase 3: Rank alternatives of problems.
Step 3.1.
Make the evaluation matrix, and then a normalization process must be performed for obtaining the normalized evaluation matrix using Equation (3).
Step 3.2.
Multiply criteria’s weights, which was obtained from ANP by the normalized evaluation matrix as in Equation (4) to construct the weighted matrix.
Step 3.3.
Determine positive and negative ideal solutions using Equations (5) and (6).
Step 3.4.
Calculate the Euclidean distance between positive solution ( d i + ) and negative ideal solution ( d i ) using Equations (7) and (8).
Step 3.5.
Make the final ranking of alternatives based on closeness coefficient.
Phase 4: Compare the proposed method with other existing methods for validating it. The framework of the suggested method is presented in Figure 3.

6. The Case Study: Results and Analysis

The proposed framework has been applied to a real sustainable supplier selection problem, and the results are analyzed in this section.
An Egyptian dairy and foodstuff corporation was founded in 1999 and is based in 10th of Ramadan City, Egypt. The corporation products include cream and skimmed milk, flavored milk, juice nectars, junior milk and juices, and tomato paste. The procurement department of the corporation is responsible for providing the required raw materials with the lowest possible cost, and purchasing corporation’s required equipment. The types of equipment are material-handling, laboratory, technical parts and machinery. The procurement department supplies packaging pure materials, pure materials and manufacturing technology. The dairy and foodstuff corporation must evaluate available suppliers and their sustainability to improve their productivity and be more competitive. Therefore, improving a system to assess and identify the superior suppliers is a significant component of this corporation’s objectives. The corporation consulted the executive manager and asked three experts to help in gathering required information for this study. The experts are in marketing, manufacturing and strategy with more than five years of experience. There are four suppliers, denoted in this study by A 1 A 4 .
Phase 1: Breakdown the complex problem for understanding it better.
The criteria and available suppliers which are relevant to our case study are identified from the literature review. The experts vote to confirm the information. The criteria, sub-criteria and available suppliers are presented in Figure 4. In order to determine how criteria and sub-criteria influence each other and correlate, for being able to apply the ANP and weighting them, we interviewed the experts.
Phase 2: Calculate the weights of problem elements.
The verdicts of experts were applied through using the interval-valued neutrosophic numbers in Table 1. We used interval-valued neutrosophic numbers because they are more realistic and accurate than crisp values, and can deal efficiently and effectively with vague and inconsistent information.
Let experts express their judgments by constructing the pairwise comparison matrices using the presented scale in Table 1—after that, aggregate comparison matrices using Equation (1). The aggregated comparison matrices of experts are presented in Table 2, Table 3, Table 4, Table 5, Table 6, Table 7, Table 8, Table 9, Table 10 and Table 11.
By using the deneutrosophication function through Equation (2), we will obtain the crisp matrix of comparison as in Table 3.
By checking consistency of the previous matrix using super decision software, we noted that the matrix is consistent with consistency ratio (CR) = 1%.
The inner interdependency of main criteria according to C 1 is presented in Table 4.
Then, the weights of decision criteria based on their inner interdependencies are as follows:
w c r i t e r i a = [ e c o n o m i c a l e n v i r o n m e n t a l s o c i a l ] = [ 0.5 0.4 0.45 0.43 0.5 0.05 0.07 0.1 0.5 ] × [ 0.59 0.32 0.09 ] = [ 0.46 0.42 0.12 ] .
It is obvious that the economic factors are the most significant factors when evaluating suppliers, followed by environmental and social factors, according to experts’ opinions.
We should also note the influence of inner interdependencies of criteria on its weights. It changed the weights of main criteria from (0.59, 0.32, 0.09) to (0.46, 0.42, 0.12).
The comparison matrices and local weights of sub-criteria relevant to their clusters are expressed in Table 12, Table 13, Table 14, Table 15, Table 16 and Table 17.
The consistency ratio (CR) of previous matrix = 0.03.
The consistency ratio (CR) of previous matrix = 0.04.
The consistency ratio (CR) of previous matrix = 0.004.
Each sub-criteria global weight is calculated via multiplying its local weight by the inner interdependent weight of the criterion to which it belongs as in Table 18.
Phase 3: Rank alternatives of problems.
Let each expert build the evaluation matrix via comparing the four alternatives relative to each criterion, by utilizing the interval-valued scale, which is presented in Table 1. After that, use Equation (1) to aggregate the evaluation matrices and obtain the final evaluation matrix relevant to experts’ committee. Proceed to deneutrosophication function to convert the interval-valued neutrosophic evaluation matrix to its crisp form using Equation (2). Then, make a normalization process to obtain the normalized evaluation matrix using Equation (3), as observed in Table 19.
Then, build the weighted matrix by multiplying the weights of criteria, obtained from ANP by the normalized evaluation matrix using Equation (4), as in Table 20.
Determine the ideal solutions using Equations (5) and (6) as follows:
A + = { 0.14 , 0.06 , 003 , 0.02 , 0.13 , 0.07 , 0.02 , 0.01 , 0.03 , 0.02 , 0.01 , 0.004 } ,
A = { 0.11 , 0.05 , 0.03 , 0.02 , 0.11 , 0.05 , 0.01 , 0.01 , 0.03 , 0.01 , 0.01 , 0.002 } .
After that, measure the Euclidean distance between positive solution ( d i + ) and negative ideal solution ( d i ) using Equations (7) and (8) as follows:
d 1 + = { 0.020 } ,   d 2 +   = { 0.036 } ,   d 3 +   = { 0.041 }   ,   d 4 +   = { 0.022 } ,
d 1   = { 0.032 } ,   d 2   = { 0.026 } ,   d 3   = { 0.010 } ,   d 4   = { 0.040 } .
Step 3.6.
Calculate the closeness coefficient using Equation (9), and make the final ranking of alternatives as in Table 21.
The ranking for the optimal sustainable suppliers of dairy and foodstuff corporation is Alternative 4, Alternative 1, Alternative 2 and Alternative 3, as shown in Figure 5.
Phase 4: Validate the model and make comparisons with other existing methods.
In this phase, the obtained ranking of optimal suppliers by the proposed framework is compared with the obtained results by the analytic hierarchy process, the analytic network process, MOORA and MOOSRA techniques.
The obtained ranking of suppliers by using an AHP technique is as follows:
Since AHP does not consider inner interdependency between problem’s elements, then weights of sub-criteria are as follows:
[ 0.32 0.14 0.08 0.47 0.19 0.09 0.03 0.02 0.04 0.03 0.01 0.00 ] .
The comparison matrix of alternatives relevant to each sub-criterion is as follows:
[ 0.53 0.46 0.46 0.43 0.52 0.54 0.45 0.58 0.48 0.59 0.59 0.51 0.46 0.58 0.53 0.48 0.43 0.58 0.59 0.52 0.54 0.54 0.46 0.64 0.44 0.43 0.56 0.53 0.49 0.45 0.36 0.46 0.49 0.38 0.47 0.47 0.56 0.52 0.43 0.55 0.54 0.41 0.56 0.43 0.48 0.45 0.46 0.32 ] .
The final weights of alternatives after multiplying two previous matrices and making normalization of results are as in Table 22.
Our proposed framework and the analytic hierarchy process agreed that the Alternative 3 is the worst alternative for the company. The two methods are different in ranking the optimal alternative due to the inner interdependencies between the problem’s criteria effect on the global weight of alternatives, and, in our case study, it reduced weights of main criteria from (0.59, 0.32, 0.09) to (0.46, 0.42, 0.12), and this surely regarded the global weight of sub-criteria and also ranking of alternatives.
The weights of sub-criteria when we applied the analytic network process are as follows (see also Table 18):
[ 0.25 0.11 0.06 0.04 0.25 0.12 0.03 0.02 0.06 0.03 0.02 0.006 ] .
In addition, the comparison matrix of alternatives relevant to each sub-criterion is as follows:
[ 0.53 0.46 0.46 0.43 0.52 0.54 0.45 0.58 0.48 0.59 0.59 0.51 0.46 0.58 0.53 0.48 0.43 0.58 0.59 0.52 0.54 0.54 0.46 0.64 0.44 0.43 0.56 0.53 0.49 0.45 0.36 0.46 0.49 0.38 0.47 0.47 0.56 0.52 0.43 0.55 0.54 0.41 0.56 0.43 0.48 0.45 0.46 0.32 ] .
After proceeding to the normalization process, the ranking of alternatives relevant to the ANP technique is presented in Table 23.
By using the ANP technique for solving the same case study, we noted that Alternative 1 and Alternative 4 have the same rank and are the best alternatives, followed by Alternative 2 and finally Alternative 3. The proposed framework and the ANP agreed that Alternative 3 is the worst alternative.
We not only used the AHP and ANP techniques for solving the case study of a dairy and foodstuff corporation, but also two other multi-objective decision-making techniques.
The first technique is the multi-objective optimization based on simple ratio analysis (MOORA), proposed by Brauers and Zavadskas [54]. There are two approaches under the MOORA: the ratio system and the reference point approaches [53]. Here, we used the ratio system method of the MOORA to validate our proposed framework.
The normalized weighted matrix and ranking of alternatives using the MOORA technique are presented in Table 24 and Table 25. The equations that we used in our calculation of MOORA normalized weighted matrix, and the equations that we employed in the ranking process are available with details in [53].
The fourth column in Table 25 is the index of the total performance p i * and equals the difference between beneficial criteria summation and non-beneficial criteria summation. The beneficial and non-beneficial criteria were determined according to experts’ weights of criteria. In other words, the total performance p i * is the difference between the second column and third column values in Table 25.
The other technique we applied to the same case study for validating our proposed framework is MOOSRA. The MOOSRA technique determines the simple ratio of beneficial and non-beneficial criteria. The MOOSRA is a multi-objective optimization technique. The steps of the MOOSRA technique are similar to the MOORA technique, except in calculating total performance index p i * . For more details, see [53]. The ranking of alternatives using MOOSRA technique is presented in Table 26.
The ranking of suppliers using the proposed framework and the other four techniques are aggregated in Table 27. The correlation coefficient between the proposed framework and other techniques is presented in Table 28; we calculated it using Microsoft Excel (version, Manufacturer, City, US State abbrev. if applicable, Country) by using the CORREL() function.
The proposed framework and the first three applied techniques (i.e., AHP, ANP, MOORA) agreed that Alternative 4 is the best alternative. The correlation coefficients help to measure the efficiency of various MCDM techniques. The correlation coefficients between our proposed framework and AHP, ANP, MOORA are very high, as shown in Table 28. The high value of Spearman correlation coefficients reflects the high consistency and validity of the proposed framework. However, the correlation coefficient between our proposed model and MOOSRA is low. Our framework is valid and consistent because the proposed framework and the first three applied techniques agreed that Alternative 4 is the optimal supplier for the dairy and foodstuff corporation.

7. Conclusions and Future Directions

For solving the sustainable supplier selection problem, many steps must be performed: the sustainability criteria must be determined; the interdependencies between these criteria must be identified—ranking and evaluating supplier performance. For more accuracy, we have suggested a framework consisting of four phases, by integrating ANP with TOPSIS using the interval-valued neutrosophic numbers. The ANP is used to weight problem criteria and sub-criteria because of its capability to consider interdependencies between problem’s elements. The TOPSIS is used to rank available suppliers for avoiding additional comparisons of analytic network process. The suggested method provides a reliable and easy to implement procedure, which is suitable for a broad range of real life applications. A case study of a dairy and foodstuff corporation has been solved employing the proposed framework. The dairy corporation trying to earn an important market share and competitive benefits faces competition from other corporations. The objectives of food corporation are to improve the green food process, to get the standard certificate. Many customers consider the ISO standard as a priority for them. Suppliers are a great part of the production process; consequently, they must be sorted and analyzed carefully using efficient framework. The selection process of experts is not an easy matter. Therefore, the provided data and information from experts must be more accurate; otherwise, it will affect the selection process of optimal suppliers. Because real life has a great amount of vague and inconsistent information and surely affects experts’ judgment, we presented our suggested framework using interval-valued neutrosophic numbers. Neutrosophic sets make a simulation of natural decision-making process, since it considers all aspects of making a decision (i.e., agree, not sure and falsity). In the future, we plan to solve the sustainable supplier selection problem with more difficult and complex dependencies between criteria using different multi-criteria decision-making techniques and presenting them in a neutrosophic environment using the alpha cut method.

Author Contributions

All authors contributed equally to this paper. The individual responsibilities and contributions of each author are described as follows: the idea of the paper was put forward by M.A.-B.; F.S. completed the preparatory work of the paper; M.M. analyzed the existing work; and the revision and submission of the paper was completed by M.A.-B.

Acknowledgments

The authors would like to thank the anonymous referees, the Chief-Editor, and support Editors for their constructive suggestions and propositions that have helped to improve the quality of this research. Thanks to the Symmetry international journal open source, we had the chance to read many papers in a neutrosophic environment, which inspired us to write this paper.

Conflicts of Interest

The authors declare no conflict of interest.

References

  1. Amindoust, A.; Ahmed, S.; Saghafinia, A.; Bahreininejad, A. Sustainable supplier selection: A ranking model based on fuzzy inference system. Appl. Soft Comput. 2012, 12, 1668–1677. [Google Scholar] [CrossRef]
  2. Abdel-Basset, M.; Manogaran, G.; Mohamed, M. Internet of Things (IoT) and its impact on supply chain: A framework for building smart, secure and efficient systems. Future Gener. Comput. Syst. 2018, in press. [Google Scholar] [CrossRef]
  3. Lin, C.-Y.; Ho, Y.-H. Determinants of green practice adoption for logistics companies in China. J. Bus. Ethics 2011, 98, 67–83. [Google Scholar] [CrossRef]
  4. Carter, C.R.; Easton, P.L. Sustainable supply chain management: Evolution and future directions. Int. J. Phys. Distrib. Logist. Manag. 2011, 41, 46–62. [Google Scholar] [CrossRef]
  5. El-Hefenawy, N.; Metwally, M.A.; Ahmed, Z.M.; El-Henawy, I.M. A review on the applications of neutrosophic sets. J. Comput. Theor. Nanosci. 2016, 13, 936–944. [Google Scholar] [CrossRef]
  6. Zadeh, L.A. Information and control. Fuzzy Sets 1965, 8, 338–353. [Google Scholar]
  7. Turksen, I.B. Interval valued fuzzy sets based on normal forms. Fuzzy Sets Syst. 1986, 20, 191–210. [Google Scholar] [CrossRef]
  8. Atanassov, K.T. Intuitionistic fuzzy sets. Fuzzy Sets Syst. 1986, 20, 87–96. [Google Scholar] [CrossRef]
  9. Atanassov, K.; Gargov, G. Interval valued intuitionistic fuzzy sets. Fuzzy Sets Syst. 1989, 31, 343–349. [Google Scholar] [CrossRef]
  10. Liu, H.-W.; Wang, G.-J. Multi-criteria decision-making methods based on intuitionistic fuzzy sets. Eur. J. Oper. Res. 2007, 179, 220–233. [Google Scholar] [CrossRef]
  11. Pei, Z.; Zheng, L. A novel approach to multi-attribute decision-making based on intuitionistic fuzzy sets. Expert Syst. Appl. 2012, 39, 2560–2566. [Google Scholar] [CrossRef]
  12. Chen, T.-Y. An outcome-oriented approach to multicriteria decision analysis with intuitionistic fuzzy optimistic/pessimistic operators. Expert Syst. Appl. 2010, 37, 7762–7774. [Google Scholar] [CrossRef]
  13. Wang, H.; Smarandache, F.; Zhang, Y.; Sunderraman, R. Single Valued Neutrosophic Sets; Review of the Air Force Academy: Colorado Springs, CO, USA, 2010; p. 10. [Google Scholar]
  14. Smarandache, F. Neutrosophy: A Unifying Field in Logics: Neutrosophic Logic. Neutrosophy, Neutrosophic Set, Neutrosophic Probability; American Research Press: Santa Fe, NM, USA, 1999. [Google Scholar]
  15. Abdel-Basset, M.; Mohamed, M.; Smarandache, F.; Chang, V. Neutrosophic Association Rule Mining Algorithm for Big Data Analysis. Symmetry 2018, 10, 106. [Google Scholar] [CrossRef]
  16. Abdel-Basset, M.; Mohamed, M.; Smarandache, F. An Extension of Neutrosophic AHP–SWOT Analysis for Strategic Planning and Decision-Making. Symmetry 2018, 10, 116. [Google Scholar] [CrossRef]
  17. Zhang, H.-Y.; Wang, J.-Q.; Chen, X.-H. Interval neutrosophic sets and their application in multicriteria decision-making problems. Sci. World J. 2014, 2014. [Google Scholar] [CrossRef] [PubMed]
  18. Majumdar, P.; Samanta, S.K. On similarity and entropy of neutrosophic sets. J. Intell. Fuzzy Syst. 2014, 26, 1245–1252. [Google Scholar]
  19. Wang, H.; Smarandache, F.; Zhang, Y.; Sunderraman, R. Interval Neutrosophic Sets and Logic: Theory and Applications in Computing; Hexis: Phoenix, AZ, USA, 2005. [Google Scholar]
  20. Broumi, S.; Smarandache, F. Single Valued Neutrosophic Trapezoid Linguistic Aggregation Operators Based Multi-Attribute Decision Making. Bull. Pure Appl. Sci.-Math. 2014, 33, 135–155. [Google Scholar] [CrossRef]
  21. Zhang, H.; Wang, J.; Chen, X. An outranking approach for multi-criteria decision-making problems with interval-valued neutrosophic sets. Neural Comput. Appl. 2016, 27, 615–627. [Google Scholar] [CrossRef]
  22. Govindan, K.; Khodaverdi, R.; Jafarian, A. A fuzzy multi criteria approach for measuring sustainability performance of a supplier based on triple bottom line approach. J. Clean. Prod. 2013, 47, 345–354. [Google Scholar] [CrossRef]
  23. Erol, I.; Sencer, S.; Sari, R. A new fuzzy multi-criteria framework for measuring sustainability performance of a supply chain. Ecol. Econ. 2011, 70, 1088–1100. [Google Scholar] [CrossRef]
  24. Wen, L.; Xu, L.; Wang, R. Sustainable supplier evaluation based on intuitionistic fuzzy sets group decision methods. J. Inf. Comput. Sci. 2013, 10, 3209–3220. [Google Scholar] [CrossRef]
  25. Orji, I.; Wei, S. A decision support tool for sustainable supplier selection in manufacturing firms. J. Ind. Eng. Manag. 2014, 7, 1293. [Google Scholar] [CrossRef]
  26. Shaw, K.; Shankar, R.; Yadav, S.S.; Thakur, L.S. Supplier selection using fuzzy AHP and fuzzy multi-objective linear programming for developing low carbon supply chain. Expert Syst. Appl. 2012, 39, 8182–8192. [Google Scholar] [CrossRef]
  27. Büyüközkan, G.; Çifçi, G. A novel fuzzy multi-criteria decision framework for sustainable supplier selection with incomplete information. Comput. Ind. 2011, 62, 164–174. [Google Scholar] [CrossRef]
  28. Ho, W.; He, T.; Lee, C.K.M.; Emrouznejad, A. Strategic logistics outsourcing: An integrated QFD and fuzzy AHP approach. Expert Syst. Appl. 2012, 39, 10841–10850. [Google Scholar] [CrossRef]
  29. Dursun, M.; Karsak, E.E. A QFD-based fuzzy MCDM approach for supplier selection. Appl. Math. Model. 2013, 37, 5864–5875. [Google Scholar] [CrossRef]
  30. Dai, J.; Blackhurst, J. A four-phase AHP-QFD approach for supplier assessment: A sustainability perspective. Int. J. Prod. Res. 2012, 50, 5474–5490. [Google Scholar] [CrossRef]
  31. Kumar, A.; Jain, V.; Kumar, S. A comprehensive environment friendly approach for supplier selection. Omega 2014, 42, 109–123. [Google Scholar] [CrossRef]
  32. Azadi, M.; Jafarian, M.; Saen, R.F.; Mirhedayatian, S.M. A new fuzzy DEA model for evaluation of efficiency and effectiveness of suppliers in sustainable supply chain management context. Comput. Oper. Res. 2015, 54, 274–285. [Google Scholar] [CrossRef]
  33. Choy, K.L.; Lee, W.; Lo, V. An enterprise collaborative management system—A case study of supplier relationship management. J. Enterp. Inf. Manag. 2004, 17, 191–207. [Google Scholar] [CrossRef]
  34. Bhattacharya, A.; Geraghty, J.; Young, P. Supplier selection paradigm: An integrated hierarchical QFD methodology under multiple-criteria environment. Appl. Soft Comput. 2010, 10, 1013–1027. [Google Scholar] [CrossRef]
  35. Amin, S.H.; Razmi, J.; Zhang, G. Supplier selection and order allocation based on fuzzy SWOT analysis and fuzzy linear programming. Expert Syst. Appl. 2011, 38, 334–342. [Google Scholar] [CrossRef]
  36. Rajesh, G.; Malliga, P. Supplier selection based on AHP QFD methodology. Procedia Eng. 2013, 64, 1283–1292. [Google Scholar] [CrossRef]
  37. Taghizadeh, H.; Ershadi, M.S.S. Selection in Supply Chain with Combined QFD and ANP Approaches (Case study). Res. J. Recent Sci. 2013, 2, 66–76. [Google Scholar]
  38. Dey, P.K.; Bhattacharya, A.; Ho, W. Strategic supplier performance evaluation: A case-based action research of a UK manufacturing organisation. Int. J. Prod. Econ. 2015, 166, 192–214. [Google Scholar] [CrossRef] [Green Version]
  39. Bayrak, M.; Celebi, N.; Taşkin, H. A fuzzy approach method for supplier selection. Prod. Plan. Control 2007, 18, 54–63. [Google Scholar] [CrossRef]
  40. Kumaraswamy, A.H.; Bhattacharya, A.; Kumar, V.; Brady, M. An integrated QFD-TOPSIS methodology for supplier selection in SMEs. In Proceedings of the 2011 Third International Conference on Computational Intelligence, Modelling and Simulation (CIMSiM), Langkawi, Malaysia, 20–22 September 2011; pp. 271–276. [Google Scholar]
  41. Wu, C.-M.; Hsieh, C.-L.; Chang, K.-L. A hybrid multiple criteria decision-making model for supplier selection. Math. Probl. Eng. 2013, 2013. [Google Scholar] [CrossRef]
  42. Ghorabaee, M.K.; Amiri, M.; Zavadskas, E.K.; Antucheviciene, J. Supplier evaluation and selection in fuzzy environments: A review of MADM approaches. Econ. Res.-Ekon. Istraž. 2017, 30, 1073–1118. [Google Scholar]
  43. Rouyendegh, B.D. Developing an integrated ANP and intuitionistic fuzzy TOPSIS model for supplier selection. J. Test. Eval. 2014, 43, 664–672. [Google Scholar] [CrossRef]
  44. Tavana, M.; Yazdani, M.; di Caprio, D. An application of an integrated ANP-QFD framework for sustainable supplier selection. Int. J. Logist. Res. Appl. 2017, 20, 254–275. [Google Scholar] [CrossRef]
  45. Şahin, R.; Yiğider, M. A Multi-criteria neutrosophic group decision-making method based TOPSIS for supplier selection. arXiv, 2014; arXiv:1412.5077. [Google Scholar]
  46. Reddy, R.; Reddy, D.; Krishnaiah, G. Lean supplier selection based on hybrid MCGDM approach using interval valued neutrosophic sets: A case study. Int. J. Innov. Res. Dev. 2016, 5, 291–296. [Google Scholar]
  47. Karaşan, A.; Kahraman, C. Interval-Valued Neutrosophic Extension of EDAS Method. In Advances in Fuzzy Logic and Technology 2017; Springer: Berlin, Germany, 2017; pp. 343–357. [Google Scholar]
  48. Van, L.H.; Yu, V.F.; Dat, L.Q.; Dung, C.C.; Chou, S.-Y.; Loc, N.V. New Integrated Quality Function Deployment Approach Based on Interval Neutrosophic Set for Green Supplier Evaluation and Selection. Sustainability 2018, 10, 838. [Google Scholar] [CrossRef]
  49. Abdel-Basset, M.; Manogaran, G.; Gamal, A.; Smarandache, F. A hybrid approach of neutrosophic sets and DEMATEL method for developing supplier selection criteria. In Design Automation for Embedded Systems; Springer: Berlin, Germany, 2018; pp. 1–22. [Google Scholar]
  50. Saaty, T.L. Decision making—The analytic hierarchy and network processes (AHP/ANP). J. Syst. Sci. Syst. Eng. 2004, 13, 1–35. [Google Scholar] [CrossRef]
  51. Saaty, T.L. What is the analytic hierarchy process. In Mathematical Models for Decision Support; Springer: Berlin, Germany, 1988; pp. 109–121. [Google Scholar]
  52. Yoon, K.; Hwang, C.-L. Multiple Attribute Decision Making: Methods and Applications; Springer: Berlin, Germany, 1981. [Google Scholar]
  53. Brauers, W.K.; Zavadskas, E.K. The MOORA method and its application to privatization in a transition economy. Control Cybern. 2006, 35, 445–469. [Google Scholar]
  54. Adalı, E.A.; Işık, A.T. The multi-objective decision-making methods based on MULTIMOORA and MOOSRA for the laptop selection problem. J. Ind. Eng. Int. 2017, 13, 229–237. [Google Scholar] [CrossRef]
Figure 1. The structural difference between hierarchy and network model.
Symmetry 10 00226 g001
Figure 2. An example of ANP interdependencies.
Symmetry 10 00226 g002
Figure 3. The framework’s proposed phases.
Symmetry 10 00226 g003
Figure 4. Hierarchy for dairy and foodstuff corporation to select the optimal supplier.
Symmetry 10 00226 g004
Figure 5. The ranking for the optimal alternatives of dairy and foodstuff corporation.
Symmetry 10 00226 g005
Table 1. The interval-valued neutrosophic scale for comparison matrix.
Linguistic VariablesInterval-Valued Neutrosophic Numbers for Relative Importance <T,I,F>
Evenly significant([0.5,0.5], [0.5,0.5], [0.5,0.5])
Low significant([0.4,0.5], [0.1,0.2], [0.2,0.3])
Basically important([0.6,0.7], [0.0,0.1], [0.0,0.1])
Very strongly significant([0.8,0.9], [0.0,0.1], [0.0,0.1])
Absolutely significant([1,1], [0.0,0.1], [0.0,0.0])
Intermediate values([0.3,0.4], [0.1,0.2], [0.6,0.7]),
([0.6,0.7], [0.1,0.2], [0.0,0.1]),
([0.7,0.8], [0.0,0.1], [0.0,0.1]),
([0.9,1], [0.0,0.1], [0.0,0.1]).
Table 2. The pairwise comparison matrix of criteria with respect to goal.
Goal C 1 C 2 C 3
C 1 [0.5,0.5], [0.5,0.5], [0.5,0.5][0.3,0.4], [0.1,0.2], [0.6,0.7][0.7,0.8], [0.0,0.1], [0.0,0.1]
C 2 [0.5,0.5], [0.5,0.5], [0.5,0.5][0.6,0.7], [0.1,0.2], [0.0,0.1]
C 3 [0.5,0.5], [0.5,0.5], [0.5,0.5]
Table 3. The equivalent crisp matrix of criteria with respect to goal.
Goal C 1 C 2 C 3 Weights
C 1 1260.59
C 2 0.5140.32
C 3 0.170.2510.09
Table 4. Internal interdependencies of criteria with respect to C 1 .
C 1 C 2 C 3
C 2 [0.5,0.5], [0.5,0.5], [0.5,0.5][0.7,0.8], [0.0,0.1], [0.0,0.1]
C 3 [0.5,0.5], [0.5,0.5], [0.5,0.5]
Table 5. The crisp interdependencies values of factors with respect to C 1 .
C 1 C 2 C 3 Weights
C 2 160.86
C 3 0.1710.14
Table 6. Internal interdependencies of criteria with respect to C 2 .
C 2 C 1 C 3
C 1 [0.5,0.5], [0.5,0.5], [0.5,0.5][0.6,0.7], [0.1,0.2], [0.0,0.1]
C 3 [0.5,0.5], [0.5,0.5], [0.5,0.5]
Table 7. The crisp interdependencies values of factors with respect to C 2 .
C 2 C 1 C 3 Weights
C 1 140.8
C 3 0.2510.2
Table 8. Internal interdependencies of criteria with respect to C 3 .
C 3 C 1 C 2
C 1 [0.5,0.5], [0.5,0.5], [0.5,0.5][1,1], [0.0,0.1], [0.0,0.0]
C 2 [0.5,0.5], [0.5,0.5], [0.5,0.5]
Table 9. The crisp interdependencies values of factors with respect to C 3 .
C 3 C 1 C 2 Weights
C 1 190.9
C 2 0.1110.1
Table 10. The relative impact of decision criteria.
C 1 C 2 C 3
C 1 10.80.9
C 2 0.8610.1
C 3 0.140.21
Table 11. The normalized relative impact of decision criteria.
C 1 C 2 C 3
C 1 0.50.40.45
C 2 0.430.50.05
C 3 0.070.10.5
Table 12. The comparison matrix and local weight of C 1 indicators.
C 1 C 11 C 12 C 13 C 14
C 11 [0.5,0.5], [0.5,0.5], [0.5,0.5][0.4,0.5], [0.1,0.2], [0.2,0.3][0.6,0.7], [0.1,0.2], [0.0,0.1][0.6,0.7], [0.0,0.1], [0.0,0.1]
C 12 [0.5,0.5], [0.5,0.5], [0.5,0.5][0.3,0.4], [0.1,0.2], [0.6,0.7][0.6,0.7], [0.1,0.2], [0.0,0.1]
C 13 [0.5,0.5], [0.5,0.5], [0.5,0.5][0.3,0.4], [0.1,0.2], [0.6,0.7]
C 14 [0.5,0.5], [0.5,0.5], [0.5,0.5]
Table 13. The crisp comparison matrix and local weight of C 1 indicators.
C 1 C 11 C 12 C 13 C 14 Weights
C 11 13450.54
C 12 0.331240.23
C 13 0.250.50120.13
C 14 0.200.250.510.08
Table 14. The comparison matrix and local weight of C 2 indicators.
C 2 C 21 C 22 C 23 C 24
C 21 [0.5,0.5], [0.5,0.5], [0.5,0.5][0.4,0.5], [0.1,0.2], [0.2,0.3][0.8,0.9], [0.0,0.1], [0.0,0.1][1,1], [0.0,0.1], [0.0,0.0]
C 22 [0.5,0.5], [0.5,0.5], [0.5,0.5][0.6,0.7], [0.0,0.1], [0.0,0.1][0.8,0.9], [0.0,0.1], [0.0,0.1]
C 23 [0.5,0.5], [0.5,0.5], [0.5,0.5][0.3,0.4], [0.1,0.2], [0.6,0.7]
C 24 [0.5,0.5], [0.5,0.5], [0.5,0.5]
Table 15. The crisp comparison matrix and local weight of C 2 indicators.
C 2 C 21 C 22 C 23 C 24 Weights
C 21 13790.59
C 22 0.331570.29
C 23 0.140.20120.08
C 24 0.110.140.5010.05
Table 16. The comparison matrix and local weight of C 3 indicators.
C 3 C 31 C 32 C 33 C 34
C 31 [0.5,0.5], [0.5,0.5], [0.5,0.5][0.3,0.4], [0.1,0.2], [0.6,0.7][0.4,0.5], [0.1,0.2], [0.2,0.3][1,1], [0.0,0.1], [0.0,0.0]
C 32 [0.5,0.5], [0.5,0.5], [0.5,0.5][0.3,0.4], [0.1,0.2], [0.6,0.7][0.7,0.8], [0.0,0.1], [0.0,0.1]
C 33 [0.5,0.5], [0.5,0.5], [0.5,0.5][0.4,0.5], [0.1,0.2], [0.2,0.3]
C 34 [0.5,0.5], [0.5,0.5], [0.5,0.5]
Table 17. The crisp comparison matrix and local weight of C 3 indicators.
C 3 C 31 C 32 C 33 C 34 Weights
C 31 12390.50
C 32 0.501260.29
C 33 0.330.50130.15
C 34 0.110.170.3310.05
Table 18. The sub-criteria global weights.
Criteria Local WeightSub-CriteriaLocal WeightGlobal Weight
Economic factors (0.46) C 11 0.540.25
C 12 0.230.11
C 13 0.130.06
C 14 0.080.04
Environmental factors (0.42) C 21 0.590.25
C 22 0.290.12
C 23 0.080.03
C 24 0.050.02
Social factors (0.12) C 31 0.500.06
C 32 0.290.03
C 33 0.150.02
C 34 0.050.006
Table 19. The normalized evaluation matrix.
C 11 C 12 C 13 C 14 C 21 C 22 C 23 C 24 C 31 C 32 C 33 C 34
A 1 0.530.460.460.430.520.540.450.580.480.590.590.51
A 2 0.460.580.530.480.430.580.590.520.540.540.460.64
A 3 0.440.430.560.530.490.450.360.460.490.380.470.47
A 4 0.560.520.430.550.540.410.560.430.480.450.460.32
Table 20. The weighted evaluation matrix.
C 11 C 12 C 13 C 14 C 21 C 22 C 23 C 24 C 31 C 32 C 33 C 34
A 1 0.130.050.030.020.130.060.010.010.030.020.010.003
A 2 0.110.060.030.020.110.070.020.010.030.020.010.004
A 3 0.110.050.030.020.120.050.010.010.030.010.010.003
A 4 0.140.060.030.020.130.050.020.010.030.010.010.002
Table 21. TOPSIS results and ranking of alternatives.
d i + d i c i Rank
A 1 0.0200.0320.6152
A 2 0.0360.0260.4193
A 3 0.0410.0100.1964
A 4 0.0220.0400.6451
Table 22. Ranking alternatives relevant to AHP.
AlternativesWeightsRank
A 1 0.2453
A 2 0.2502
A 3 0.2444
A 4 0.2671
Table 23. Ranking alternatives relevant to ANP.
AlternativesWeightsRank
A 1 0.261
A 2 0.252
A 3 0.233
A 4 0.261
Table 24. The weighted normalized matrix under the MOORA technique.
C 11 C 12 C 13 C 14 C 21 C 22 C 23 C 24 C 31 C 32 C 33 C 34
A 1 0.130.050.030.020.130.060.010.010.030.020.010.003
A 2 0.110.060.030.020.110.070.020.010.030.020.010.004
A 3 0.110.050.030.020.120.050.010.010.030.010.010.003
A 4 0.140.060.030.020.130.050.020.010.030.010.010.002
Table 25. The ranking of alternatives using the MOORA technique.
j = 1 g x i j * j = g + 1 n x i j * p i * Ranking
A 1 0.43 0.0730.3572
A 2 0.410.0840.3264
A 3 0.390.0630.3273
A 4 0.440.0720.3681
Table 26. The ranking of alternatives using the MOOSRA technique.
j = 1 g x i j * j = g + 1 n x i j * p i * Ranking
A 1 0.43 0.0735.893
A 2 0.410.0844.884
A 3 0.390.0636.191
A 4 0.440.0726.112
Table 27. The ranking of alternatives relevant to various applied techniques.
SuppliersProposed Technique (1)AHP (2)ANP (3)MOORA (4)MOOSRA (5)
A 1 23123
A 2 32244
A 3 44331
A 4 11112
Table 28. The correlation coefficients between the proposed model and other applied techniques.
Correlation (1, 2)Correlation (1, 3)Correlation (1, 4)Correlation (1, 5)
0.80.90.80.2

