Enabling Symmetric Collaboration in Public Spaces through 3D Mobile Interaction


 , and
, and
Abstract
:1. Introduction
2. Related Work
2.1. Individual User Experience
2.2. Collaborative User Experience
2.3. Summary
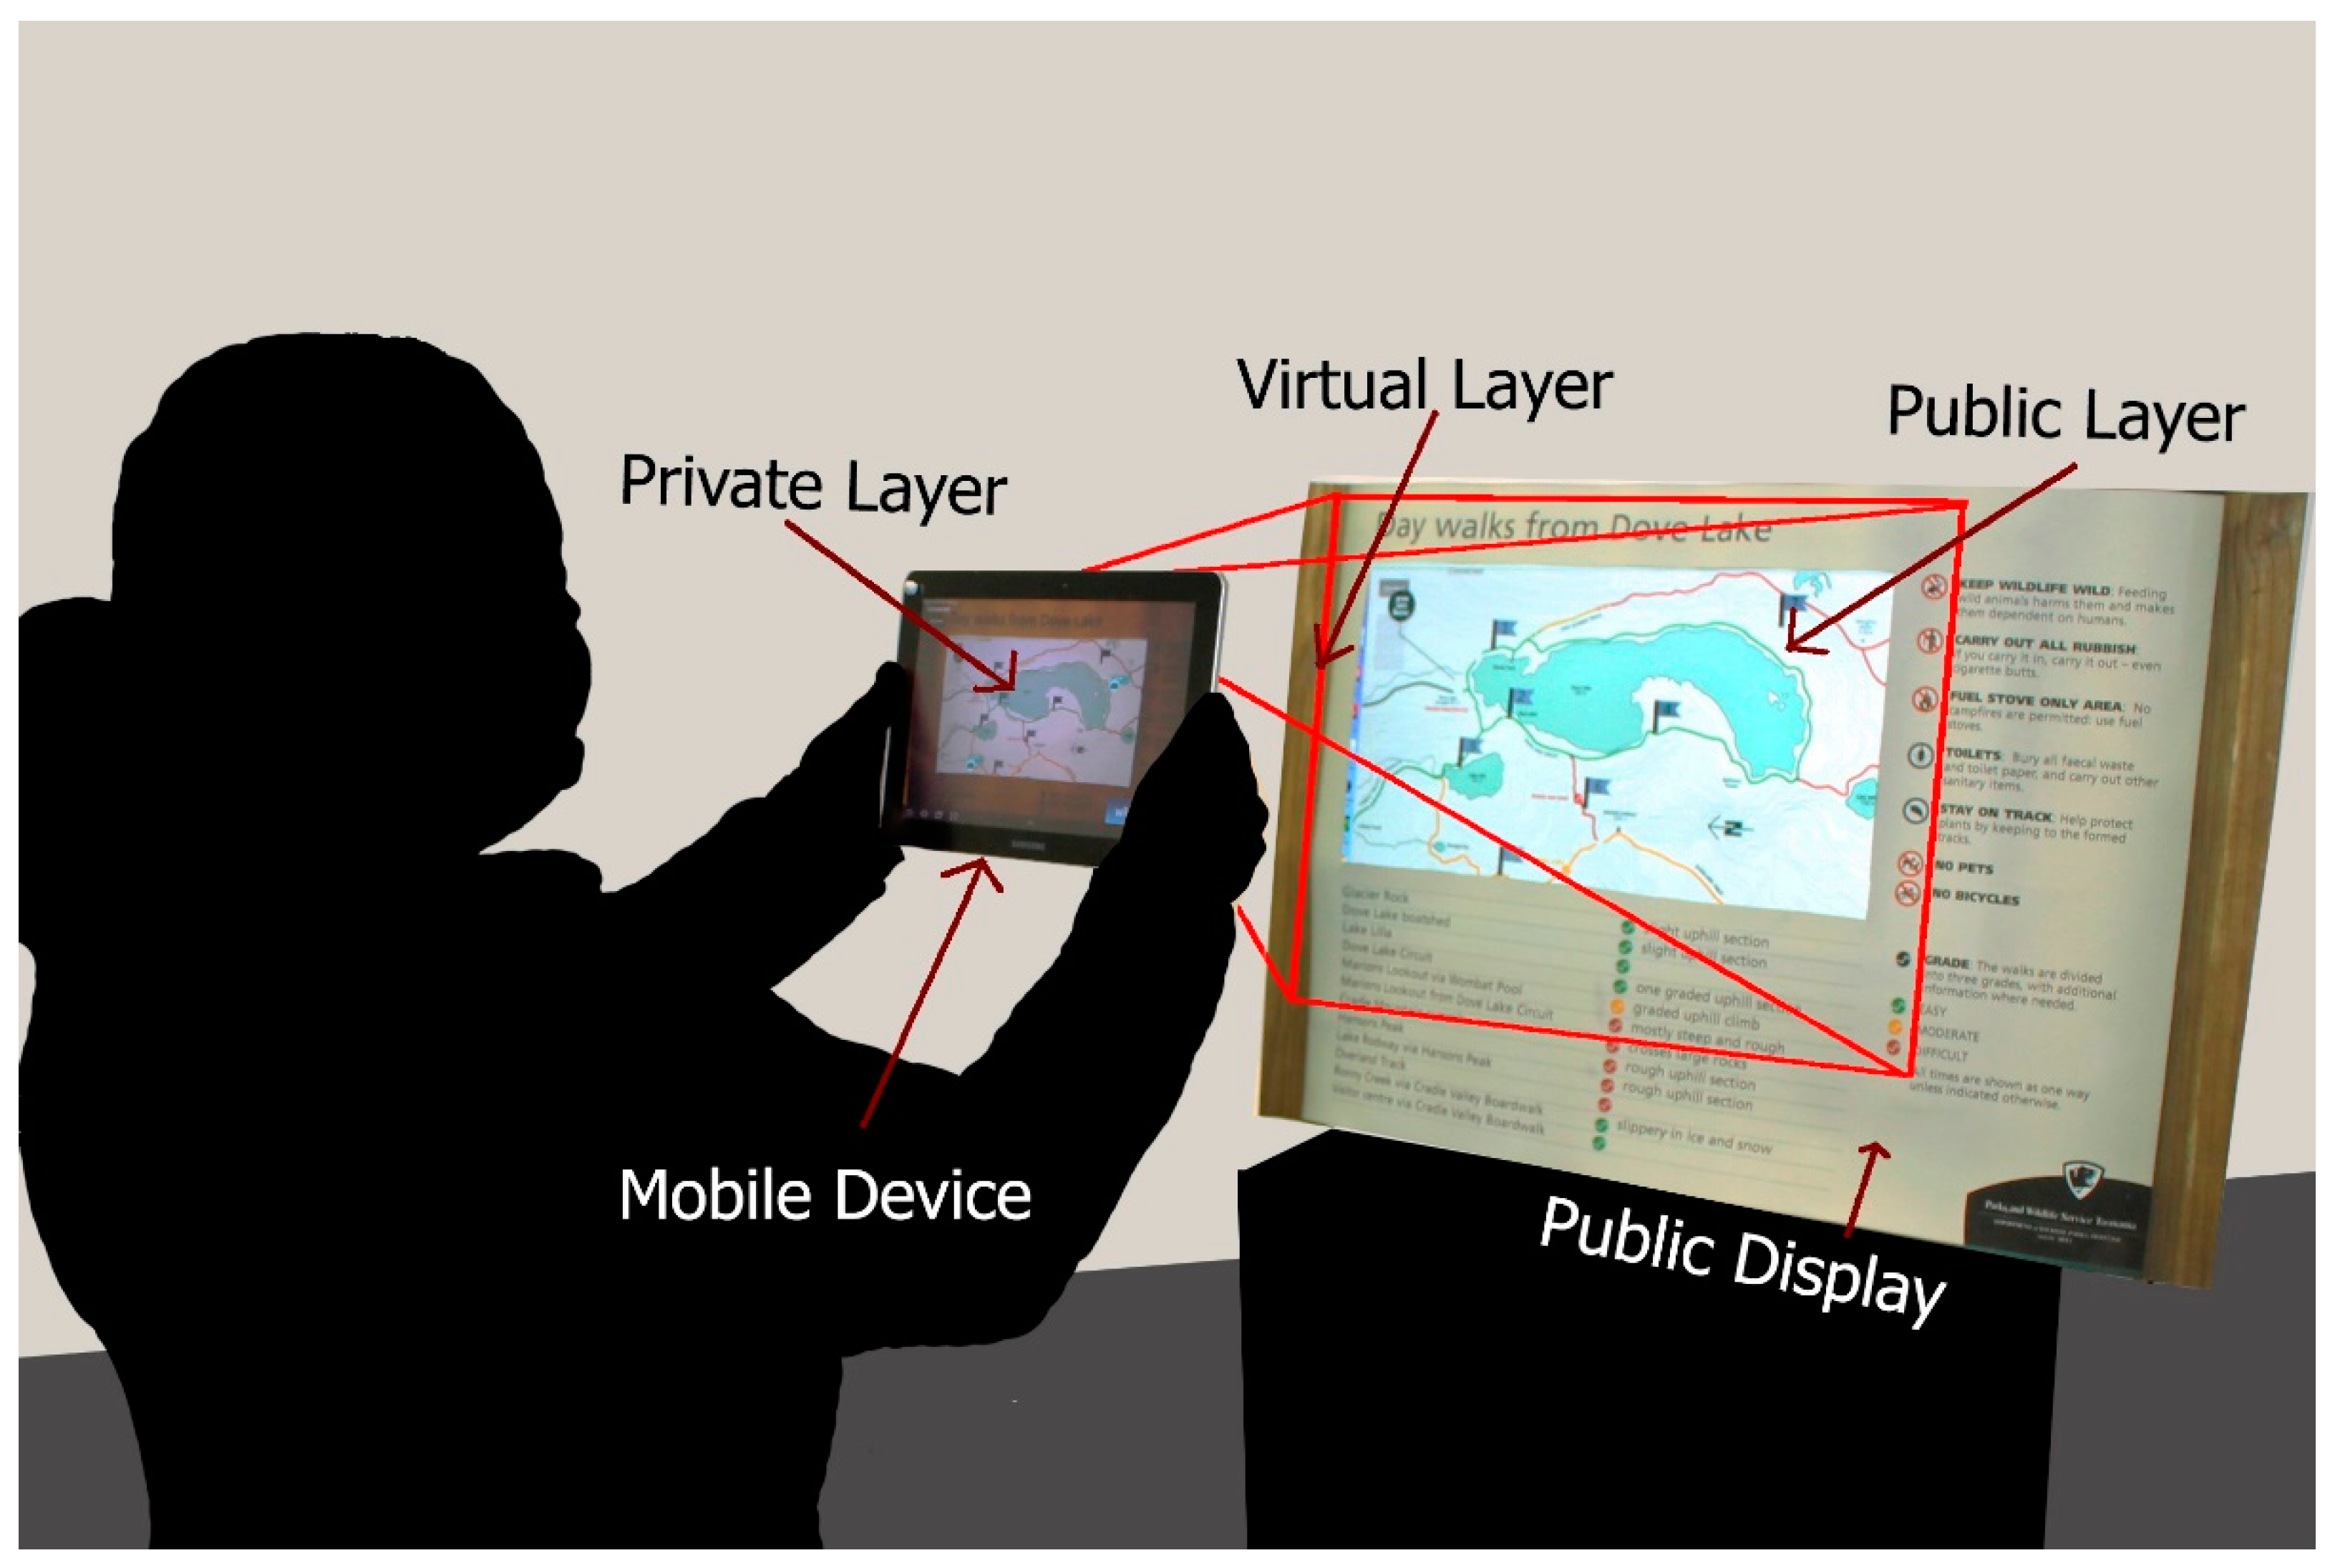
3. 3D Mobile Interaction
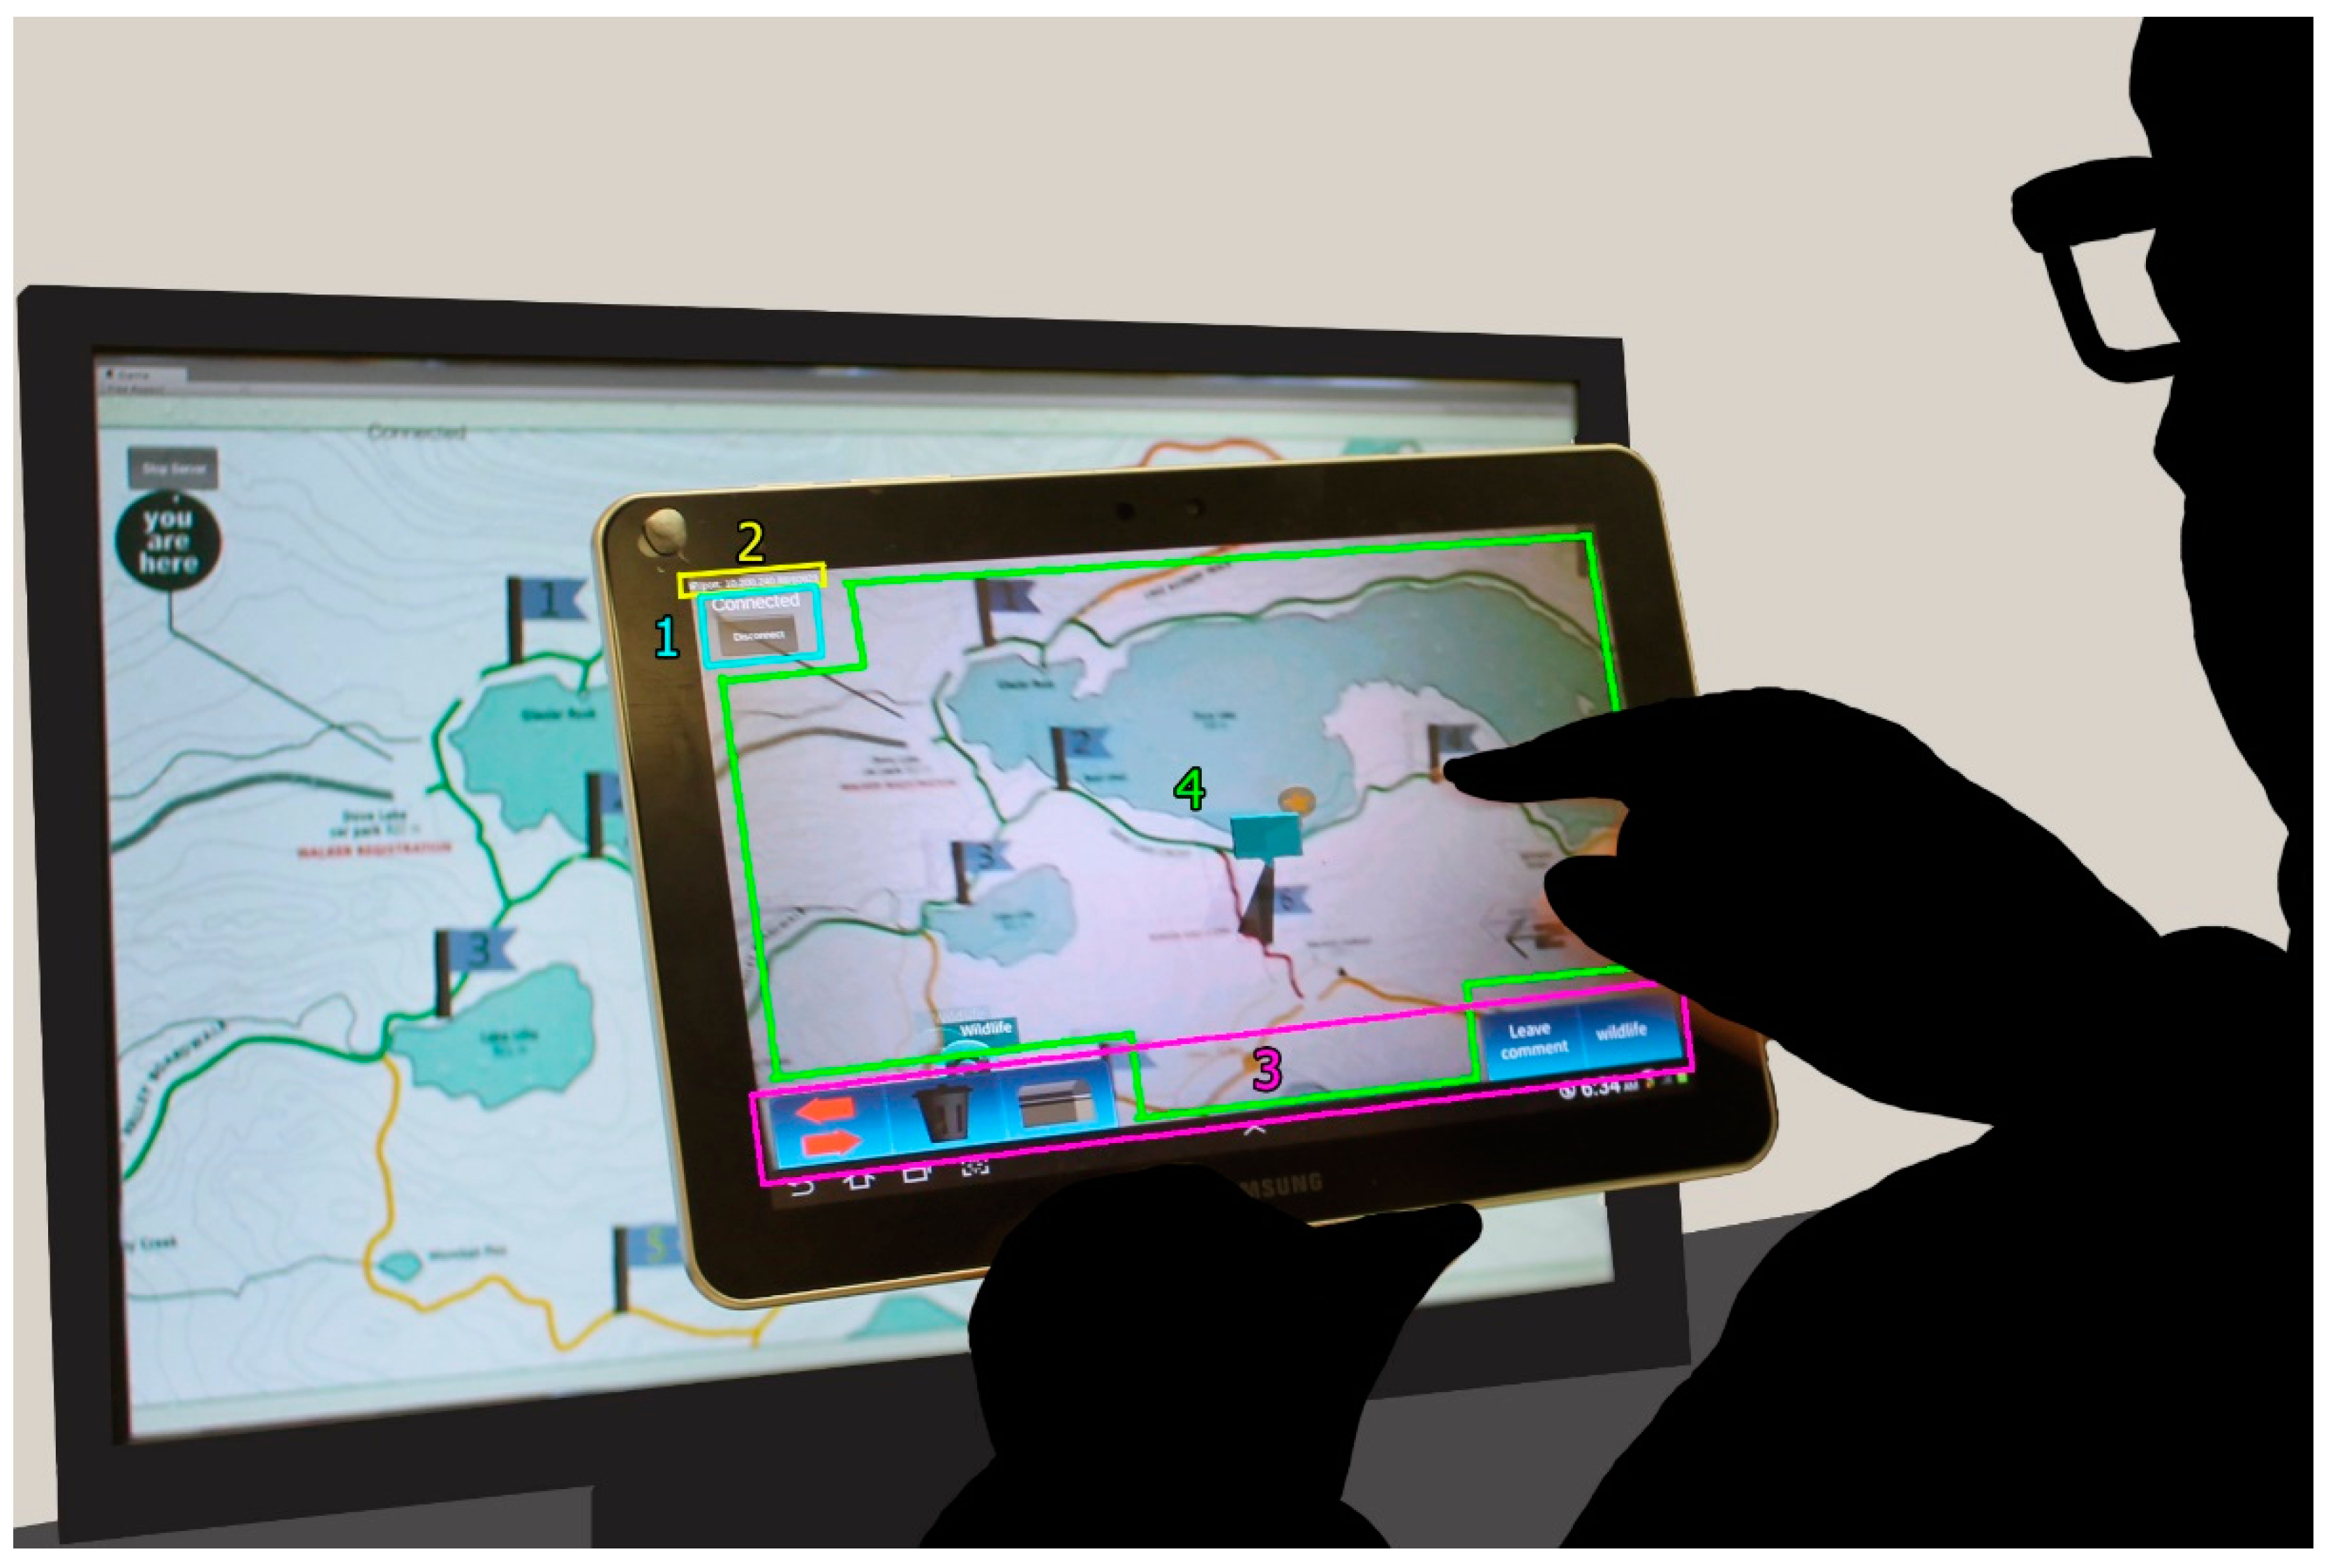
3.1. System Development
3.2. Interaction Design
4. Experiment
- (1)
- Can the proposed 3D mobile interaction increase the level of engagement to the content displayed on the public display?
- (2)
- How can the proposed 3D mobile interactions enable collaboration among users of public displays?
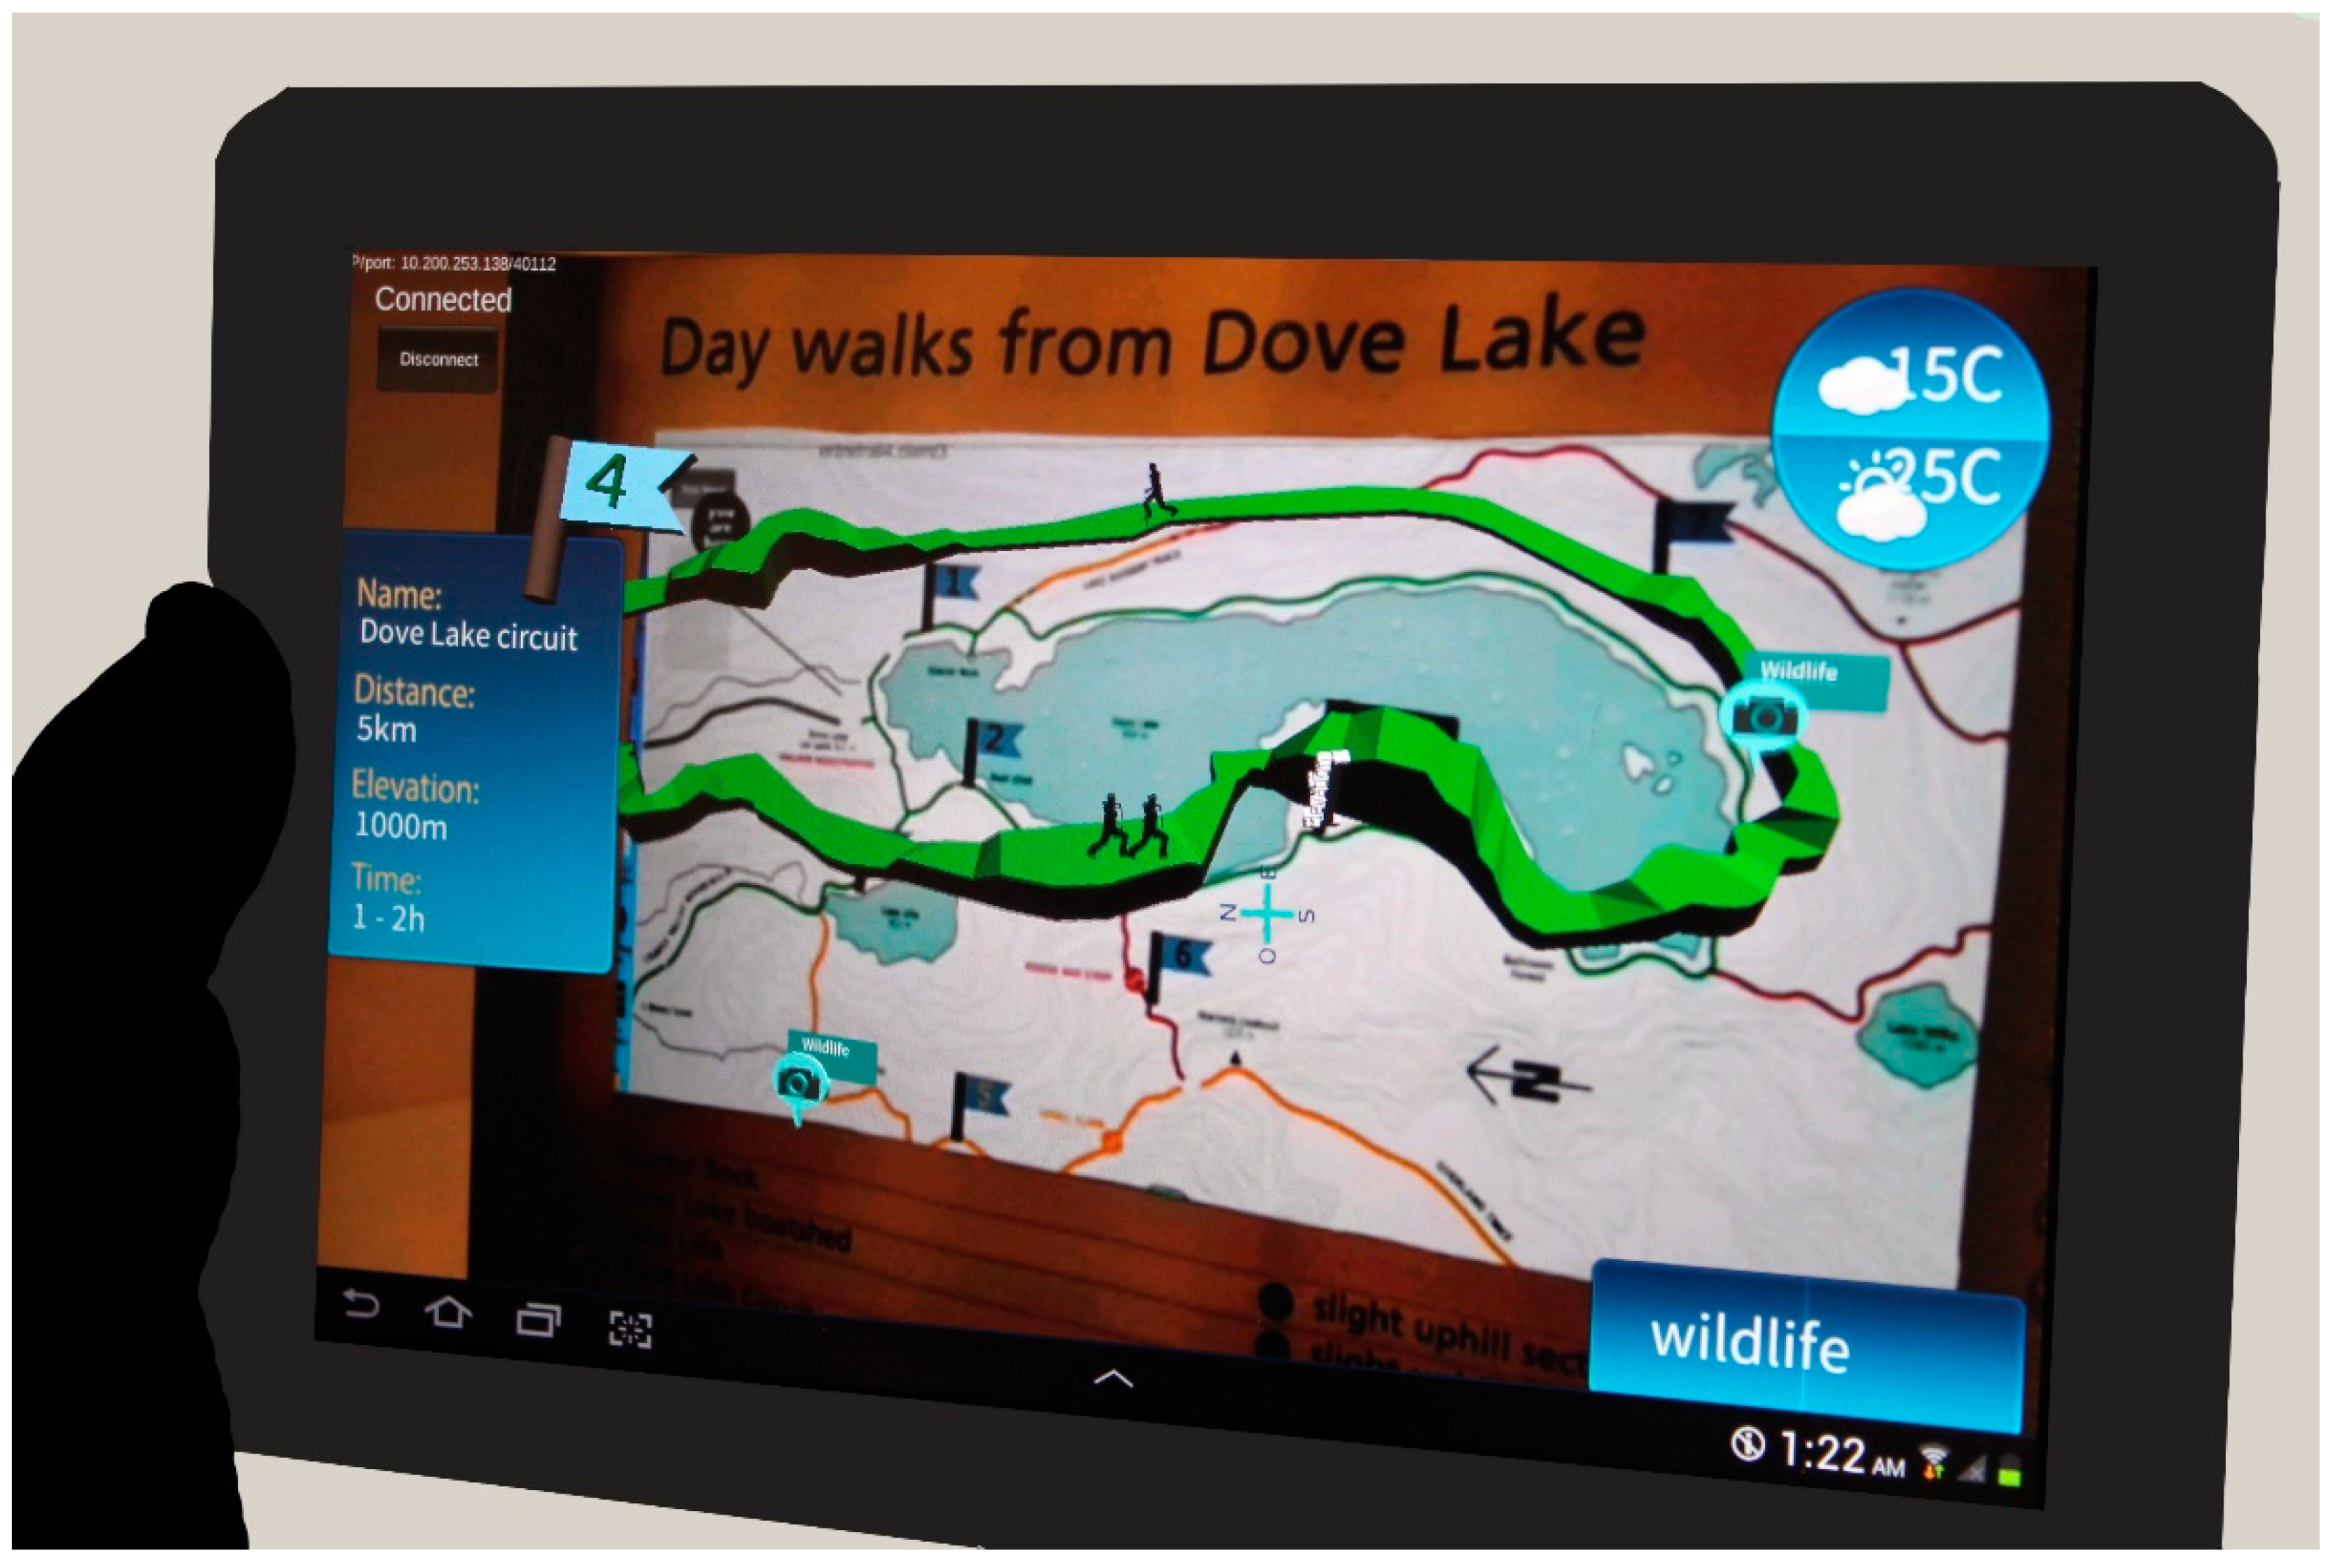
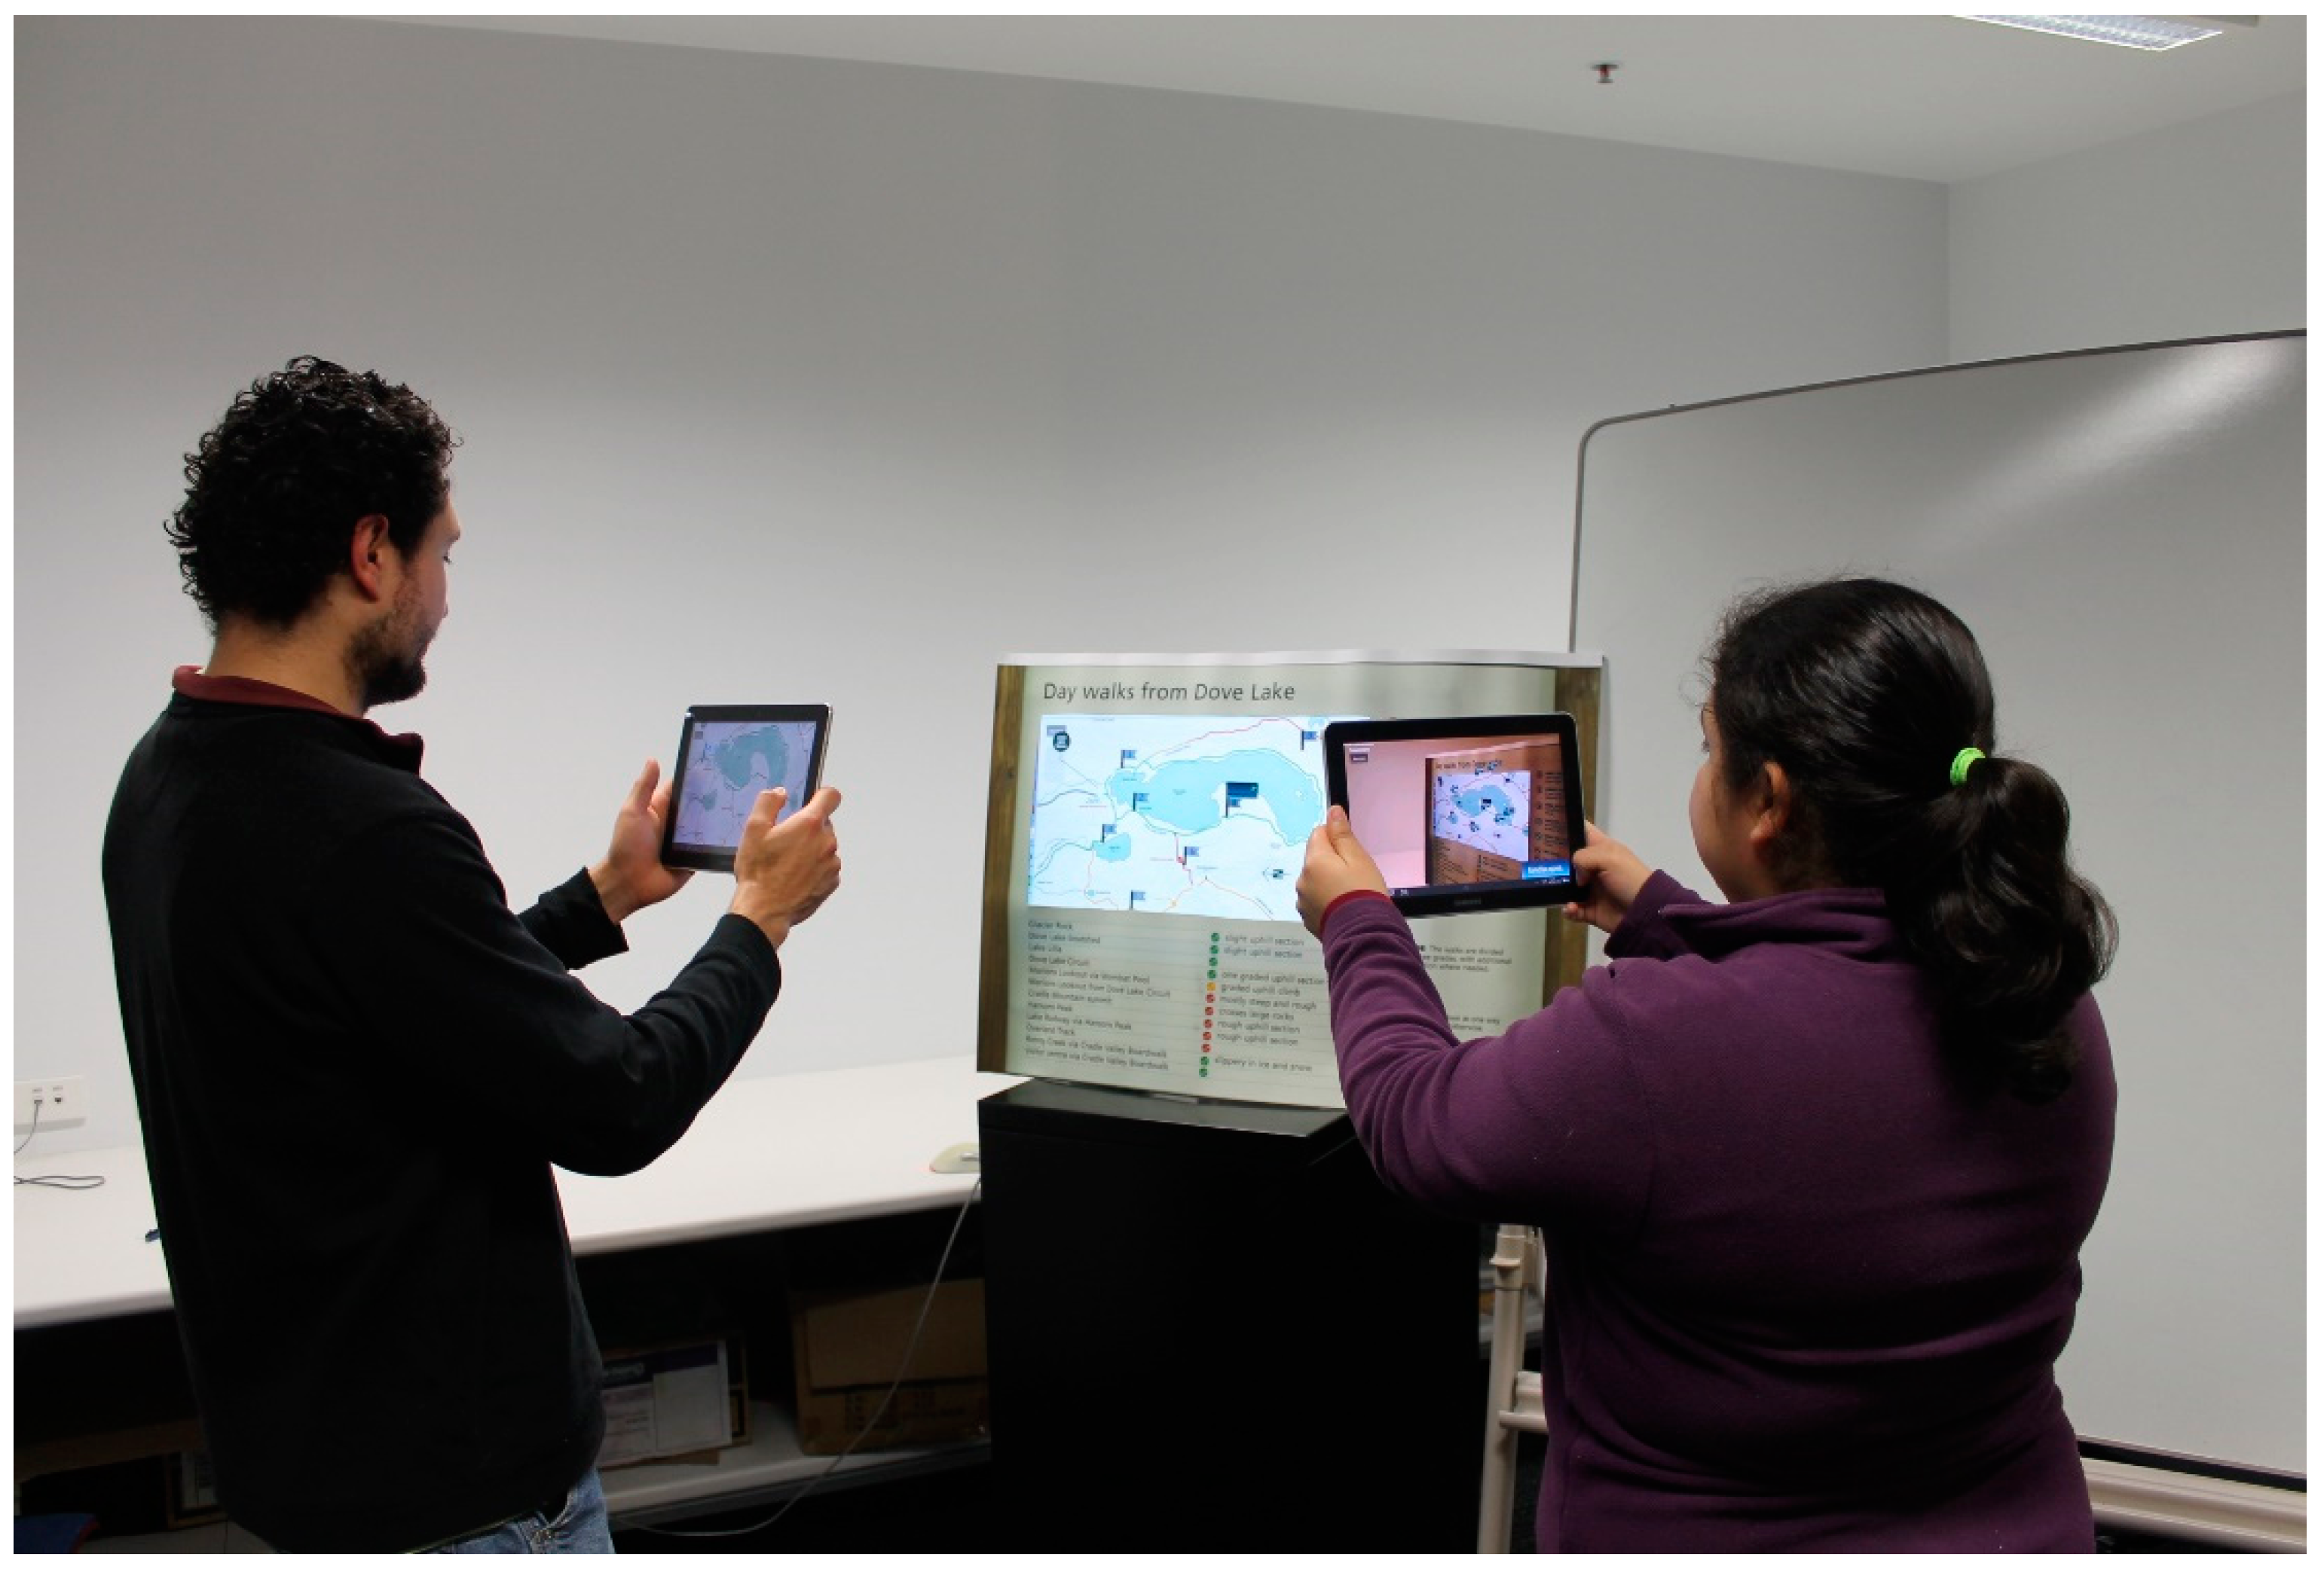
4.1. Context
- Wildlife: with pictures of wildlife sighted at that position. The pictures show what types of animals are commonly found there.
- Landscapes: with pictures of the view from that position.
- Notes: with extra information of that particular spot, mimicking comments other hikers could leave on the public display.
4.2. Theoretical Framework
Collaboration
Engagement
- (1)
- Proximal interaction measure: measures how close participants work to each other.
- (2)
- Mutual modification measure: indicates each participant’s contribution to the final results.
- (3)
- Contribution to joint production measure: indicates the increased contribution to final results.
4.3. Design
- Proximal interaction measure: To identify this characteristic, we limit the time between the instance that one group member finishes talking and the time that the other members starts talking (one second or less). If the silence time between each participant exceeded this limitation, the subconversation was finished and a new one was started. This precaution was especially important in identifying “both” subconversations.
- Mutual modification measure: To identify this characteristic, we counted a subconversation as “both” when participants where incorporating different opinions to the discussion. When one participant agrees on the other participant’s opinion, even with words, that conversation was labelled as “one”.
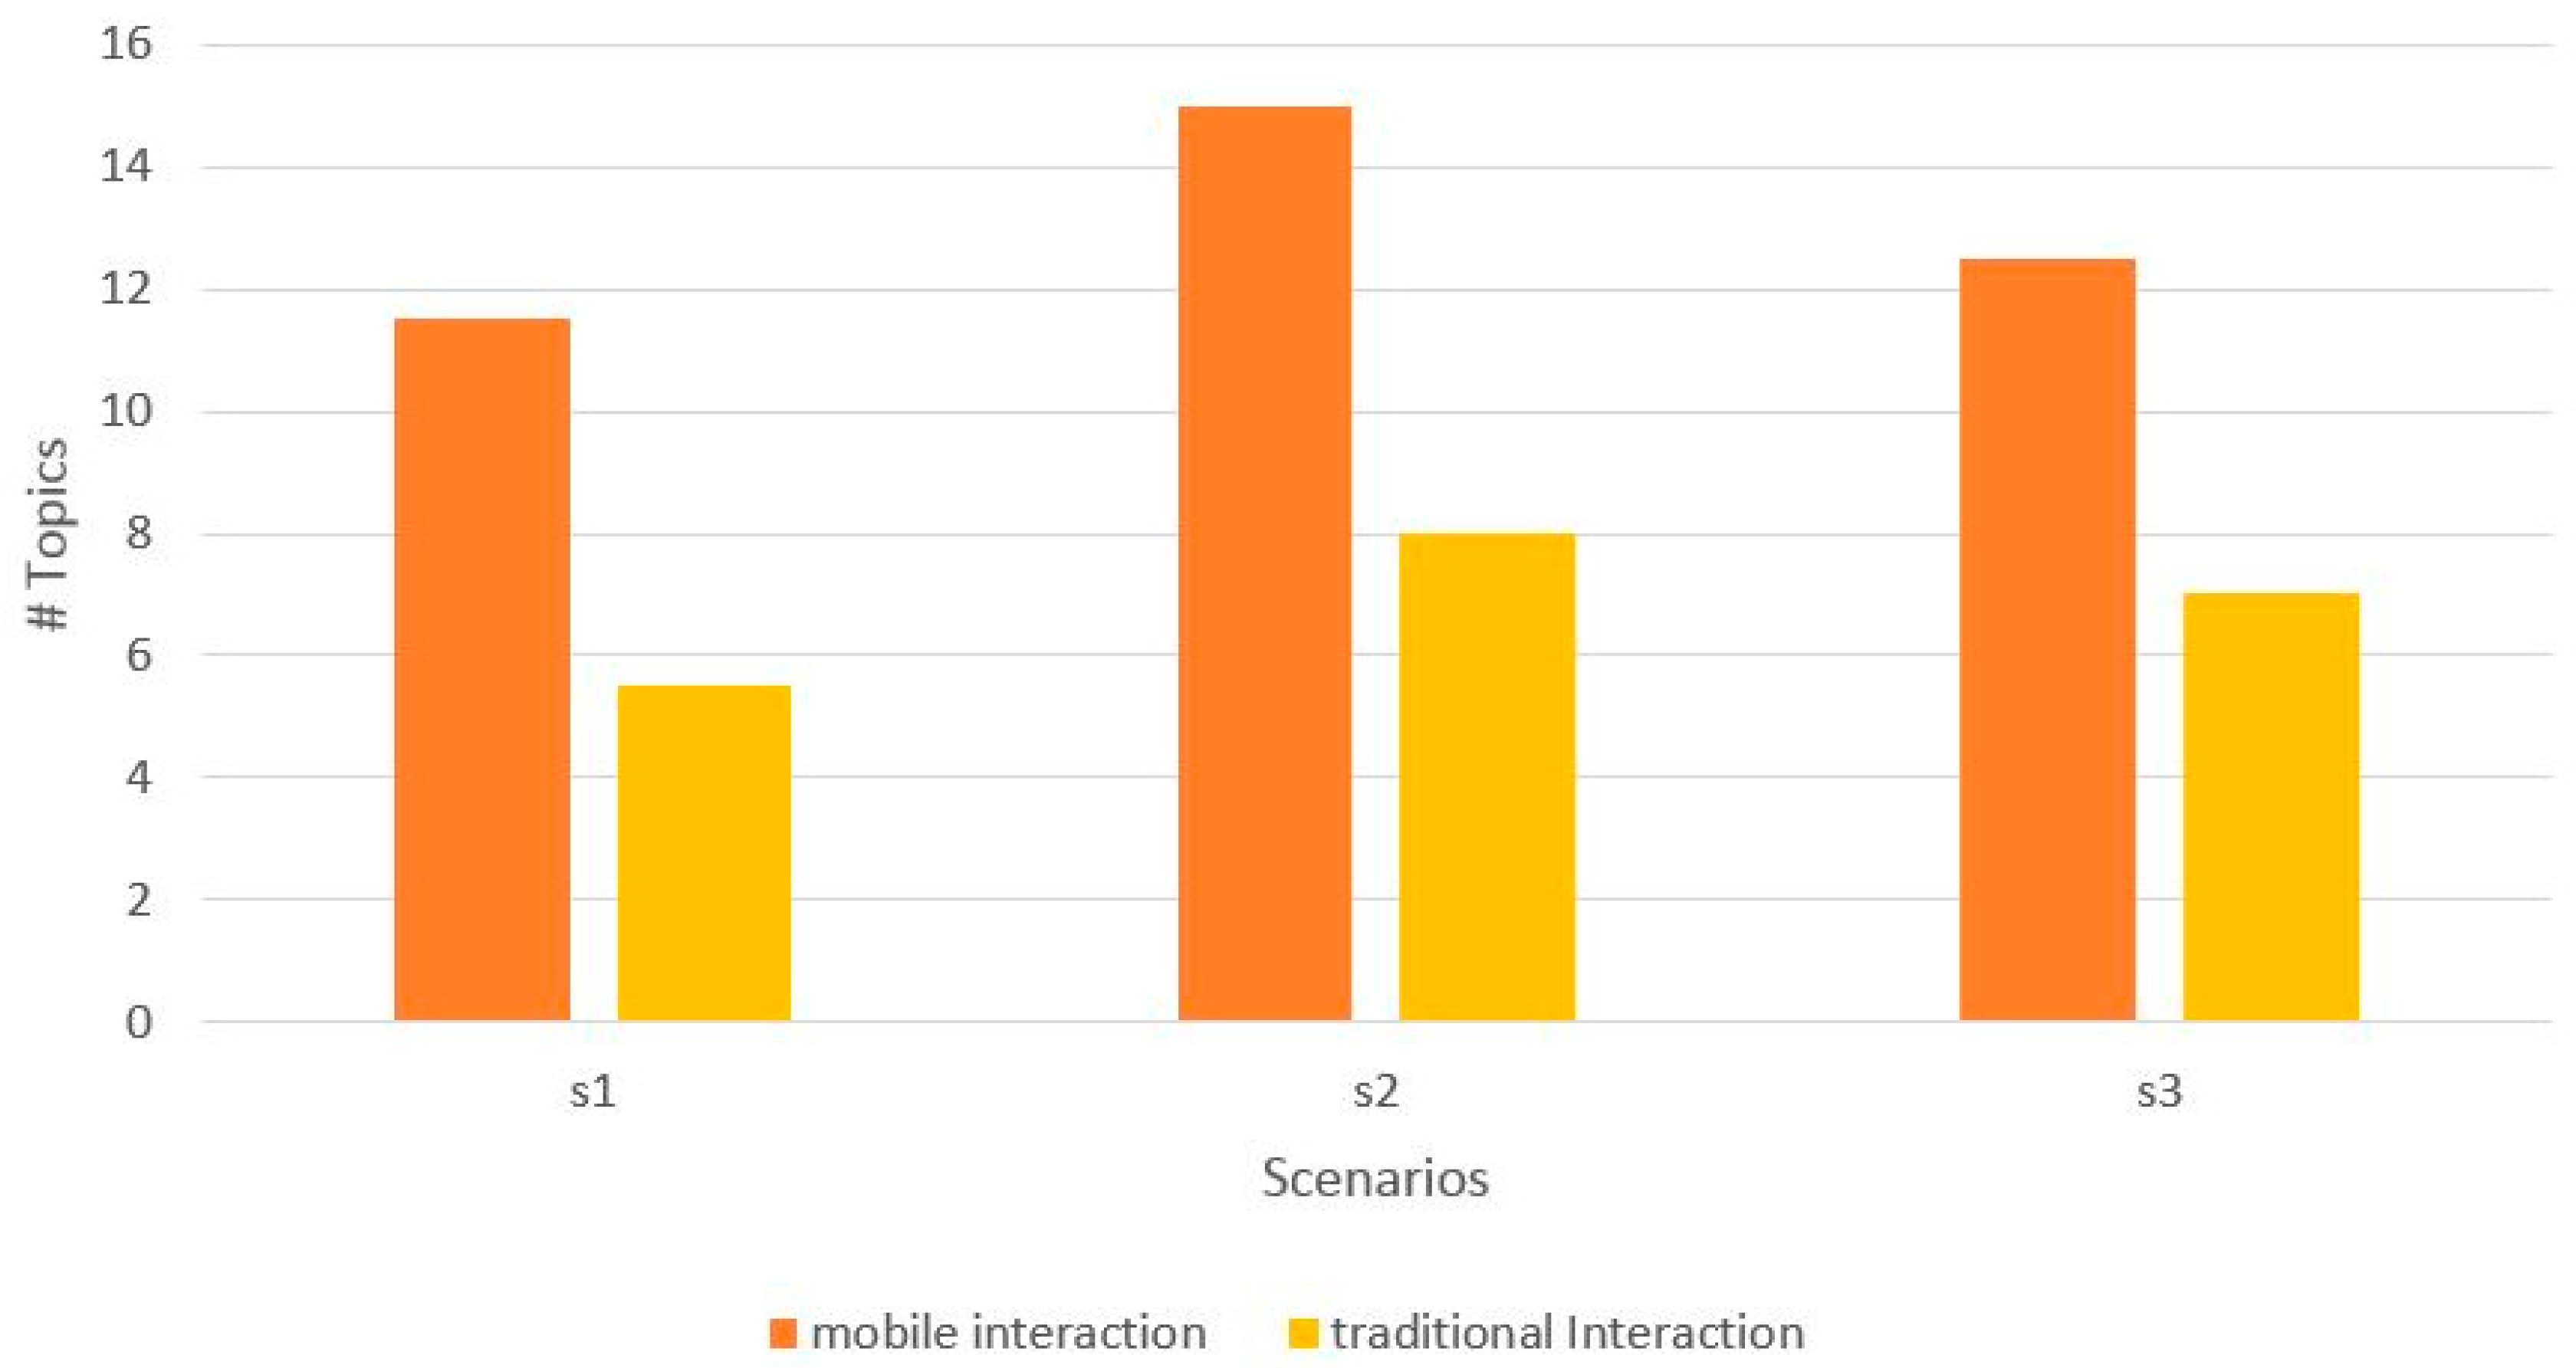
- Contribution to joint production measure: To identify this characteristic, we only counted towards the subconversation analysis the topics related to the content of the public display.
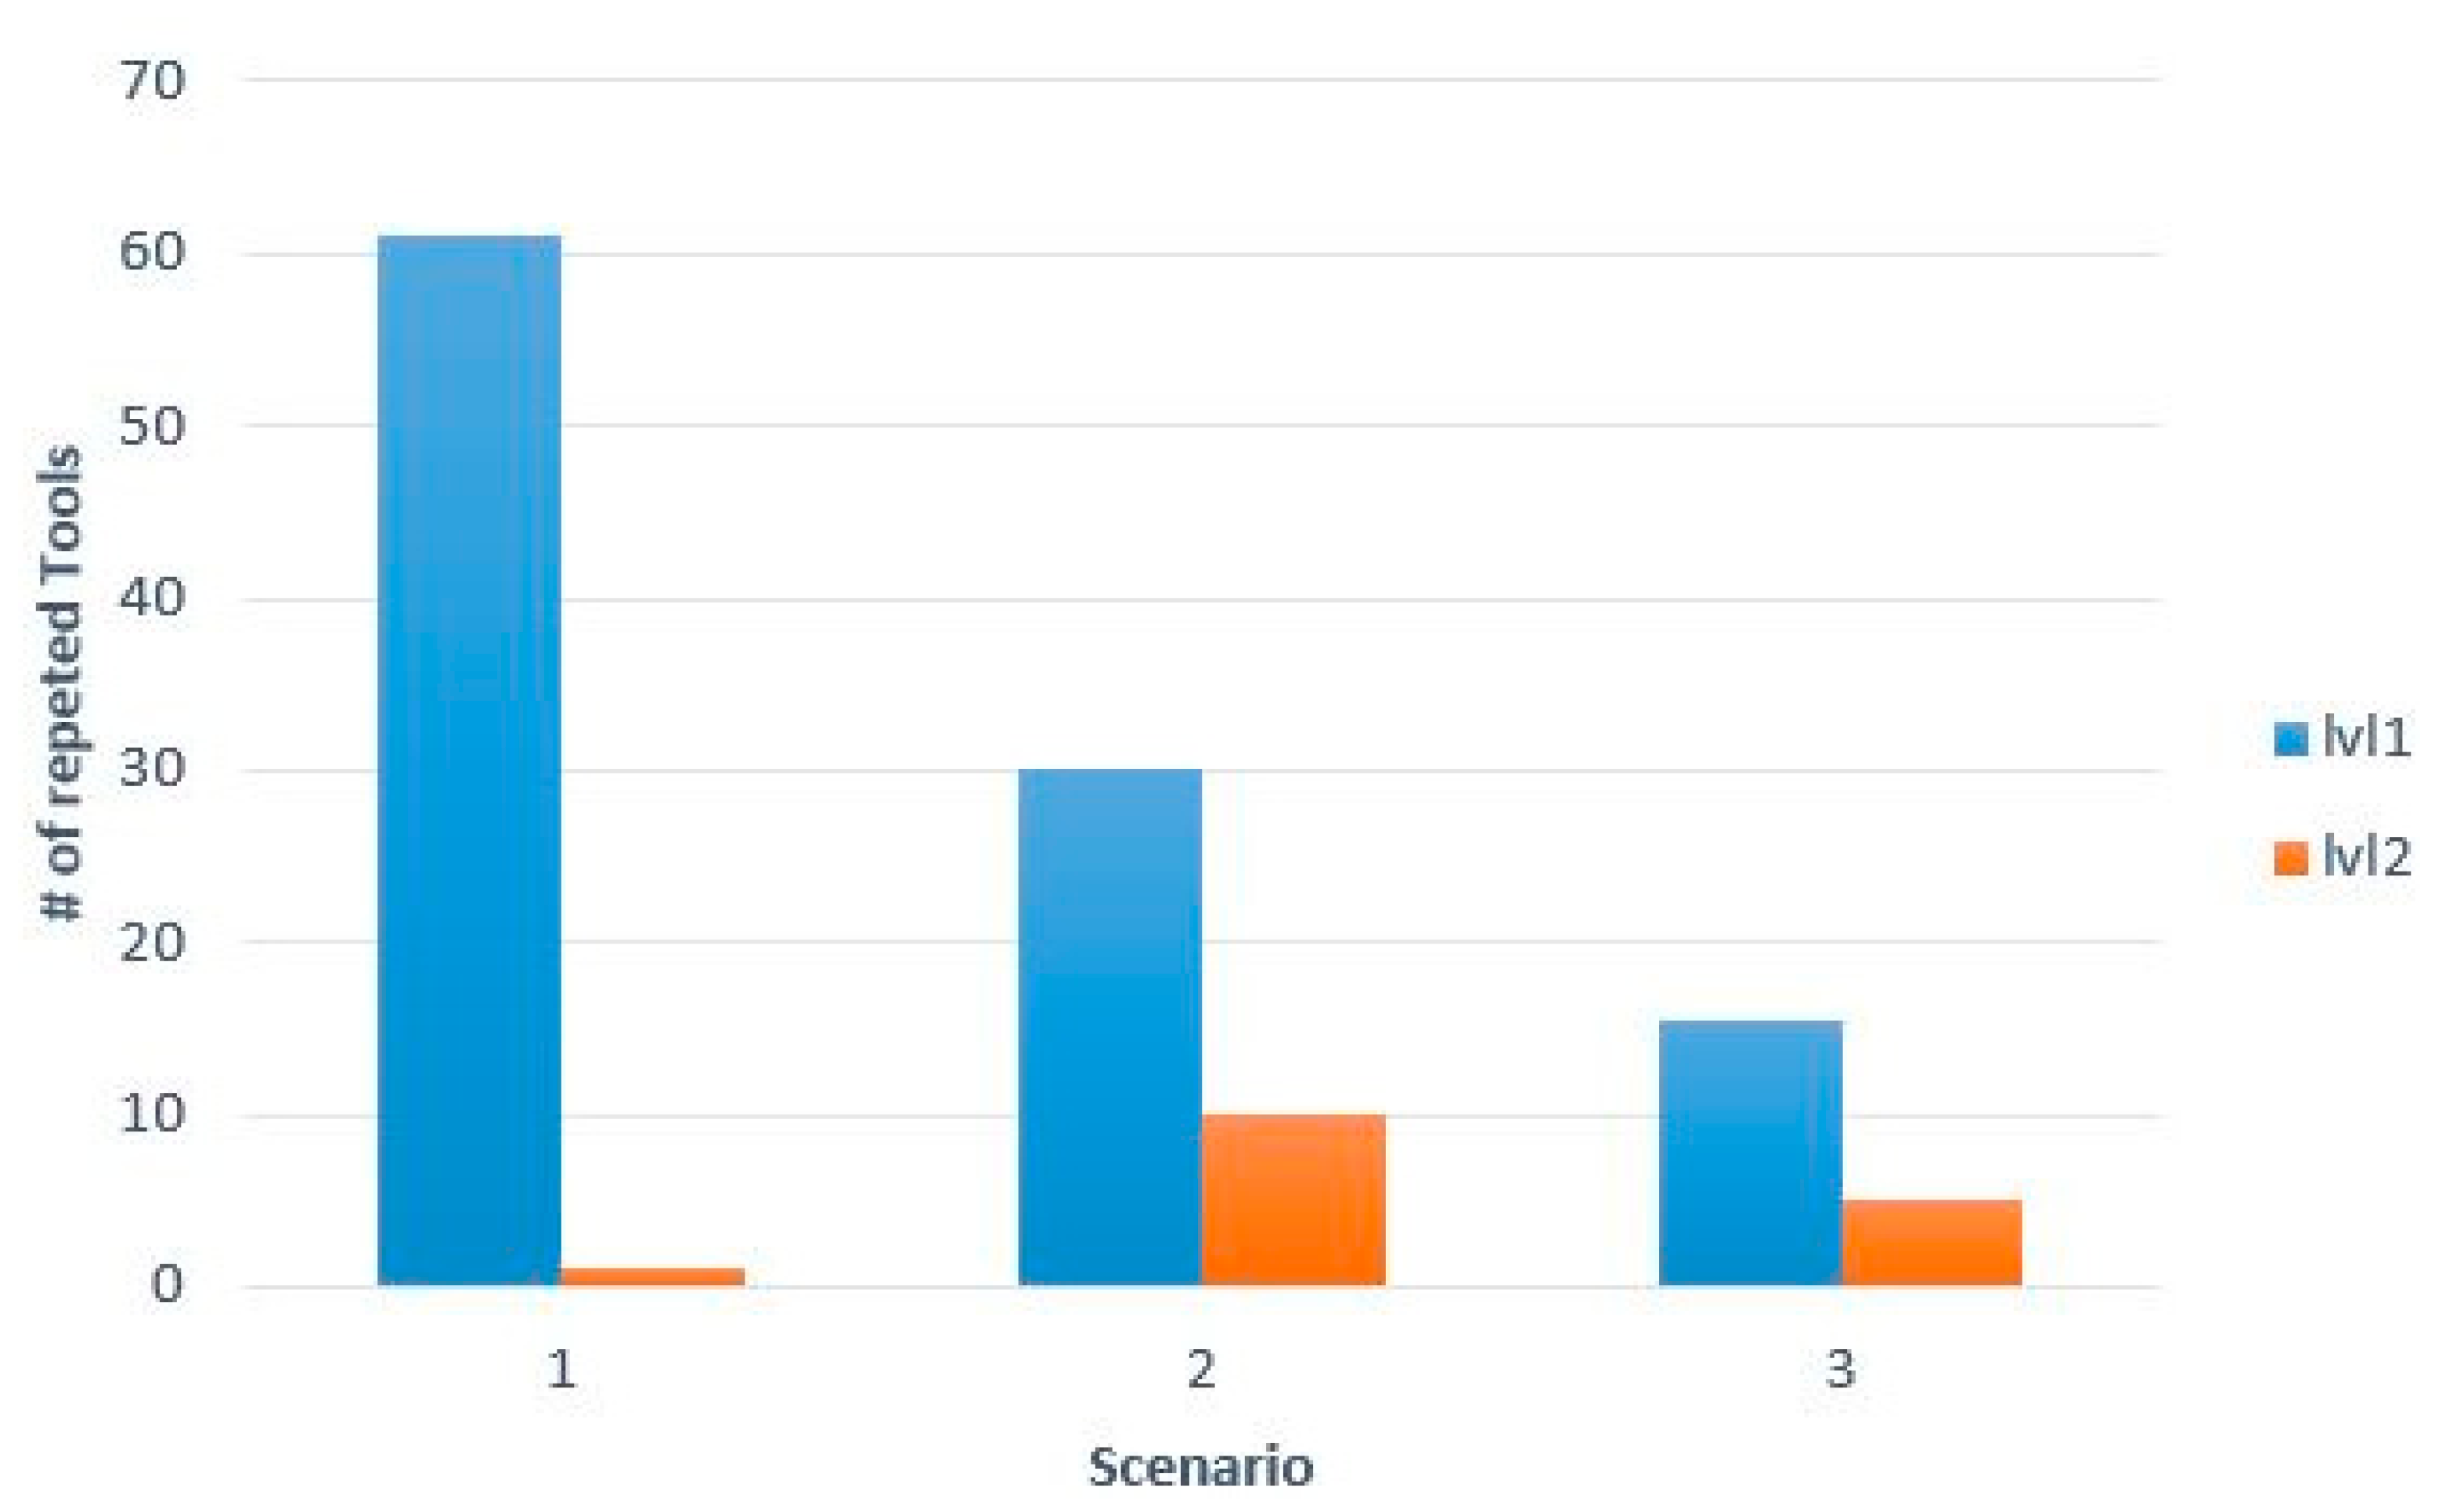
- Novelty: the used elements in the user interface were analyzed to see the browsing pattern of each user. We theorize that if users find the elements interesting or unusual they will seek them out, clicking them multiple times and looking at all the information available.
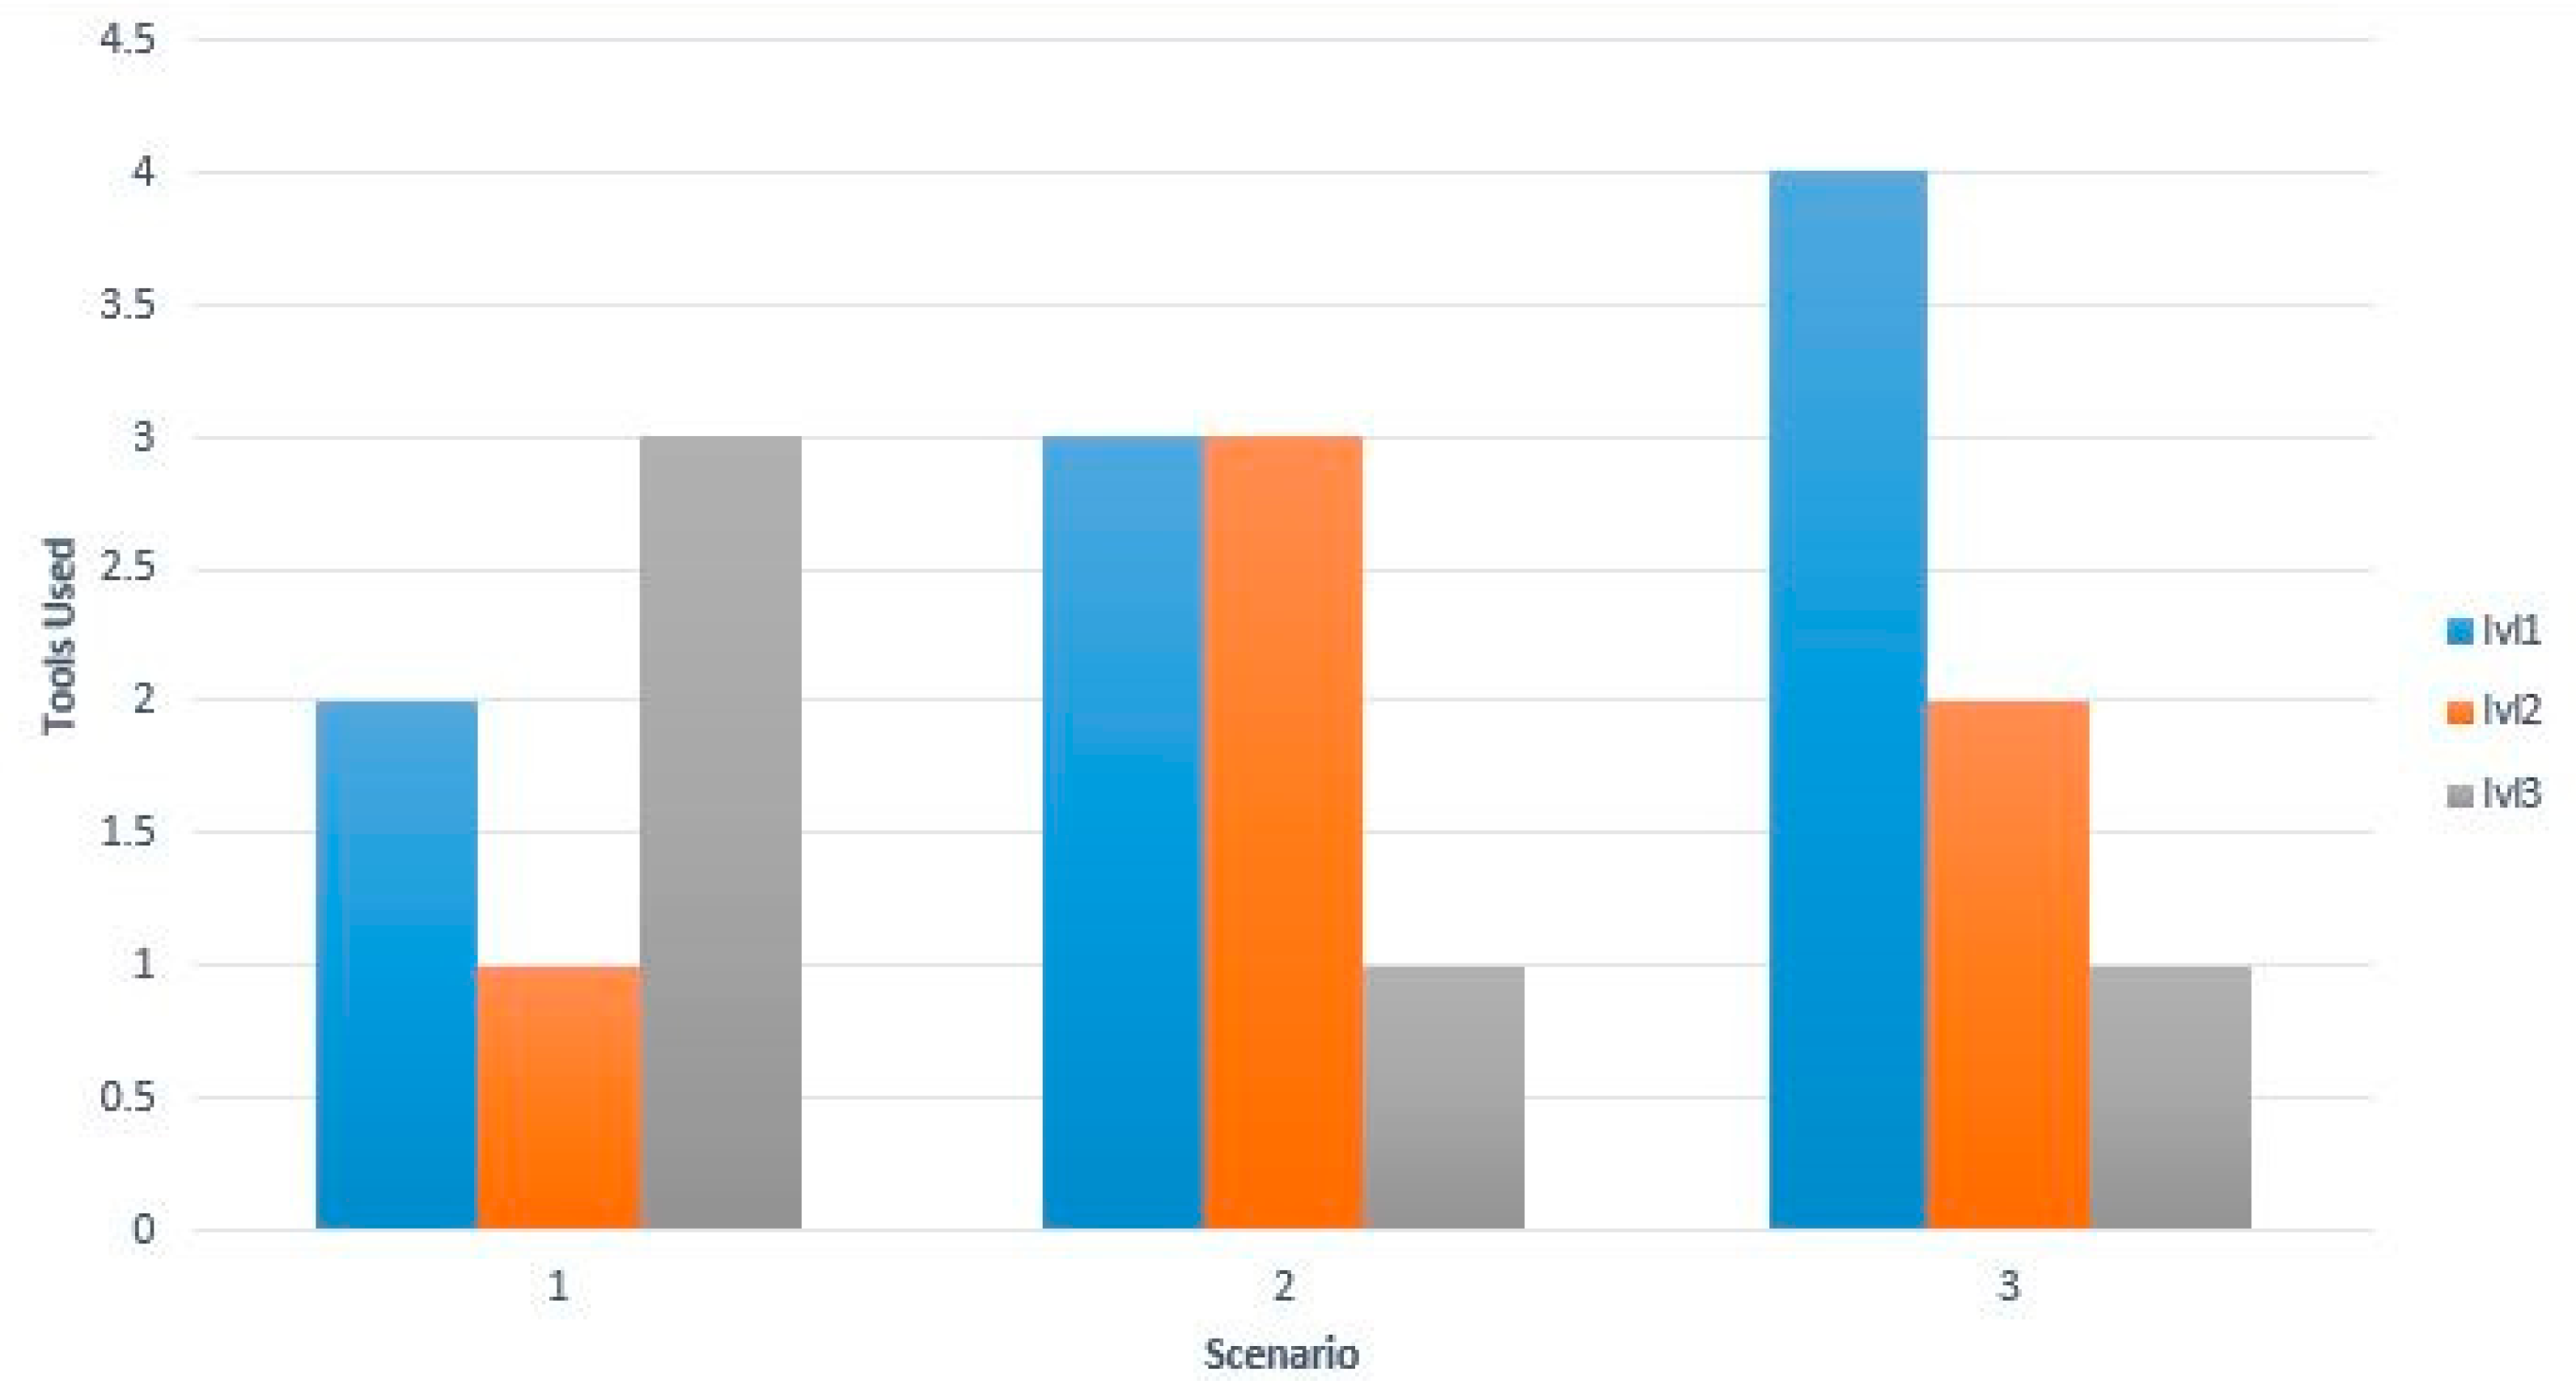
- Engagement: our interface has three information levels and we take participants’ sustained interest in the information if they explore all information levels. The three levels of information available are:
- ○
- Level 1: geolocalized information on the map and accessible with one click.
- ○
- Level 2: more information (pictures, comments) on top of that geolocalized information and accessible with two clicks.
- ○
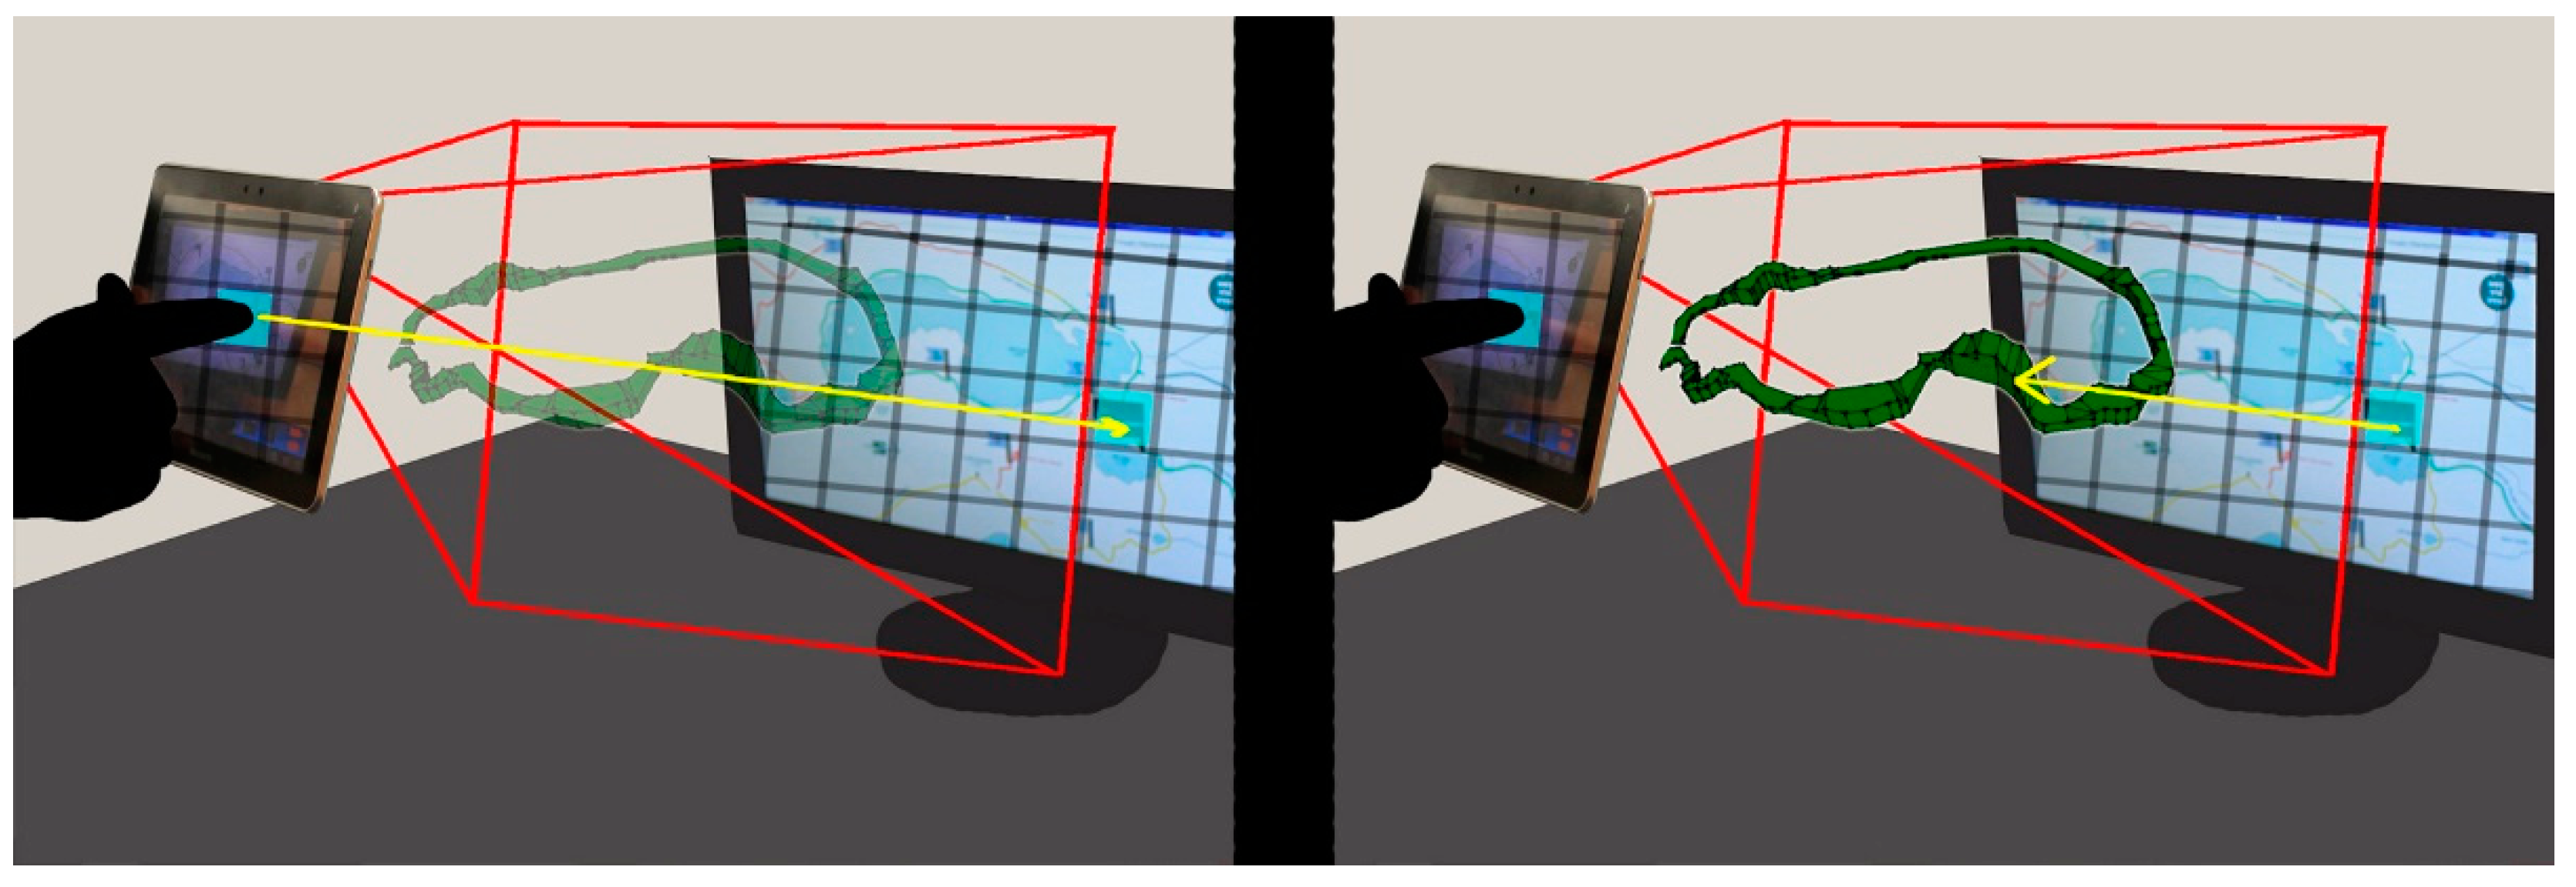
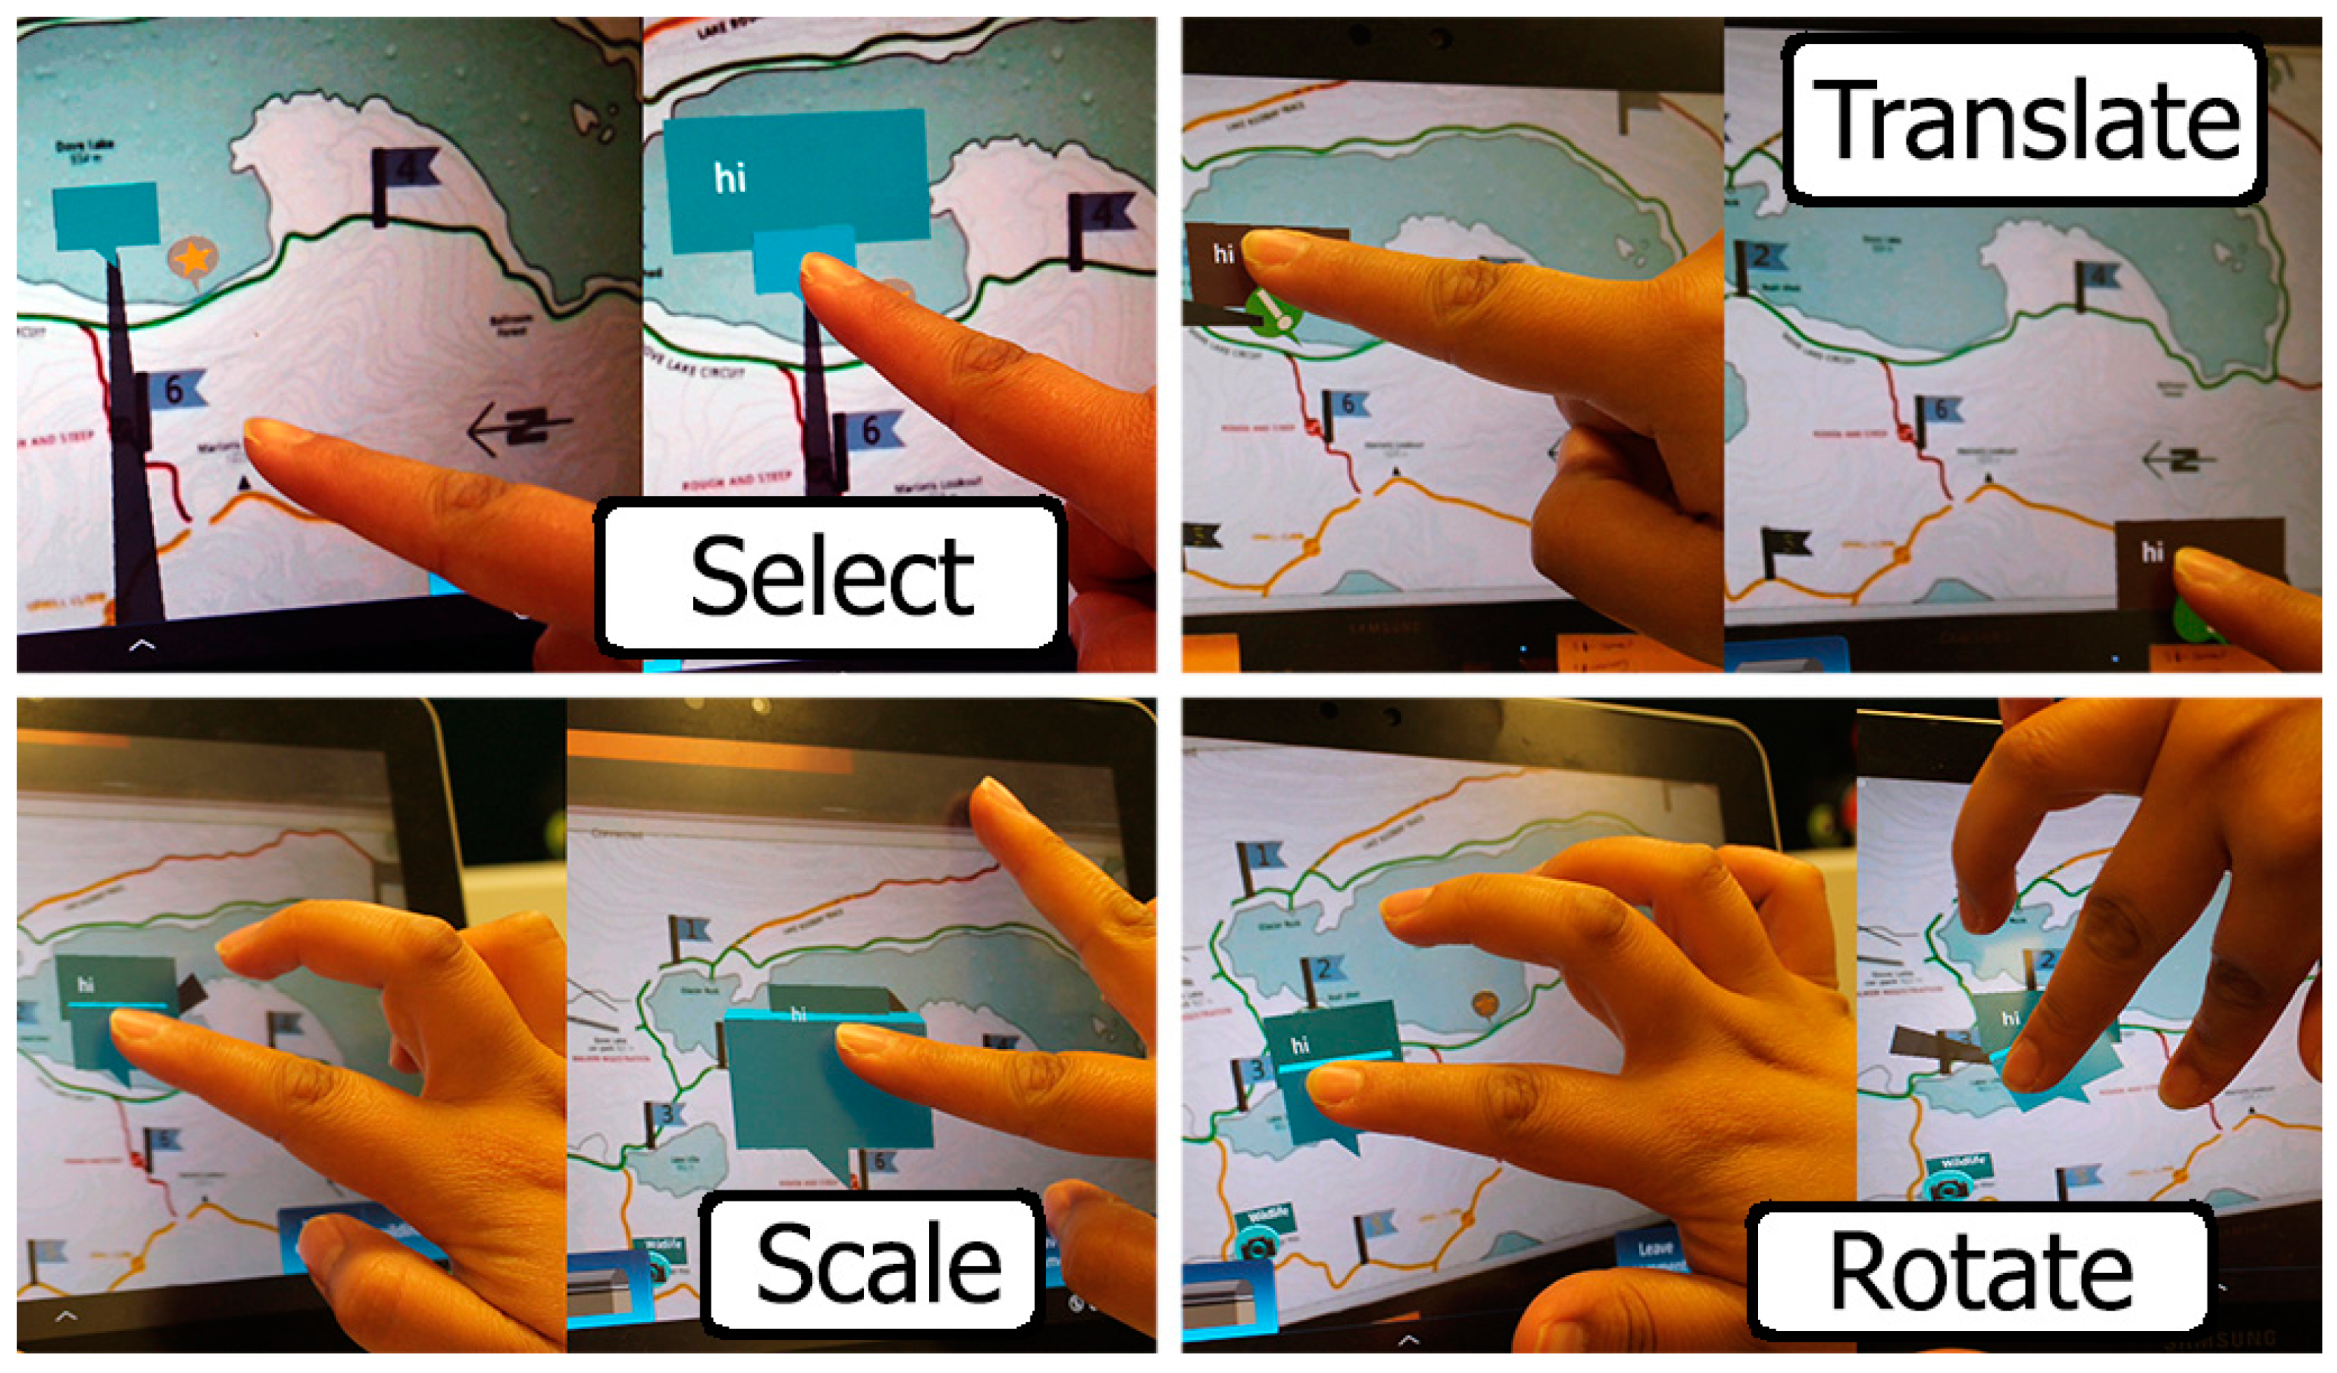
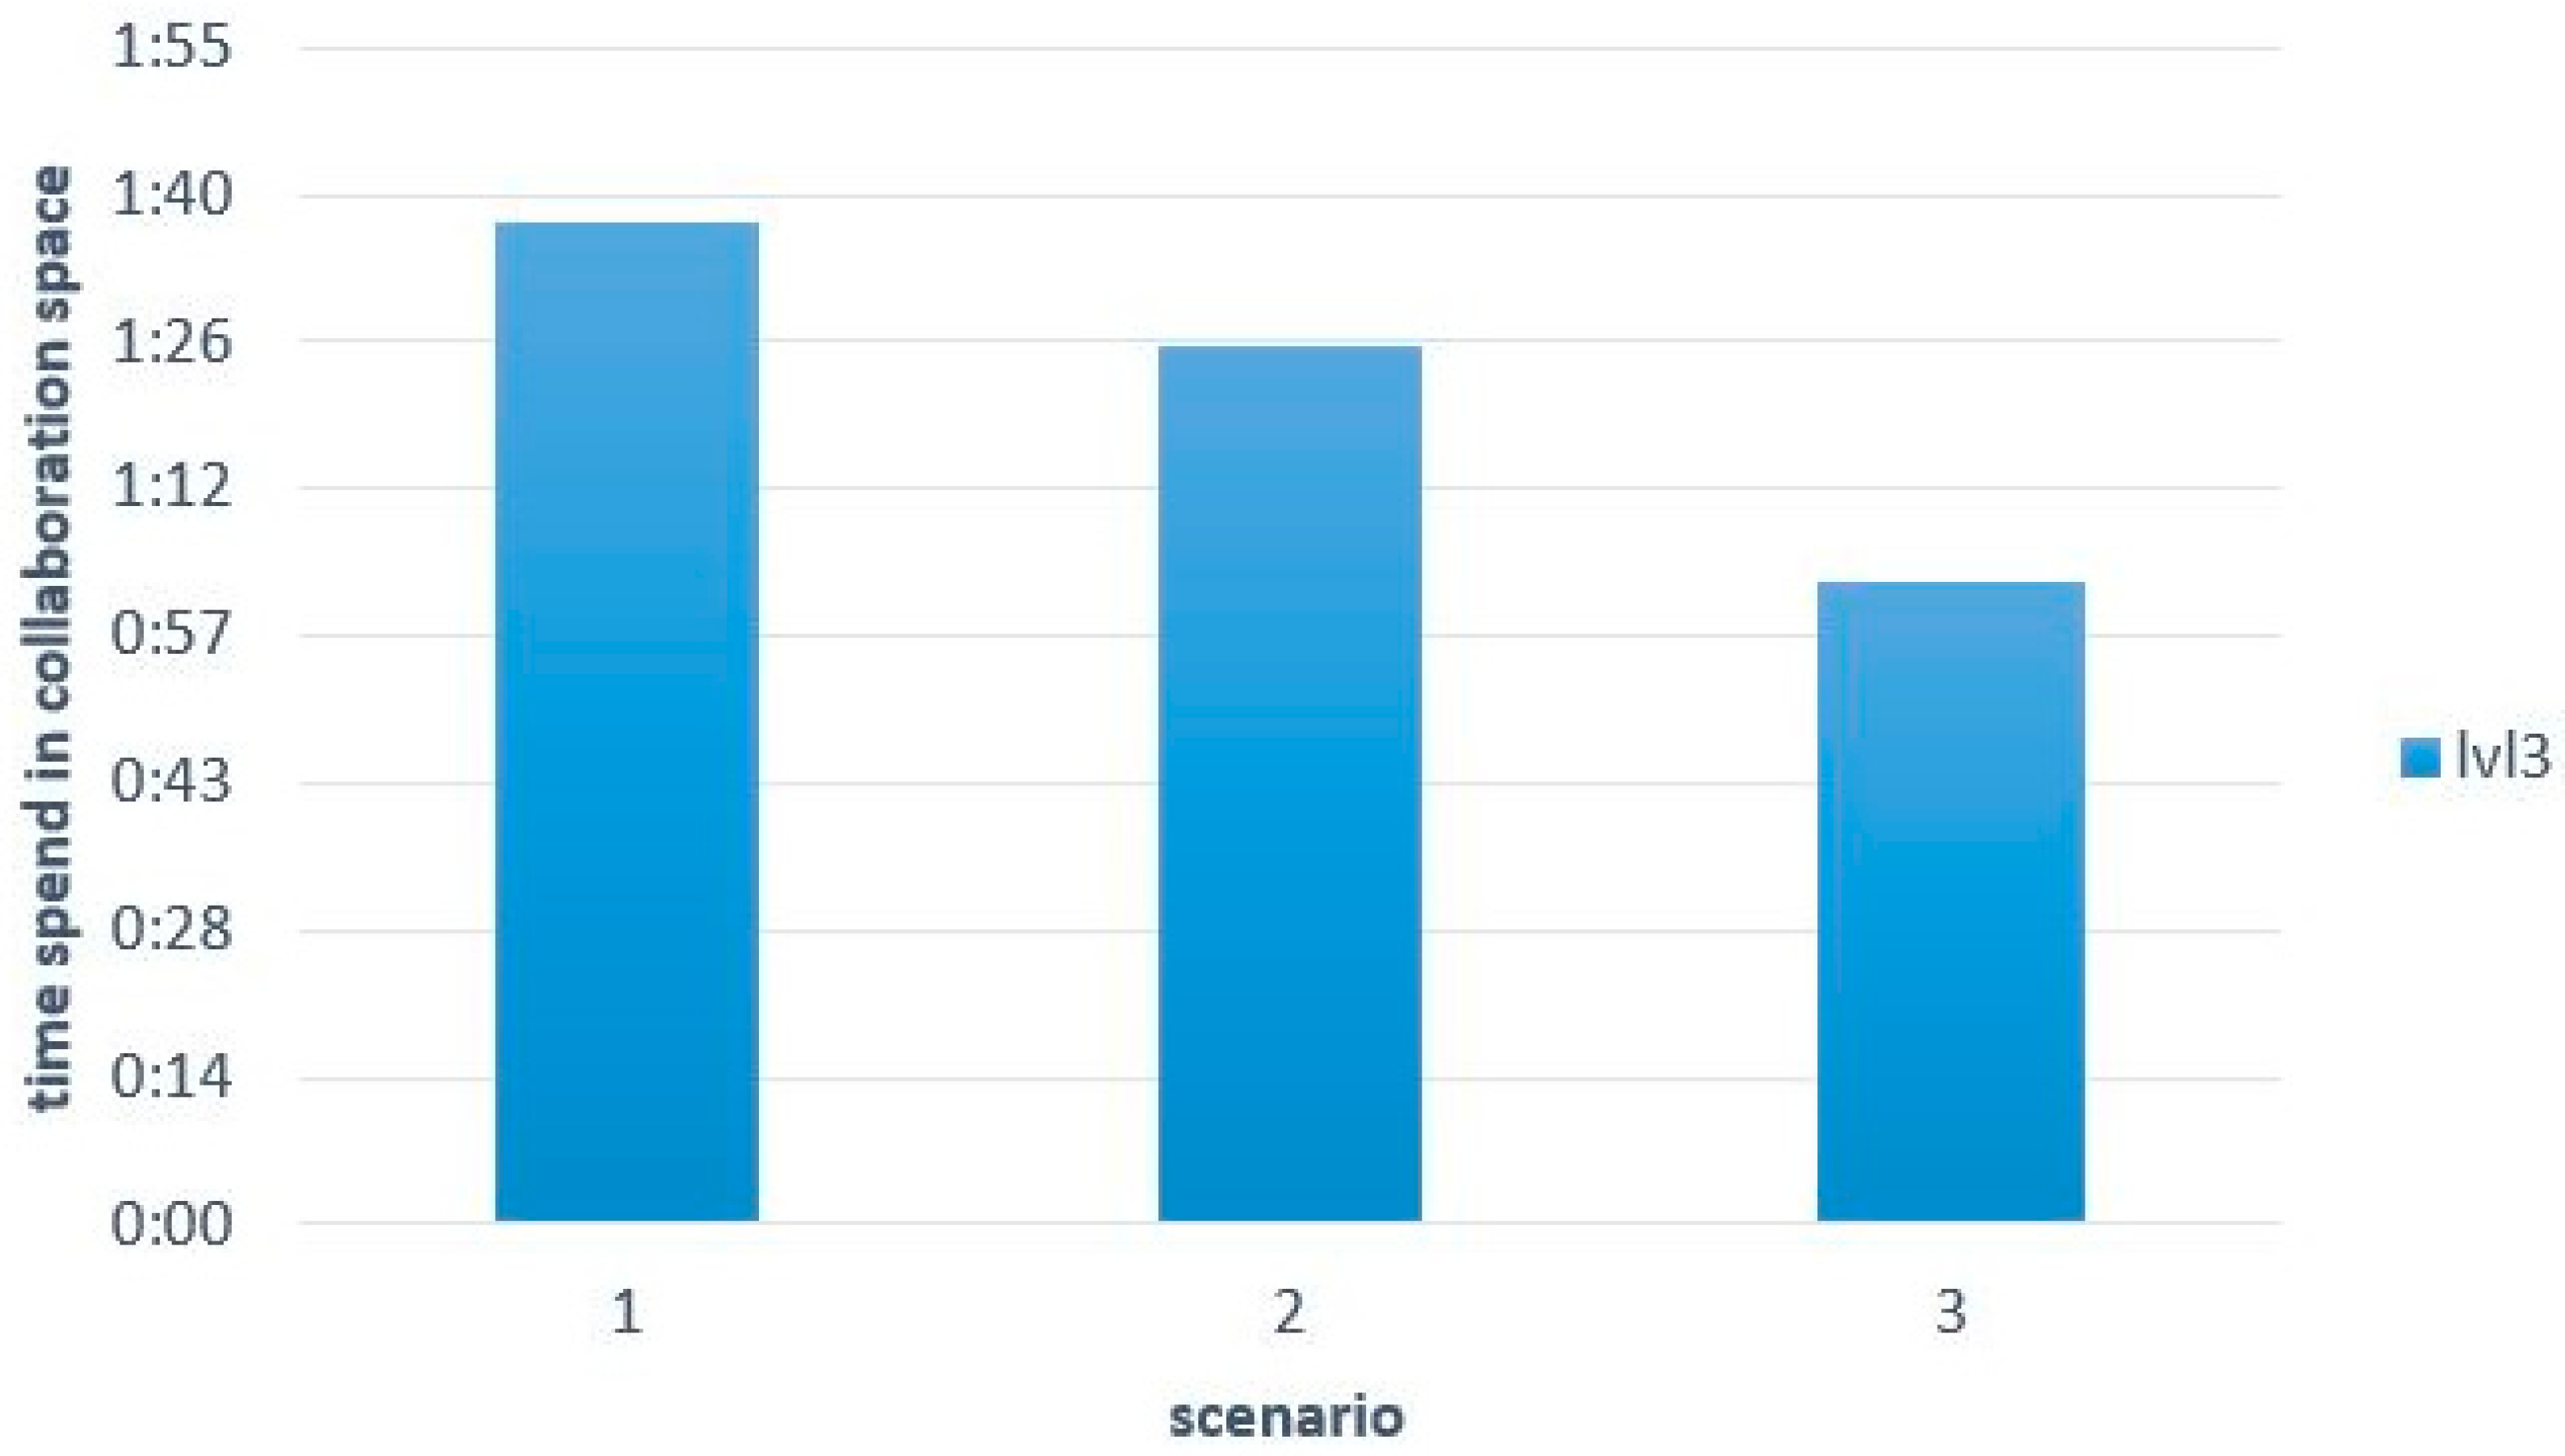
- Level 3: 3D models only visible in the cooperative space and that enhance the information already available on the public display. This information is accessible using touch gestures like translation.
5. Results and Discussion
5.1. Collaboration
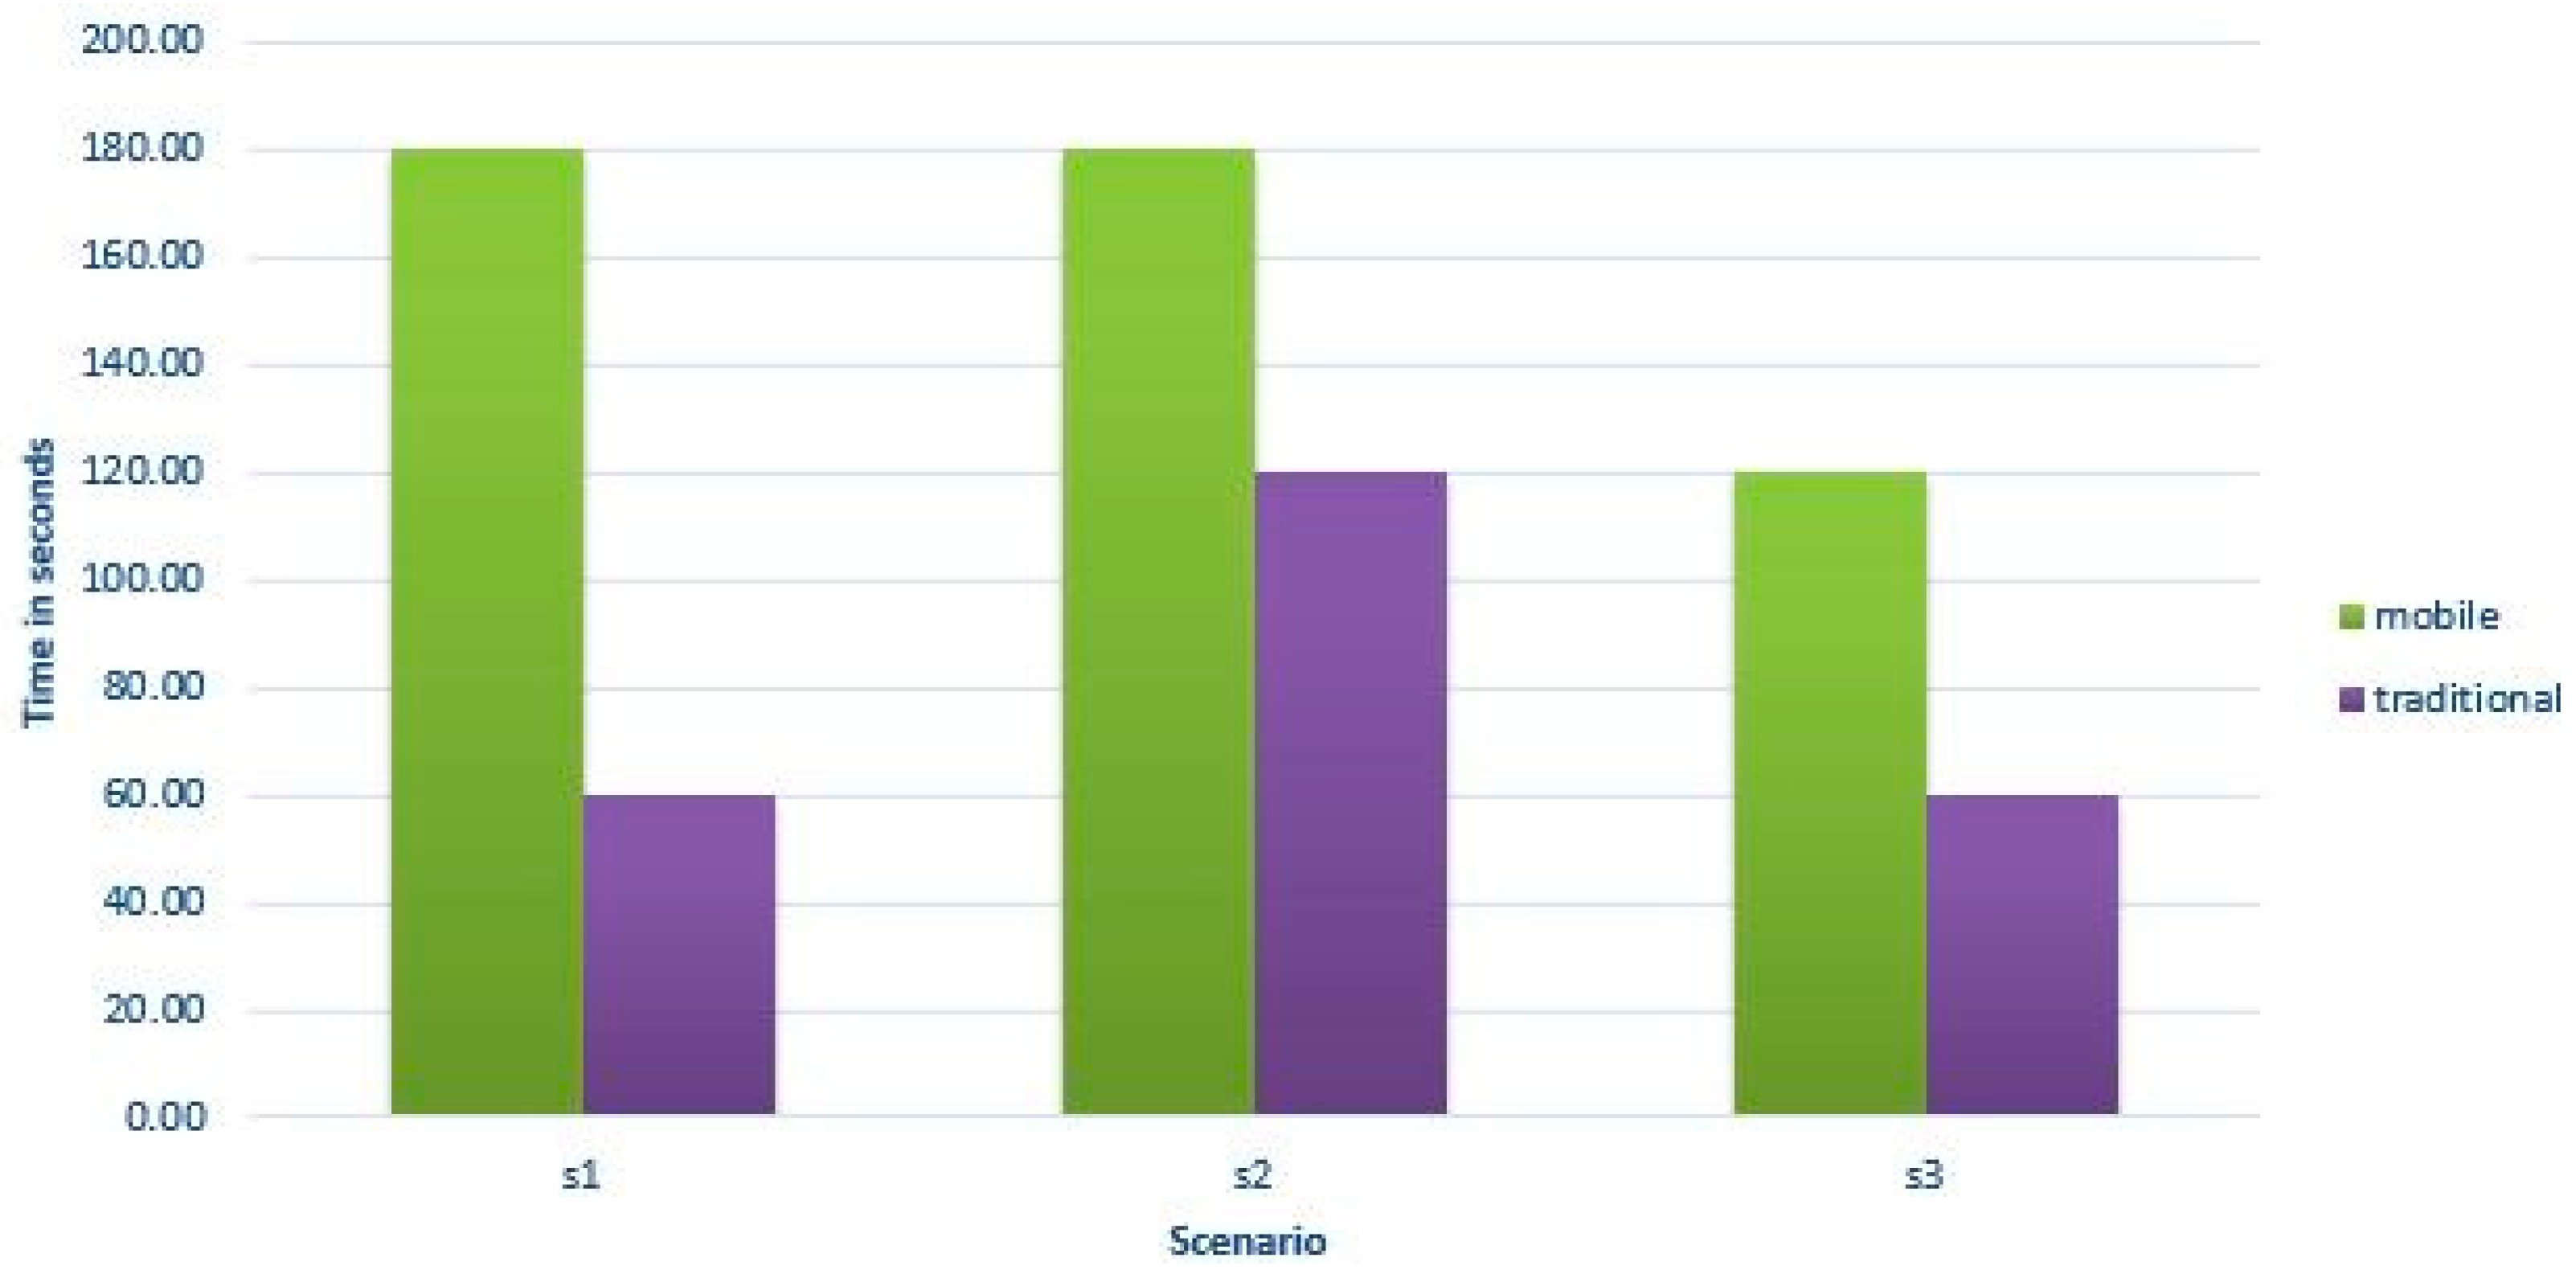
5.2. Engagement
6. Conclusions
- The usability test scenario, bushwalking, was tested in a controlled environment inside the HIT Lab AU. To evaluate the proposed 3D mobile interaction in a real setting, future analysis could be done in a field study. This could lead to other types of collaboration this usability study did not explore.
- The proposed 3D mobile interaction was tested in one of the many scenarios where public displays can be used. Future research can conduct other usability tests to evaluate the proposed 3D mobile interaction in one of those scenarios.
- An off-location scenario of the interaction is interesting and worth exploring as a follow-up activity after the initial on-location scenario engagement, which is the focus of this paper. This could further increase the level of user engagement.
Author Contributions
Conflicts of Interest
References
- Hosio, S.; Kukka, H.; Goncalves, J.; Kostakos, V.; Ojala, T. Toward Meaningful Engagement with Pervasive Displays. IEEE Pervasive Comput. 2016, 15, 24–31. [Google Scholar] [CrossRef]
- Parra, G.; Klerkx, J.; Duva, E. Understanding Engagement with Interactive Public Displays: An Awareness Campaign in the Wild. In Proceedings of the International Symposium on Pervasive Displays (PerDis ’14), Copenhagen, Denmark, 3–4 June 2014; ACM: New York, NY, USA, 2014. [Google Scholar]
- Müller, J.; Alt, F.; Schmidt, A.; Michelis, D. Requirements and Design Space for Interactive Public Displays. In Proceedings of the 18th ACM International Conference on Multimedia, Firenze, Italy, 25–29 October 2010; ACM: New York, NY, USA, 2010; pp. 1285–1294. [Google Scholar]
- Machuca, M.D.B.; Chinthammit, W.; Yang, Y.; Duh, H. 3D mobile interactions for public displays. In Proceedings of the SIGGRAPH Asia 2014 Mobile Graphics and Interactive Applications (SA ’14), Shenzhen, China, 3–6 December 2014; ACM: New York, NY, USA, 2014. Article 8. [Google Scholar]
- Azuma, R.T. A survey of augmented reality. Presence Teleoper. Virtual Environ. 1997, 6, 355–385. [Google Scholar] [CrossRef]
- Bryan-Kinns, N.; Healey, P.; Leach, J. Exploring mutual engagement in creative collaborations. In Proceedings of the 6th ACM SIGCHI Conference on Creativity & Cognition (C&C ’07), Washington, DC, USA, 13–15 June 2007; ACM: New York, NY, USA, 2007; pp. 223–232. [Google Scholar]
- Kurdyukova, E.; Obaid, M.; André, E. Direct, Bodily or Mobile Interaction? Comparing Interaction Techniques for Personalized Public Displays. In Proceedings of the 11th International Conference on Mobile and Ubiquitous Multimedia, Ulm, Germany, 4–6 December 2012; ACM: New York, NY, USA, 2012. [Google Scholar]
- Huang, W.; Kaminski, B.; Luo, J.; Huang, X.; Li, J.; Ross, A.; Wright, J.; An, D.H. SMART: Design and evaluation of a collaborative museum visiting application. In Proceedings of the 12th International Conference on Cooperative Design, Visualization, and Engineering, Mallorca, Spain, 20–23 September 2015; pp. 57–64. [Google Scholar]
- Huang, W.; Alem, L.; Tecchia, F. HandsIn3D: Supporting remote guidance with immersive virtual environments. In Proceedings of the IFIP Conference on Human-Computer Interaction, Cape Town, South Africa, 2–6 September 2013; pp. 70–79. [Google Scholar]
- Vogel, D.; Balakrishnan, R. Distant freehand pointing and clicking on very large, high resolution displays. In Proceedings of the 18th Annual ACM Symposium on User Interface Software and Technology (UIST ’05), Seattle, WA, USA, 23–26 October 2005; ACM: New York, NY, USA, 2005; pp. 33–42. [Google Scholar]
- Schmidt, D.; Seifert, J.; Rukzio, E.; Gellersen, H. A Cross-Device Interaction Style for Mobiles and Surfaces. In Proceedings of the Designing Interactive Systems Conference, Newcastle Upon Tyne, UK, 11–15 June 2012; ACM: New York, NY, USA, 2012; pp. 318–327. [Google Scholar]
- Hyakutake, A.; Ozaki, K.; Kitani, K.; Koike, H. 3-D Interaction with a Large Wall Display using Transparent Markers. In Proceedings of the International Conference on Advanced Visual Interfaces, Roma, Italy, 26–28 May 2010; ACM: New York, NY, USA, 2010; pp. 97–100. [Google Scholar]
- Baldauf, M.; Lasinger, K.; Fröhlich, P. Private Public Screens—Detached Multi-User Interaction with Large Displays through Mobile Augmented Reality. In Proceedings of the 11th International Conference on Mobile and Ubiquitous Multimedia, Ulm, Germany, 4–6 December 2012; ACM: New York, NY, USA, 2012; p. 27. [Google Scholar]
- Brignull, H.; Rogers, Y. Enticing people to interact with large public displays in public spaces. In Proceedings of the IFIP TC13 International Conference on Human-Computer Interaction (Human-Computer Interaction INTERACT ’03), Zurich, Switzerland, 1–5 September 2003; IOS Press: Amsterdam, The Netherlands, 2003; pp. 17–24. [Google Scholar]
- Hinrichs, U.; Carpendale, S.; Valkanova, N.; Kuikkaniemi, K.; Jacucci, G.; Vande Moere, A. Interactive Public Displays. IEEE Comput. Graph. Appl. 2013, 33, 25–27. [Google Scholar] [CrossRef] [PubMed]
- Matsushita, N.; Rekimoto, J. HoloWall: Designing a Finger, Hand, Body, and Object Sensitive Wall. In Proceedings of the ACM Symposium on User Interface Software and Technology (UIST), Banff, AB, Canada, 14–17 October 1997; pp. 209–210. [Google Scholar]
- Clayphan, A.; Martinez-Maldonado, R.; Ackad, C.; Kay, J. An approach for designing and evaluating a plug-in vision-based tabletop touch identification system. In Proceedings of the 25th Australian Computer-Human Interaction Conference on Augmentation, Application, Innovation, Collaboration (OzCHI ’13), Adelaide, Australia, 25–29 November 2013; ACM: New York, NY, USA, 2013; pp. 373–382. [Google Scholar]
- Reid, J.; Hyams, J.; Shaw, K.; Lipson, M. “Fancy a Schmink?”: A novel networked game in a café. In Proceedings of the 2004 ACM SIGCHI International Conference on Advances in Computer Entertainment Technology, Singapore, 3–5 June 2004; ACM: New York, NY, USA, 2004; pp. 18–23. [Google Scholar]
- Scheible, J.; Ojala, T. MobiLenin combining a multitrack music video, personal mobile phones and a public display into multi-user interactive entertainment. In Proceedings of the 13th Annual ACM International Conference on Multimedia (MULTIMEDIA ’05), Singapore, 6–11 November 2005; ACM: New York, NY, USA, 2005; pp. 199–208. [Google Scholar]
- Lucero, A.; Holopainen, J.; Jokela, T. MobiComics: Collaborative use of mobile phones and large displays for public expression. In Proceedings of the 14th International Conference on Human-Computer Interaction with Mobile Devices and Services (MobileHCI ’12), San Francisco, CA, USA, 21–24 September 2012; ACM: New York, NY, USA, 2012; pp. 383–392. [Google Scholar]
- Lee, G.; Yang, U.; Son, W. Layered multiple displays for immersive and interactive digital contents. In Proceedings of the International Conference on Electronic Commerce (ICEC ’06), Cambridge, UK, 20–22 September 2006; Springer: Berlin/Heidelberg, Germany, 2006; pp. 123–134. [Google Scholar]
- Bier, E.A.; Stone, M.C.; Pier, K.; Buxton, W.; DeRose, T.D. Toolglass and Magic Lenses: The See-Through Interface. In Proceedings of the 20th Annual Conference on Computer Graphics and Interactive Techniques (SIGGRAPH ’93), Anaheim, CA, USA, 2–6 August 1993; pp. 73–80. [Google Scholar]
- Bachl, S.; Tomitsch, M.; Kappel, K.; Grechenig, T. The effects of personal displays and transfer techniques on collaboration strategies in multi-touch based multi-display environments. In Proceedings of the 13th IFIP TC 13 International Conference on Human-Computer Interaction (INTERACT ’11), Lisbon, Portugal, 5–9 September 2011; Springer: Berlin/Heidelberg, Germany, 2011; Volume Part III, pp. 373–390. [Google Scholar]
- Huang, W.; Alem, L.; Livingston, M.A. Human Factors in Augmented Reality Environments; Springer: New York, NY, USA, 2013. [Google Scholar]
- Tang, J. Findings from observational studies of collaborative work. Int. J. Man-Mach. Stud. 1991, 34, 143–160. [Google Scholar] [CrossRef]
- Kitamura, Y.; Osawa, W.; Yamaguchi, T.; Takemura, H.; Kishino, F. A display table for strategic collaboration preserving private and public information. In Proceedings of the 4th International Conference on Entertainment Computing (ICEC ’05), Sanda, Japan, 19–21 September 2005; Springer: Berlin/Heidelberg, Germany, 2005; pp. 167–179. [Google Scholar]
- Jakobsen, M.; HornbÆk, K. Up close and personal: Collaborative work on a high-resolution multitouch wall display. ACM Trans. Comput.-Hum. Interact. 2014, 21, 11. [Google Scholar] [CrossRef]
- Ballagas, R.; Dugan, T.; Revelle, G.; Mori, K.; Sandberg, M.; Go, J.; Reardon, E.; Spasojevic, M. Electric Agents: Fostering Sibling Joint Media Engagement through Interactive Television and Augmented Reality. In Proceedings of the 2013 Conference on Computer Supported Cooperative Work Companion (CSCW ’13), San Antonio, TX, USA, 23–27 February 2013; ACM: New York, NY, USA, 2013; pp. 225–235. [Google Scholar]
- Hornecker, E. Interactions around a contextually embedded system. In Proceedings of the Fourth International Conference on Tangible, Embedded, and Embodied Interaction (TEI ’10), Cambridge, MA, USA, 24–27 January 2010; ACM: New York, NY, USA, 2010; pp. 169–176. [Google Scholar]
- O’Brien, H.L.; Toms, E.G. Measuring engagement with search systems using the User Engagement Scale. Inf. Process. Manag. 2013, 49, 1092–1107. [Google Scholar] [CrossRef]


| Source | Type III Sum of Squares | df | Mean Square | F | Sig. | Partial Eta Squared |
|---|---|---|---|---|---|---|
| Scenario 1 | 0.025 | 1 | 0.25 | 0.165 | 0.697 | 0.004 |
| Scenario 2 | 1.225 | 1 | 1.225 | 6.166 | 0.018 | 0.140 |
| Scenario 3 | 0.225 | 1 | 0.225 | 0.985 | 0.350 | 0.023 |
| Source | Type III Sum of Squares | df | Mean Square | F | Sig. | Partial Eta Squared |
|---|---|---|---|---|---|---|
| Both conversation topics | 60.000 | 1 | 60.000 | 6.790 | 0.012 | 0.0112 |
| Both conversation time | 2260.045 | 2 | 2260.045 | 1.106 | 0.298 | 0.021 |
| One conversation topics | 52.002 | 1 | 52.002 | 10.489 | 0.002 | 0.087 |
| One conversation time | 245.157 | 1 | 245.157 | 0.175 | 0.676 | 0.002 |
| Source | Type III Sum of Squares | df | Mean Square | F | Sig. | Partial Eta Squared |
|---|---|---|---|---|---|---|
| Scenario | 10.300 | 3 | 3.433 | 1.789 | 1.157 | 0.069 |
| Interaction | 11.250 | 1 | 11.250 | 5.861 | 0.018 | 0.075 |
| Scenario * interactions | 20.50 | 3 | 6.817 | 3.551 | 0.019 | 0.129 |
© 2018 by the authors. Licensee MDPI, Basel, Switzerland. This article is an open access article distributed under the terms and conditions of the Creative Commons Attribution (CC BY) license (http://creativecommons.org/licenses/by/4.0/).
Share and Cite
Machuca, M.D.B.; Chinthammit, W.; Huang, W.; Wasinger, R.; Duh, H. Enabling Symmetric Collaboration in Public Spaces through 3D Mobile Interaction. Symmetry 2018, 10, 69. https://doi.org/10.3390/sym10030069
Machuca MDB, Chinthammit W, Huang W, Wasinger R, Duh H. Enabling Symmetric Collaboration in Public Spaces through 3D Mobile Interaction. Symmetry. 2018; 10(3):69. https://doi.org/10.3390/sym10030069
Chicago/Turabian StyleMachuca, Mayra Donaji Barrera, Winyu Chinthammit, Weidong Huang, Rainer Wasinger, and Henry Duh. 2018. "Enabling Symmetric Collaboration in Public Spaces through 3D Mobile Interaction" Symmetry 10, no. 3: 69. https://doi.org/10.3390/sym10030069
APA StyleMachuca, M. D. B., Chinthammit, W., Huang, W., Wasinger, R., & Duh, H. (2018). Enabling Symmetric Collaboration in Public Spaces through 3D Mobile Interaction. Symmetry, 10(3), 69. https://doi.org/10.3390/sym10030069