Abstract
Intelligent cooperative multiagent systems are applied for solving a large range of real-life problems, including in domains like biology and healthcare. There are very few metrics able to make an effective measure of the machine intelligence quotient. The most important drawbacks of the designed metrics presented in the scientific literature consist in the limitation in universality, accuracy, and robustness. In this paper, we propose a novel universal metric called MetrIntSimil capable of making an accurate and robust symmetric comparison of the similarity in intelligence of any number of cooperative multiagent systems specialized in difficult problem solving. The universality is an important necessary property based on the large variety of designed intelligent systems. MetrIntSimil makes a comparison by taking into consideration the variability in intelligence in the problem solving of the compared cooperative multiagent systems. It allows a classification of the cooperative multiagent systems based on their similarity in intelligence. A cooperative multiagent system has variability in the problem solving intelligence, and it can manifest lower or higher intelligence in different problem solving tasks. More cooperative multiagent systems with similar intelligence can be included in the same class. For the evaluation of the proposed metric, we conducted a case study for more intelligent cooperative multiagent systems composed of simple computing agents applied for solving the Symmetric Travelling Salesman Problem (STSP) that is a class of NP-hard problems. STSP is the problem of finding the shortest Hamiltonian cycle/tour in a weighted undirected graph that does not have loops or multiple edges. The distance between two cities is the same in each opposite direction. Two classes of similar intelligence denoted IntClassA and IntClassB were identified. The experimental results show that the agent belonging to IntClassA intelligence class is less intelligent than the agents that belong to the IntClassB intelligence class.
1. Introduction
Intelligent cooperative multiagent systems (ICMASs) are applied for a large diversity of difficult real-life problem solving tasks [,,,,,]. In cooperative multiagent systems (CMASs), the intelligence could be considered at the system’s level. Much research has [,] proved that, even in cooperative multiagent systems composed of simple agents, an increased intelligence at the systems level could emerge if the member agents cooperate efficiently and flexibly.
In scientific literature, the intelligence estimation is many times based on some intuitive biologically inspired intelligence considerations. There are very few studies related to intelligence measurement, from which few are able also to be applied for accurate and robust symmetric comparison of the intelligence of two or even more multiagent systems. We consider that, similarly to biological systems, there is a variability even in the case of ICMASs. In some situations, a CMAS could behave more intelligently, in others less intelligently. Another aspect consists in treating what we call low and high outlier intelligence values. Sometimes taking into consideration such values could result in an erroneous evaluation and/or comparison result. Another aspect that we consider important consists in the number of compared multiagent systems. If the intelligence of more than two multiagent systems should be compared, an erroneous decision consists in comparing them pairwise. We will further elaborate on this subject in the discussions section.
We have not found in the scientific literature an effective metric that includes all of the considerations previously mentioned, able to simultaneously compare the similarity in intelligence of any number (even more than two) cooperative multiagent systems. With this purpose, we propose a novel metric called MetrIntSimil that is capable of making an accurate and also robust symmetric comparison of the similarity in intelligence of two or more than two cooperative multiagent systems, taking into consideration the variability in the intelligence of the multiagent systems. The Travelling Salesman Problem (TSP) [,,] is a well known NP-hard problem (non-deterministic polynomial-time hardness). NP-hardness, is the defining property of a class of problems that are, “at least as hard as the hardest problems in NP”. Both variants of the TSP the Symmetric TSP (STSP) and the Asymmetric TSP (ATSP) are frequently studied. In order to assess the effectiveness of the proposed metric, we conducted a case study. Three multiagent systems composed of cooperative reactive agents specialized in solving a class of NP-hard problems, the STSP [], were considered. The cooperative multiagent systems operated as a Best-Worst Ant System [,], a Min-Max Ant System [,] and an Ant Colony System [,].
The upcoming part of the paper is organized as follows: Section 2 analyzes the intelligence of cooperative multiagent systems; representative metrics described in the scientific literature proposed for measuring artificial systems intelligence are also presented. In Section 3, our proposed MetrIntSimil metric for intelligence comparison of more cooperative multiagent systems is presented. For validation purposes, in Section 4, a case study was performed. In Section 5, we discussed on the designed MetrIntSimil metric and compared it with a recent metric presented in the literature. Section 6 presents our next research direction. In Section 7, the main conclusions of the research described in this paper are presented.
2. Measuring the Machine Intelligence Quotient
2.1. Intelligent Cooperative Multiagent Systems
Theories and principles of systems science can explain many complicated matters of the world and offer a new vision on many unsettled problems [,]. As a particular scientific domain, it has its own particular methodology for qualitative and quantitative analyses. The motivation for the domain of systems science is the necessity of understanding the systems research with operable mathematical methods as an organic whole. Systems science among others establishes systemic formulas based on a unified systems approach.
Langley, Laird, and Rogers [] examine the motivations for research on cognitive architectures. In the paper, the architecture of cognitive systems described in scientific literature was reviewed. The authors discuss some open issues that should drive research related to the architecture of cognitive systems. They consider the following capabilities that a cognitive architecture should support: organization, performance, learning and some theoretical criteria for making an evaluation at the system level.
In Ref. [], a prototype agent-based geographical information system (GIS) abbreviated as GXGIS is proposed. In the proposal, a developed interface agent interactively assists the users in the query formation processes. It has the capability to offer domain knowledge associated with a given query. Another capability of the agent consists in the recording of a user’s troubleshooting experience and show it to the same user or other users as hints.
We call intelligent agent-based systems the intelligent agents and the intelligent cooperative multiagent systems. The motivation for using this generic name consists in the fact that a cooperative multiagent system from the external point of view could be seen as an individual. Whomever (human or an artificial agent) submits a problem for solving does not know that the problem is solved by an agent or cooperatively by more agents. He/she/it submits the problem to an agent and the problem could be subsequently solved, if necessary, cooperatively by more agents. There is various research worldwide focused on the development of intelligent agent-based systems [,,,].
The agents’ intelligence could not be unanimously defined based on the large diversity of agents []. The intelligence estimation is many times realized based on different considerations like []: autonomous learning, self-adaptation and evolution. These considerations are inspired by biological systems able to learn during their life cycle, to adapt to the environment and to evolve during more generations.
Mobile agents versus static agents are able to move in the environment during the problem solving. Mobile agents could be classified as software mobile agents and robotic mobile agents. The software mobile agents operate in a software environment (a computer, or a computer network); the mobile robotic agents operate in a physical environment (a swarm of mobile robots distributed in a physical environment specialized in collecting objects, for example).
To illustrate the impossibility of the definition of the agents’ intelligence, let us consider the differences in intelligence between static software agents vs. mobile software agents []. Many developed mobile agents are more limited in intelligence than their static counterparts. Limitations in the mobile agents’ endowment with intelligence are based on some practical reasons. The endowment of a mobile agent with intelligence may increase the agent’s body size. The execution of an intelligent mobile agent (more complex software code, more computations) in a software environment requires more computational resources. The transmission of a large number of intelligent mobile agents in a network might overload the network with data transmission. A large number of intelligent mobile agents, which execute complex computations to a host, may overload that host. The mobile agents migrate during their operation in the network, and, based on this fact, it is difficult to estimate where a mobile agent is at a specific moment of time. This limitation makes the endowment of mobile agents with communication capacity difficult. The communication is indispensable for cooperation.
There is no unanimously accepted definition of the cooperative multiagent systems intelligence. This fact is based on the large diversity of cooperative multiagent systems. Many times, in scientific literature, a cooperative multiagent system is considered intelligent, based on the simple consideration that the efficient and flexible cooperation between the agents emerge in intelligence at the systems level. Based on this aspect, in a cooperative multiagent system, the intelligence could be considered at the system’s level [,]. The intelligence in such a system is higher than the individual member agents’ intelligence. Even in a very simple cooperative multiagent system, intelligence at the system’s level could emerge. Efficient and flexible cooperating simple agents could intelligently solve difficult problems.
There is a lot of research [,] focused on the study of decision-making in the frame of cooperative coalitions. Decisions made in the frame of coalitions outperform many times the decisions of individuals that operate in isolation.
Yang, Galis, Guo, and Liu [] present an intelligent mobile multiagent system composed of simple reactive agents. The mobile agents are specialized in a computer network administration. They are endowed with knowledge retained as a set of rules that describe network administration tasks. The multiagent system could be considered intelligent based on the fact that it simulates the behavior of a human network administrator.
In our approach, we will refer to agent-based systems, cooperative multiagent systems composed of two or more agents that cooperatively solve difficult problems. The agent members of such a system are not necessarily intelligent, but, at the level of the system, there is emerging increased intelligence that can be quantitatively measured. The study of aspects related to cooperative multiagent system intelligence is important in order to develop highly efficient problem solving methods.
2.2. Metrics for Measuring the Machine Intelligence
The existence of some properties of the cooperative multiagent systems that could be associated with intelligence does not allow a quantitative evaluation, such properties just prove its existence. In Ref. [], it is considered that the evaluation of a system’s intelligence must be based on some effective metrics that allow the measuring of the quantity of intelligence and comparison of a system’s intelligence with the intelligence of another system. In many papers, some evaluation or analysis of the system’s intelligence are presented. There are very few designed metrics able to make an effective comparison of two or more multiagent systems’ intelligence.
Besold, Hernandez-Orallo, and Schmid [] study the difficult problems for the humans that could be used as benchmark problems for intelligent systems. The authors consider that an intelligent system that can successfully solve difficult problems for humans has some kind of human-level intelligence. The paper analyses and discusses this assumption.
There are some metrics developed for making different kinds of measurements in systems that are considered intelligent. Such metrics are not always developed for measuring the systems’ intelligence as a whole. They are used only for measuring some aspects that represent interest. A fault-tolerant system should be able to diagnose and recover from some faults. The fault-tolerance has a direct impact on the performance of a system. Sometimes, this property of the systems is associated with the intelligence. Kannan and Parker [] analyze the intelligent fault-tolerant systems. They study the effectiveness of some metrics for the evaluation of fault-tolerance in the context of system performance. A main focus of the presented approach is to capture the effect of intelligence (reasoning and learning) on the effective fault-tolerance of a system. The fault-tolerance of different heterogeneous multi-robot teams there were analyzed and compared. The proposed metric is able to make some evaluation of the quality of learning towards system level fault-tolerance.
Park, Kim, and Lim [] analyzed the measuring of machine intelligence of human–machine cooperative systems. They proposed a so-called intelligence task graph as a modeling and analysis tool. The authors consider that a human–machine cooperative system can be modelled as equations.
Schreiner [] presents a study realized by the US National Institute of Standards and Technology (NIST). It accentuates the necessity of developing intelligent systems in the US in different fields such as the industry and military, including public and private sectors. The study is related to creating standard measures for systems that can be considered intelligent. Schreiner accentuates the main studied questions related to how precisely intelligent systems are defined and how to measure and compare the capabilities that intelligent systems should provide. NIST’s initial approach to establishing metrics attempts to address different pragmatic and theoretical aspects.
The paper [] proposes a method called OutIntSys for the detection of the systems, which has a statistically extremely low or extremely high intelligence, from a set of intelligent systems that solves the same type(s) of problems. The proposed method can be applied in choosing the most intelligent systems from a set of intelligent systems able to solve difficult problems.
The Minimum Message Length (MML) principle supports a specific compression as a method to perform inductive inference resulting in intelligence [,,]. Dowe and Hajek [,] proposed an adapted Turing test with some specific compression exercises, having the purpose to measure the ability of inductive inference in the context of MML []. Sterret [] analyzed how IBM developed a question-answering computer (Watson) competes against humans on the Jeopardy game. Watson [] was developed in the frame of the DeepQA project by a research team led by David Ferrucci at “Thomas J. Watson Research Center” located in Yorktown Heights, New York, U.S.
Legg and Hutter defined a formal measure [], presuming that the performance in easy environments counts more toward an agent’s intelligence than does performance in difficult environments. Hibbard [] proposed an alternative measure, which is based on a hierarchy of sets of increasingly difficult environments, considering a reinforcement learning framework. Hibbard considers an agent’s intelligence as the ordinal of the most difficult set of environments that it can pass. The applied measure is defined in Turing machine and finite state machine models of computing. In the finite state machine model, the measure is calculated as the number of time steps necessary to pass the test.
Anthon and Jannett [] define the agent-based systems intelligence based on the ability to compare alternatives with different complexity. In the presented approach, a measure of machine intelligence allows the comparing of alternatives with different complexity. A method for measuring the Machine Intelligence Quotient (MIQ) of the human-cooperative system is adapted and applied to measure the MIQ of an agent-based system. The method is proposed to be applied for agent-based distributed sensor network systems. The proposal was tested by comparing the MIQ in different agent-based scenarios for a distributed sensor network application.
Hernandez-Orallo and Dowe [] proposed the idea of a general test called a universal anytime intelligence test. The authors of the study consider that such a test should be able to measure the intelligence level, which could be in different situations very low (called inept systems) or very high (called brilliant systems), of any biological or artificial system. Such a test should be able to evaluate slowly and quickly operating systems. Another property of such a test consists in the fact that it could be interrupted at any time, this way obtaining an approximation of the intelligence score. Based on this property, if more time is left for a test, then a more accurate result will be obtained. The proposed test is based on some previous works on the measurement of machine intelligence. The considered works were based on Kolmogorov complexity and universal distributions. In the 1990s, the C-tests and compression-enhanced Turing tests were developed. The proposal presented in the paper is also based on the idea of measuring intelligence through dynamic tests. The authors of the research discuss different developed tests by highlighting their limitations. They introduce some novel ideas that they consider necessary for the development of a “universal intelligence test”.
A novel metric called MetrIntMeas for measuring the machine intelligence of a swarm system is presented in the paper []. MetrIntMeas is able to measure the machine intelligence of an evaluated swarm system and compare it with a considered reference machine intelligence value. The metric also makes a classification of the studied swarm system, by verifying if it belongs to the class of swarm systems with the considered reference machine intelligence value. The paper gives a definition to the swarm systems’ evolution in intelligence. It defines the evolution of the swarm systems in the intelligence, as a measurable increase in intelligence by using the MetrIntMeas metric.
Many researchers are focused on the study of collective intelligence of the swarm systems. Many difficult problem solving tasks are based on swarm systems. Winklerova [] assessed the collective intelligence of a particle swarm system according to a proposed Maturity Model. The proposed model is based on the Maturity Model of C2 (Command and Control) operational space and the model of Collaborating Software. The main aim of the study [] was to obtain a more thorough explanation of how the intelligent behavior of the particle swarm emerges. A conclusion of the research is that a swarm system’s effectiveness can be improved by adaptation of the rules that specifies the particle’s behaviour. Each particle should adjust its velocity using some control parameters. The parameters value would be derived from inside of the swarm system.
Ref. [] proposes a novel metric called MetrIntPair for measuring the machine intelligence of cooperative multiagent systems. The MetrIntPair metric is able to exactly analyze the intelligence of two cooperative multiagent systems. It makes an accurate comparison of the intelligence of the two studied cooperative intelligent systems at an application, and at the same time it verifies if they can be included in the same class of intelligence (solve problems with the same intelligence). The intelligence comparison of two cooperative systems is based on some kind of pairwise problem solving intelligence evaluations. This approach has as principal advantage versus the non-pairwise intelligence evaluations the decrease of the number of necessary problem solving experimental intelligence evaluations versus the case when non-pairwise intelligence evaluations are made.
Liu, Shi, and Liu [] present a study related to the analysis of the intelligence quotient and the grade of artificial intelligence. A so-called “standard intelligence model” was proposed. It unifies artificial intelligence and “human characteristics” that include aspects of knowledge like: input, output, mastery, and creation.
Douglas Detterman [] announced a challenge related to the Artificial Intelligence artefact measuring by classical IQ tests. Sanghi and Dowe [] in 2003 presented a computer program tested on some standard human IQ tests. The program was smaller than the chess-playing Deep Blue [], having just about 960 lines of code written in the Perl programming language. It surpassed the average human intelligence score by 100 on some tests [].
In this subsection, we presented some relevant metrics for measuring machine intelligence. Each of the proposed metrics is based on a specific method of measuring the intelligence, appreciating the intelligence measure based on some specific principles/definition of the intelligence. Different definitions of the intelligence and different associated measuring approaches do not allow a punctual comparison of the metrics (many of them do not allow even any considerable comparison). There is no standardization or even a relatively generally acceptable view on what an intelligence metric should measure. Based on this consideration, the design of novel universal metrics that could standardize the intelligence measuring is an open and important research direction.
In our opinion, the most feasible consideration of measuring the machine intelligence consists in the principle of difficult problem solving ability. The purpose of the design of intelligent systems consists in the efficient solving of difficult problems. We consider that the main purpose of an intelligence metric consists in the differentiation of the computing systems based on the problem solving intelligence. The universal MetrIntComp metric [] presented in the literature is able to make a robust comparison of two cooperative multiagent system’s intelligence, and classify them in intelligence classes. MetrIntComp is effective even in the case of small differences in intelligence between the compared intelligent systems. For proving the effectiveness of the metric, a case study for two cooperative multiagent systems was presented []. MetrIntComp has as disadvantages related to the reduced accuracy and the limitation in the application for intelligence comparison to more than two intelligent systems at the same time. We will discuss this subject with more details in the Discussion section. Based on these limitations, the design of a novel metric that eliminates these limitations is important and actual.
3. Description of the MetrIntSimil Metric
In this section, we present a novel universal metric proposed for the accurate and robust symmetric comparison of the similarity in intelligence of two or more than two CMASs specialized in difficult problem solving. The MetrIntSimil metric is described as an algorithm called from now on Multiagent Systems Intelligence Comparison. Henceforth, we consider a set of cooperative multiagent systems denoted as . represents the number of compared multiagent systems. The obtained intelligence indicators as a result of problem solving intelligence measuring are denoted as = …, , = , …, = , . represents the cardinality/sample size of . Table 1 presents the obtained intelligence indicator results for . —represents the measured intelligence of the ; —represents the measured intelligence of the ; …; —represents the measured intelligences of the .

Table 1.
Symmetric experimental evaluation of , and intelligence.
An intelligence indicator should make a quantitative indication of a system’s intelligence. In the case of a particular set of cooperative multiagent systems, the researcher who wishes to compare the intelligence of more multiagent systems should decide on the most appropriate intelligence indicator. Our metric, presented in the form of the MetrIntSimil algorithm, is appropriate for multiagent systems, where the problem solving intelligence indicator of each system can be expressed as a single value. If necessary, in the case of a multiagent system, this value can be calculated as the weighted sum of some other values that measure different aspects of the system intelligence Equation (1):
Equation (1) indicates the general case when the intelligence indicator is calculated as the weighted sum of r intelligence components measure, where: denote the intelligence components measure, which are obtained as a result of a problem solving intelligence evaluation; and denote the intelligence components weights. For illustrative purposes, we present the scenario of an intelligent cooperative multiagent system composed of flying drones (drones with agent properties) denoted CoopIntDrones. The drones should cooperatively perform different missions established by a human specialist(s) denoted HE. Based on the efficient cooperative solving of difficult problems, the intelligence can be considered at the system’s level. The intelligence of such a system cannot be unanimously defined. The human specialist(s) who would like to measure the CoopIntDrones intelligence must clarify what he/she understands by intelligence, establish the corresponding problem solving intelligence indicator, and the intelligence components based on that should generate the intelligence indicator. HE could consider, for example, the machine intelligence based on the intelligence of fulfilling the mission and the ability to learn. CoopIntDrones can learn new data/information/knowledge that could increase the efficiency of cooperation and improve the fulfilling of future missions. As intelligence components, the following could be considered: the necessary time for the fulfilling of the mission; the mission fulfilling accuracy; quantity of new data/information/knowledge learnt at the system’s level; quantity of measurable improvement in cooperation efficiency by learning; degree of autonomy in the fulfilling of the mission (counting the number of times for which the remote intervention of human specialists was necessary) and some others.
represent the central intelligence indicators of the . We considered the central intelligence indicators of as the means or the medians of the . The decision for opting as central intelligence indicator for the mean is in the parametric case (all the intelligence indicator data sampled from Gaussian population with equal Variance and Standard Deviation(SD); Variance=SD) or the median in the nonparametric case (not all the intelligence indicator data sampled from Gaussian population or all the intelligence indicator data sampled from Gaussian population, but not all the intelligence indicator data variances are equal).
Figure 1 presents the flowchart of the main processing steps performed by the MetrIntSimil metric. The MetrIntSimil algorithm described in detail in Figure 2 compares the intelligence of on some testing problems sets. It checks if the results (more concretely, the central intelligence indicators) are similar or different from a statistical point of view. We call in the following, Null Hypothesis denoted as H0, the statement that intelligence are similar from the statistical point of view. We denote by H1 the Alternative Hypothesis, which indicates that the intelligence of is different from the statistical point of view.
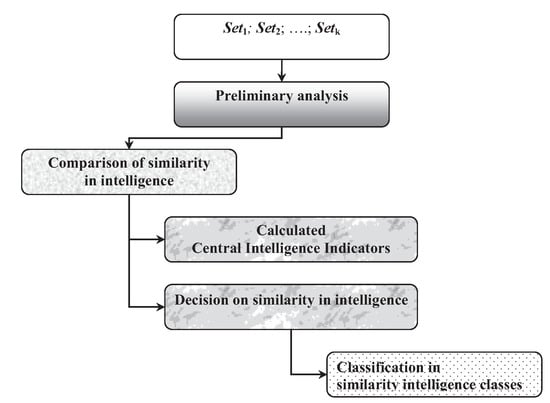
Figure 1.
The flowchart of the processing performed by the MetrIntSimil metric.
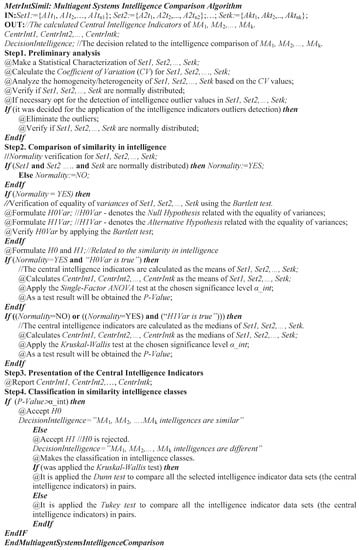
Figure 2.
The proposed MetrIntSimil metric.
The MetrIntSimil metric uses as input = ; ; …; = that represents the intelligence indicators obtained during the intelligence evaluation in solving some sets of test problems.
For the normality verification, we propose the One-Sample Kolmogorov–Smirnov Goodness-of-Fit test [,,] and the Lilliefors test [,,] that is based on the Kolmogorov–Smirnov test. For the verification of equality of variances of two samples, the F test [] can be used. For the verification of equality of variances of more than two samples, we propose the use of the Bartlett test [,].
We propose in some cases the use of a method for the elimination of outlier intelligence indicator values. We call outlier intelligence indicator value, a very high or very low intelligence value, different from those other intelligence indicator values. The difference of an intelligence indicator value from others should be considered from the statistical point of view. Based on this fact, we consider appropriate the application of statistical tests for outlier intelligence values detection. There are many tests for statistical outliers’ detection described in scientific literature, like: Chauvenet’s criterion [,], Peirce’s criterion [], Dixon’s Q test [] and Grubbs test [].
We chose the Grubbs test for outliers’ detection and decided to apply the significance level = 0.05. At first application, the Grubbs test is able to detect a single outlier (if there is at least one outlier). If a value is identified as an outlier, then it can be concluded that this is the most statistically different value from those other measured intelligence indicator values. If an outlier is identified, then a decision of whether the outliers’ detection test should be applied again may be considered. This is a recursive process, and the detection method could be applied consecutively more times until there are no other outliers identified.
If sample intelligence data does not follow a Gaussian distribution, then one can opt for the application of a transformation. Some of the most common normalizing transformations are indicated in Table 2 [].
Table 2.
Examples of transformation that can be applied in order to obtain normally distributed data.
For the effective comparison of intelligence of the multiagent systems, the parametric Single-Factor ANOVA test [] or the nonparametric Kruskal–Wallis test [] should be applied. In case of choosing each of them, the (the significance levels at which the statistical test is applied) value should be established. We suggest as the value of , = 0.05, which we consider as the most appropriate. denotes the probability to make a Type I error, to reject H0 (Null Hypothesis) when it is true. A Type I error means detecting an effect that is not present.
In the proposed metric algorithm, if p-value (p-value obtained by applying the Single-Factor ANOVA test or the Kruskal–Wallis test), then it can be decided that H0 could be accepted. The conclusion states that even if there is a numerical difference between the calculated central intelligence indicators , there is no statistical difference between the intelligence of the studied k multiagent systems. The numerical difference is the result of the variability in the intelligence of the multiagent systems. In this situation, from the classification point of view, all of the multiagent systems can be classified in the same class composed of systems with similar intelligence.
If H1 is accepted (as result of H0 rejection), then the intelligence level of is different. The numerical difference between the central intelligence indicators is statistically significant and is not the consequence of the variability. From the classification point of view cannot be classified in the same class composed of systems with similar intelligence. If is accepted, then the Dunn test [] or Tukey test [,] should be applied, which allow the classification in intelligence classes of all the studied CMASs. More concretely, these tests make a statistical comparison between the central intelligence indicators, the mean in parametric case or the median in the nonparametric case.
Tukey test [,] is a single-step parametric multiple pairwise comparison method. Tukey test can be used as a post hoc analysis following the rejection of Single-Factor ANOVA test null hypothesis.
Dunn’s test [] is a non-parametric multiple pairwise comparisons method. Dunn’s test is based on rank sums. It is used as a post hoc method following rejection of a Kruskal–Wallis test null hypothesis. In the case study presented in a further section based on the non-parametric data, the Dunn test is applied.
4. Measuring the Intelligence of More CMASs—A Case Study on Solving the Symmetric TSP
4.1. Symmetric Travelling Salesman Problem Solving
The TSP has many applications, such as logistics, planning, and the manufacture of microchips. A sub-problem in DNA sequencing is represented as a slightly modified version of the TSP []. The concept city represents DNA fragments, and the concept distance represents a similarity measure between DNA fragments. Ref. [] analyses the computational recognition of RNA Splice Sites described as a modified TSP a Quadratic Traveling Salesman Problem by some exact algorithms. Ref. [] presents an evolution based biosensor receptor DNA Sequence generation algorithm. The TSP approach is applied in the proposed algorithm to evaluate the safety and fitness of the generated DNA sequences.
The Travelling Purchaser Problem (TPP) and the Vehicle Routing Problem (VRP) are both NP-hard problems that represent generalizations of TSP. Since TSP is NP-hard, TPP and VRP are also NP-hard. The TPP can be enounced as follows “Given a list of marketplaces, the cost of travelling between different marketplaces, and a list of available goods together with the price of each such good at each marketplace, the task is to find, for a given list of articles, the route with the minimum combined cost of purchases and traveling” []. The VRP can be enounced as follows “What is the optimal set of routes for a fleet of vehicles to traverse in order to deliver to a given set of customers?” [].
Both variants of the TSP, the Asymmetric TSP (ATSP) and the Symmetric TSP (STSP) are frequently studied. The ATSP characterizes the situation when edges may not exist in both directions or the distances might be different; a directed graph is formed. Traffic collisions, one-way streets, are examples of situations when the symmetry property is not satisfied. Dantzig et al. [] formulated the asymmetric traveling salesman problem as a 0–1 linear program on a graph (V,E). Their formulation for the symmetric case gives rise to the standard subtour elimination polytope SEP(n).
The STSP [] is the problem of finding the shortest Hamiltonian cycle/tour in a weighted undirected graph (the distance between two cities is the same in each opposite direction) that does not have loops or multiple edges. Many practical combinatorial optimization problems in production management and scheduling can be formulated as equivalent to the STSP. The symmetry property is useful based on the fact that it halves the number of possible solutions. There are many studies and research performed on the STSP [,,]. Ref. [] proposes a transforming of asymmetric into symmetric TSP.
Ref. [] proposes an alternate formulation of the symmetric traveling salesman problem and presents its properties. The polytope defined by this formulation, U(n), is compared with the standard subtour elimination polytope SEP(n). It is proved that U(n) ⊆ SEP(n).
Ref. [] proposes a novel lower bounding and reduction procedures for the STSP. In the proposal, the lower bounds are obtained through the solution of the linear program corresponding to the 2-matching relaxation, being improved through a restricted Lagrangean 2-matching approach. It presents a comparison of the new bounds with bounds obtained with the well-known Lagrangean 1-tree relaxation.
4.2. CMASs That Operate by Mimicking Biological Ants
The ability of biological ants to determine shortest paths to food was studied in many research papers [,,]. An individual ant possesses few capabilities, but, when operating in swarms/colonies, the ants are capable of having a complex surviving behavior. Biological ants communicate by pheromones, which allow the finding of the shortest path between food sources and their nests. All ants deposit pheromones on the trail while walking. Each ant follows the pheromone trail that it meets with some probability, and which is proportional to the density of the pheromone. The more ants walk on a trail, the more pheromone is deposited on it, and the more and more ants follow that trail. Based on this collaboration mechanism, there is a very high probability for the ants to find a very short path (shortest path or close to it).
For proving the effectiveness of the designed MetrIntSimil metric, we conducted a case study. The Symmetric Travelling Salesman Problem solved by three CMASs formed by autonomous mobile agents that mimic biological ants was considered. We understand by mobile agents simple computing embedded agents able to move in the environment during the problem solving. The communication between the agents is carried out by signs and it is similar to the communication of the biological ants by using pheromones. This type of communication allows an efficient, flexible and robust cooperative problem solving even in CMASs composed of a large number of individuals. There are many studies conducted on systems composed of artificial ants and their applications for different problem solving [,].
Marco Dorigo in his Ph.D. thesis [,] proposed first the problem solving based on simple computing agents that mimic the operation of biological ants. Artificial ants (operating as reactive agents known in the intelligent agent literature) imitate the behavior of biological ants on how they search for food. As a general idea, in an Ant System, initially, each agent is placed on a randomly chosen city (node of the graph). An agent k currently at node i chooses to move to node j by applying the following probabilistic transition rule Equation (2). After each agent completes its tour, the pheromone amount on each path will be adjusted according to Equations (3)–(5):
In Formulas (2)–(5), the following notations are used: and are adjustable parameters. and control the relative weights of the heuristic visibility and the pheromone trail. In the parameters establishment, a trade-off between edge length and pheromone intensity appears to be necessary. Q denotes an arbitrary constant. represents the distance between the nodes (k and h); the heuristic visibility of edge . 1- is the pheromone decay parameter, , and it represents the trail evaporation when the agent chooses a node where it decides to move. m denotes the number of agents, and denotes the length of the tour performed by agent k.
4.3. The Experimental Setup
For the validation of the proposed metric, we carried out experimental evaluations for different sets of cooperative multiagent systems. We experimented: Ant System, Elitist Ant System, Ranked Ant System, Best-Worst Ant System, Min-Max Ant System and Ant Colony System. Finally, we decided to present the validation for three cooperative multiagent systems between which the central intelligence indicator value does not have a high difference. In the experiment that we present in the following, we considered three cooperative multiagent systems denoted as , and , which operated as a Best-Worst Ant System [,] the ; a Min-Max Ant System [,] the and Ant Colony System [,] the . All of them were applied for the Symmetric Travelling Salesman Problem solving. STSP is a well known NP-hard problem []. In each multiagent system, the agents cooperated in order to efficiently solve the undertaken problems by the multiagent system. =. = k = 3.
In the experimental setup, for all the analyzed multiagent systems, we considered maps with = 35 randomly placed cities on the map. All the studied multiagent systems were composed of m = 10 cooperative reactive agents. As parameters, all the cooperative multiagent systems were considered: = 1000; (power of the pheromone); (power of the distance/edge weight); (the evaporation factor). We choose as parameter values (experimentally established): = 1; = 1 and = 0.1. Table 3 presents the obtained simulation results. In the simulations, the obtained best to date travel value from the end of the problem solving was considered for the case of all multiagent systems as the intelligence indicator.
Table 3.
The obtained Intelligence Indicators for , and .
Table 4 presents the obtained results by analyzing , , and . In the table, the following notations were used: SEM denotes the standard error of the mean; [LCI95%, UCI95%] denotes the 95% confidence interval of the mean; Lowest denotes the smallest; Highest denotes the utmost; K-S Stat denotes the Kolmogorov–Smirnov test statistic; Lill Stat denotes the Lillefors test statistic. The normality was verified by using the One-Sample Kolmogorov–Smirnov Goodness-of-Fit test and Lilliefors test, applied at = 0.05 significance level. It can be noticed that the does not pass the normality test. In order to obtain normally distributed data on , we applied the Grubbs test with = 0.05. The Grubbs test identified the value 7.278 as a single outlier. It was identified at the first application of the test. When applying the test again, no outlier was detected. We calculated .
Table 4.
Results of the intelligence indicator sample data analysis.
The last column of Table 4 presents the analysis results for *. Now, the * passed the normality test. For the verification of the equality of standard deviations of , , and *, we applied the Bartlett test at the = 0.05 significance level. The obtained p-value (p-value of Bartlett’s test) was p-value = 0.0002 (p-value ), which suggested that the difference between the standard deviations of , , and * is very significant. Another calculation detail was the obtained Bartlett statistics value 17.225.
Figure 3 contains the graphical representation of intelligence indicators, , , and , with all the intelligence indicator data included. As an observation, we mention that the data was not paired. We understand by pairing the fact that the experimental intelligence evaluation number 1 for , and was not carried out for the same problems. The experimental intelligence evaluation number 2 for , and was not carried out for the same problem. The lines represented in Figure 3 illustrate the intelligence variation in problem solving. The MetrIntSimil metric algorithm does not restrict the number of intelligence evaluations for all of the multiagent systems to be the same. In our experimental setup, there were = 48, = 50 and = 45 considered experimental evaluations of the intelligence. Figure 4 is similar to content of Figure 3, but it contains the graphical representation of the obtained intelligence indicators data with the outlier intelligence values excluded.
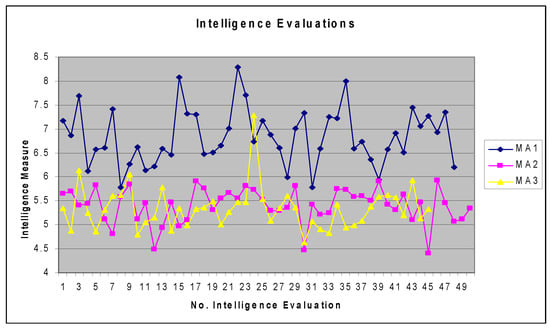
Figure 3.
Graphical representation of the intelligence indicators of , , and .
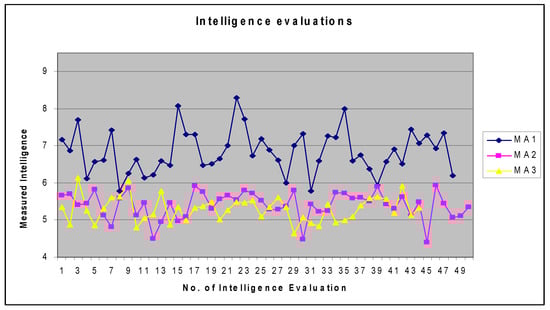
Figure 4.
Graphical representation of the intelligence indicators of , , and with the outliers excluded.
The Coefficient of Variation (CV) of a sample intelligence indicator data should be calculated using formula 6. In formula 6, the SD/Mean is multiplied by 100 for obtaining the result in percentages. For example, SD/Mean = 0.3 multiplied by 100 gives 30. We used the CV value for analyzing the homogeneity–heterogeneity of the intelligence indicator data [,]. We consider the data classification based on the variability as follows. A classification of the homogeneity–heterogeneity of the data can be carried out based on the . indicates homogeneous data; , indicates relatively homogeneous data; , indicates heterogeneous data:
Based on the obtained results, all the samples , and * were normally distributed, but having different variances; the algorithm indicated the application of the nonparametric Kruskal–Wallis test with = 0.05. p-value ≈ 0.0001, obtained as a result of the Kruskal–Wallis test, p-value . Based on this result, it should be concluded that H0 cannot be accepted. The intelligence level of all the studied multiagent systems , , cannot be considered to be the same. From the classification point of view, the multiagent systems cannot be classified in the same intelligence class.
According to the MetrIntSimil algorithm, as a next step, we applied the Dunn test [] for all the pairs of , , *, with significance level . The obtained results, presented in Table 5, prove that and can be included in the same class of systems with similar intelligence denoted in the following . should be included in a separate class of systems with similar intelligence denoted . The multiagent systems that belongs to has a higher intelligence than the multiagent system that belongs to the intelligence class. As an intelligence indicator in our study, we have considered the global-best, this having the significance that a lower value indicates higher intelligence. For example, the global-best by 4.868 is better than 8.084.
Table 5.
Results of the Dunn test for paired intelligence comparison.
The obtained results prove (Table 5, the comparison result of vs. ) that and can be included in the same similarity class of intelligence, denoted in the following by . As another proof of this fact, the metric algorithm can be applied again just for the characterized by the of intelligence indicators and characterized by the * of intelligence indicators. Table 4 presents the fact that the normality test for and * was passed. For the verification of the equality of variances of and *, we applied the F-test at significance level . The result of the F-test is p-value = 0.63. p-value > , which indicates that the difference between the variances of and * is not statistically significant. Based on these considerations, the application of the Single-Factor ANOVA test at significance level = 0.05 can be considered. The obtained result was p-value = 0.1341. p-value, sustaining the conclusion that the two multiagent and can be included in the same similarity intelligence class.
5. Discussion and Comparison of the MetrIntSimil Metric
In our research, we considered the difficult problem solving intelligence measuring at the level of the whole cooperative multiagent system, not at the individual/agent level. Our metric, presented in the form of the algorithm MetrIntSimil, is appropriate for multiagent systems, where the intelligence indicator of a problem solving by a multiagent system can be expressed as a single value. If necessary, this value can be calculated as the weighted sum of some values of more intelligent components that measure different aspects of the system intelligence.
An intelligence indicator should make a quantitative indication of a system intelligence in solving a difficult problem. The researcher who wishes to make a comparison of the intelligence of two or more multiagent systems should decide on the type of intelligence indicator. For all the compared multiagent systems, the type of intelligence indicator should be the same. We consider that an effective metric must be able to measure the same type of intelligence. As an example, in the case of biological systems, it makes no sense to compare the intelligence of a fish with the intelligence of a bird.
The elaborated metric takes into consideration the variability in the intelligence of the compared multiagent systems. A multiagent system could have different intelligent reactions in different situations. In a specific situation, the reaction could be more or less intelligent. In our research, we considered the presence of high and low outlier intelligence values, which are statistically very different from all other intelligence values. If such outlier values are taken into consideration, this could influence the comparison result of more multiagent systems’ intelligence.
In our research, we considered the necessity of the establishment of a central intelligence indicator of a CMAS, which illustrates the central intelligence tendency of the multiagent system. We considered as possible central intelligence indicators, and the calculation as the means of intelligence indicators sample data in the parametric case (all , , …, are sampled from a Gaussian population and their variance is equal from statistical point of view) and as the medians in the nonparametric case (not all the intelligence indicators data are sampled from Gaussian population or all the intelligence indicator data sampled from Gaussian population, but they have different variances). The median is more robust than the mean, a higher or lower value influences more the mean than the median.
We did not find in the scientific literature an effective metric based on difficult problem solving intelligence measuring that has all the properties of MetrIntSimil metric, such as: allowing the simultaneous intelligence comparison of two or more than two multiagent systems; and accuracy and robustness in comparison and universality at the same time.
MetrIntComp metric [] presented in the scientific literature is able to make a comparison of two cooperative multiagent systems’ intelligence. The MetrIntComp metric is based on a similar principle of difficult problem solving intelligence measuring as the MetrIntSimil metric. The MetrIntComp metric uses difficult problem solving intelligence evaluation data, based on which it makes a mathematically grounded comparison of exactly two cooperative multiagent systems intelligence. This allows the classification of the compared systems in intelligence classes (classification in the same class or in different classes). The main advantage of the MetrIntComp metric is the robustness. The robustness is assured by the fact that in the metric algorithm for the obtained intelligence indicator data comparison, the two unpaired samples Mann–Whitney test is used that is known as a nonparametric robust test [,]. It does not require data normality (that the samples belong to a Gaussian distribution).
MetrIntSimil based on the obtained intelligence indicators makes a mathematically grounded analysis. At a specific step of the MetrIntSimil metric algorithm based on some analysis, it chooses between the application of the parametric Single-Factor ANOVA test [] and nonparametric Kruskal–Wallis test []. Based on this fact, the MetrIntSimil metric is accurate and robust at the same time. MetrIntSimil conserves and extends the properties and advantages of the MetrIntComp metric. In the case of normally distributed intelligence indicator data with same variances, MetrIntSimil is able to apply a parametric test that is the most appropriate. Another advantage consists in the necessary sample size of intelligence indicators. If a parametric test could be applied, then the required sample size should be smaller than in the nonparametric case.
The Mann–Whitney test for two unpaired samples is the non-parametric analog to the two-sample unpaired t-test. It uses a different test statistic comparatively with the Kruskal–Wallis test (U instead of the H of the Kruskal–Wallis test), but the p-value is mathematically identical to that of a Kruskal–Wallis test [,].
Comparatively with the MetrIntComp metric, the MetrIntSimil metric is able to make a simultaneous comparison of more than two multiagent systems, with the established significance level (the probability of making a Type I error is ). MetrIntComp could be used for the comparison of more that two cooperative multiagent systems, pair-by-pair, but this approach is not appropriate. The probability of making a Type I error increases as the number of tests increase. If the significance level is set at , the probability of a Type I error can be obtained, regardless of the number of groups being compared. For example, if the probability of a Type I error for the analysis is set at = 0.05 and six two-sample tests (t-test for example) are performed, the overall probability of a Type I error for the set of tests = 1− = 0.265.
In the scientific literature, there is no universal view on what intelligence metrics should measure. Each of the designed metrics consider the machine intelligence based on different principles. Based on this fact, most of them cannot be effectively compared directly with each other. For comparison reasons, we chose a recent intelligence metric called MetrIntComp [], which made possible the comparison and this opens a research direction to standardization of the intelligence metrics. Table 6 summarises the comparison results.
Table 6.
Comparison of the MetrIntSimil metric with the MetrIntComp metric.
A case study was realized for the experimental evaluation of the MetrIntComp metric proposed in the paper []. It measured and compared the intelligence of two cooperative multiagent systems in solving an NP-hard problem, the Symmetric TSP more concretely. We used the intelligence indicators reported in the paper [] and applied on them the MetrIntSimil metric. The same result was obtained for MetrIntSimil as was obtained by applying the MetrIntComp metric. Both of the metrics made a differentiation in intelligence between the two studied cooperative multiagent systems, even if the numerical difference between the measured intelligence was small. Based on this fact, the two multiagent systems could not be considered to belong to the same class of intelligence and should be classified in different classes of intelligence.
6. Theory of Multiple Intelligences in Machines: The Next Research Works
Humans can solve more or less intelligent problems that require different types of thinking []: musical-rhythmic, visual-spatial, verbal-linguistic, logical-mathematical, bodily-kinesthetic, interpersonal, intrapersonal and naturalistic. The theory of multiple intelligences proposed by Howard Gardner differentiates intelligence into specific modalities [,]. According to the theory of multiple intelligences, the intelligence is not dominated by a single general ability.
In the next research work, we will focus on the development of a theory of multiple intelligences in machines. Our preliminary conclusion is that such a theory should not be designed based on similarity with the theory of multiple intelligences in humans. The human intelligence and the artificial intelligence are not similar. They are of a completely different type. Life on earth is the result of an evolution by 0.5 billion years []. We consider that different types of problem solving by intelligent systems require different types of machine intelligence. In this framework, we consider an important particular research direction: the automatic detection of different types of intelligence that an intelligent artificial system possesses.
With illustrative purpose, we mention the scenario of next-generation flying agent-based drones (flying drones with properties of intelligent agents) able to transport passengers. Such developments certainly will be built in the future. Such an intelligent drone must detain different types of intelligence specific to different types of problems and sub-problems. We consider that, in such a scenario, the clear definition of similarity between drones is necessary. Drones could be specialized: in transporting very few passengers, and in transporting a large number of passengers. As examples of types of intelligence that a drone can possess, it can be noticed: intelligence in communication with the passengers; intelligence in communication and cooperation with other similar flying drones; intelligence in communication and cooperation with other non-similar flying drones; intelligence to fly in difficult weather conditions; and intelligence in avoiding different objects during the flight and some others. The intelligence measure has the sense to be compared to similar drones. Based on a specific type of intelligence, a flying drone could be more intelligent than another similar flying drone. For another type of problem, the situation could be the vice versa. For example, the flying drone SimFDA could be more intelligent in the communication with the passengers than the flying drone SimFDB. In the avoiding of the objects during the flight, SimFDB could be more intelligent than SimFDA.
7. Conclusions
Intelligent cooperative multiagent systems (CMASs) by a large diversity are used for many real life problem solving tasks. There are very few metrics designed for the quantitative evaluation of CMASs intelligence. There are even fewer metrics that allow also an effective quantitative comparison of the intelligence level of more multiagent systems. In this paper, we proposed a novel metric called MetrIntSimil that allows an accurate and robust symmetric comparison of the similarity in intelligence of two or more than two CMASs. The proposed metric efficiently takes into account the variability in the intelligence of the compared CMASs.
For validation purposes of the MetrIntSimil metric, we conducted a case study for three cooperative multiagent systems, that operated by mimicking a Best-Worst Ant System [,], that operated by mimicking an Min-Max Ant System [,] and that operated by mimicking an Ant Colony System [,]. The evaluation was carried out for solving a NP-hard problem, the Symmetric Traveling Salesman Problem []. The proposed metric identified that two of the multiagent systems and have similar intelligence level, and, based on that, they can be classified in the same similarity class of intelligence denoted . The multiagent intelligence is different from the other two multiagent systems intelligence, and, based on that, it should be considered that it belongs to another intelligence class that we denoted by . Another conclusion consists in the fact that the multiagent systems belonging to have a higher intelligence level than those that belong to .
The universal MetrIntSimil metric is not dependent on aspects/details like the studied/compared cooperative multiagent systems’ architecture. It could be applied even to comparison of similarity in intelligence of systems that operate individually without cooperating. Based on a comprehensive study of the scientific literature, we consider that our proposed metric is original and will represent the basis for intelligence measuring and comparison of systems intelligence in many future research works worldwide.
Acknowledgments
Matthias Dehmer thanks the Austrian Science Funds for supporting this work, P 30031.
Author Contributions
Laszlo Barna Iantovics, Matthias Dehmer and Frank Emmert-Streib designed the proposed intelligence metric; Laszlo Barna Iantovics, Matthias Dehmer and Frank Emmert-Streib conceived and designed the experiments; Laszlo Barna Iantovics performed the experiments; Laszlo Barna Iantovics, Matthias Dehmer and Frank Emmert-Streib analyzed the data; Laszlo Barna Iantovics, Matthias Dehmer and Frank Emmert-Streib contributed analysis tools; Laszlo Barna Iantovics, Matthias Dehmer and Frank Emmert-Streib wrote the paper.
Conflicts of Interest
The authors declare no conflict of interest.
References
- Guillaud, A.; Troadec, H.; Benzinou, A.; Bihan, J.L.; Rodin, V. Multiagent System for Edge Detection and Continuity Perception on Fish Otolith Images. EURASIP J. Appl. Signal Process. 2002, 7, 746–753. [Google Scholar] [CrossRef]
- Iantovics, L.B. A New Intelligent Mobile Multiagent System. In Proceedings of the IEEE-SOFA 2005, Szeged, Hungary and Arad, Romania, 27–30 August 2005; pp. 153–159. [Google Scholar]
- Iantovics, L.B.; Zamfirescu, C.B. ERMS: An Evolutionary Reorganizing Multiagent System. Innov. Comput. Inf. Control 2013, 9, 1171–1188. [Google Scholar]
- Stoean, C.; Stoean, R. Support Vector Machines and Evolutionary Algorithms for Classification; Intelligent Systems Reference Library; Springer International Publishing: Cham, Switzerland, 2014; Volume 69, pp. 570–573. [Google Scholar]
- Chen, M.H.; Wang, L.; Sun, S.W.; Wang, J.; Xia, C.Y. Evolution of cooperation in the spatial public goods game with adaptive reputation assortment. Phys. Lett. A 2016, 380, 40–47. [Google Scholar] [CrossRef]
- Wang, C.; Wang, L.; Wang, J.; Sun, S.; Xia, C. Inferring the reputation enhances the cooperation in the public goods game on interdependent lattices. Appl. Math. Comput. 2017, 293, 18–29. [Google Scholar] [CrossRef]
- Yang, K.; Galis, A.; Guo, X.; Liu, D. Rule-Driven Mobile Intelligent Agents for Real-Time Configuration of IP Networks. In International Conference on Knowledge-Based Intelligent Information and Engineering Systems; Palade, V., Howlett, R.J., Jain, L., Eds.; Springer: Berlin/Heidelberg, Germany, 2003; Volume 2773, pp. 921–928. [Google Scholar]
- Van Jan, L. (Ed.) Algorithms and Complexity. In Handbook of Theoretical Computer Science; Elsevier: Amsterdam, The Netherlands, 1998; Volume A. [Google Scholar]
- Crisan, G.C.; Nechita, E.; Palade, V. On the Effect of Adding Nodes to TSP Instances: An Empirical Analysis. In Advances in Combining Intelligent Methods; Hatzilygeroudis, I., Palade, V., Prentzas, J., Eds.; Springer: Berlin/Heidelberg, Germany, 2016; Volume 116, pp. 25–45. [Google Scholar]
- Karp, R.M. Reducibility among Combinatorial Problems. In Complexity of Computer Computations; Miller, R.E., Thatcher, J.W., Eds.; Plenum Press: New York, NY, USA, 1972; pp. 85–103. [Google Scholar]
- Grotschel, M.; Padberg, M.W. On the Symmetric Travelling Salesman Problem: Theory and Computation. In Optimization and Operations Research; Henn, R., Korte, B., Oettli, W., Eds.; Springer: Berlin/Heidelberg, Germany, 1978; Volume 157. [Google Scholar]
- Zhang, Y.; Wang, H.; Zhang, Y.; Chen, Y. Best-Worst Ant System. In Proceedings of the 3rd International Conference on Advanced Computer Control (ICACC), Harbin, China, 18–20 January 2011; pp. 392–395. [Google Scholar]
- Cordon, O.; de Viana, I.F.; Herrera, F. Analysis of the Best-Worst Ant System and Its Variants on the QAP. In International Workshop on Ant Algorithms; Dorigo, M., Di Caro, G., Sampels, M., Eds.; Springer: Berlin/Heidelberg, Germany, 2002; Volume 2463. [Google Scholar]
- Prakasam, A.; Savarimuthu, N. Metaheuristic algorithms and probabilistic behaviour: A comprehensive analysis of Ant Colony Optimization and its variants. Artif. Intell. Rev. 2016, 45, 97–130. [Google Scholar] [CrossRef]
- Stutzlem, T.; Hoos, H.H. Max-Min Ant System. Future Gener. Comput. Syst. 2000, 16, 889–914. [Google Scholar] [CrossRef]
- Colorni, A.; Dorigo, M.; Maniezzo, V. Distributed Optimization by Ant Colonies. In Actes de la Premiere Conference Europeenne sur la vie Artificielle; Elsevier: Paris, France, 1991; pp. 134–142. [Google Scholar]
- Dorigo, M. Optimization, Learning and Natural Algorithms. Ph.D. Thesis, Politecnico di Milano, Milan, Italy, 1992. [Google Scholar]
- Lin, Y.; Duan, X.; Zhao, C.; Xu, L. Systems Science Methodological Approaches; CRC Press: Boca Raton, FL, USA, 2012. [Google Scholar]
- Xu, L. The Contribution of Systems Science to Information Systems Research. Syst. Res. Behav. Sci. 2000, 17, 105–116. [Google Scholar] [CrossRef]
- Langley, P.; Laird, J.E.; Rogers, S. Cognitive architectures: Research issues and challenges. Cogn. Syst. Res. 2009, 10, 141–160. [Google Scholar] [CrossRef]
- Tang, C.; Xu, L.; Feng, S. An Agent-Based Geographical Information System. Knowl. Based Syst. 2001, 14, 233–242. [Google Scholar] [CrossRef]
- Dreżewski, R.; Doroz, K. An Agent-Based Co-Evolutionary Multi-Objective Algorithm for Portfolio Optimization. Symmetry 2017, 9, 168. [Google Scholar] [CrossRef]
- Wang, D.; Ren, H.; Shao, F. Distributed Newton Methods for Strictly Convex Consensus Optimization Problems in Multi-Agent Networks. Symmetry 2017, 9, 163. [Google Scholar] [CrossRef]
- West, D.; Dellana, S. Diversity of ability and cognitive style for group decision processes. Inf. Sci. 2009, 179, 542–558. [Google Scholar] [CrossRef]
- Zamfirescu, C.B.; Duta, L.; Iantovics, L.B. On investigating the cognitive complexity of designing the group decision process. Stud. Inform. Control 2010, 19, 263–270. [Google Scholar] [CrossRef]
- Iantovics, L.B.; Rotar, C. A Novel Metric for Comparing the Intelligence of Two Swarm Multiagent Systems. J. Artif. Intell. 2016, 9, 39–44. [Google Scholar] [CrossRef]
- Besold, T.; Hernández-Orallo, J.; Schmid, U. Can Machine Intelligence be Measured in the Same Way as Human intelligence? Künstl. Intell. 2015, 29, 291–297. [Google Scholar] [CrossRef]
- Kannan, B.; Parker, L.E. Metrics for quantifying system performance in intelligent, fault-tolerant multi-robot teams. In Proceedings of the 2007 IEEE/RSJ International Conference on Intelligent Robots and Systems, San Diego, CA, USA, 29 October–2 November 2007; pp. 951–958. [Google Scholar]
- Park, H.J.; Kim, B.K.; Lim, K.Y. Measuring the machine intelligence quotient (MIQ) of human-machine cooperative systems. IEEE Trans. Syst. Man Cybern. Part A Syst. Hum. 2001, 31, 89–96. [Google Scholar] [CrossRef]
- Schreiner, K. Measuring IS: Toward a US standard. IEEE Intell. Syst. Their Appl. 2000, 15, 19–21. [Google Scholar] [CrossRef]
- Arik, S.; Iantovics, L.B.; Szilagyi, S.M. OutIntSys—A Novel Method for the Detection of the Most Intelligent Cooperative Multiagent Systems. In Proceedings of the 24th International Conference on Neural Information Processing, Guangzhou, China, 14–18 November 2017; Volume 10637, pp. 31–40. [Google Scholar]
- Wallace, C.S.; Dowe, D.L. Minimum message length and Kolmogorov complexity. Comput. J. 1999, 42, 270–283. [Google Scholar] [CrossRef]
- Wallace, C.S. Statistical and Inductive Inference by Minimum Message Length; Springer: Berlin/Heidelberg, Germany, 2005. [Google Scholar]
- Dowe, D.L. MML, hybrid Bayesian network graphical models, statistical consistency, invariance and uniqueness. In Handbook of the Philosophy of Science; Bandyopadhyay, P.S., Forster, M.R., Eds.; Elsevier: Amsterdam, The Netherlands, 2011; Volume 7, pp. 901–982. [Google Scholar]
- Dowe, D.L.; Hajek, A.R. A computational extension to the Turing Test. In Proceedings of the 4th Conference of the Australasian Cognitive Science Society, Melbourne, Australia, 28 November–1 December 2013. [Google Scholar]
- Dowe, D.L.; Hajek, A.R. A non-behavioural, computational extension to the Turing Test. In Proceedings of the International Conference on Computational Intelligence and Multimedia Application, Gippsland, Australia, 7–10 February 1998; pp. 101–106. [Google Scholar]
- Wallace, C.S.; Boulton, D.M. An information measure for classification. Comput. J. 1968, 11, 185–194. [Google Scholar] [CrossRef]
- Sterret, S.G. Turing on the Integration of Human and Machine Intelligence. In Philosophical Explorations of the Legacy of Alan Turing; Floyd, J., Bokulich, A., Eds.; Springer: Cham, Switzerland, 2017; Volume 324, pp. 323–338. [Google Scholar]
- Ferrucci, D.; Levas, A.; Bagchi, S.; Gondek, D.; Mueller, E.T. Watson: Beyond Jeopardy! Artificial Intelligence 2013, 199, 93–105. [Google Scholar] [CrossRef]
- Legg, S.; Hutter, M. A Formal Measure of Machine Intelligence. In Proceedings of the 15th Annual Machine Learning Conference of Belgium and The Netherlands (Benelearn 2006), Ghent, Belgium, 11–12 May 2006; pp. 73–80. [Google Scholar]
- Hibbard, B. Measuring Agent Intelligence via Hierarchies of Environments. In Artificial General Intelligence AGI 2011; Schmidhuber, J., Thórisson, K.R., Looks, M., Eds.; Springer: Berlin/Heidelberg, Germany, 2011; Volume 6830, pp. 303–308. [Google Scholar]
- Anthon, A.; Jannett, T.C. Measuring machine intelligence of an agent-based distributed sensor network system. In Advances and Innovations in Systems, Computing Sciences and Software Engineering; Elleithy, K., Ed.; Springer: Berlin/Heidelberg, Germany, 2007; pp. 531–535. [Google Scholar]
- Hernandez-Orallo, J.; Dowe, D.L. Measuring universal intelligence: Towards an anytime intelligence test. Artif. Intell. 2010, 174, 1508–1539. [Google Scholar] [CrossRef]
- Iantovics, L.B.; Emmert-Streib, F.; Arik, S. MetrIntMeas a novel metric for measuring the intelligence of a swarm of cooperating agents. Cogn. Syst. Res. 2017, 45, 17–29. [Google Scholar] [CrossRef]
- Winklerova, Z. Maturity of the Particle Swarm as a Metric for Measuring the Collective Intelligence of the Swarm. In Advances in Swarm Intelligence, ICSI 2013; Tan, Y., Shi, Y., Mo, H., Eds.; Springer: Berlin/Heidelberg, Germany, 2013; Volume 7928, pp. 40–54. [Google Scholar]
- Iantovics, L.B.; Rotar, C.; Niazi, M.A. MetrIntPair—A Novel Accurate Metric for the Comparison of Two Cooperative Multiagent Systems Intelligence Based on Paired Intelligence Measurements. Int. J. Intelli. Syst. 2018, 33, 463–486. [Google Scholar] [CrossRef]
- Liu, F.; Shi, Y.; Liu, Y. Intelligence quotient and intelligence grade of artificial intelligence. Ann. Data Sci. 2017, 4, 179–191. [Google Scholar] [CrossRef]
- Detterman, D.K. A challenge to Watson. Intelligence 2011, 39, 77–78. [Google Scholar] [CrossRef]
- Sanghi, P.; Dowe, D.L. A computer program capable of passing I.Q. tests. In Proceedings of the Joint International Conference on Cognitive Science, 4th ICCS International Conference on Cognitive Science and 7th ASCS Australasian Society for Cognitive Science (ICCS/ASCS-2003), Sydney, Australia, 13–17 July 2003; pp. 570–575. [Google Scholar]
- Campbell, M.; Hoane, A.J.; Hsu, F. Deep Blue. Artif. Intell. 2002, 134, 57–83. [Google Scholar] [CrossRef]
- Iantovics, L.B.; Rotar, C.; Nechita, E. A novel robust metric for comparing the intelligence of two cooperative multiagent systems. Procedia Comput. Sci. 2016, 96, 637–644. [Google Scholar] [CrossRef]
- Chakravarti, I.M.; Laha, R.G.; Roy, J. Handbook of Methods of Applied Statistics; John Wiley and Sons: Hoboken, NJ, USA, 1967; Volume I, pp. 392–394. [Google Scholar]
- Lilliefors, H. On the Kolmogorov–Smirnov test for normality with mean and variance unknown. J. Am. Stat. Assoc. 1967, 62, 399–402. [Google Scholar] [CrossRef]
- Lilliefors, H. On the Kolmogorov–Smirnov test for the exponential distribution with mean unknown. J. Am. Stat. Assoc. 1969, 64, 387–389. [Google Scholar] [CrossRef]
- Dallal, G.E.; Wilkinson, L. An analytic approximation to the distribution of Lilliefors’s test statistic for normality. Am. Stat. 1986, 40, 294–296. [Google Scholar]
- Markowski, C.A.; Markowski, E.P. Conditions for the Effectiveness of a Preliminary Test of Variance. Am. Stat. 1990, 44, 322–326. [Google Scholar]
- Bartlett, M.S. Properties of sufficiency and statistical tests. Proc. R. Soc. Lond. A 1937, 160, 268–282. [Google Scholar] [CrossRef]
- Snedecor, G.W.; Cochran, W.G. Statistical Methods, 8th ed.; Iowa State University Press: Iowa, IA, USA, 1989. [Google Scholar]
- Ross, S.M. Peirce’s Criterion for the Elimination of Suspect Experimental Data. J. Eng. Technol. 2003, 2, 1–12. [Google Scholar]
- Zerbet, A.; Nikulin, M. A new statistics for detecting outliers in exponential case. Commun. Stat. Theory Methods 2003, 32, 573–583. [Google Scholar] [CrossRef]
- Stigler, S.M. Mathematical statistics in the early states. Ann. Stat. 1978, 6, 239–265. [Google Scholar] [CrossRef]
- Dean, R.B.; Dixon, W.J. Simplified Statistics for Small Numbers of Observations. Anal. Chem. 1951, 23, 636–638. [Google Scholar] [CrossRef]
- Barnett, V.; Lewis, T. Evolution by gene duplication. In Outliers in Statistical Data, 3rd ed.; Wiley: Hoboken, NJ, USA, 1994. [Google Scholar]
- Motulsky, H. GraphPad InStat Version 3. In The InStat Guide to Choosing and Interpreting Statistical Tests; GraphPad Software, Inc.: La Jolla, CA, USA, 2003. [Google Scholar]
- Fisher, R.A. On the “Probable Error” of a Coefficient of Correlation Deduced from a Small Sample. Metron 1921, 1, 3–32. [Google Scholar]
- Kruskal, W.H.; Wallis, W.A. Use of ranks in one-criterion variance analysis. J. Am. Stat. Assoc. 1952, 47, 583–621. [Google Scholar] [CrossRef]
- Dunn, O.J. Multiple comparisons using rank sums. Technometrics 1964, 6, 241–252. [Google Scholar] [CrossRef]
- Tukey, J. Comparing Individual Means in the Analysis of Variance. Biometrics 1949, 5, 99–114. [Google Scholar] [CrossRef] [PubMed]
- Sosnoff, J.J.; Heffernan, K.S.; Jae, S.Y.; Fernhall, B. Aging, hypertension and physiological tremor: The contribution of the cardioballistic impulse to tremorgenesis in older adults. J. Neurol. Sci. 2013, 326, 68–74. [Google Scholar]
- Lee, J.Y.; Shin, S.Y.; Park, T.H.; Zhang, B.T. Solving traveling salesman problems with DNA molecules encoding numerical values. Biosystems 2004, 78, 39–47. [Google Scholar] [CrossRef] [PubMed]
- Fischer, A.; Fischer, F.; Jager, G.; Keilwagen, J.; Molitor, P.; Grosse, I. Computational Recognition of RNA Splice Sites by Exact Algorithms for the Quadratic Traveling Salesman Problem. Computation 2015, 3, 285–298. [Google Scholar] [CrossRef]
- Kim, E.; Lee, M.; Gatton, T.M.; Lee, J.; Zang, Y. An Evolution Based Biosensor Receptor DNA Sequence Generation Algorithm. Sensors 2010, 10, 330–341. [Google Scholar] [CrossRef] [PubMed]
- Boctor, F.F.; Laporte, G.; Renaud, J. Heuristics for the traveling purchaser problem. Comput. Oper. Res. 2003, 30, 491–504. [Google Scholar] [CrossRef]
- Dantzig, G.B.; Ramser, J.H. The Truck Dispatching Problem. Manag. Sci. 1959, 6, 80–91. [Google Scholar] [CrossRef]
- Dantzig, G.; Fulkerson, D.; Johnson, S. Solution of a large scale traveling salesman problem. Oper. Res. 1954, 2, 393–410. [Google Scholar] [CrossRef]
- Ouaarab, A.; Ahiod, B.; Yang, X.S. Discrete cuckoo search algorithm for the travelling salesman problem, Neural Comput. Appl. 2014, 24, 1659. [Google Scholar]
- Huang, Z.G.; Wang, L.G.; Xu, Z.; Cui, J.J. An efficient two-step iterative method for solving a class of complex symmetric linear systems. Comput. Math. Appl. 2018, in press. [Google Scholar] [CrossRef]
- Koczy, L.T.; Foldesi, P.; Tuu-Szabo, B. Enhanced discrete bacterial memetic evolutionary algorithm—An efficacious metaheuristic for the traveling salesman optimization. Inf. Sci. 2017, in press. [Google Scholar] [CrossRef]
- Jonker, R.; Volgenant, T. Transforming asymmetric into symmetric traveling salesman problems. Oper. Res. Lett. 1983, 2, 161–163. [Google Scholar] [CrossRef]
- Arthanari, T.S.; Usha, M. An alternate formulation of the symmetric traveling salesman problem and its properties. Discret. Appl. Math. 2000, 98, 173–190. [Google Scholar] [CrossRef]
- Smith, T.H.C.; Meyer, T.W.S.; Thompson, G.L. Lower bounds for the symmetric travelling salesman problem from Lagrangean relaxations. Discret. Appl. Math. 1990, 26, 209–217. [Google Scholar] [CrossRef]
- Holldobler, B.; Wilson, E.O. The Ants; Harvard University Press: Cambridge, MA, USA, 1990. [Google Scholar]
- Higashi, S.; Yamauchi, K. Influence of a Supercolonial Ant Formica(Formica) yessensis Forel on the Distribution of Other Ants in Ishikari Coast. Jpn. J. Ecol. 1979, 29, 257–264. [Google Scholar]
- Giraud, T.; Pedersen, J.S.; Keller, L. Evolution of supercolonies: The Argentine ants of southern Europe. Proc. Natl. Acad. Sci. USA 2002, 99, 6075–6079. [Google Scholar] [CrossRef] [PubMed]
- Sim, Y.B.; Lee, S.G.; Lee, S. Function-Oriented Networking and On-Demand Routing System in Network Using Ant Colony Optimization Algorithm. Symmetry 2017, 9, 272. [Google Scholar] [CrossRef]
- Crisan, G.C.; Pintea, C.M.; Palade, V. Emergency Management Using Geographic Information Systems: Application to the first Romanian Traveling Salesman Problem Instance. Knowl. Inf. Syst. 2017, 50, 265–285. [Google Scholar] [CrossRef]
- Everitt, B. The Cambridge Dictionary of Statistics; Cambridge University Press: New York, NY, USA, 1998. [Google Scholar]
- Marusteri, M.; Bacarea, V. Comparing groups for statistical differences: How to choose the right statistical test? Biochem. Med. 2010, 20, 15–32. [Google Scholar] [CrossRef]
- Mann, H.B.; Whitney, D.R. On a Test of Whether one of Two Random Variables is Stochastically Larger than the Other. Ann. Math. Stat. 1947, 18, 50–60. [Google Scholar] [CrossRef]
- Fay, M.P.; Proschan, M.A. Wilcoxon–Mann–Whitney or t-test? On assumptions for hypothesis tests and multiple interpretations of decision rules. Stat. Surv. 2010, 4, 1–39. [Google Scholar] [CrossRef] [PubMed]
- McDonald, J.H. Handbook of Biological Statistics, 3rd ed.; Sparky House Publishing: Baltimore, MD, USA, 2014. [Google Scholar]
- Fagerland, M.W.; Sandvik, L. The Wilcoxon-Mann-Whitney Test under scrutiny. Stat. Med. 2009, 28, 1487–1497. [Google Scholar] [CrossRef] [PubMed]
- Slavin, R. Educational Psychology Theory and Practice, 9th ed.; Allyn and Bacon: Boston, MA, USA, 2009; p. 117. [Google Scholar]
- Gardner, H. Frames of Mind: The Theory of Multiple Intelligences, 3rd ed.; Basic Books: New York, NY, USA, 2011. [Google Scholar]
- Visser, B.A.; Ashton, M.C.; Vernon, P.A. g and the measurement of Multiple Intelligences: A response to Gardner. Intelligence 2006, 34, 507–510. [Google Scholar] [CrossRef]
- Bell, E.A.; Boehnke, P.; Harrison, T.M.; Mao, W.L. Potentially biogenic carbon preserved in a 4.1 billion year-old zircon. Proc. Natl. Acad. Sci. USA 2015, 112, 14518–14521. [Google Scholar] [CrossRef] [PubMed]
© 2018 by the authors. Licensee MDPI, Basel, Switzerland. This article is an open access article distributed under the terms and conditions of the Creative Commons Attribution (CC BY) license (http://creativecommons.org/licenses/by/4.0/).