Design of Sampling Plan Using Regression Estimator under Indeterminacy


Abstract
1. Introduction
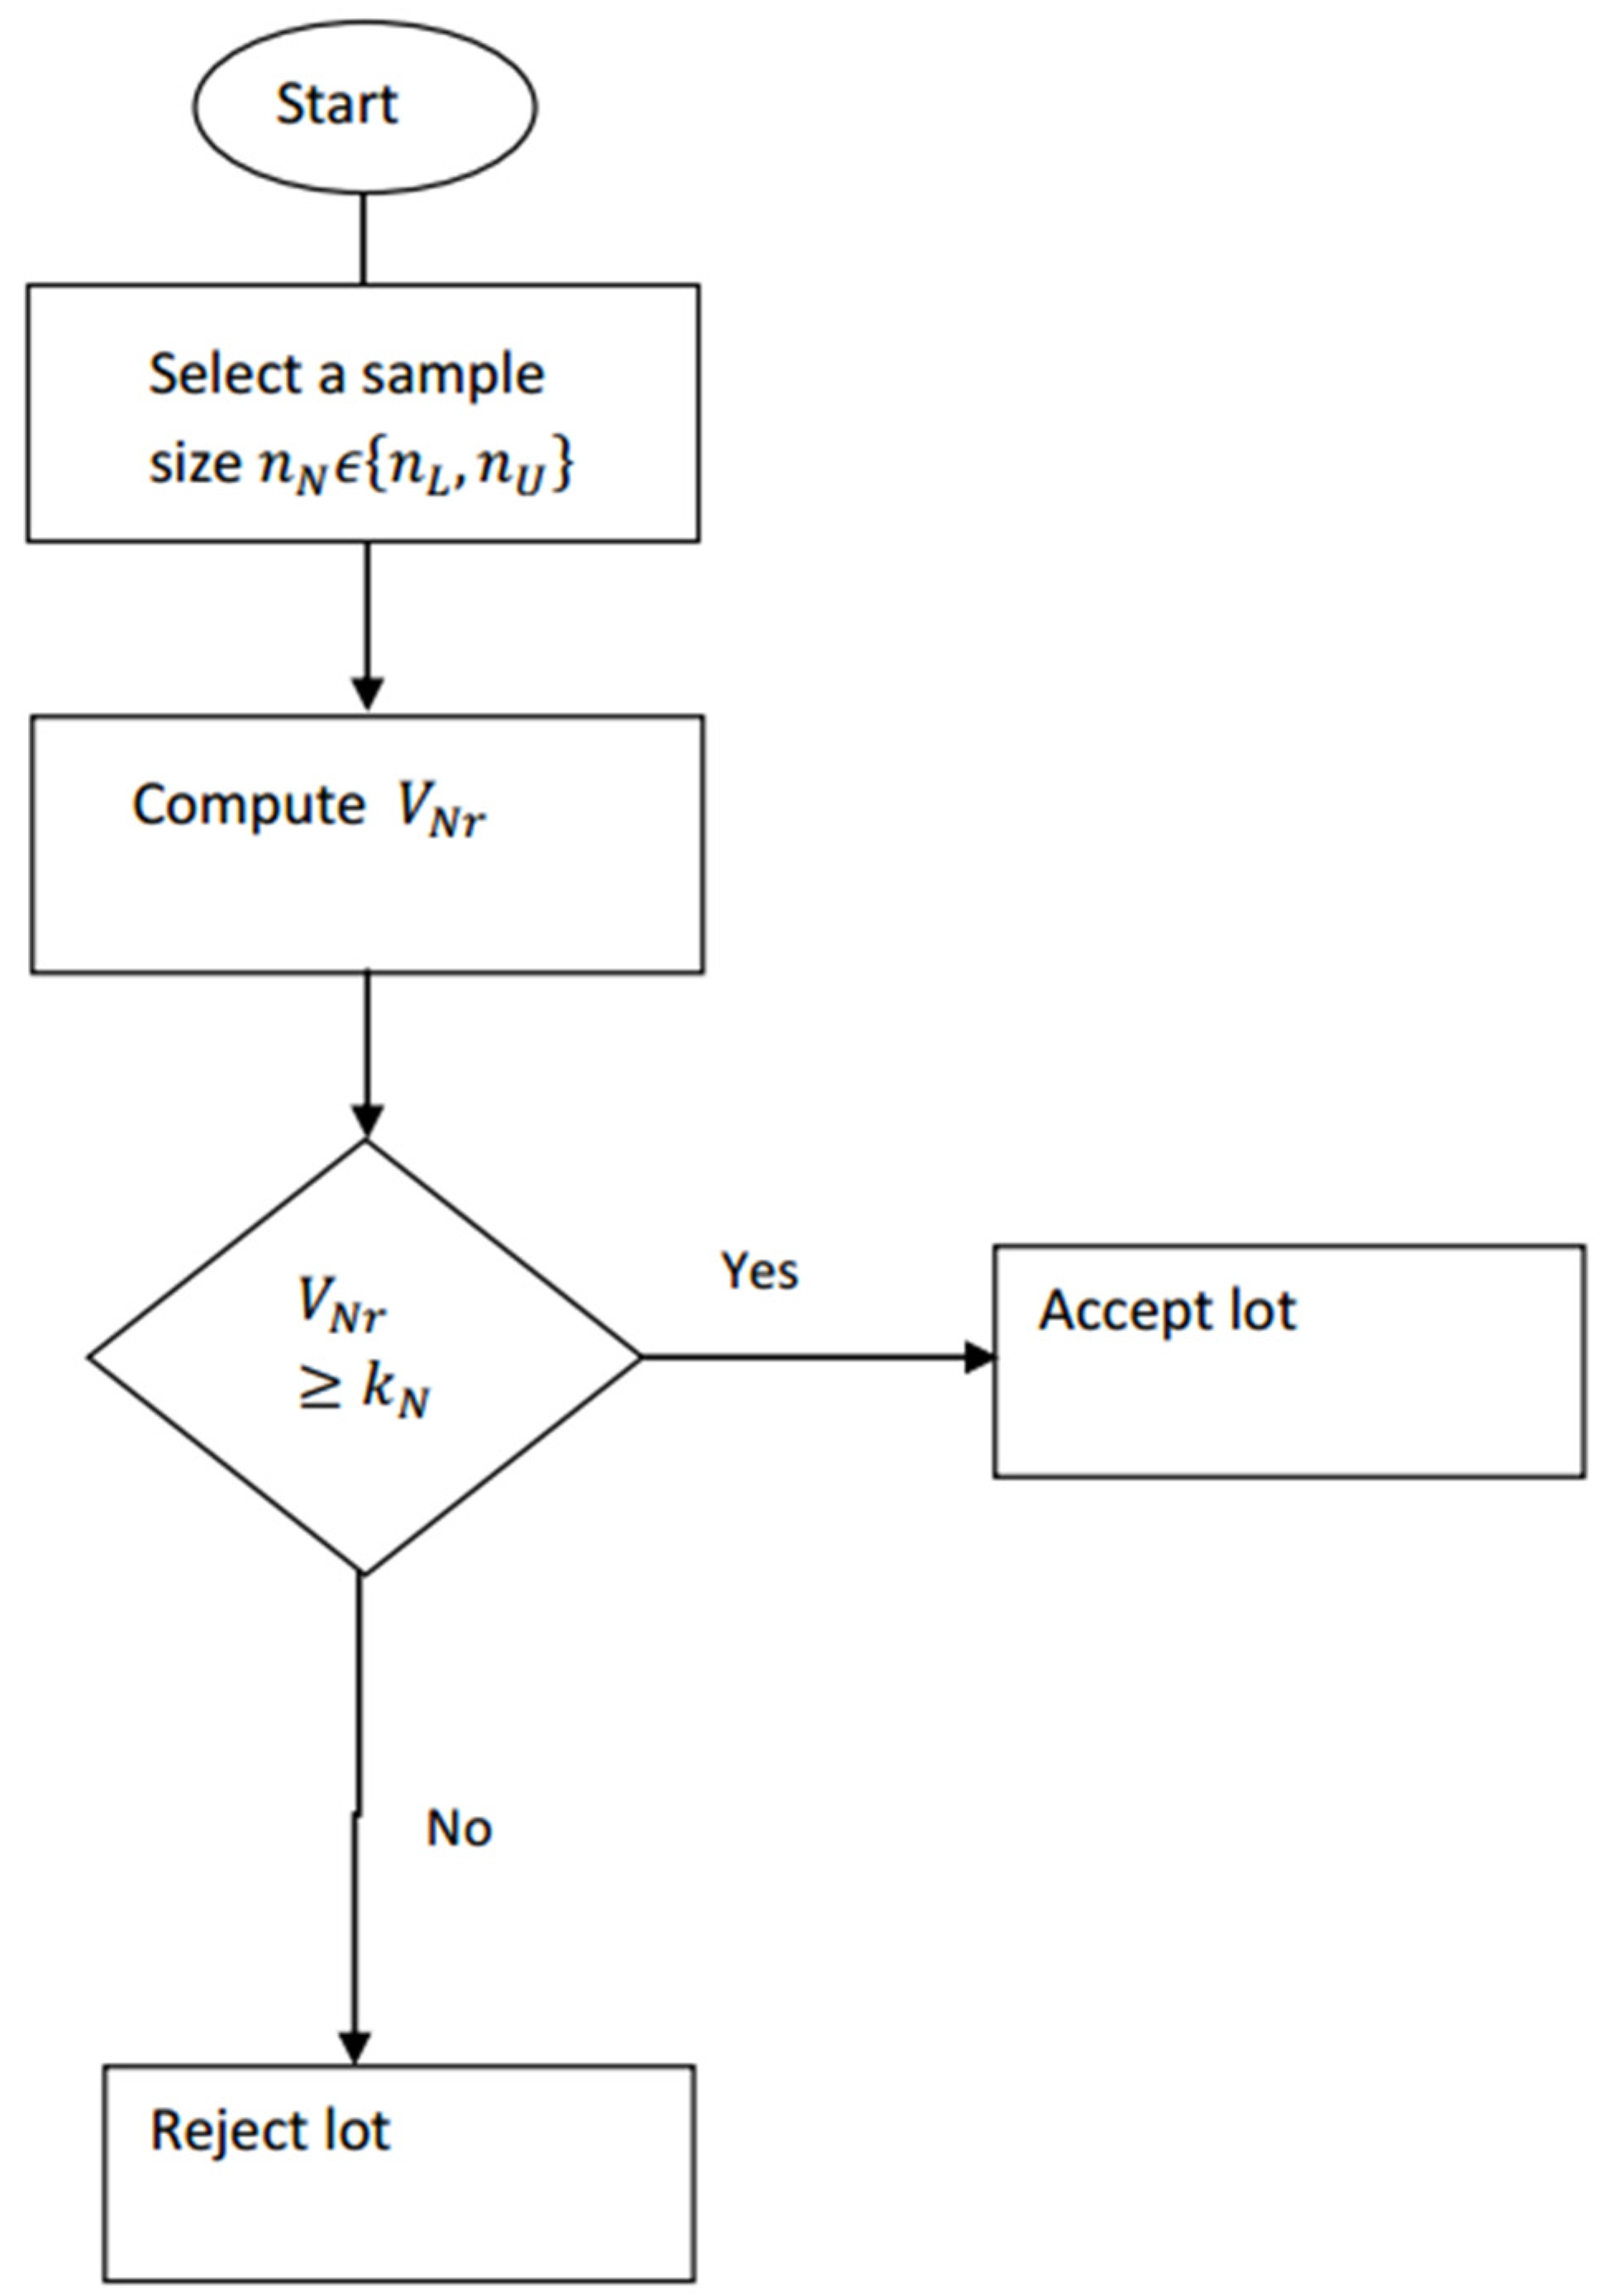
2. Design of the Proposed Plan
3. Comparative Study
4. Application of the Proposed Plan
5. Concluding Remarks
Author Contributions
Funding
Acknowledgments
Conflicts of Interest
References
- Figueiredo, F.; Figueiredo, A.; Gomes, M.I. Acceptance sampling plans for inflated Pareto processes. In Proceedings of the 4th international symposium on statistical process monitoring, ISSPM, Padua, Italy, 7–9 July 2015. [Google Scholar]
- Seal, K.C. A single sampling plan for correlated variables with a single-sided specification limit. J. Am. Stat. Assoc. 1959, 54, 248–259. [Google Scholar] [CrossRef]
- Riaz, M. Monitoring process mean level using auxiliary information. Stat. Neerl. 2008, 62, 458–481. [Google Scholar] [CrossRef]
- Aslam, M.; Satti, S.L.; Moemen, M.A.-E.; Jun, C.-H. Design of sampling plan using auxiliary information. Commun. Stat.-Theory Methods 2017, 46, 3772–3781. [Google Scholar] [CrossRef]
- Aslam, M.; Yen, C.-H.; Chang, C.-H.; Jun, C.-H. Multiple dependent state variable sampling plans with process loss consideration. Int. J. Adv. Manuf. Technol. 2014, 71, 1337–1343. [Google Scholar] [CrossRef]
- Lee, H.; Aslam, M.; Shakeel, Q.-U.-A.; Lee, W.; Jun, C.-H. A control chart using an auxiliary variable and repetitive sampling for monitoring process mean. J. Stat. Comput. Simul. 2015, 85, 3289–3296. [Google Scholar] [CrossRef]
- Yen, C.-H.; Chang, C.-H.; Aslam, M. Repetitive variable acceptance sampling plan for one-sided specification. J. Stat. Comput. Simul. 2015, 85, 1102–1116. [Google Scholar] [CrossRef]
- Kanagawa, A.; Ohta, H. A design for single sampling attribute plan based on fuzzy sets theory. Fuzzy Sets Syst. 1990, 37, 173–181. [Google Scholar] [CrossRef]
- Jamkhaneh, E.B.; Sadeghpour-Gildeh, B.; Yari, G. Important criteria of rectifying inspection for single sampling plan with fuzzy parameter. Int. J. Contemp. Math. Sci. 2009, 4, 1791–1801. [Google Scholar]
- Jamkhaneh, E.B.; Sadeghpour-Gildeh, B.; Yari, G. Inspection error and its effects on single sampling plans with fuzzy parameters. Struct. Multidiscip. Optim. 2011, 43, 555–560. [Google Scholar] [CrossRef]
- Sadeghpour Gildeh, B.; Baloui Jamkhaneh, E.; Yari, G. Acceptance single sampling plan with fuzzy parameter. Iran. J. Fuzzy Syst. 2011, 8, 47–55. [Google Scholar]
- Tong, X.; Wang, Z. Fuzzy acceptance sampling plans for inspection of geospatial data with ambiguity in quality characteristics. Comput. Geosci. 2012, 48, 256–266. [Google Scholar] [CrossRef]
- Turanoğlu, E.; Kaya, I.; Kahraman, C. Fuzzy acceptance sampling and characteristic curves. Int. J. Comput. Intell. Syst. 2012, 5, 13–29. [Google Scholar] [CrossRef]
- Uma, G.; Ramya, K. Impact of Fuzzy Logic on Acceptance Sampling Plans–A Review. Autom. Auton. Syst. 2015, 7, 181–185. [Google Scholar]
- Kahraman, C.; Bekar, E.T.; Senvar, O. A Fuzzy Design of Single and Double Acceptance Sampling Plans. In Intelligent Decision Making in Quality Management; Springer: Berlin/Heidelberg, Germany, 2016; pp. 179–211. [Google Scholar]
- Afshari, R.; Sadeghpour Gildeh, B. Designing a multiple deferred state attribute sampling plan in a fuzzy environment. Am. J. Math. Manag. Sci. 2017, 36, 328–345. [Google Scholar] [CrossRef]
- Senturk, S.; Erginel, N. Development of fuzzy X¯∼-R∼ and X¯∼-S∼ control charts using α-cuts. Inf. Sci. 2009, 179, 1542–1551. [Google Scholar] [CrossRef]
- Smarandache, F. Neutrosophic logic-generalization of the intuitionistic fuzzy logic. arXiv, 2003; arXiv:math/0303009. [Google Scholar] [CrossRef]
- Chen, J.; Ye, J.; Du, S.; Yong, R. Expressions of rock joint roughness coefficient using neutrosophic interval statistical numbers. Symmetry 2017, 9, 123. [Google Scholar] [CrossRef]
- Aslam, M. A New Sampling Plan Using Neutrosophic Process Loss Consideration. Symmetry 2018, 10, 132. [Google Scholar] [CrossRef]
- Aslam, M.; Arif, O. Testing of Grouped Product for the Weibull Distribution Using Neutrosophic Statistics. Symmetry 2018, 10, 403. [Google Scholar] [CrossRef]
- Aslam, M. Design of Sampling Plan for Exponential Distribution under Neutrosophic Statistical Interval Method. IEEE Access 2018, 6, 64153–64158. [Google Scholar] [CrossRef]
- Aslam, M.; Raza, M.A. Design of new sampling plans for multiple manufacturing lines under uncertainty. Int. J. Fuzzy Syst. 2018, 1–15. [Google Scholar] [CrossRef]
- Sarkar, B.; Samanta, S. Generalized fuzzy trees. J. Comput. Intell. Syst. 2017, 10, 711–720. [Google Scholar] [CrossRef]
- Smarandache, F. Introduction to Neutrosophic Statistics; Infinite Study: Hollywood, FL, USA, 2014. [Google Scholar]
- Duncan, A.J. Quality Control and Industrial Statistics; R. D. Irwin: Homewood, FL, USA, 1974. [Google Scholar]
- Sultan, T. An acceptance chart for raw materials of two correlated properties. Qual. Assur. 1986, 12, 70–72. [Google Scholar]
- Chen, H. A multivariate process capability index over a rectangular solid tolerance zone. Stat. Sin. 1994, 4, 749–758. [Google Scholar]


| Authors | Year | Contributions |
|---|---|---|
| Aslam et al. [4] | 2017 | Introduced regression estimator in the sampling plan |
| Smarandache [18] | 2010 | Introduced neutrosophic logic |
| Smarandache [25] | 2014 | Introduced neutrosophic statistics |
| Aslam [20] | 2018 | Introduced neutrosophic industrial statistics (NIS) |
| 0.001 | 0.004 | [321,323] | [93.9,105.2] | [0.9505,0.9512] | [0.0991,0.0999] |
| 0.006 | [184,186] | [69.7,77.9] | [0.9533,0.9539] | [0.0967,0.0968] | |
| 0.008 | [128,130] | [59.9,64.5] | [0.9503,0.9515] | [0.0929,0.0983] | |
| 0.010 | [102,106] | 50.1,57.5] | [0.9524,0.9544] | [0.0878,0.0973] | |
| 0.015 | [71,73] | [40.6,46.2] | [0.9596,0.9645] | [0.0968,0.0990] | |
| 0.020 | [55,77] | [35.1,40.1] | [0.9576,0.9633] | [0.0919,0.0954] | |
| 0.0025 | 0.030 | [62,65] | [34.9,40.0] | [0.9561,0.9655] | [0.0959,0.0966] |
| 0.050 | [38,40] | [26.2,30.3] | [0.9553,0.9587] | [0.0846,0.0955] | |
| 0.005 | 0.050 | [55,59] | [30.6,35.8] | [0.9515,0.9539] | [0.0788,0.0955] |
| 0.100 | [30,33] | [21.0,24.3] | [0.9639,0.9819] | [0.0900,0.0963] | |
| 0.140 | [23,25] | [17.4,20.1] | [0.9752,0.9865] | [0.0983, 0.0994] | |
| 0.01 | 0.030 | [233,235] | [63.5,71.7] | [0.9501,0.9518] | [0.0931,0.0978] |
| 0.03 | 0.090 | [134,136] | [40.6,45.9] | [0.9516,0.9576] | [0.0974,0.0986] |
| 0.05 | 0.100 | [285,290] | [56.3,63.9] | [0.9538,0.9552] | [0.0902,0.0998] |
| 0.150 | [115,118] | [33.7,38.3] | [0.9739,0.9788] | [0.0959,0.0989] |
| 0.001 | 0.004 | [264,299] | [104.6,121.0] | [0.9532,0.9682] | [0.0903,0.0846] |
| 0.006 | [161,172] | [79.3,89.6] | [0.9672,0.9690] | [0.0904,0.0769] | |
| 0.008 | [115,129] | [66.3,76.3] | [0.9568,0.9707] | [0.0705,0.0655] | |
| 0.01 | [99,103] | [60.2,66.3] | [0.9725,0.9831] | [0.0728,0.0858] | |
| 0.02 | [61,63] | [43.3,48.8] | [0.9947,0.9918] | [0.0977,0.0700] | |
| 0.0025 | 0.03 | [53,57] | [38.7,43.8] | [0.9685,0.9738] | [0.0746,0.0663] |
| 0.05 | [39,41] | [30.2,35.6] | [0.9945,0.9801] | [0.0995,0.0438] | |
| 0.005 | 0.05 | [47,58] | [33.7,40.9] | [0.9630,0.9766] | [0.0631,0.0425] |
| 0.1 | [24,33] | [21.6,27.3] | [0.9806,0.9955] | [0.0731,0.0514] | |
| 0.005 | 0.14 | [23,30] | [18.7,27.5] | [0.9989,0.9747] | [0.0908,0.0073] |
| 0.01 | 0.03 | [175,183] | [65.2,73.1] | [0.9590,0.9549] | [0.0873,0.0697] |
| 0.05 | 0.1 | [201,205] | [53.2,59.0] | [0.9654,0.9551] | [0.0690,0.0498] |
| 0.15 | [65,80] | [28.4,33.6] | [0.9564,0.9871] | [0.0631,0.0689] |
| 0.001 | 0.004 | [321,323] | 321 |
| 0.006 | [184,186] | 184 | |
| 0.008 | [128,130] | 128 | |
| 0.010 | [102,106] | 102 | |
| 0.015 | [71,73] | 71 | |
| 0.020 | [55,77] | 55 | |
| 0.0025 | 0.030 | [62,65] | 62 |
| 0.050 | [38,40] | 38 | |
| 0.005 | 0.050 | [55,59] | 55 |
| 0.100 | [30,33] | 30 | |
| 0.140 | [23,25] | 23 | |
| 0.01 | 0.030 | [233,235] | 233 |
| 0.03 | 0.090 | [134,136] | 134 |
| 0.05 | 0.100 | [285,290] | 285 |
| 0.150 | [115,118] | 115 |
| Observations | Observations | ||||
|---|---|---|---|---|---|
| 1 | [143,143] | [34.2,34.2] | 13 | [187,191] | [58.2,64] |
| 2 | [200,200] | [57,57] | 14 | [186,186] | [57,57] |
| 3 | [168,175] | [47.5,50] | 15 | [172,172] | [49.4,49.4] |
| 4 | [181,181] | [53.4,53.4] | 16 | [182,182] | [57.2,57.2] |
| 5 | [148,148] | [47.8,47.8] | 17 | [177,180] | [50.6,45] |
| 6 | [178,178] | [51.5,51.5] | 18 | [204,204] | [55.1,55.1] |
| 7 | [162,168] | [45.9,50] | 19 | [178,178] | [50.9,50.9] |
| 8 | [215,215] | [59.1,59.1] | 20 | [198,200] | [57.9,60.9] |
| 9 | [161,161] | [48.4,48.4] | 21 | [160,160] | [45.5,45.5] |
| 10 | [141,141] | [47.3,47.3] | 22 | [183,187] | [53.9,55.8] |
| 11 | [175,177] | [57.3,59.6] | 23 | [179,179] | [51.2,51.2] |
| 12 | [187,187] | [58.5,58.5] | 24 | [194,198] | [57.5,58.9] |
© 2018 by the authors. Licensee MDPI, Basel, Switzerland. This article is an open access article distributed under the terms and conditions of the Creative Commons Attribution (CC BY) license (http://creativecommons.org/licenses/by/4.0/).
Share and Cite
Aslam, M.; AL-Marshadi, A.H. Design of Sampling Plan Using Regression Estimator under Indeterminacy. Symmetry 2018, 10, 754. https://doi.org/10.3390/sym10120754
Aslam M, AL-Marshadi AH. Design of Sampling Plan Using Regression Estimator under Indeterminacy. Symmetry. 2018; 10(12):754. https://doi.org/10.3390/sym10120754
Chicago/Turabian StyleAslam, Muhammad, and Ali Hussein AL-Marshadi. 2018. "Design of Sampling Plan Using Regression Estimator under Indeterminacy" Symmetry 10, no. 12: 754. https://doi.org/10.3390/sym10120754
APA StyleAslam, M., & AL-Marshadi, A. H. (2018). Design of Sampling Plan Using Regression Estimator under Indeterminacy. Symmetry, 10(12), 754. https://doi.org/10.3390/sym10120754