1. Introduction
At offshore plants, high-frequency waves, such as ultra high frequency (UHF) and very high frequency (VHF), are used for wireless communication, and automatic identification system (AIS), global positioning system (GPS), and radar scanners are installed. In such wireless communication devices, electromagnetic waves with high waves are generated. Additionally, structures such as metal objects, pipelines, crane ropes, etc. existing in the offshore plant can act as receivers. High-frequency electromagnetic waves from various devices induce voltage and current in metallic conductor structures at the offshore plant. The amplitude of such induced current depends on the wavelength of the transmitted signal, the surrounding electromagnetic field, and the shape and size of the structure. In addition, if the induced voltage or current is large enough, sparks can occur and cause large fires and explosions.
Offshore plants are subject to a variety of marine environmental conditions during operation, with more than 70% of accidents involving explosions or fires. This can lead to large-scale explosions in the event of an accident, leading to human casualties, and can cause serious marine pollution, which can lead to great economic and industrial losses. The possibility of fires and explosions caused by high-frequency radiation is analyzed considering the electromagnetic wave intensity generated from the communication facility of the offshore plant, the characteristics of the metallic structure acting as a receiving antenna, the size of the induced received power, and the characteristics of combustible material at the plant. The risk should be evaluated and reflected in design and construction.
The current state of related papers is as follows. Sang-Won Choi and Hyuk-Myun Kwon [
1] performed an experiment to reduce electric shock and ignition by current and voltage induced by electromagnetic waves from a large crane. The necessity of various studies on the energy required to cause fires and explosions by a spark has been suggested. Eckhoff and Thomassen [
2] studied various sources of ignition in offshore plants. Among them, the influence of high-frequency propagation was considered. According to their paper, electromagnetic waves are emitted by all systems that generate high-frequency electrical energy (10
4 Hz to 10
11 Hz), and ignition sources can be generated if the field is strong enough and the receiver antenna is large enough. In this regard, a method of securing safety levels based on guidance was studied. Bradby [
3] studied various practical applications of fire risk assessment based on BS 6656:2002 code. BS 6656:2002 [
4] is a code detailing a systematic approach, such as initial assessment and full assessment, to assess radio frequency-induced ignition risk. The initial assessment is performed in three steps: (1) determine the size of the maximum vulnerable zone, (2) identify significant transmission sources within the vulnerable zone, and (3) screen each type of transmission source using BS 6656. Full assessment performs the full assessment methodology for the remaining sources. The study by Rajkumar and Bhattacharjee [
5] carried out a step-by-step risk assessment from transmission based on BS 6656:2002. The evaluation step calculated the effective field strength according to frequency. The risk of fires and explosions in the explosion environment was evaluated by calculating the energy generated by sparks in the conductive structure caused by electromagnetic waves, and safety measures for the risk of radio frequency (RF) ignition were suggested. Wang [
6] recommended RF mechanisms that directly or indirectly cause fires and explosions and summarized RF risk studies in flammable and explosive environments. In addition, some issues of RF risk studies were discussed, and RF risk studies were conducted.
Examining the status of related papers, most studies on high-frequency and RF risk assessment were based on the BS guide, and studies conducted in parallel with numerical analysis were rare. In addition, overall studies on land and sea have been conducted on the risk of high-frequency ignition. In this paper, a risk assessment for a dipole antenna commonly used in an offshore plant is performed. The assessment is based on BS PD CLC/TR 50427:2004 [
7] and IEC 60079 [
8,
9,
10] for risk assessment for high-frequency radiation. BS PD CLC/TR 50427:2004 is a guideline for assessing the risk of ignition of a facility where flammable gases due to RF emissions from communications, radar or other transmit antennas may be present. It specifies procedures and formulas necessary for risk assessment. IEC 60079 standard refers to IEC 60079-0, IEC 60079-10-1, and IEC 60079-10-2. IEC 60079-0 specifies the general requirements for the manufacture, testing and marking of electrical equipment and explosive (EX) components for use in explosive atmospheres. IEC 60079-10-1 is an international standard for identification and classification of explosive gas atmospheres and regions where combustible gases, vapors of mist can exist. IEC 60079-10-2 is an international standard for the identification and classification of explosive dust atmospheres and regions where combustible dust layers may be present. The IEC international standard was used to determine the gas threshold. At the same time, Ansys HFSS numerical analysis is performed to contribute to the accuracy of the existing risk assessment based on the BS guide.
3. Risk Assessment Based on the BS Guide
Analysis of the risk assessment is performed in accordance with the BS guide, and methods for assessing potential RF ignition risk include initial assessment, full assessment, and on-site tests. There are two initial assessments: assessment of the risk to a particular plant and assessment of the risk from a particular transmitter. First, referring to the table of the BS guide for the risk to a particular plant, the different radii of vulnerable zones are calculated for all loop structures whose inside perimeter is 40 m or less, for horizontal loops whose height is 5 m or less, and for all other loop structures. The second is a risk assessment for a particular transmitter. For the cases where the inside circumference of the roof structure is less than 85 m at the frequency of 30 MHz or more and the maximum circumference of the largest structure in the plant is 40 m at the frequency of 30 MHz or less and the height is less than 5 m for the horizontal loop structure, the radius of the zone of vulnerable is calculated by referring to the table of BS guide. If the initial assessment indicates a risk inside the vulnerable zone, a full assessment is performed. In this paper, a risk assessment based on the BS guide was performed for a frequency of 30 MHz or more and an inner circumference of the loop structure of 85 m or less.
In the full assessment, the power or energy that can be extracted is calculated and compared with the threshold value according to the gas group. Finally, if a potential hazard is indicated in the full assessment, the power that can be extracted from the on-site test is measured and compared with the threshold value according to the gas group. If an on-site test indicates a hazard, measures such as plant design changes, plant movement, and transmission power reduction are considered. The full assessment of the entire procedure for performing a risk assessment from an antenna is shown in
Figure 1, which is taken from the BS guide. As shown in
Figure 1, all information about the plant or transmission is first collected (① of
Figure 1), and then the effective field strength is calculated (② of
Figure 1) according to the equation provided by the BS guide. Then, the equation is classified into three types according to frequency and polarization. Once the effective field strength is calculated, the extractable power is calculated (③ of
Figure 1). The extractable power is calculated according to the formula provided by the BS guide, and classified into two types according to frequency. At this time, if the frequency is less than 30 MHz, the internal circumference of the structure is taken into account. If the frequency exceeds 30 MHz, the inside circumference of the structure is not considered. If the transmission used in the evaluation is a single transmission (④ of
Figure 1), risk is evaluated by comparing it with the extracted power and the code-based threshold power. On the other hand, when the transmission is a multiple transmission (⑤ of
Figure 1), the maximum extractable power is recalculated and compared with the threshold power to assess the risk. Finally, the threshold power is compared with the extractable power (⑥ of
Figure 1). If the extractable power is smaller than the threshold power, it is checked whether there is no potential ignition risk (⑦ of
Figure 1). On the other hand, if the extractable power is greater than or equal to the threshold power, it is checked whether there is a potential ignition risk (⑧ of
Figure 1) and the on-site test should proceed.
To evaluate the potential risks to the analysis object, risk assessment is performed based on the BS guide from
Section 3.1,
Section 3.2 and
Section 3.3. For the dipole antenna to be analyzed in this paper, initial assessment is carried out for general and offshore plant-specific criteria in
Section 3.1. As a result, of the analysis, it is judged if there is a potential risk, and the full assessment is performed in a single transmission environment in
Section 3.2. Similarly, the full assessment in a multiple transmission environment is performed at
Section 3.3. As a result, the analysis object determines whether there is a potential ignition risk under the condition.
3.1. Initial Assessment
Initial assessments are carried out on land and offshore plants in accordance with the BS guide. Offshore plants are a special concern in the assessment of ignition hazards by RF emissions. Therefore, the BS guide represents the standard for all transmissions, and the transmission criterion for offshore plants is a separate set of transmissions for special offshore plants.
A transmission in accordance with the BS guide is selected to determine the zone of vulnerability; then, it is determined if any gases or vapors that may be dangerous are inside or outside the zone of vulnerability. If gases or vapors are found to be outside the vulnerable area, the transmission is considered not to cause an RF ignition hazard, and the evaluation is stopped. Conversely, if gases or vapors are found to be located inside a vulnerable zone, the transmission is considered to cause an RF ignition hazard, and a full assessment procedure is followed.
First, initial assessment is conducted using general criteria, including land and sea. Here, the frequency is 30 MHz or more, and the loop structure is initialized to a specific transmission by setting the inner circumference to 85 m or less. Since the frequency of the antenna is 163 MHz, the transmission given in
Table 2 is selected and performed.
Table 2 is a reference to the radii of vulnerable zones of the BS guide and includes all land and sea transmissions. If the details of the transmissions are different from those shown in
Table 2, the IIC group representing the largest vulnerable area of the closest equivalent transmission in
Table 2 is selected. The initial assessment results are most similar to serial number 54 VHF and UHF land, fixed, and mobile and maritime mobile transmission, which is the largest IIC group, and the size of the vulnerable zone was determined to be 6 m.
Second, offshore plants are a special issue in the assessment of risk of ignition by RF radiation. Thus, from general RF transmissions and antennas used in offshore plants, the vulnerable zone radius is based on the most common size of structures or cranes that can exist in an offshore plant according to BS PD CLC/TR 50427:2004. Antenna specifications and structural conditions apply equally to the general standards. Initial assessment should be performed by selecting the transmission given in
Table 3. If the details of the transmission are not identical to those shown in
Table 3, the vulnerable area of the nearest equivalent transmission is selected. The initial assessment results are compared to the transmission details given in
Table 3. The most similar is marine VHF fixed, and the size of the vulnerable zone is determined to be 1.1 m.
Both initial assessment on the general criteria and initial assessment specific to the offshore plant were performed on the transmission. The results on land were more conservative, with the vulnerable area of 6 m, compared to the 1.1 m of the offshore plant.
3.2. Full Assessment
Full assessment should be carried out in the initial assessment when a potential hazard appears and proceeds as follows:
Collect all relevant information on transmissions and the plant
Calculate the effective field strength taking into account effects of modulation
Calculate the extractable power or energy from the adventitious antenna
Compare the extractable power or energy from the adventitious antenna with the threshold values
Because most transmissions are modulated, the modulation must be made with clearance, and the calculated field strengths use the modulation factor to obtain the effective field strength.
The transmission is subjected to full assessment up to 6 m in the vulnerable area where the initial assessment result is more conservative. Effective field strengths are classified into three categories based on 10.4.3 [
7] of the BS guide. The first one is horizontal polarization with a frequency of less than 30 MHz. The second one is vertical polarization with frequency below 30 MHz. The third one is when the frequency exceeds 30 MHz. The effective field strength is calculated by selecting one of three equations for each transmitter condition [
12]. Since the frequency of the transmission is more than 30 MHz at 163 MHz, the effective field strength is calculated as follows:
In this case, the modulation factor (
m) of the VHF is 1.0 as a frequency of phase modulation (FM), and the horizontal radiation pattern (
F) is 1. The antenna gain (
G) is measured by the directional power (dB). If the gain is expressed in decibels, it is calculated by the following equation of BS guide [
7]:
The calculated effective field strengths are quantified in
Table 4.
The extractable power is calculated considering the inner circumference of the loop-type structure when the frequency is 30 MHz or less. In contrast, for frequencies above 30 MHz, without considering the perimeter of the structure, the equation given below is calculated, taking into account only the effective field strength and frequency.
The calculated extractable power is shown in
Table 5.
The calculated power is compared to the threshold value specified in the BS guide.
Table 6 shows the threshold power and thermal initiation time criterion from the BS guide. In this paper, the risk of ignition was evaluated using threshold power. If the
Pmax calculated for each gas group is less than
Pth on the BS, the evaluation is no longer carried out because there is no risk of RF ignition. If
Pmax is greater than or equal to
Pth, there is a potential risk of high-frequency ignition.
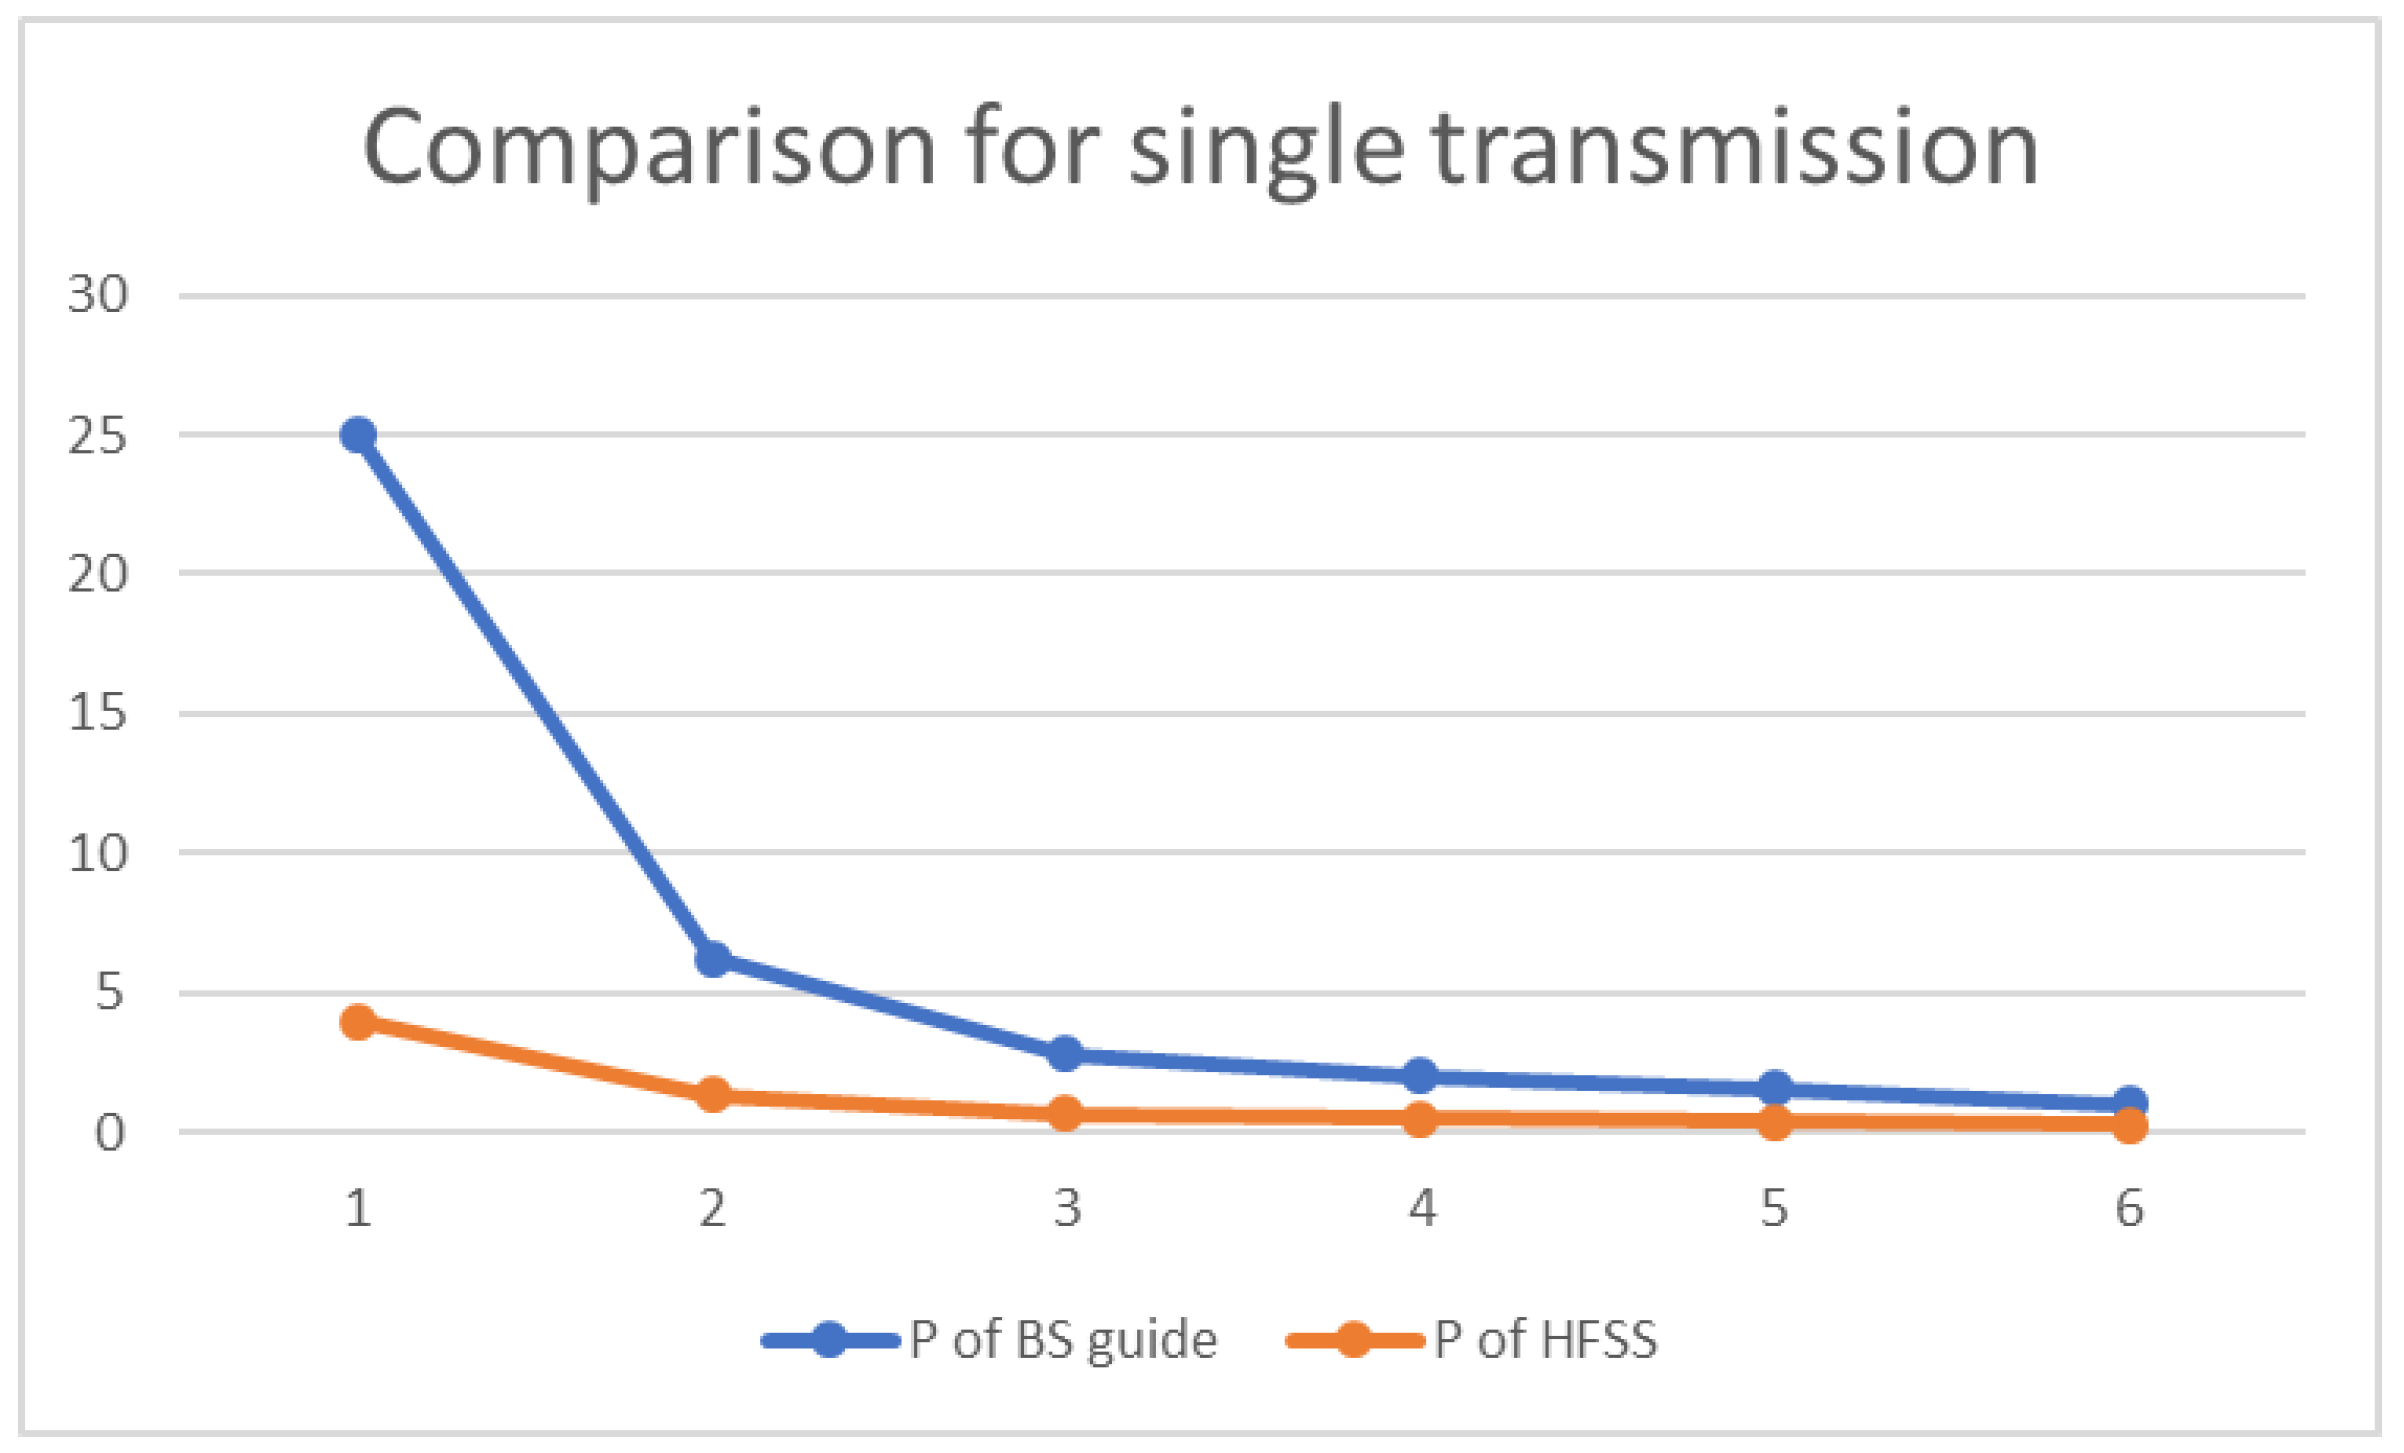
The gas type is assumed to be the IIC group, considering the hydrogen as a high-risk gas located in the offshore plant, and the results are compared. As a result, of evaluating risk of ignition depending on distance, there is a risk of high-frequency ignition because Pmax is equal to or larger than Pth from the transmission to 3.5 m. In contrast, from 4 m to 6 m, Pmax is smaller than Pth, so there is no danger of high-frequency ignition.
The full assessment result and the initial assessment result at 30 MHz or more were compared with each other. In the initial evaluation using the general criteria, it was judged that there was a risk of ignition within 6 m of the vulnerable zone, and there was a danger from the full assessment to 3.5 m after the initial assessment. However, in the initial assessment, which applied specific criteria for offshore plants, it was judged that there was a risk of ignition within 1.1 m of the vulnerable zone. This analysis shows that the BS guide on general criteria including land and sea produces more conservative results, and that marine plant-specific criteria are limited.
3.3. Multiple Transmission Assessment
In the case of multiple transmissions, the effective field strength and
Pmax for each transmission are calculated according to frequency. If the sum of all the values of
Pmax is less than
Pth, there is no risk of RF ignition, and the assessment can be stopped. However, if the sum of these values of
Pmax is larger than
Pth, then the off-resonance effects should be considered by calculation of the modulus match power,
Pmm.
Pmm can be obtained using the following equation, where
fr is the resonant frequency of structure, f
t is the transmission frequency, and
Qk is the circuit factor:
Qk (quality factor or circuit factor) [
13,
14,
15] at resonance is the quality of the frequency selection characteristic and is calculated using the equation below. The resonance frequency divided by the 3 dB bandwidth on both sides is
Qk, which means that the band is wide when the value is low and narrow when it is high.
ft is the frequency of the transmission used in the assessment, 163 MHz, and
fr and
Qk are obtained through calculation.
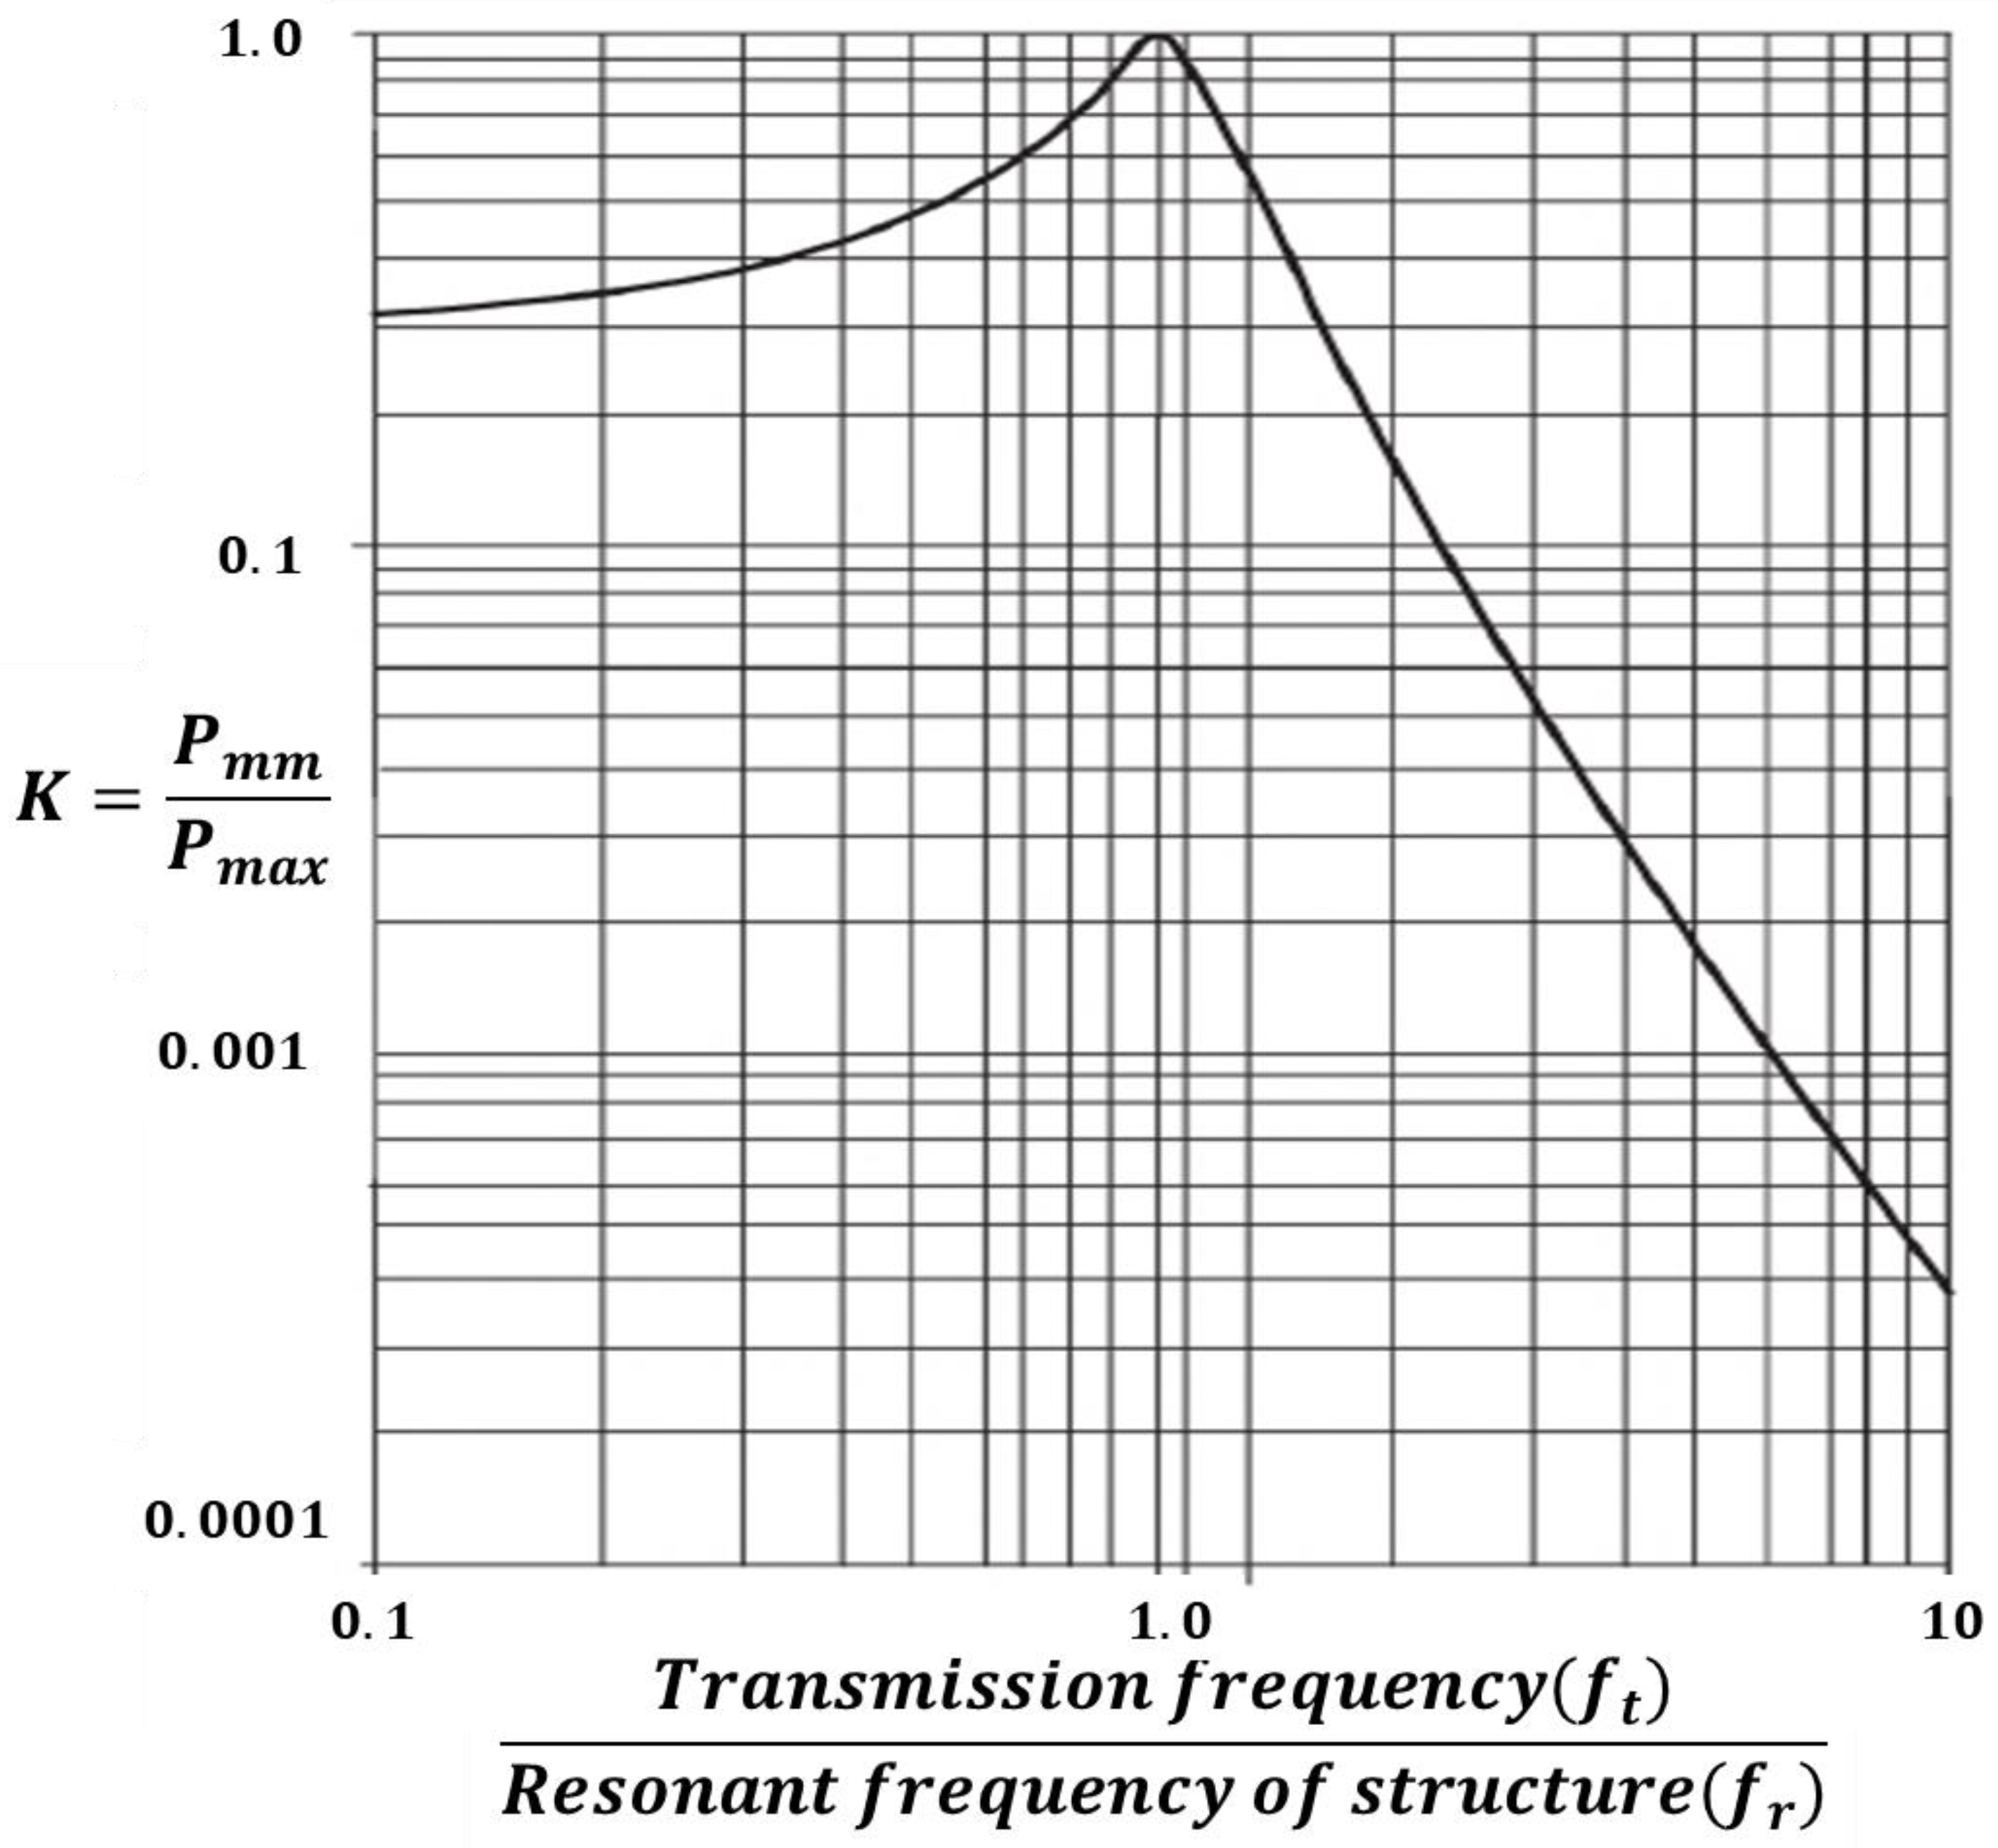
fr is the resonance frequency of the structure and is determined to be the most conservative value at which the ratio of
ft:fr is 1.0 with reference to
Figure 2.
fr is determined to be 163 MHz since
ft is 163 MHz.
Figure 2 is taken from the BS guide, and the
Qk value is 5 as an example.
As a result, if
ft and
fr are the most conservative values,
n is 1 regardless of
Qk, according to the above Equation (4). Therefore, the value of
Pmm is equal to the value of
Pmax. That is, the power of the multiplex transmission is the sum of
Pmm of the transmitters as shown in
Table 7. Comparing the threshold power and the sum of
Pmm in
Table 6, it is determined that there is a danger of high-frequency ignition because the sum of
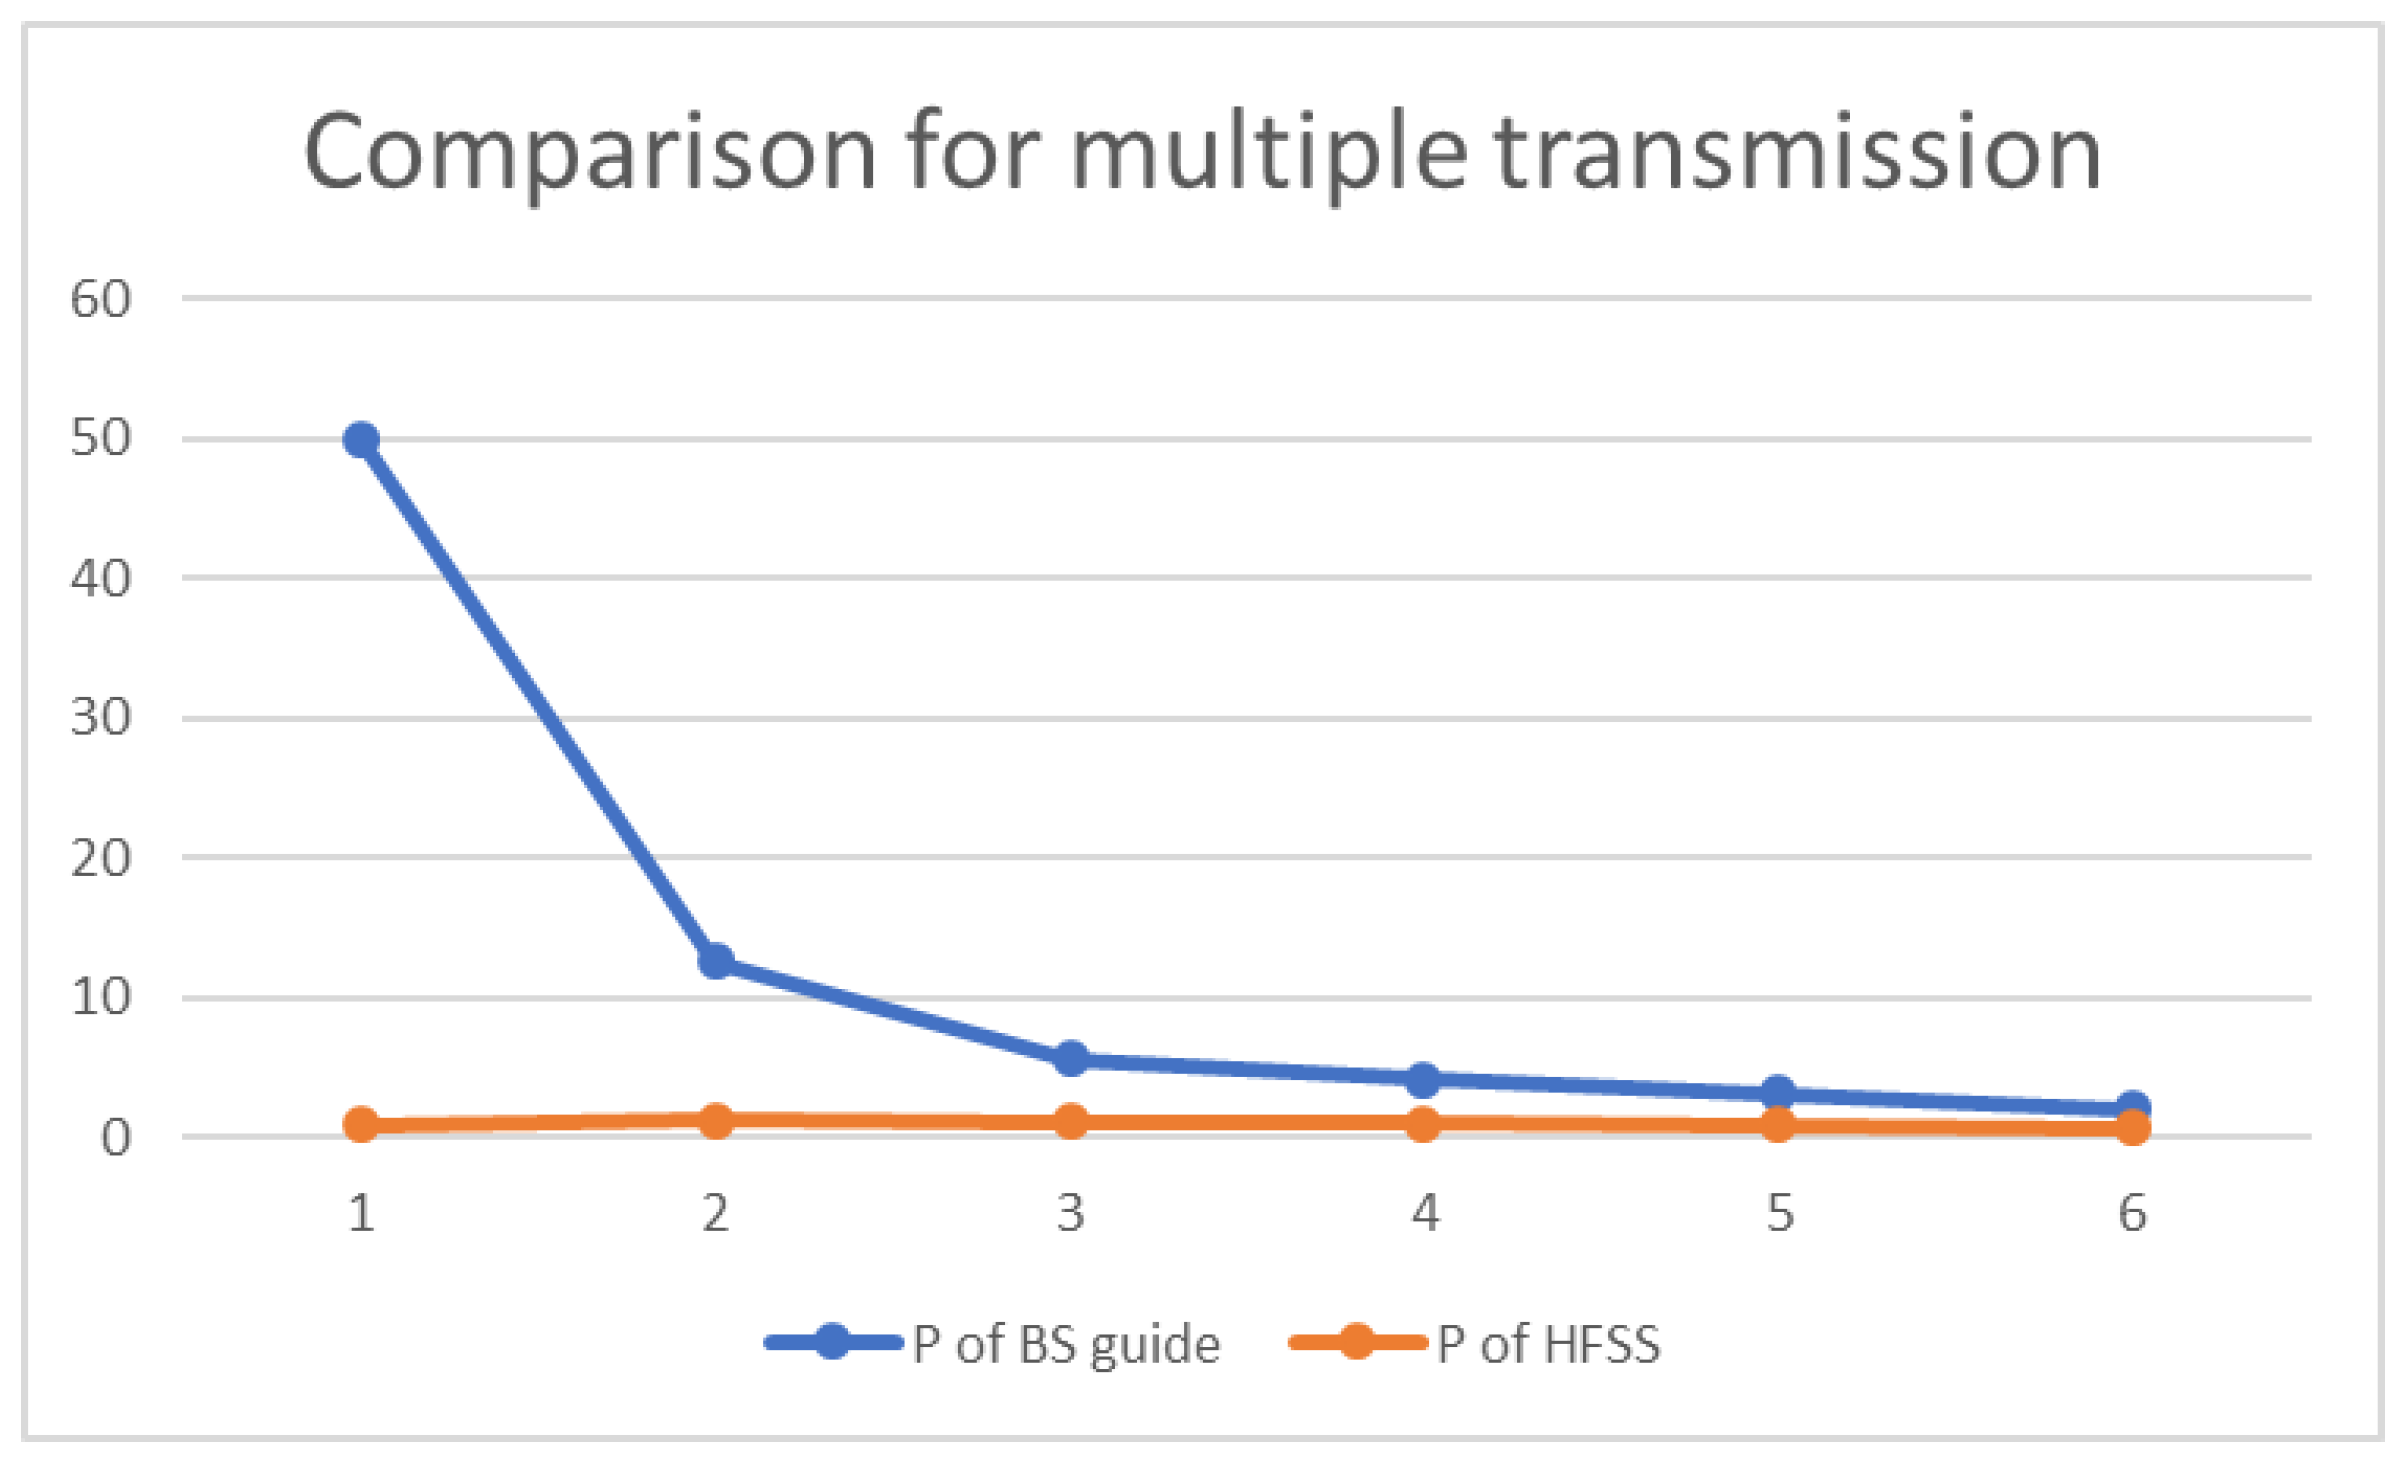
Pmm is equal to or greater than the threshold power up to a distance of 5 m. However, when the distance is more than 5 m, it is assumed that there is no danger of high-frequency ignition because
Pmm is less than the critical power.
Therefore, the on-site test should be performed at the point, where it is judged if there is a risk of high-frequency ignition because the power value that can be extracted from the threshold power is greater than or equal to the threshold value. The on-site test is used to measure the actual extractable power and compare it with the threshold power of the gas group. if the results of on-site tests indicate a risk, we can investigate measures such as plant design changes, plant movement, transmission movement, and transmission power reduction. Methods include bonding, insulation, reducing the effectiveness of the structure as a receiving antenna, and de-tuning.
4. Numerical Analysis
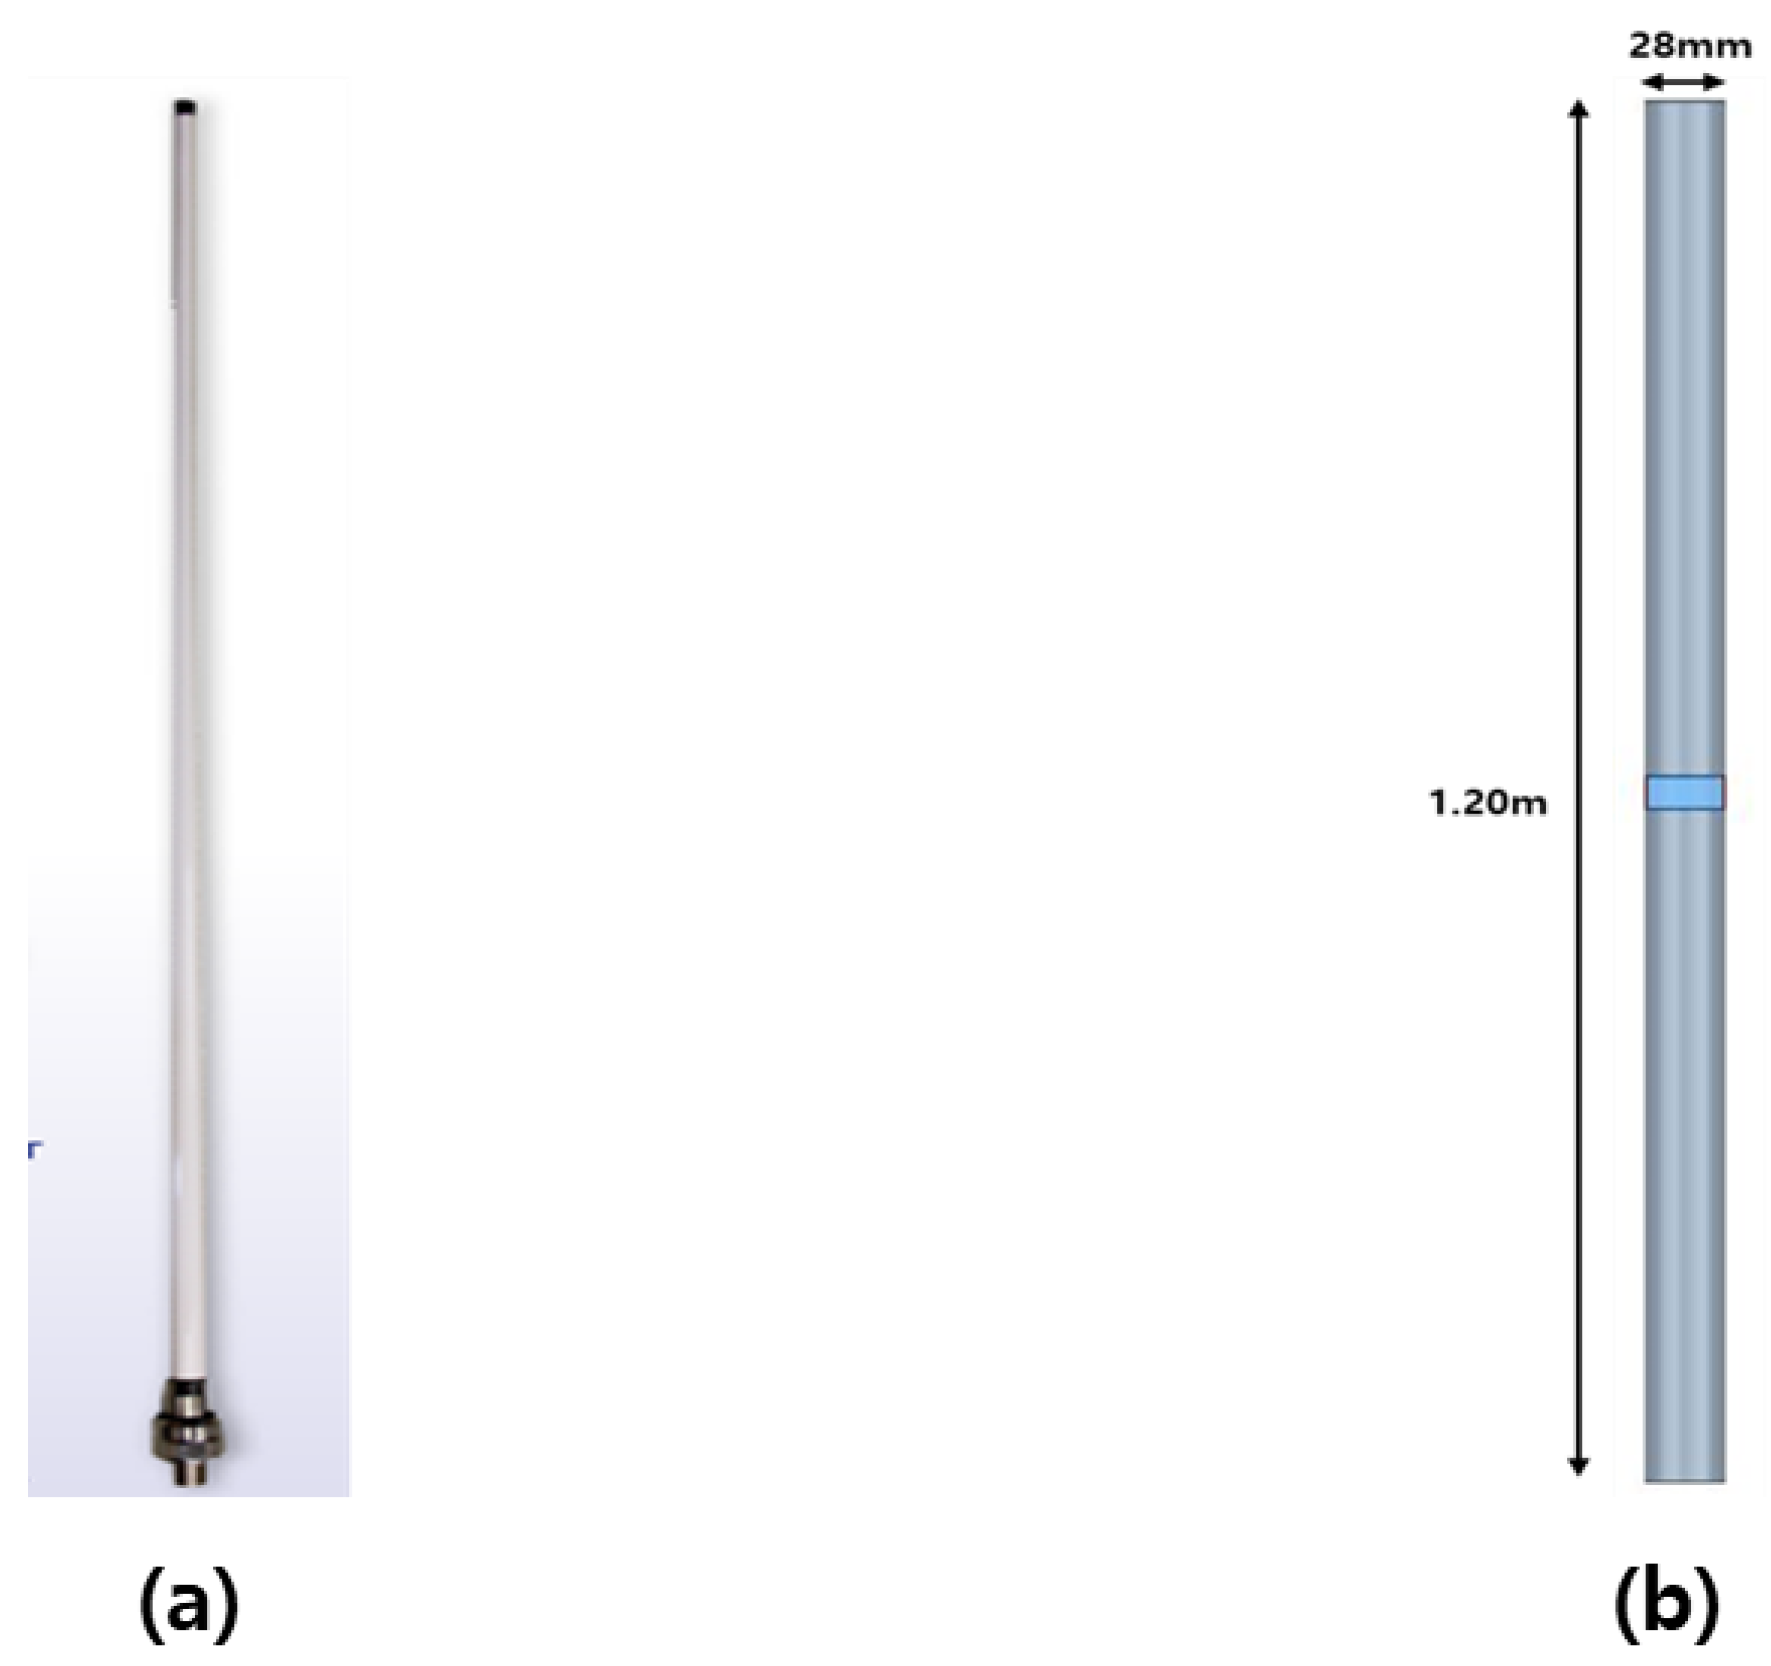
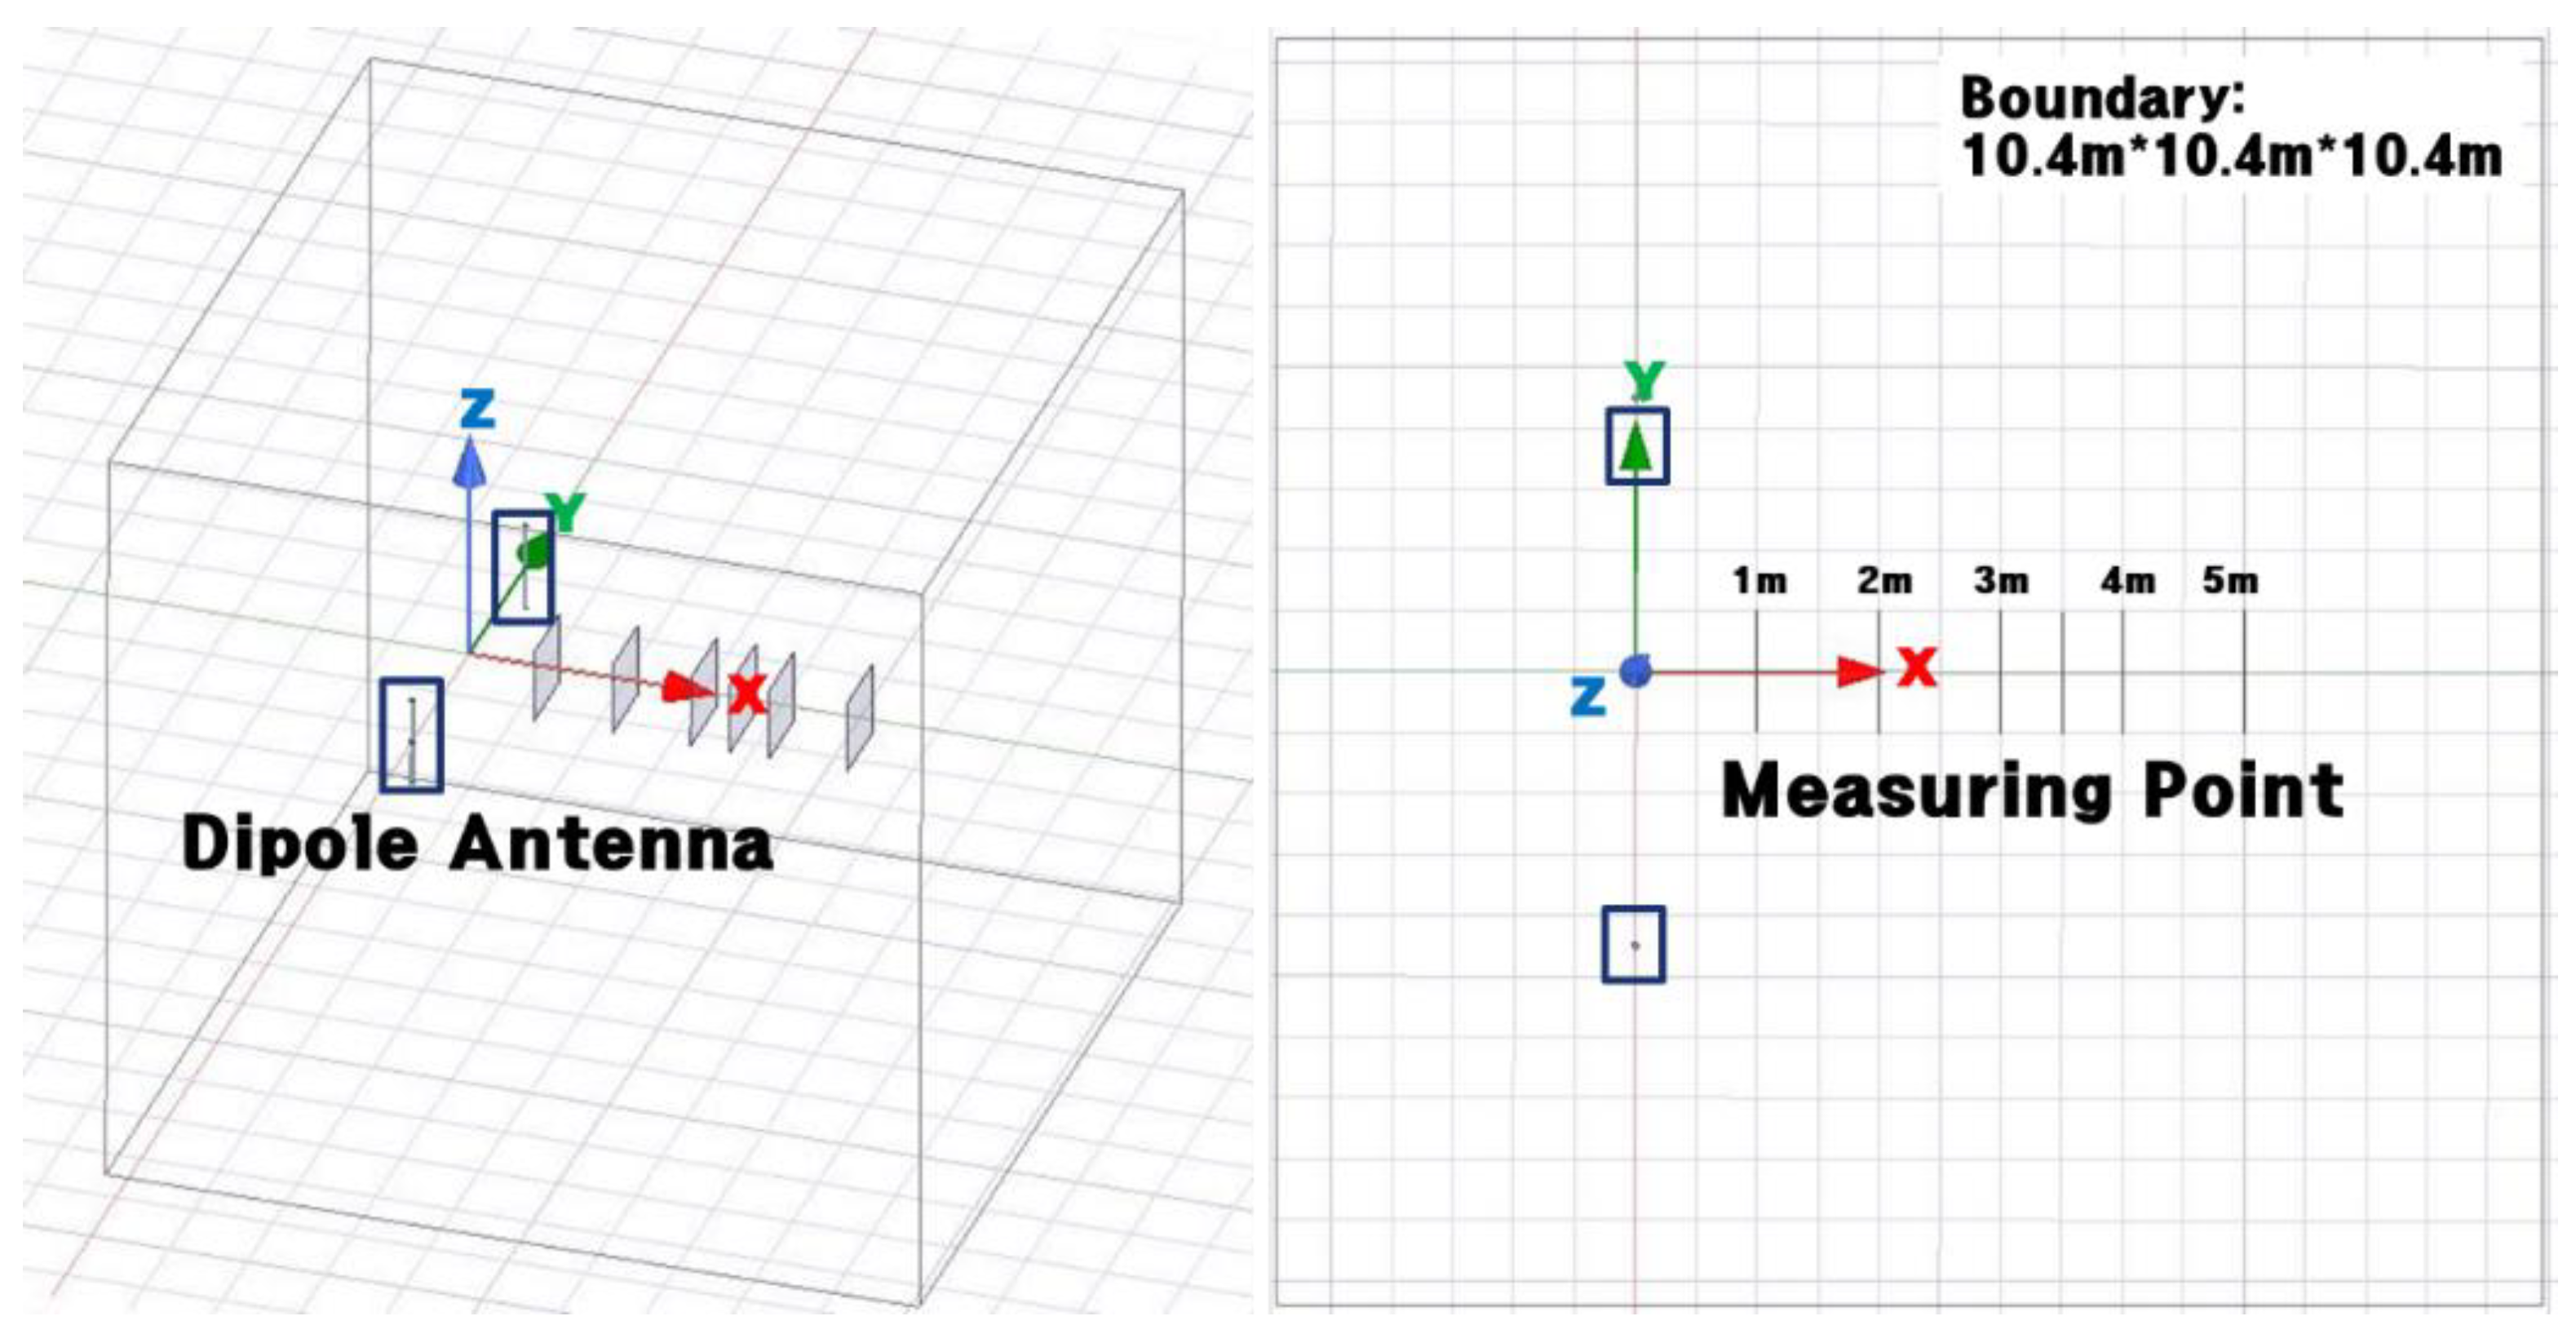
To compare with the results based on the BS guide, the effective field strength and power are calculated by Ansys HFSS. Numerical analysis derives the effective field strength and power at a specific distance from the transmission without considering the structure to simplify the calculation. Numerical analysis was performed to measure the effective field strength up to 5 m because of the risk assessment of code analysis. Numerical analysis was performed for a single transmission and multiple transmissions. The actual shape of the dipole antenna, which is the basic transmission, and the modeled shape are shown in
Figure 3. The detailed specifications are shown in
Table 1.
In the numerical analysis, the effective field strength (
E) of 1 m to 5 m from the transmission to the
X-axis is measured from 0 to 360 degrees in 5-degree intervals according to phase and power (
P). The effective field strength was calculated by assuming root mean square (RMS), which is an average value index widely used in antenna analysis. The RMS equation is defined as follows:
The power passing through the surface of a specific location was calculated using the Ansys HFSS Fields Calculator. The defined power equation is as follows. Here, is the surface used to calculate the force, and is the normal vector for .
The Fields Calculator [
16] referenced HFSS’s Fields Calculator Cookbook’s Fields Calculator Recipes.
4.1. Analysis for a Single Transmission
For a single transmission, the effective field strength (
E) and power (
P) were calculated from 1 m to 5 m from the transmission on the
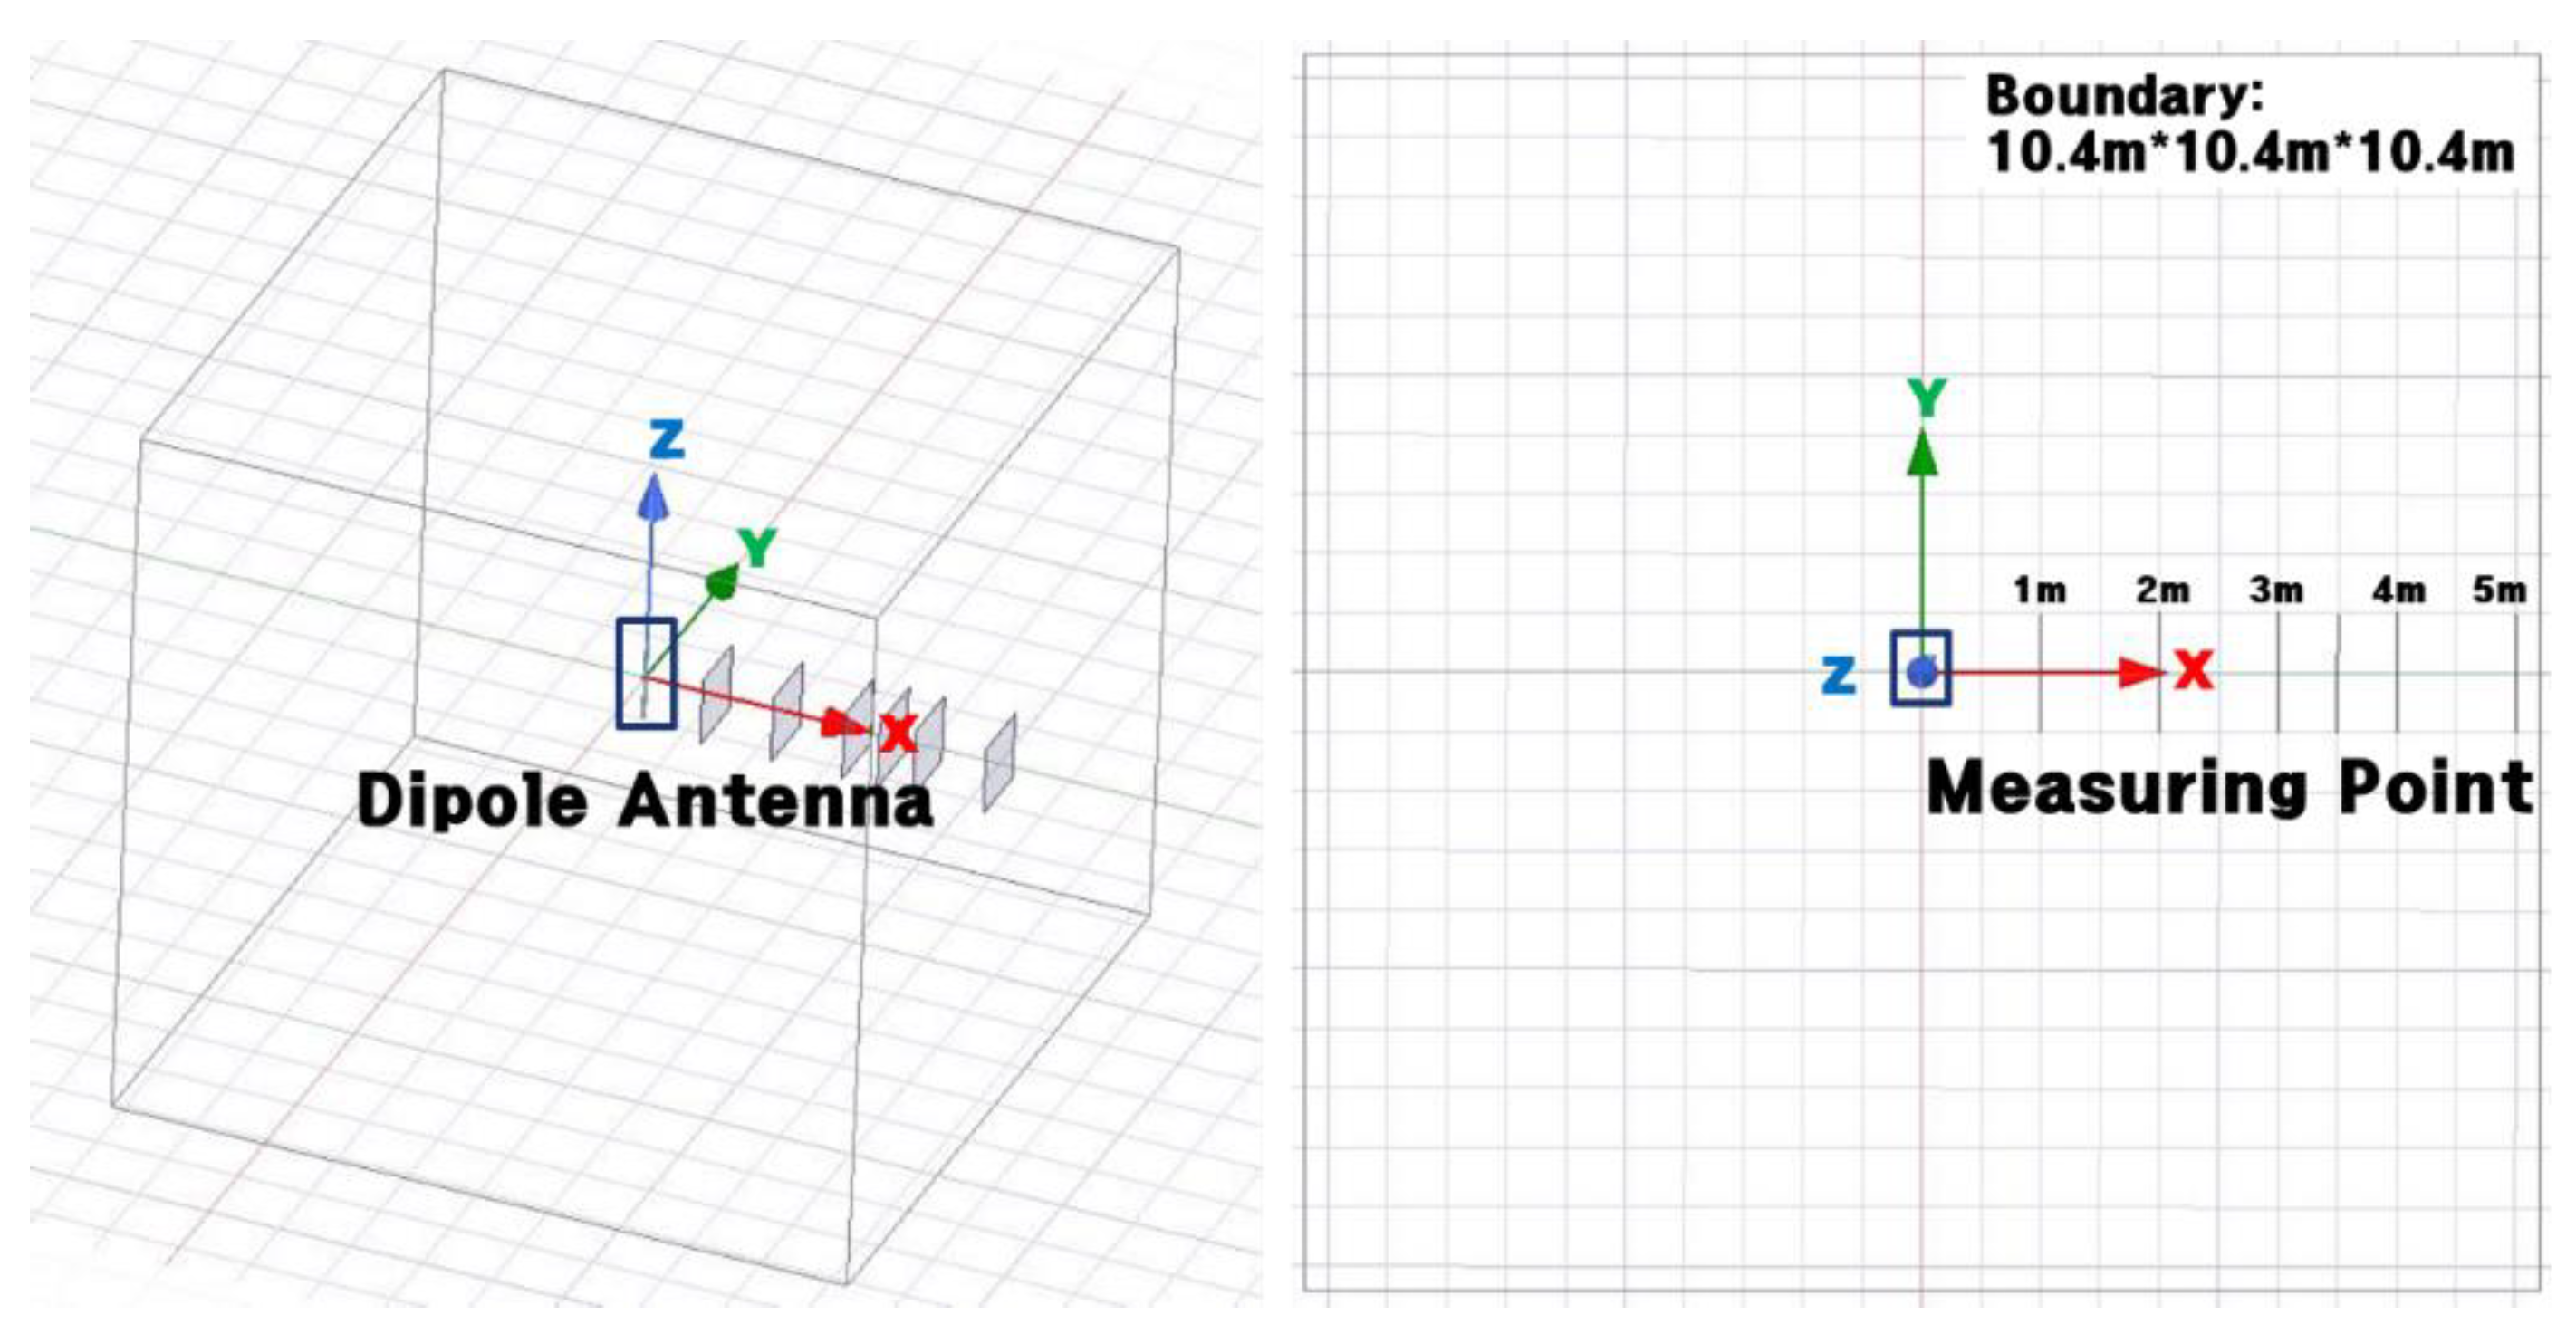
X-axis. The modeling of the transmission is shown in
Figure 4, and the main specifications are as follows. Since the boundary conditions cannot be infinite in the analysis space, the boundaries are selected to be ±5.2 m on the
X-,
Y-, and
Z-axes, and radiation conditions are given to the outermost surfaces. The port is a lumped condition, and the impedance is fed to the default value of 50 Ω. The frequency of the transmission is 163 MHz, the power is 100 W, the antenna length is 1200 mm, and the antenna thickness is 28 mm. The
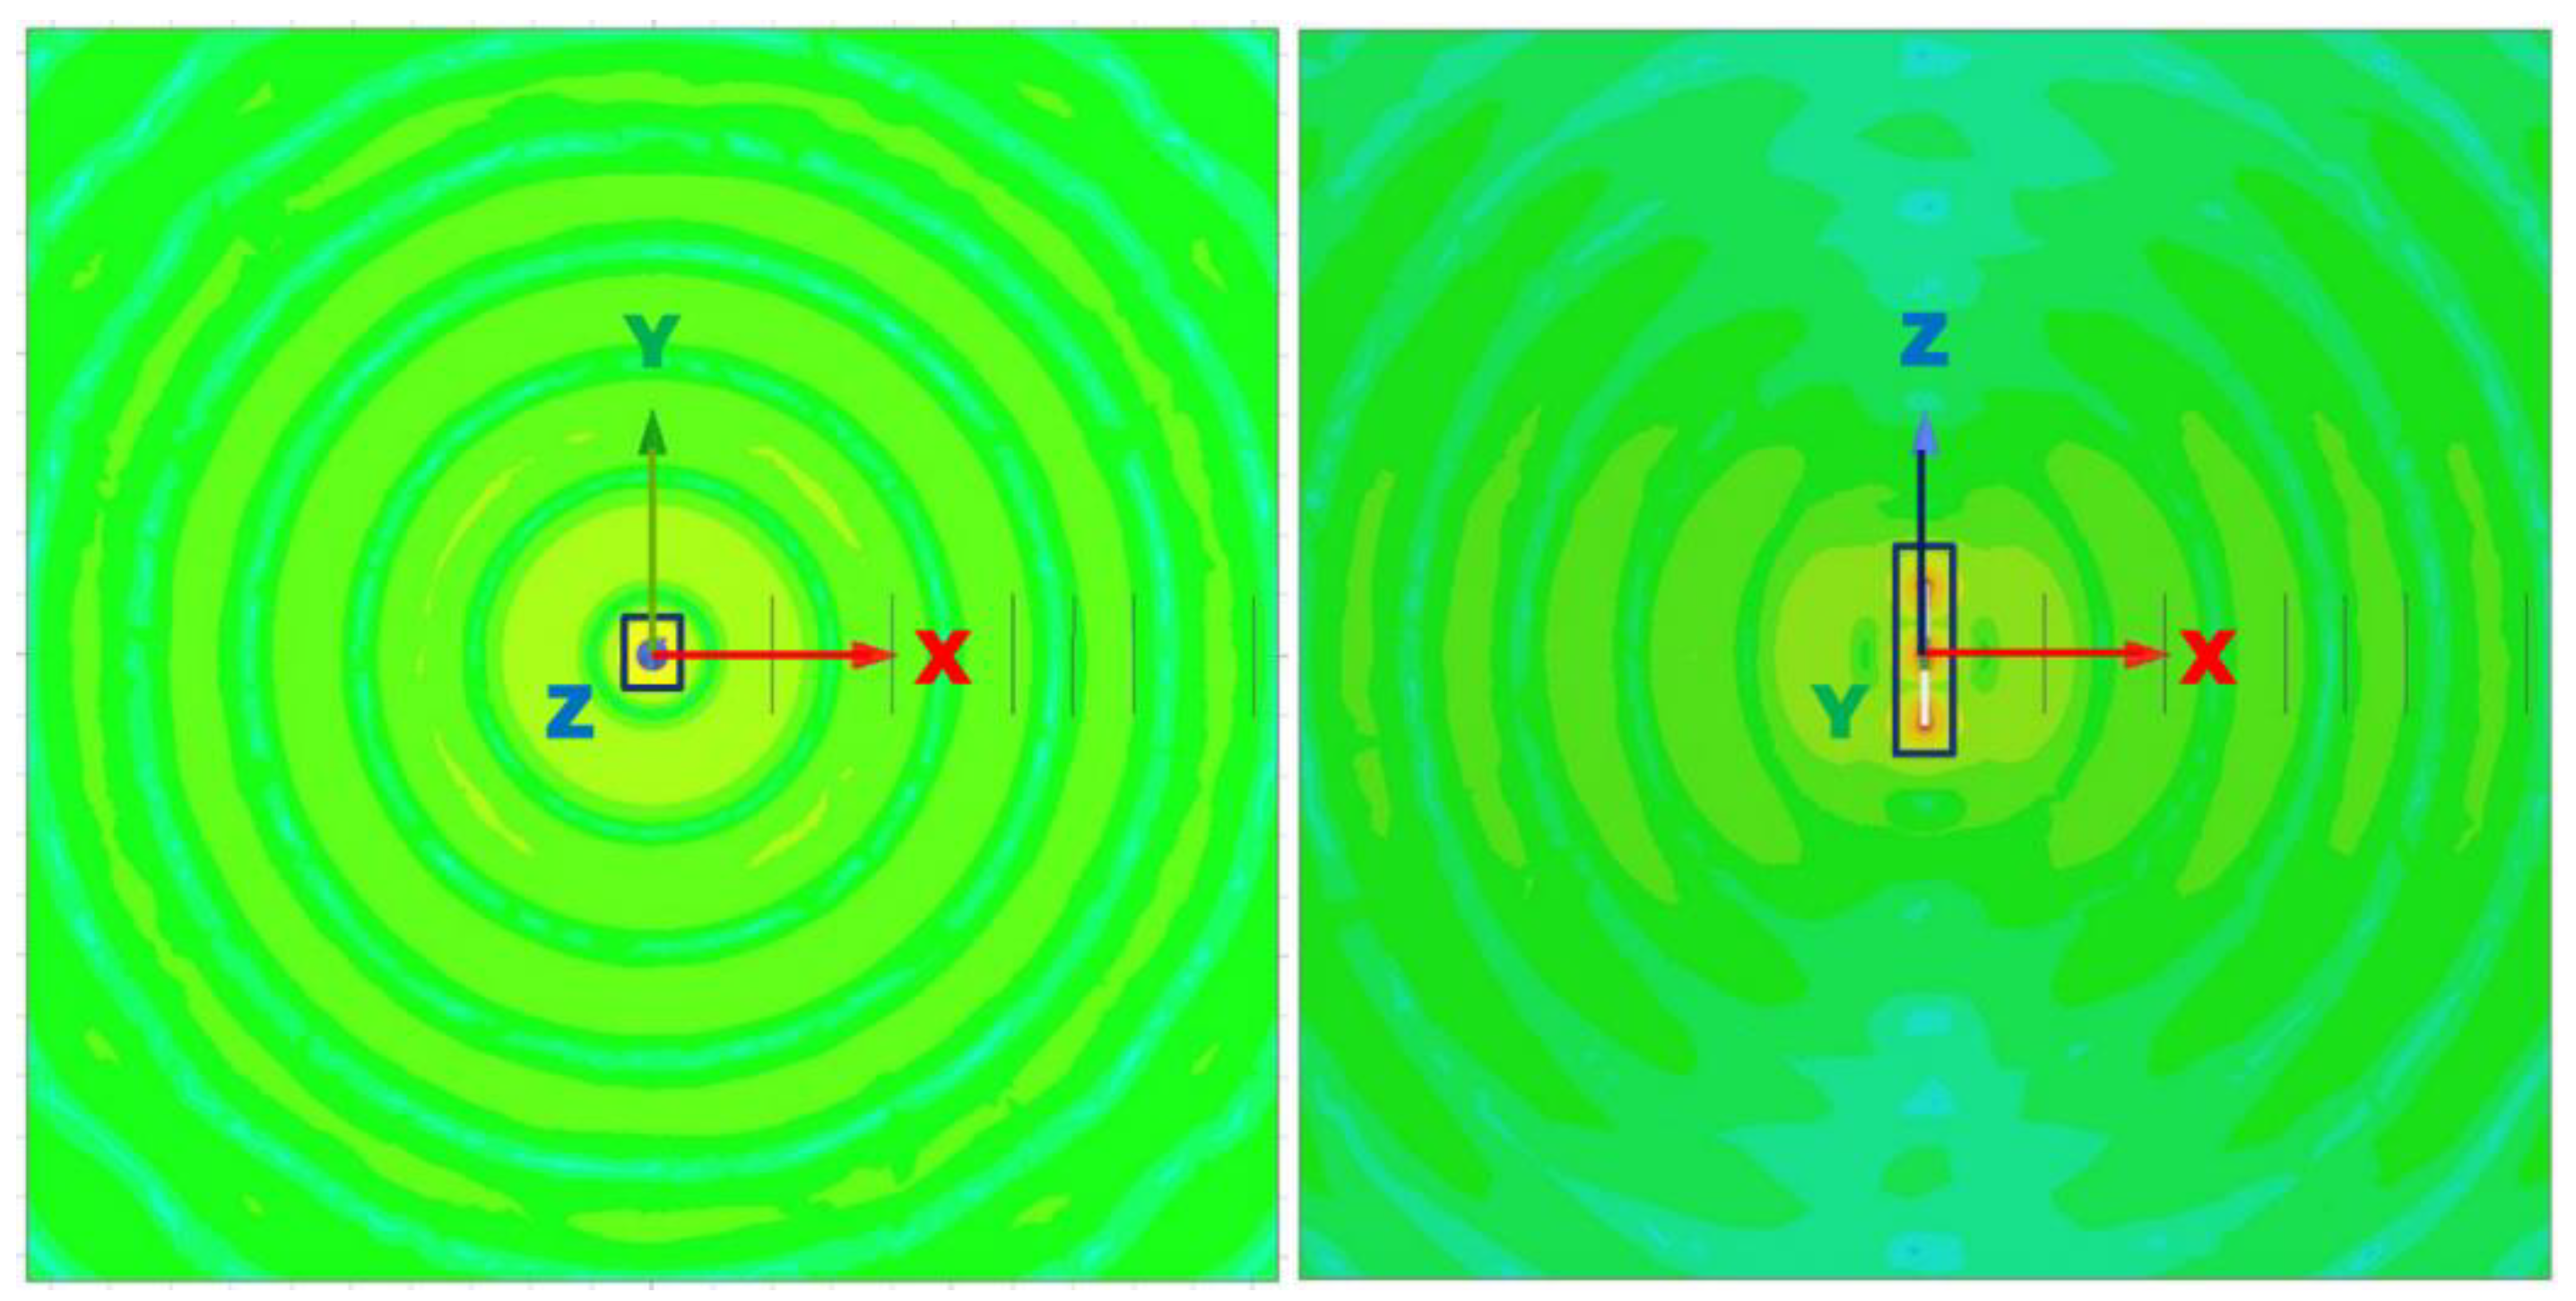
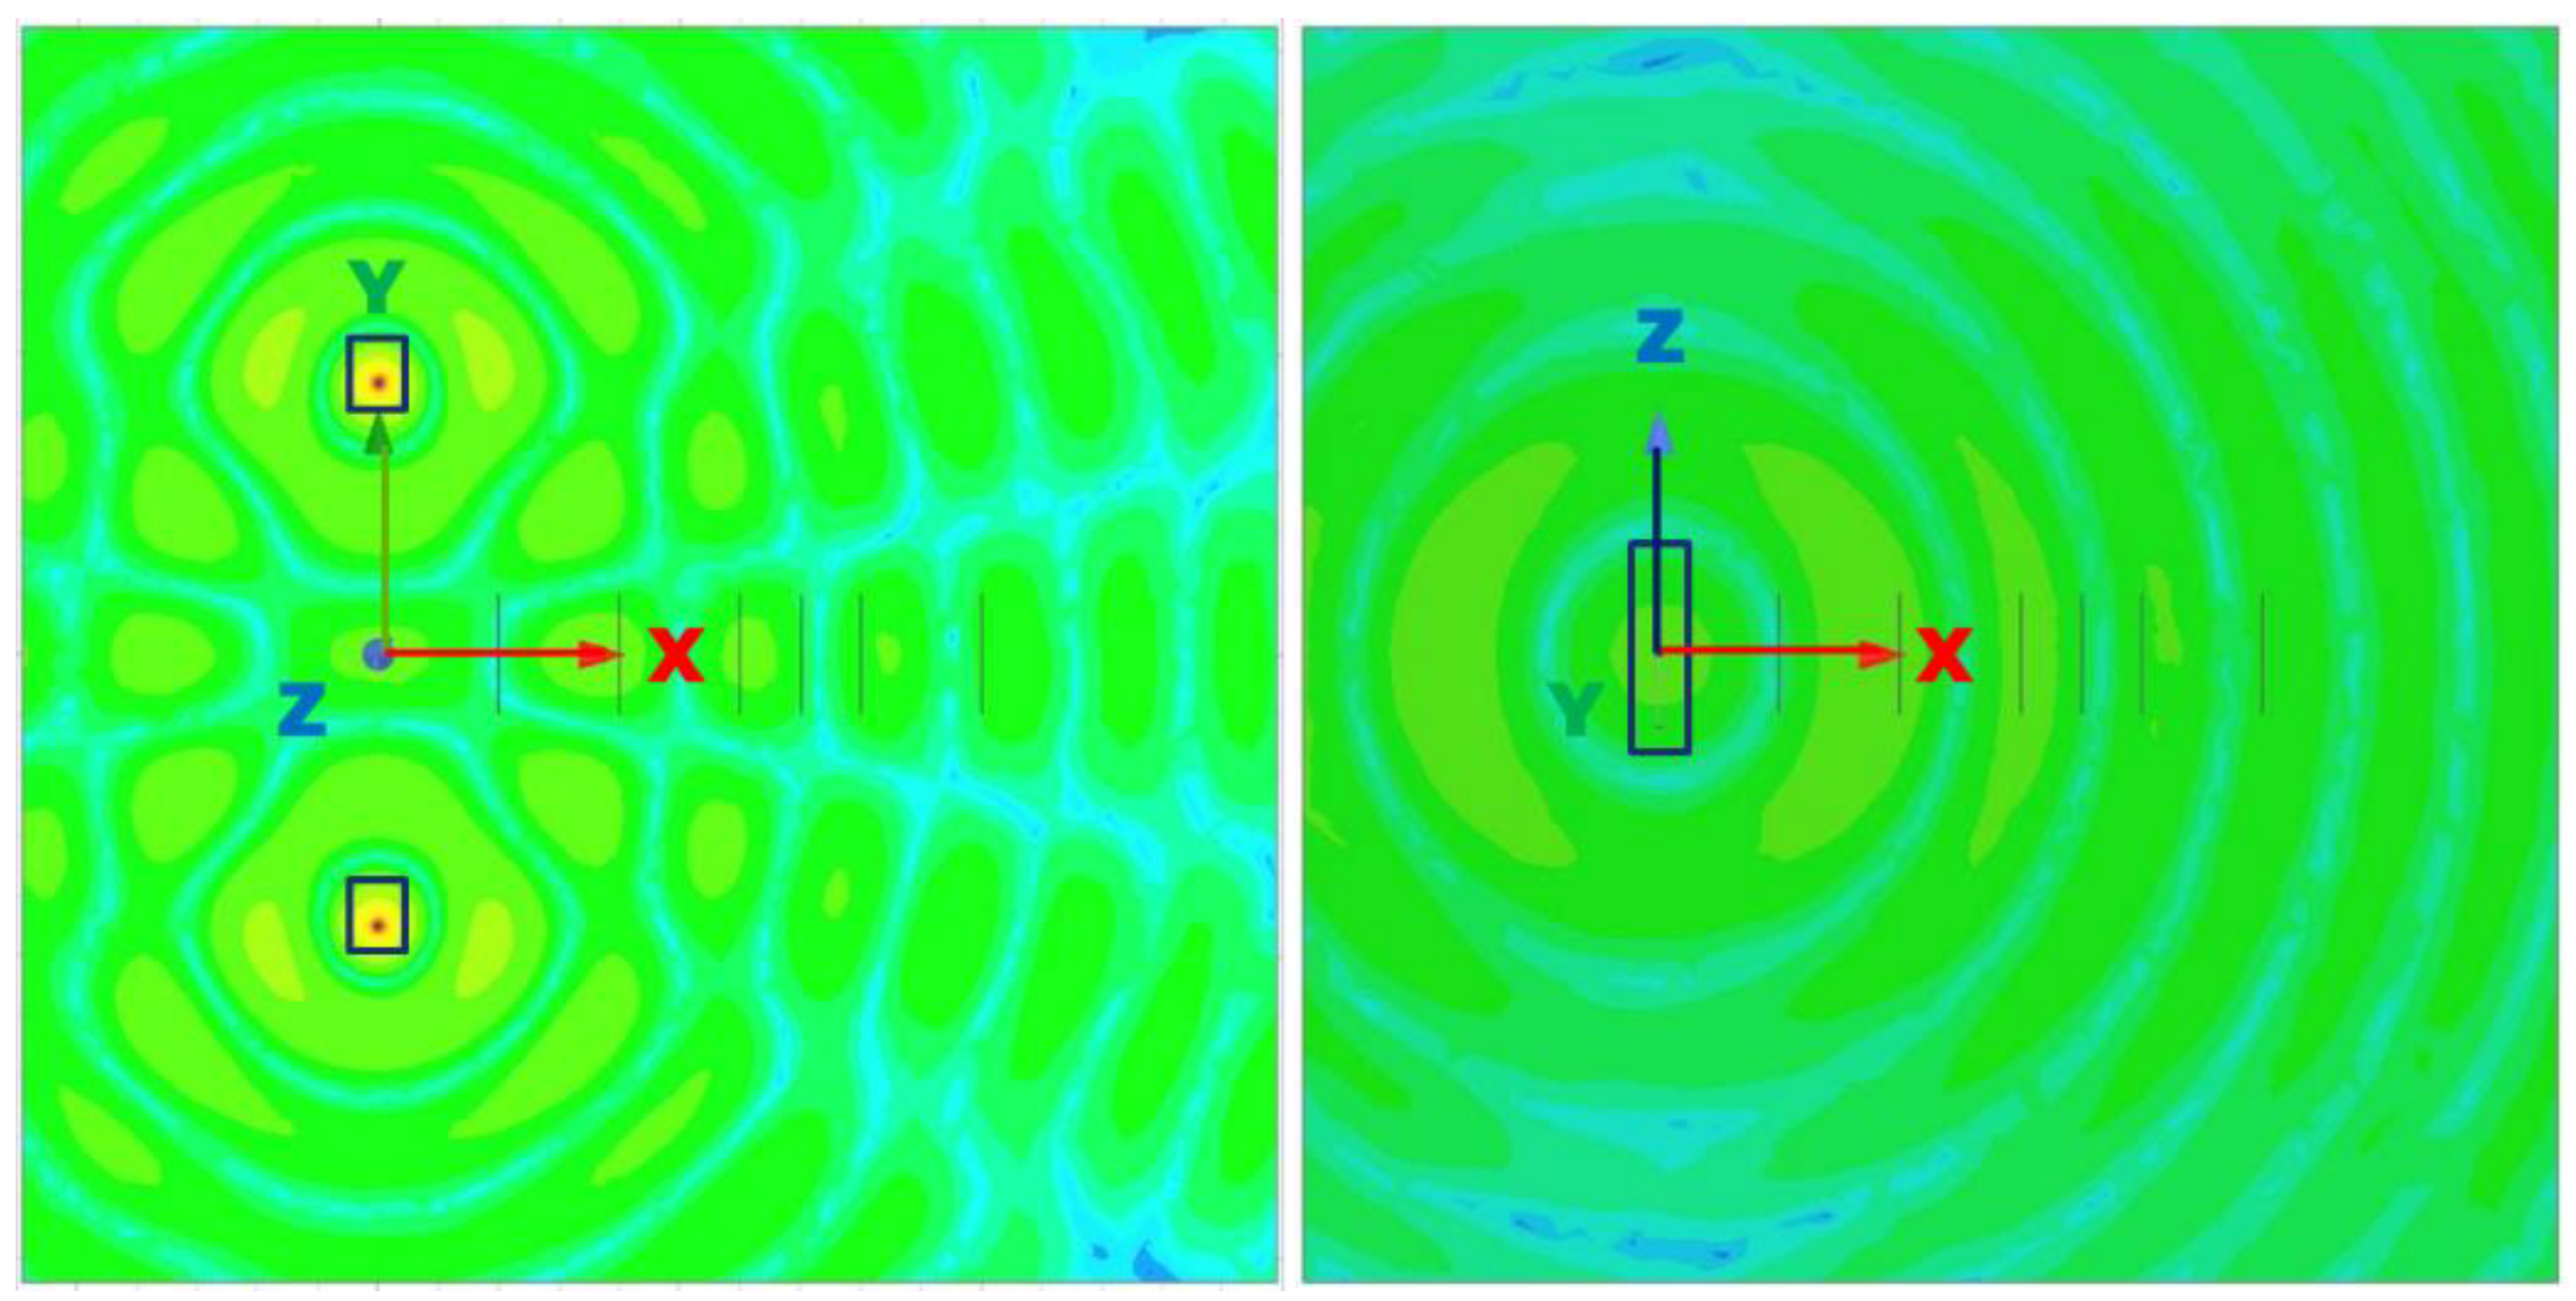
E field had an omni-directional shape, as shown in
Figure 5.
Table 8 shows the effective field strength and power measured by Ansys HFSS.
4.2. Analysis of Multiple Transmissions
In the case of multiple transmissions, modeling is done as shown in
Figure 6, and the condition is the same as a single transmission. The
E field is shown in
Figure 7. Unlike a single transmission, two antennas transmit to each other, producing interference. Both transmissions emit the same radiation and are located 4.5 m from each other. The effective field strength (
E) and power (
P) were calculated from the axis between the two transmissions, from 1 m to 5 m, on the same
X-axis as the single antenna. The results of Ansys HFSS are shown in
Table 9.

